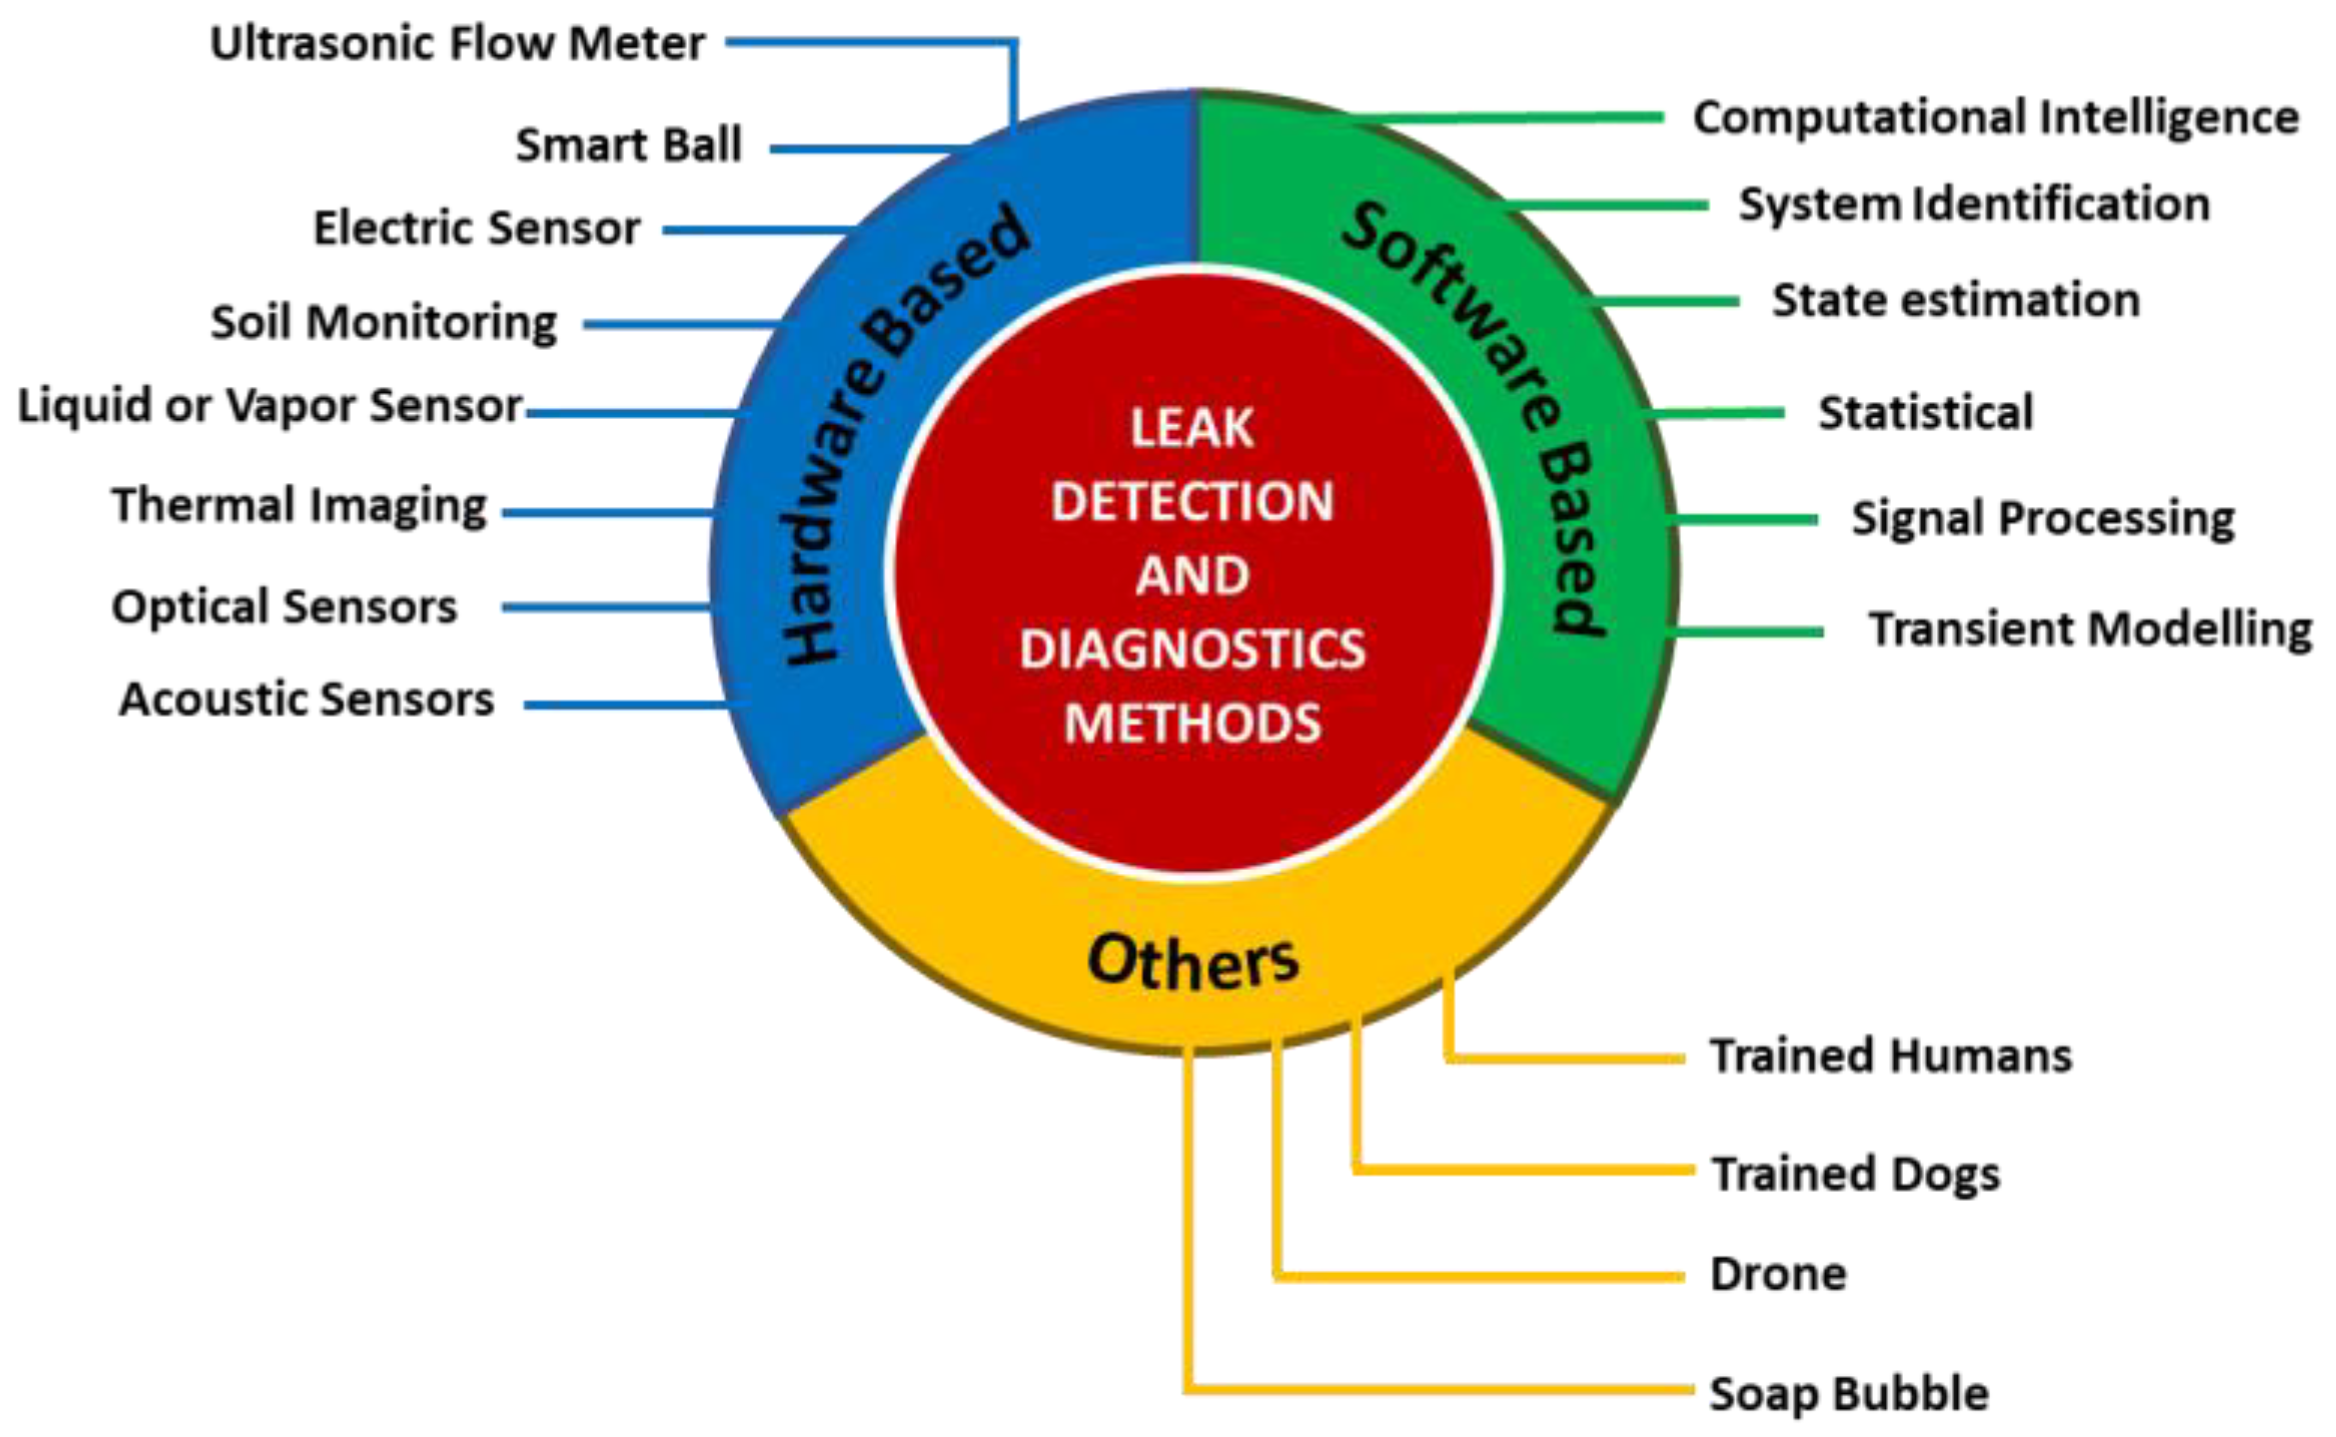
Figure 1.
Updated classification of fault detection and diagnostics techniques (FDD).
Figure 1.
Updated classification of fault detection and diagnostics techniques (FDD).
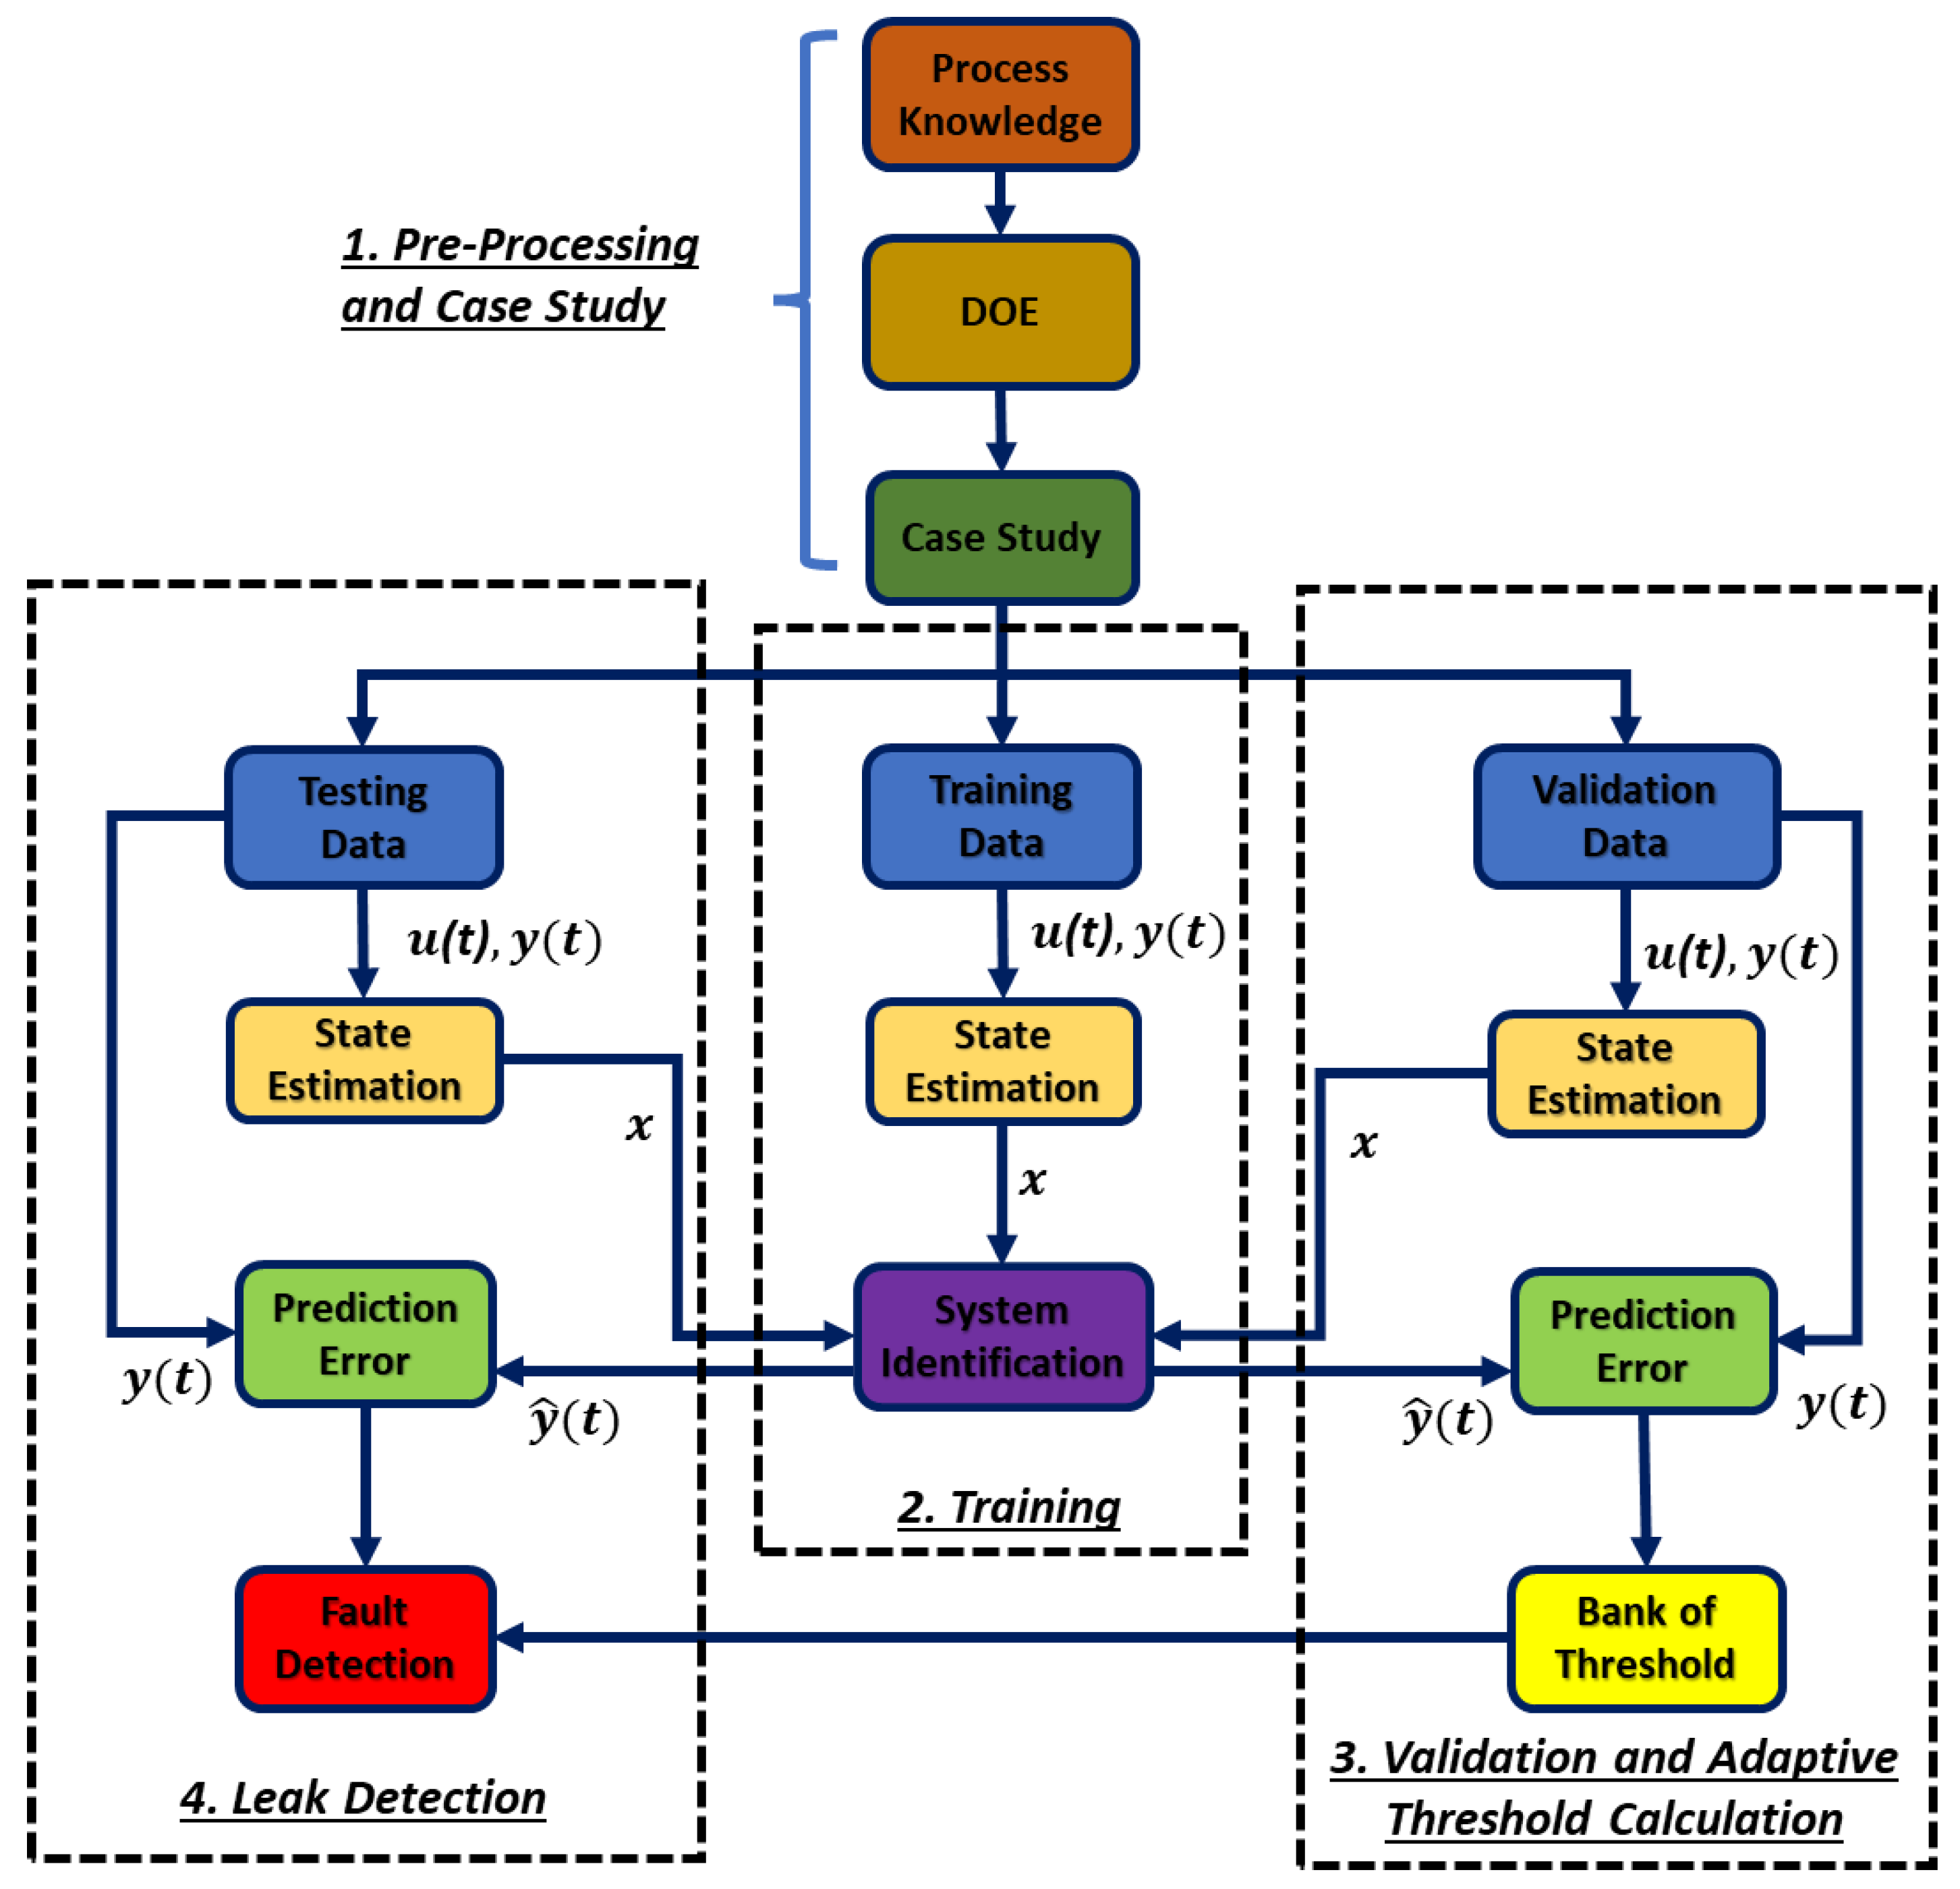
Figure 2.
Novel methodology of adaptive threshold-based leak detection (ATBLD).
Figure 2.
Novel methodology of adaptive threshold-based leak detection (ATBLD).
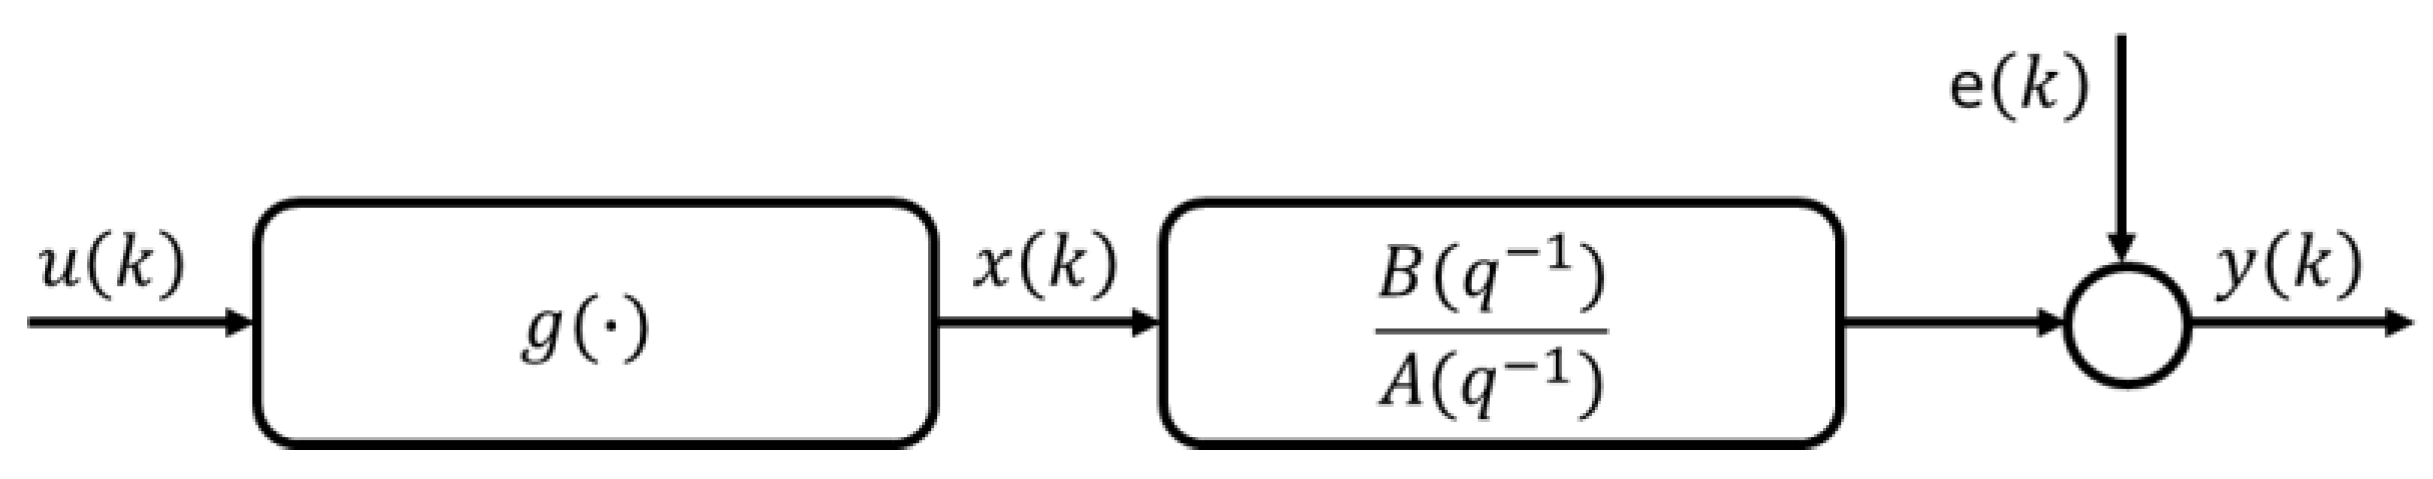
Figure 3.
Block diagram representation of SISO Hammerstein model.
Figure 3.
Block diagram representation of SISO Hammerstein model.
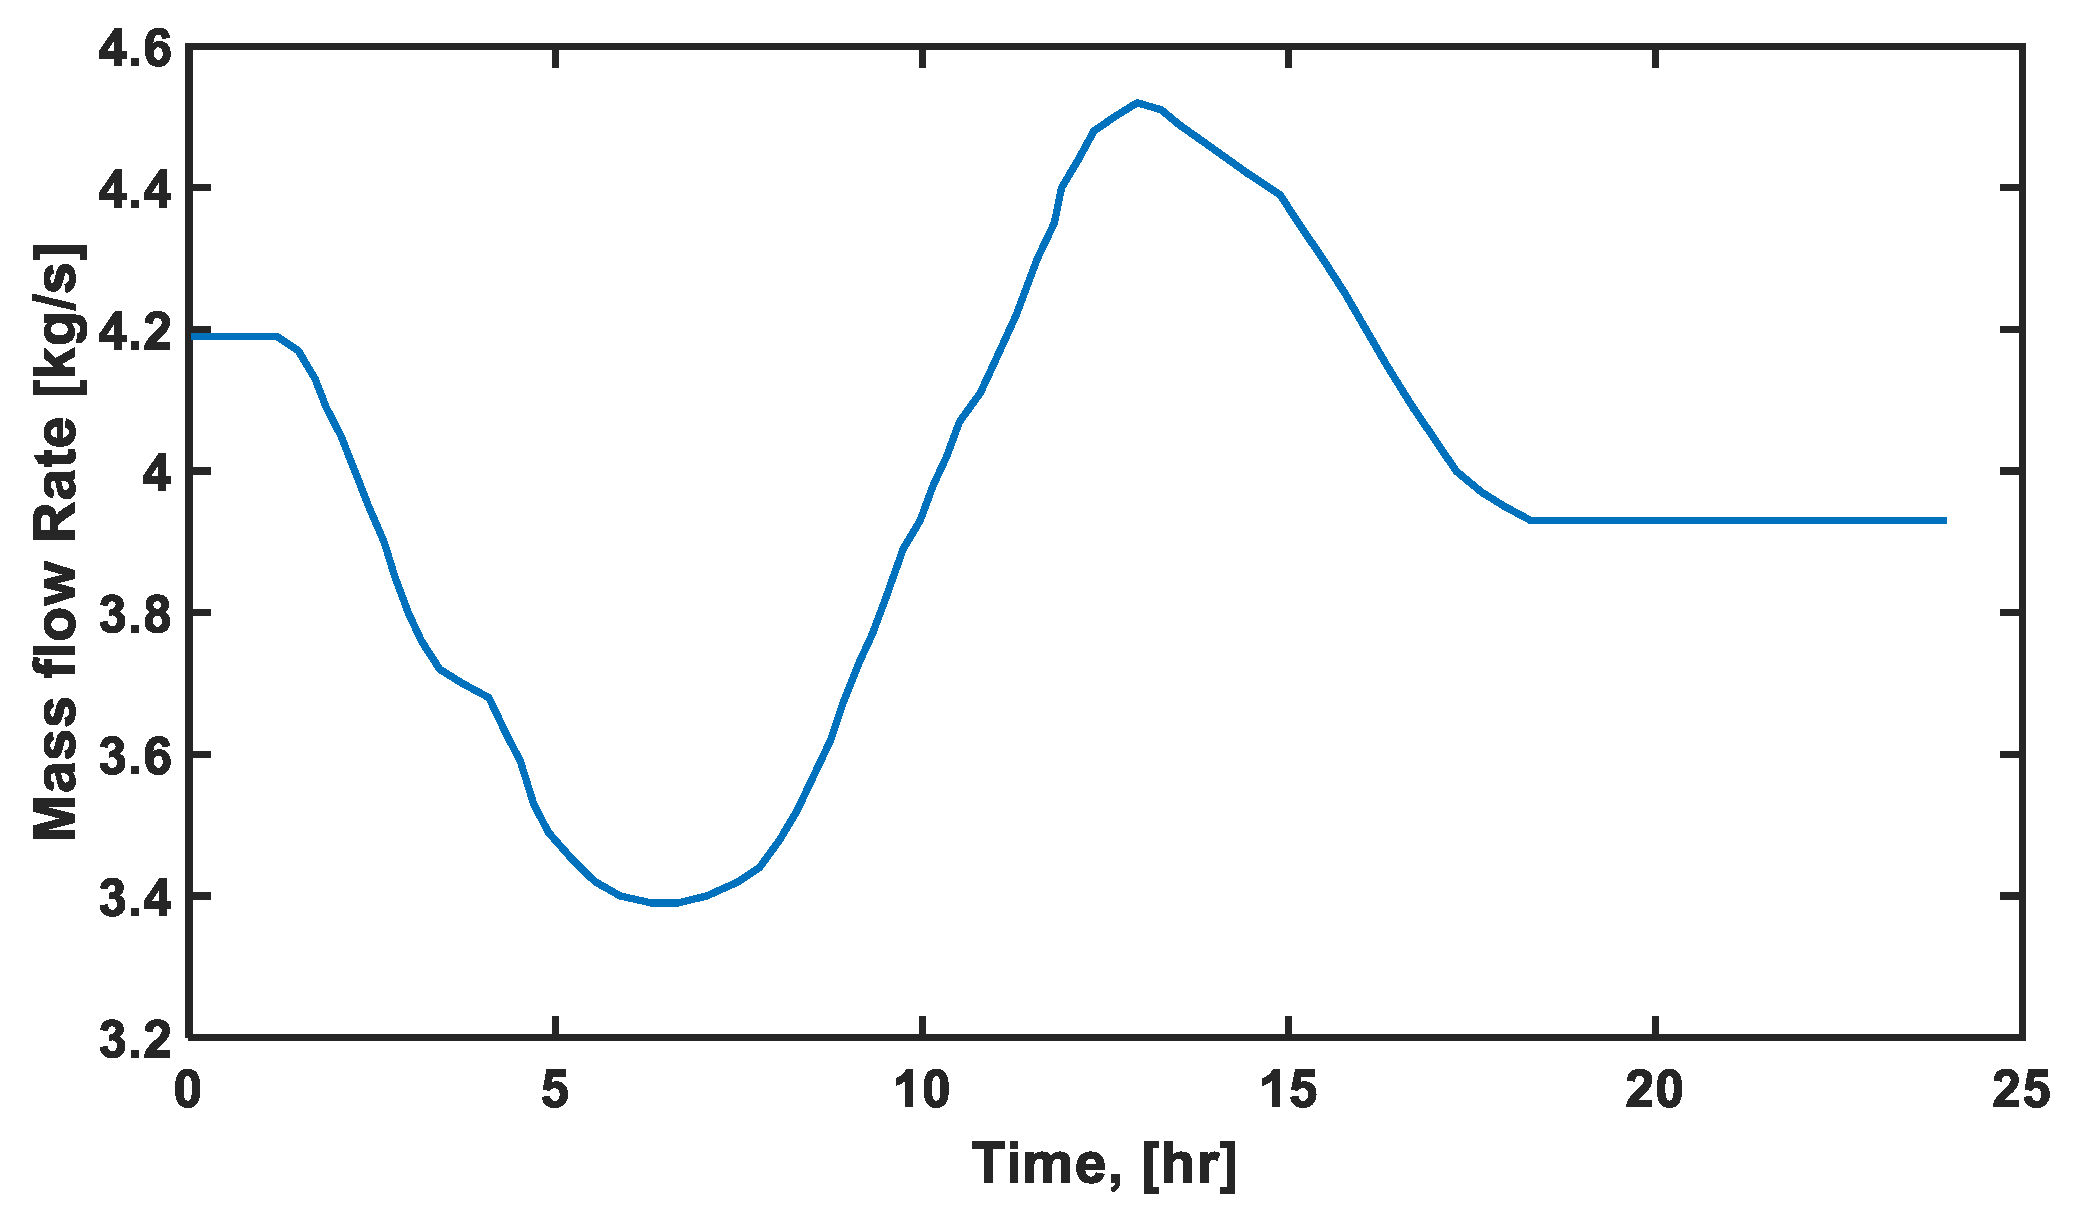
Figure 4.
Mass flow rate changes at the outlet of the pipeline for validation test.
Figure 4.
Mass flow rate changes at the outlet of the pipeline for validation test.
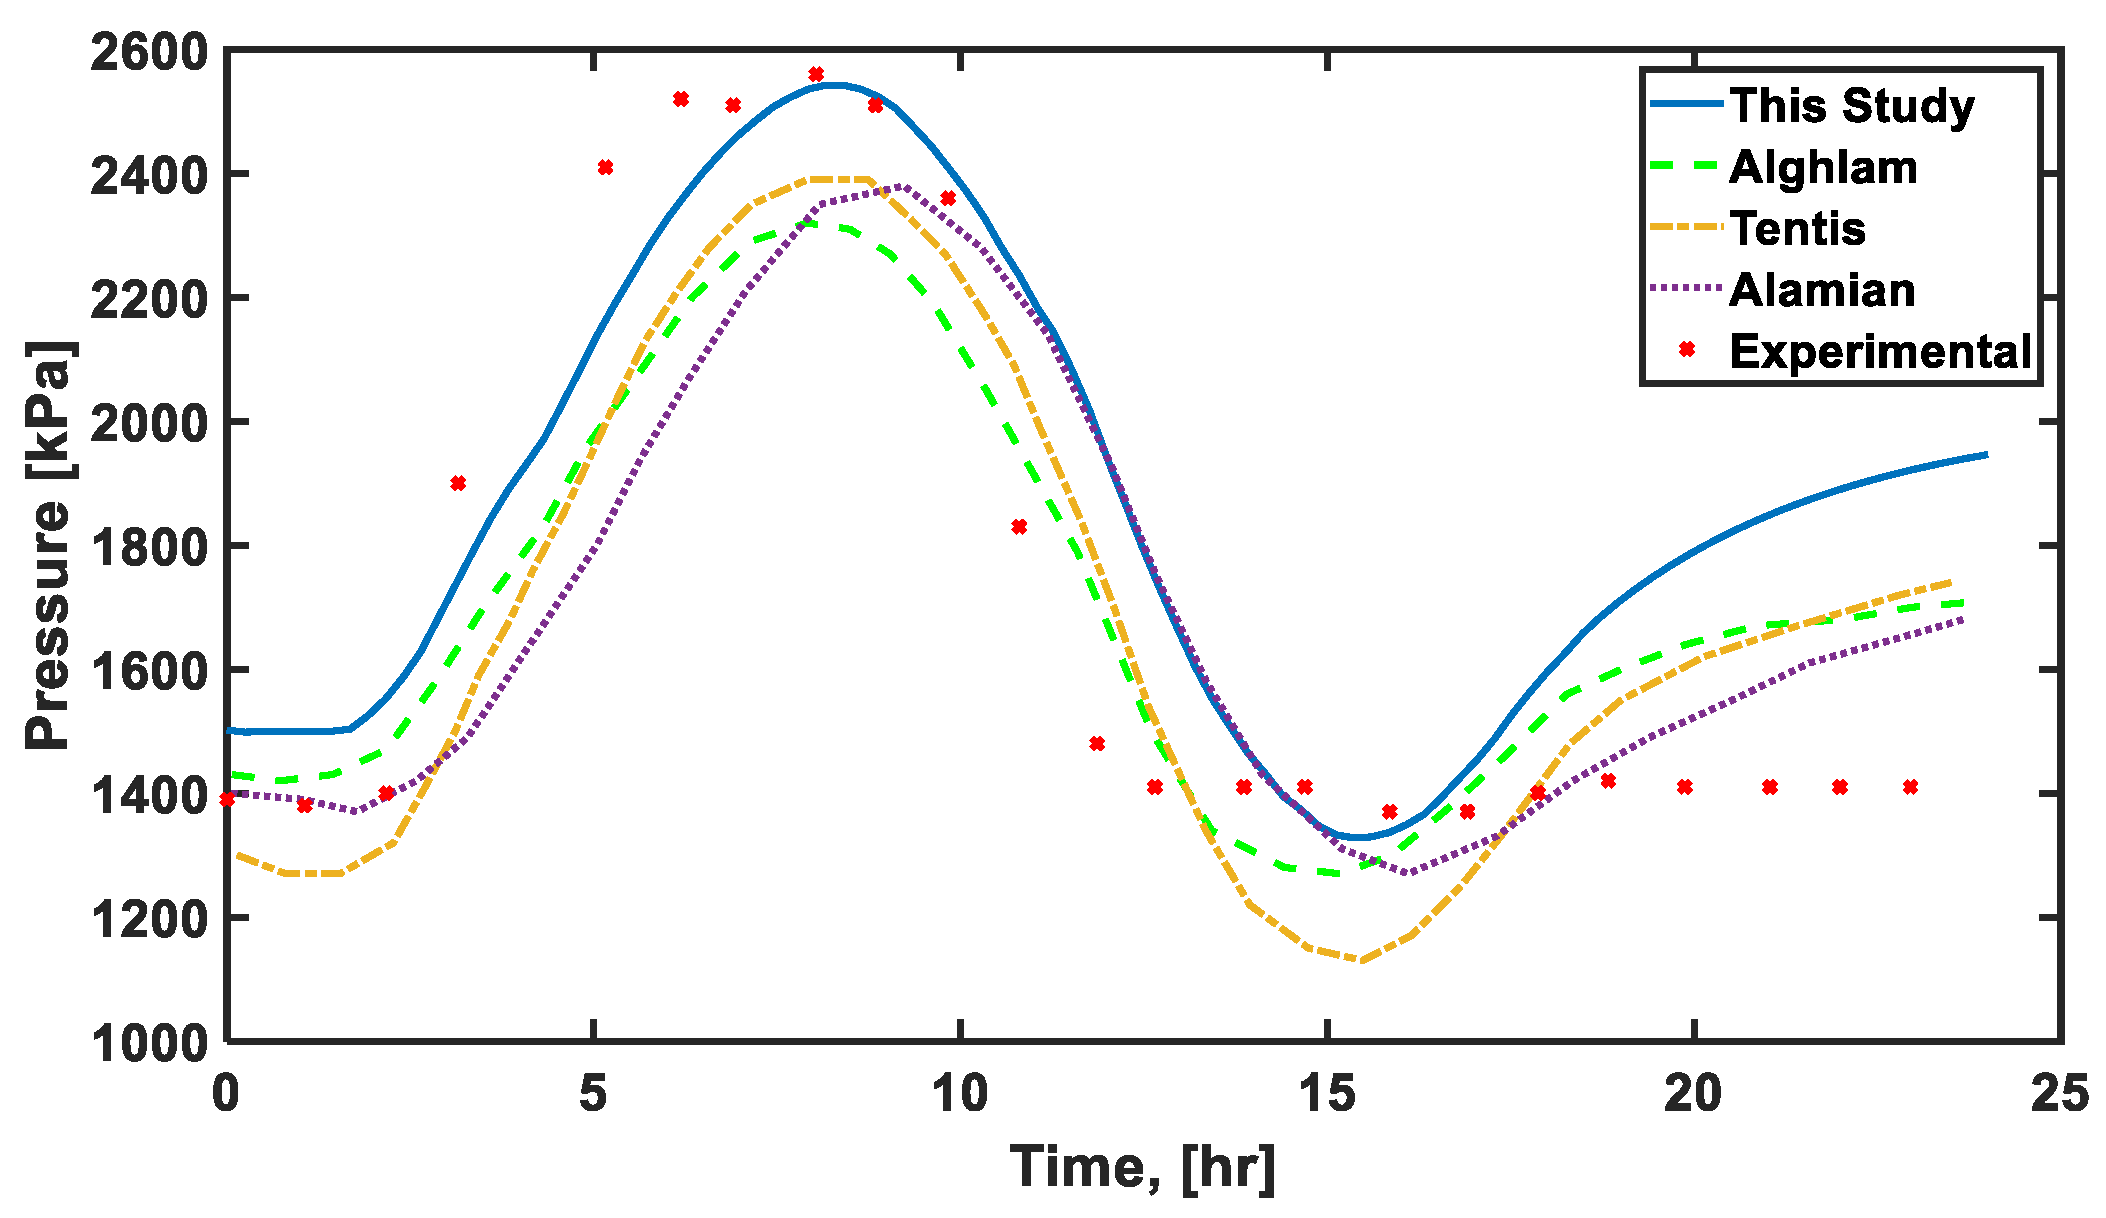
Figure 5.
Pipeline outlet pressure comparison with the experimental data and other studies.
Figure 5.
Pipeline outlet pressure comparison with the experimental data and other studies.
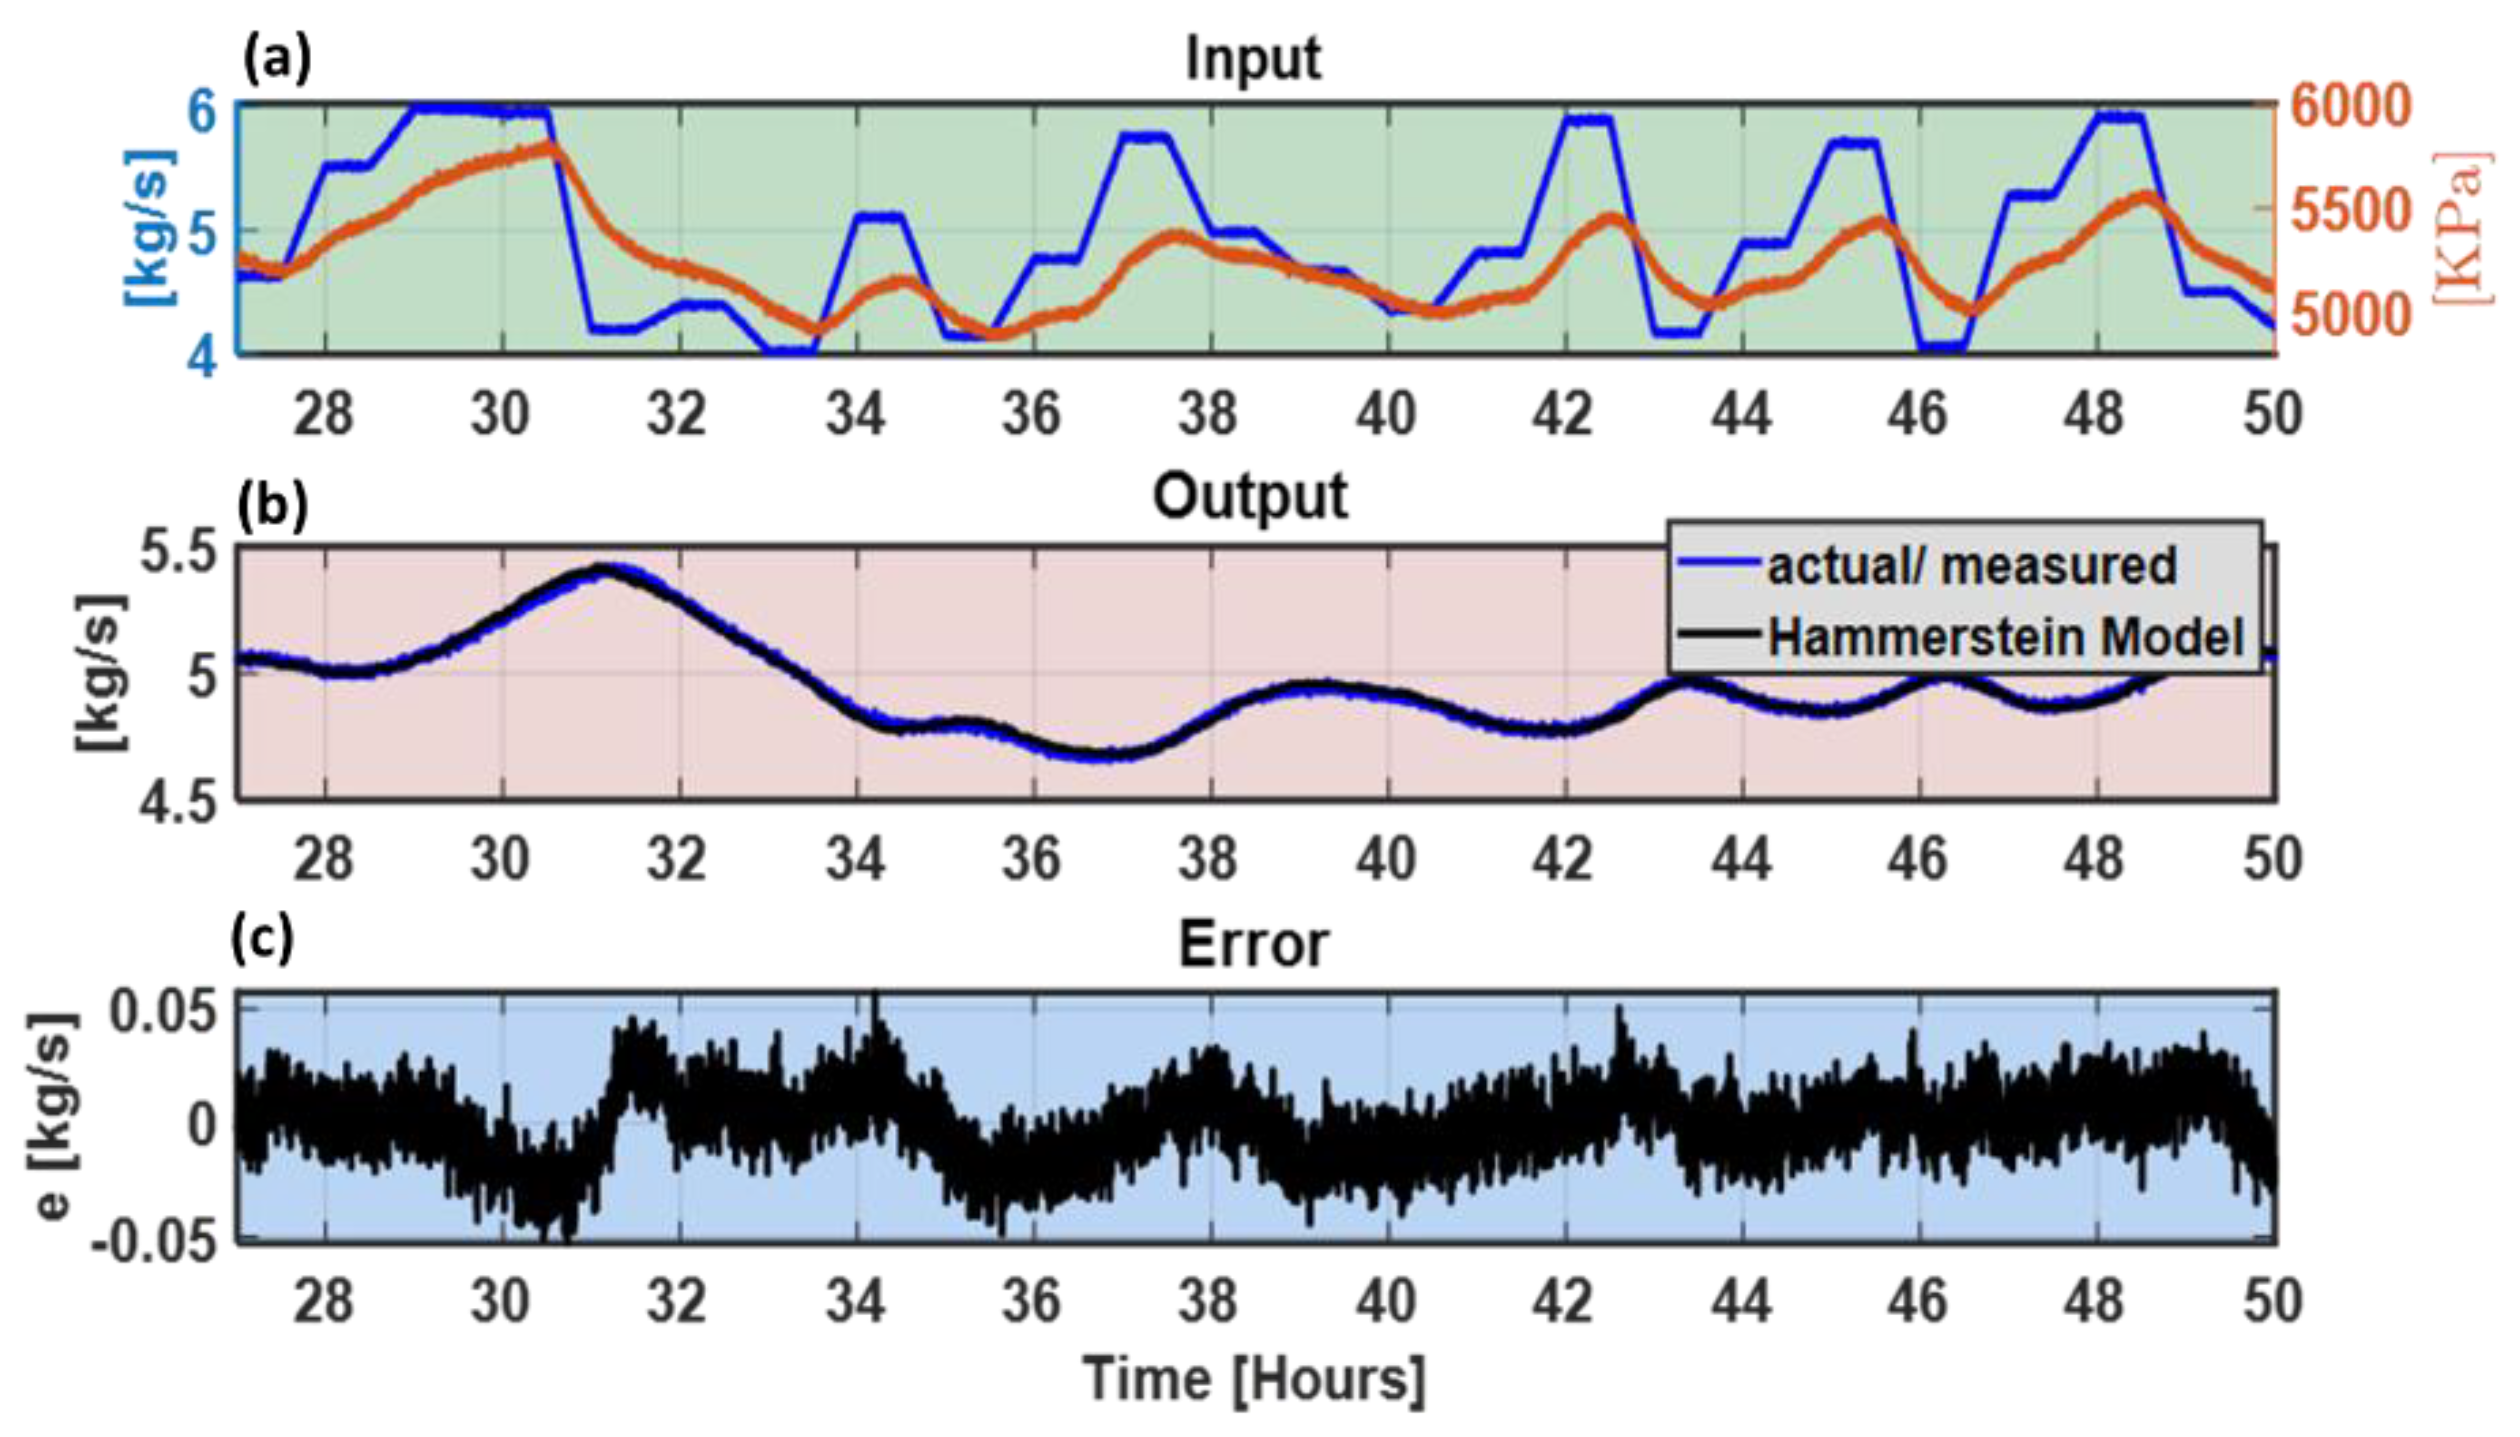
Figure 6.
Hammerstein model identification results (training), (a) pressure and mass flow rate signals at inlet, used as a model input, (b) actual mass flow rate signals at outlet, used as a model output. Estimated mass flow rate sign for given input and output signals, (c) modeling errors between actual and estimated mass flow rate.
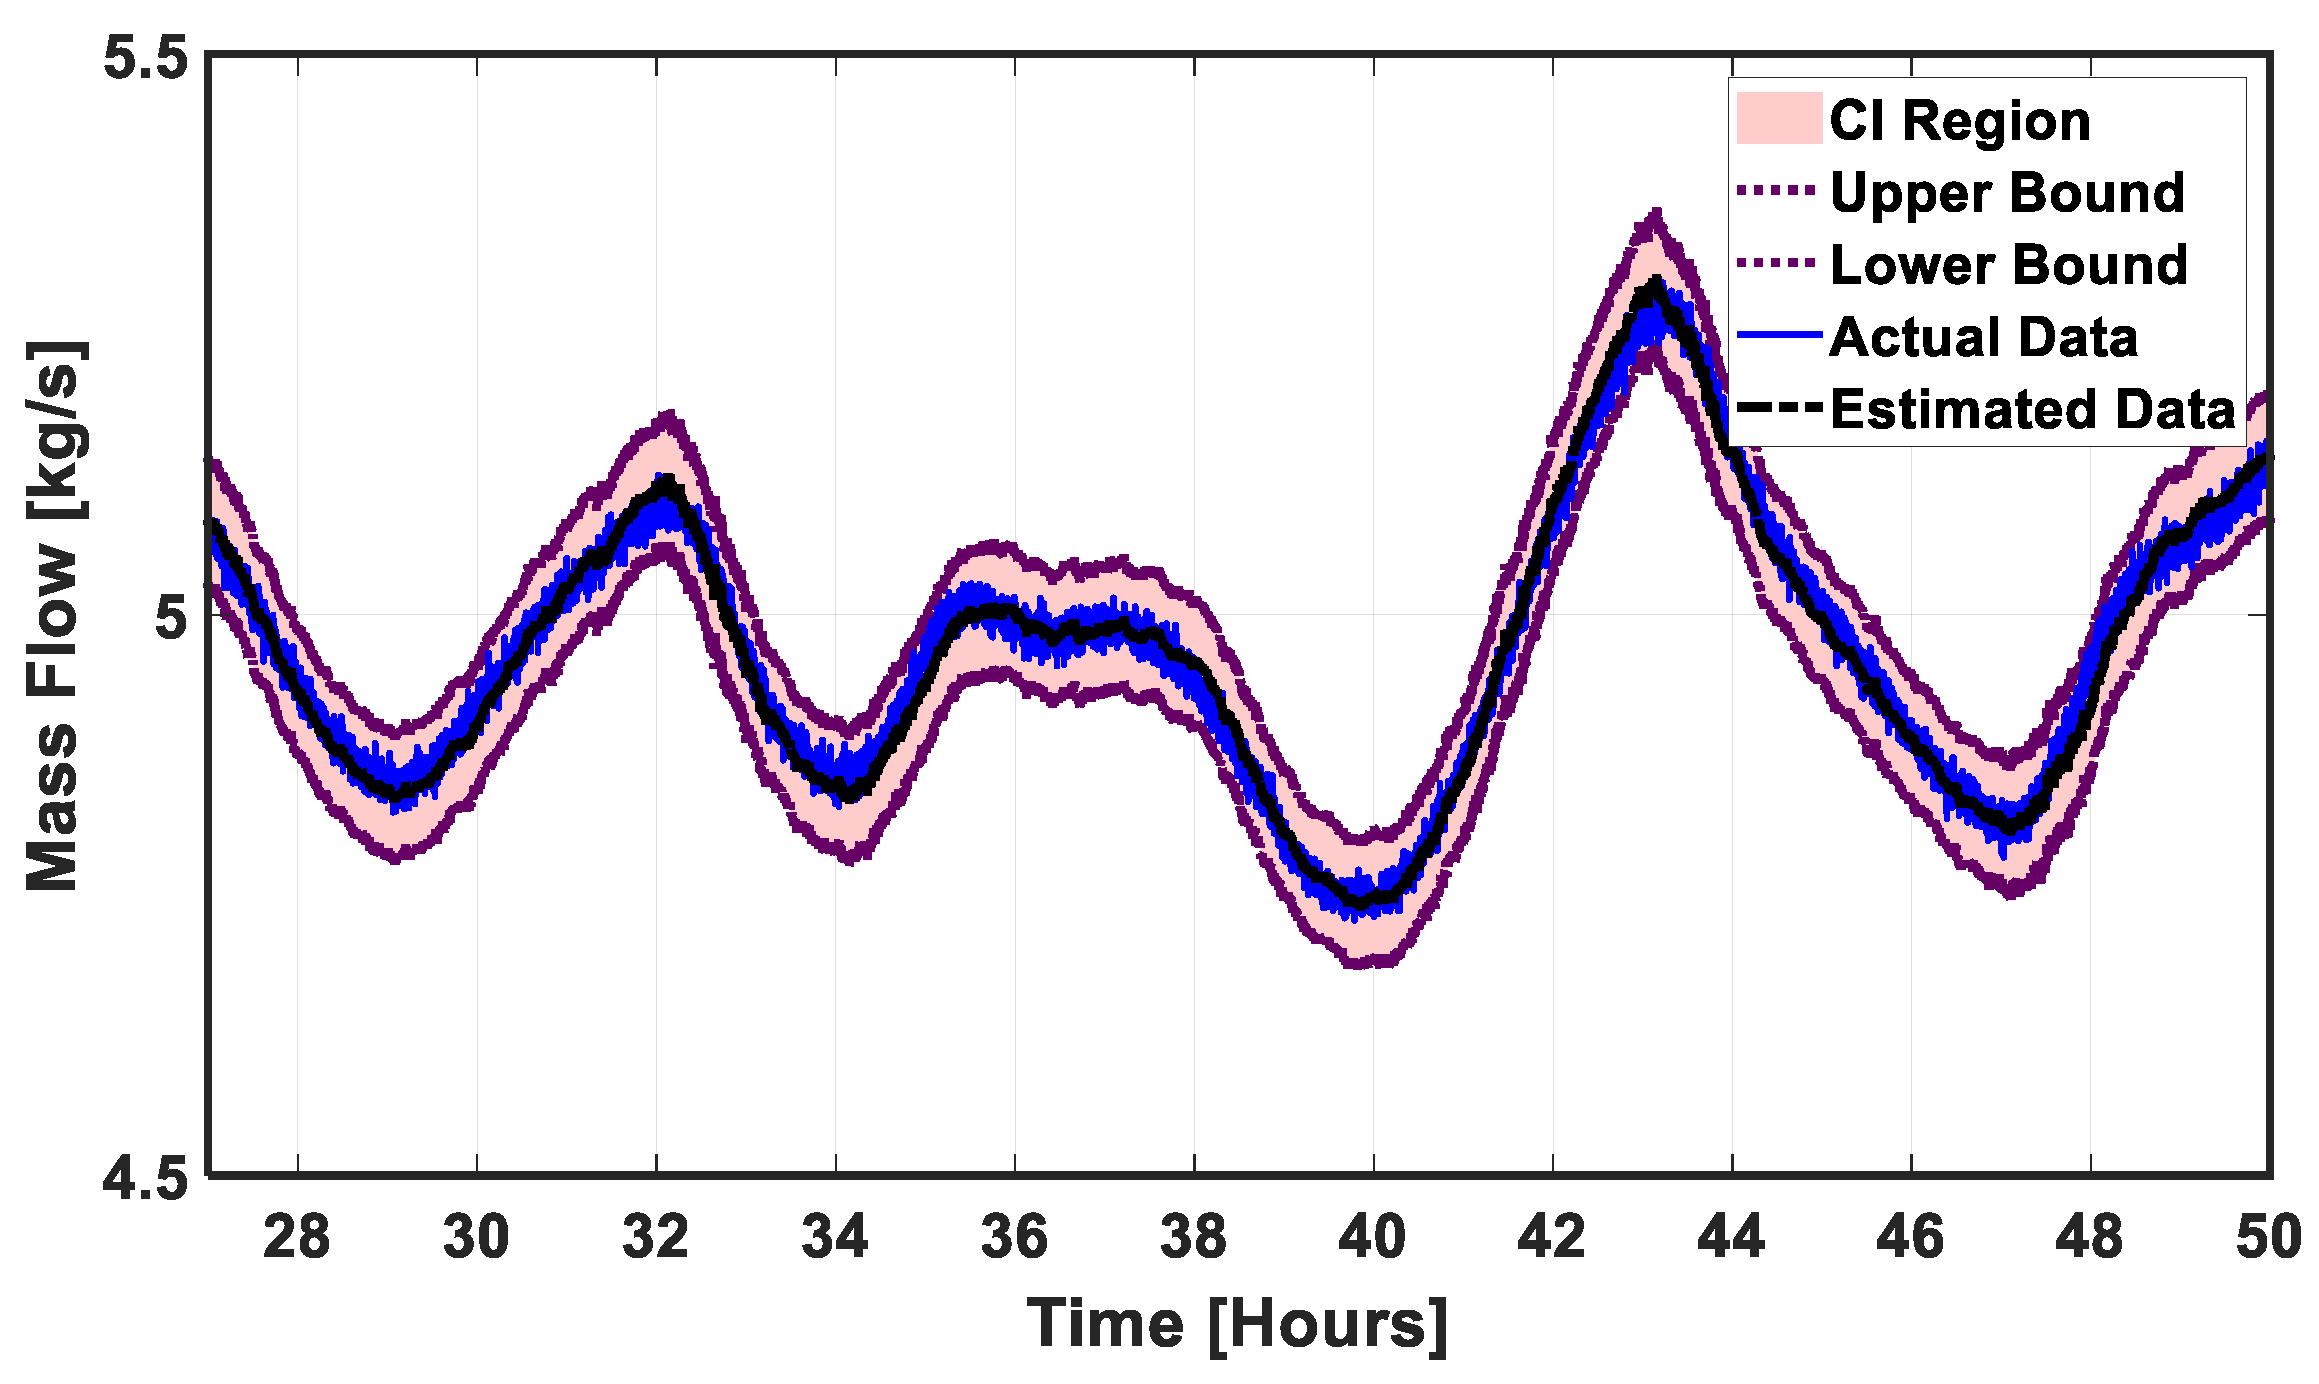
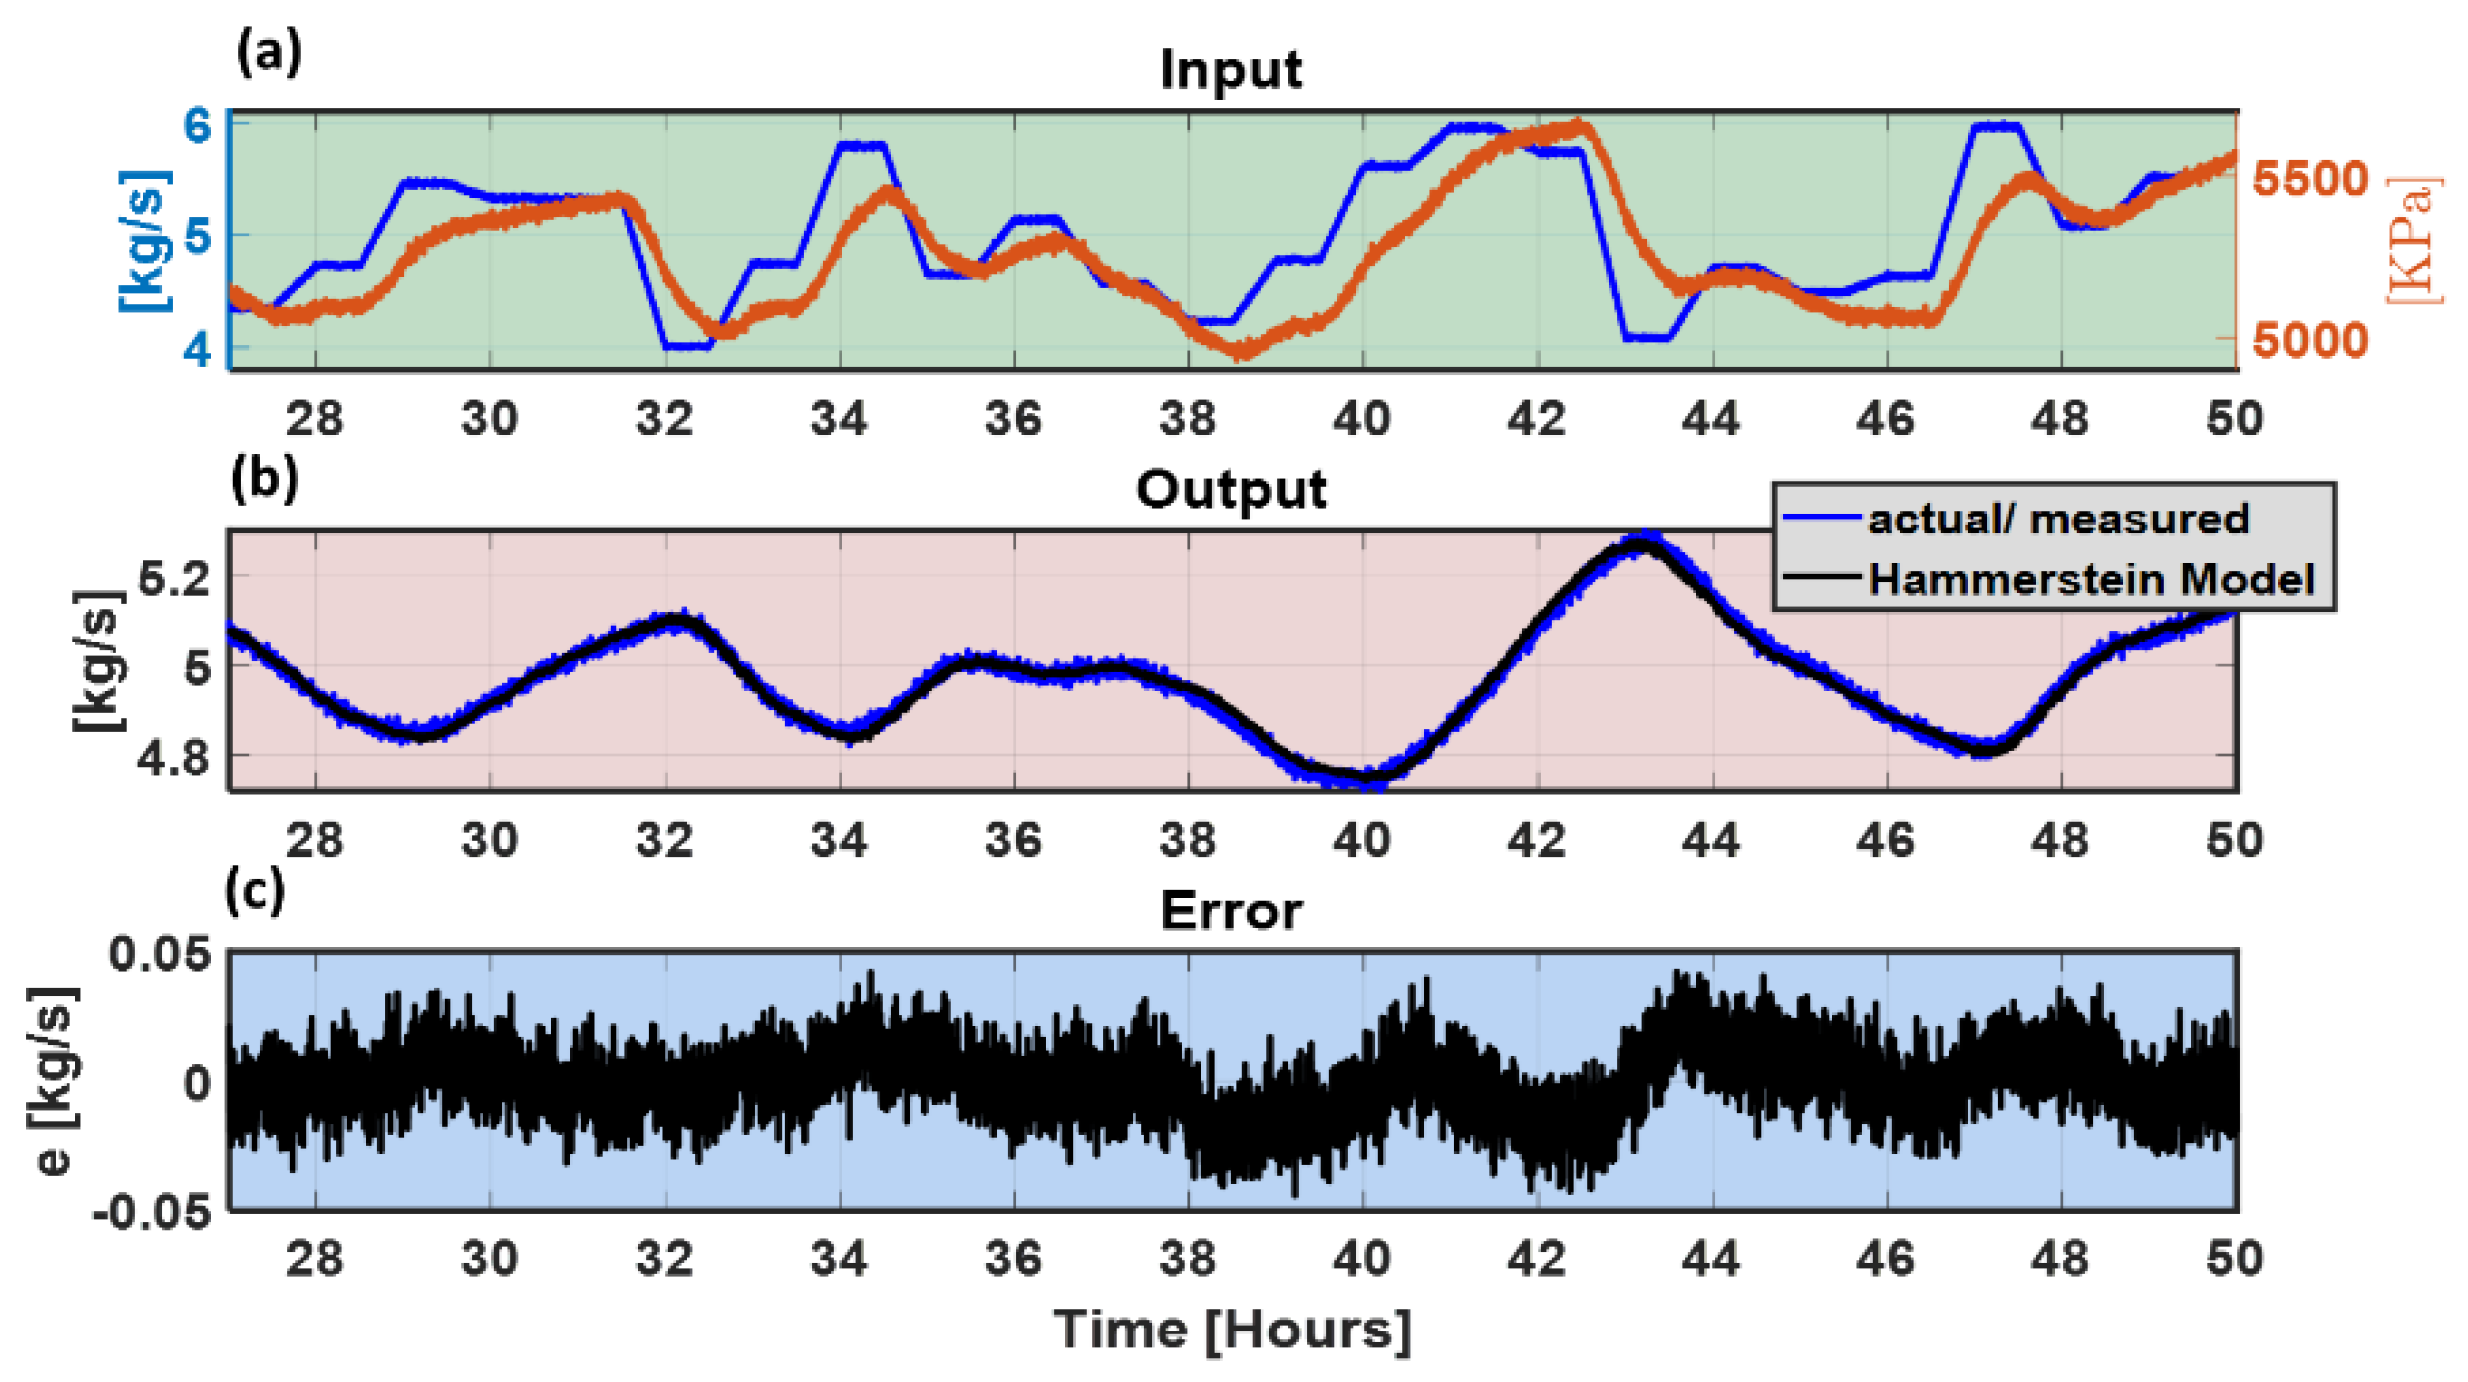
Figure 7.
Validation of Hammerstein model with 1201 parameters and noise ratio of 0.2%, (a) Pressure and mass flow rate signals at inlet, used as a model input, (b) actual mass flow rate signals at outlet, used as a model output. Estimated mass flow rate sign for given input and output signals, (c) Modeling errors between actual and estimated mass flow rate.
Figure 8.
Testing of Hammerstein model with 0% leak at 30 h, 1201 parameters and 0.2% noise ratio.
Figure 8.
Testing of Hammerstein model with 0% leak at 30 h, 1201 parameters and 0.2% noise ratio.
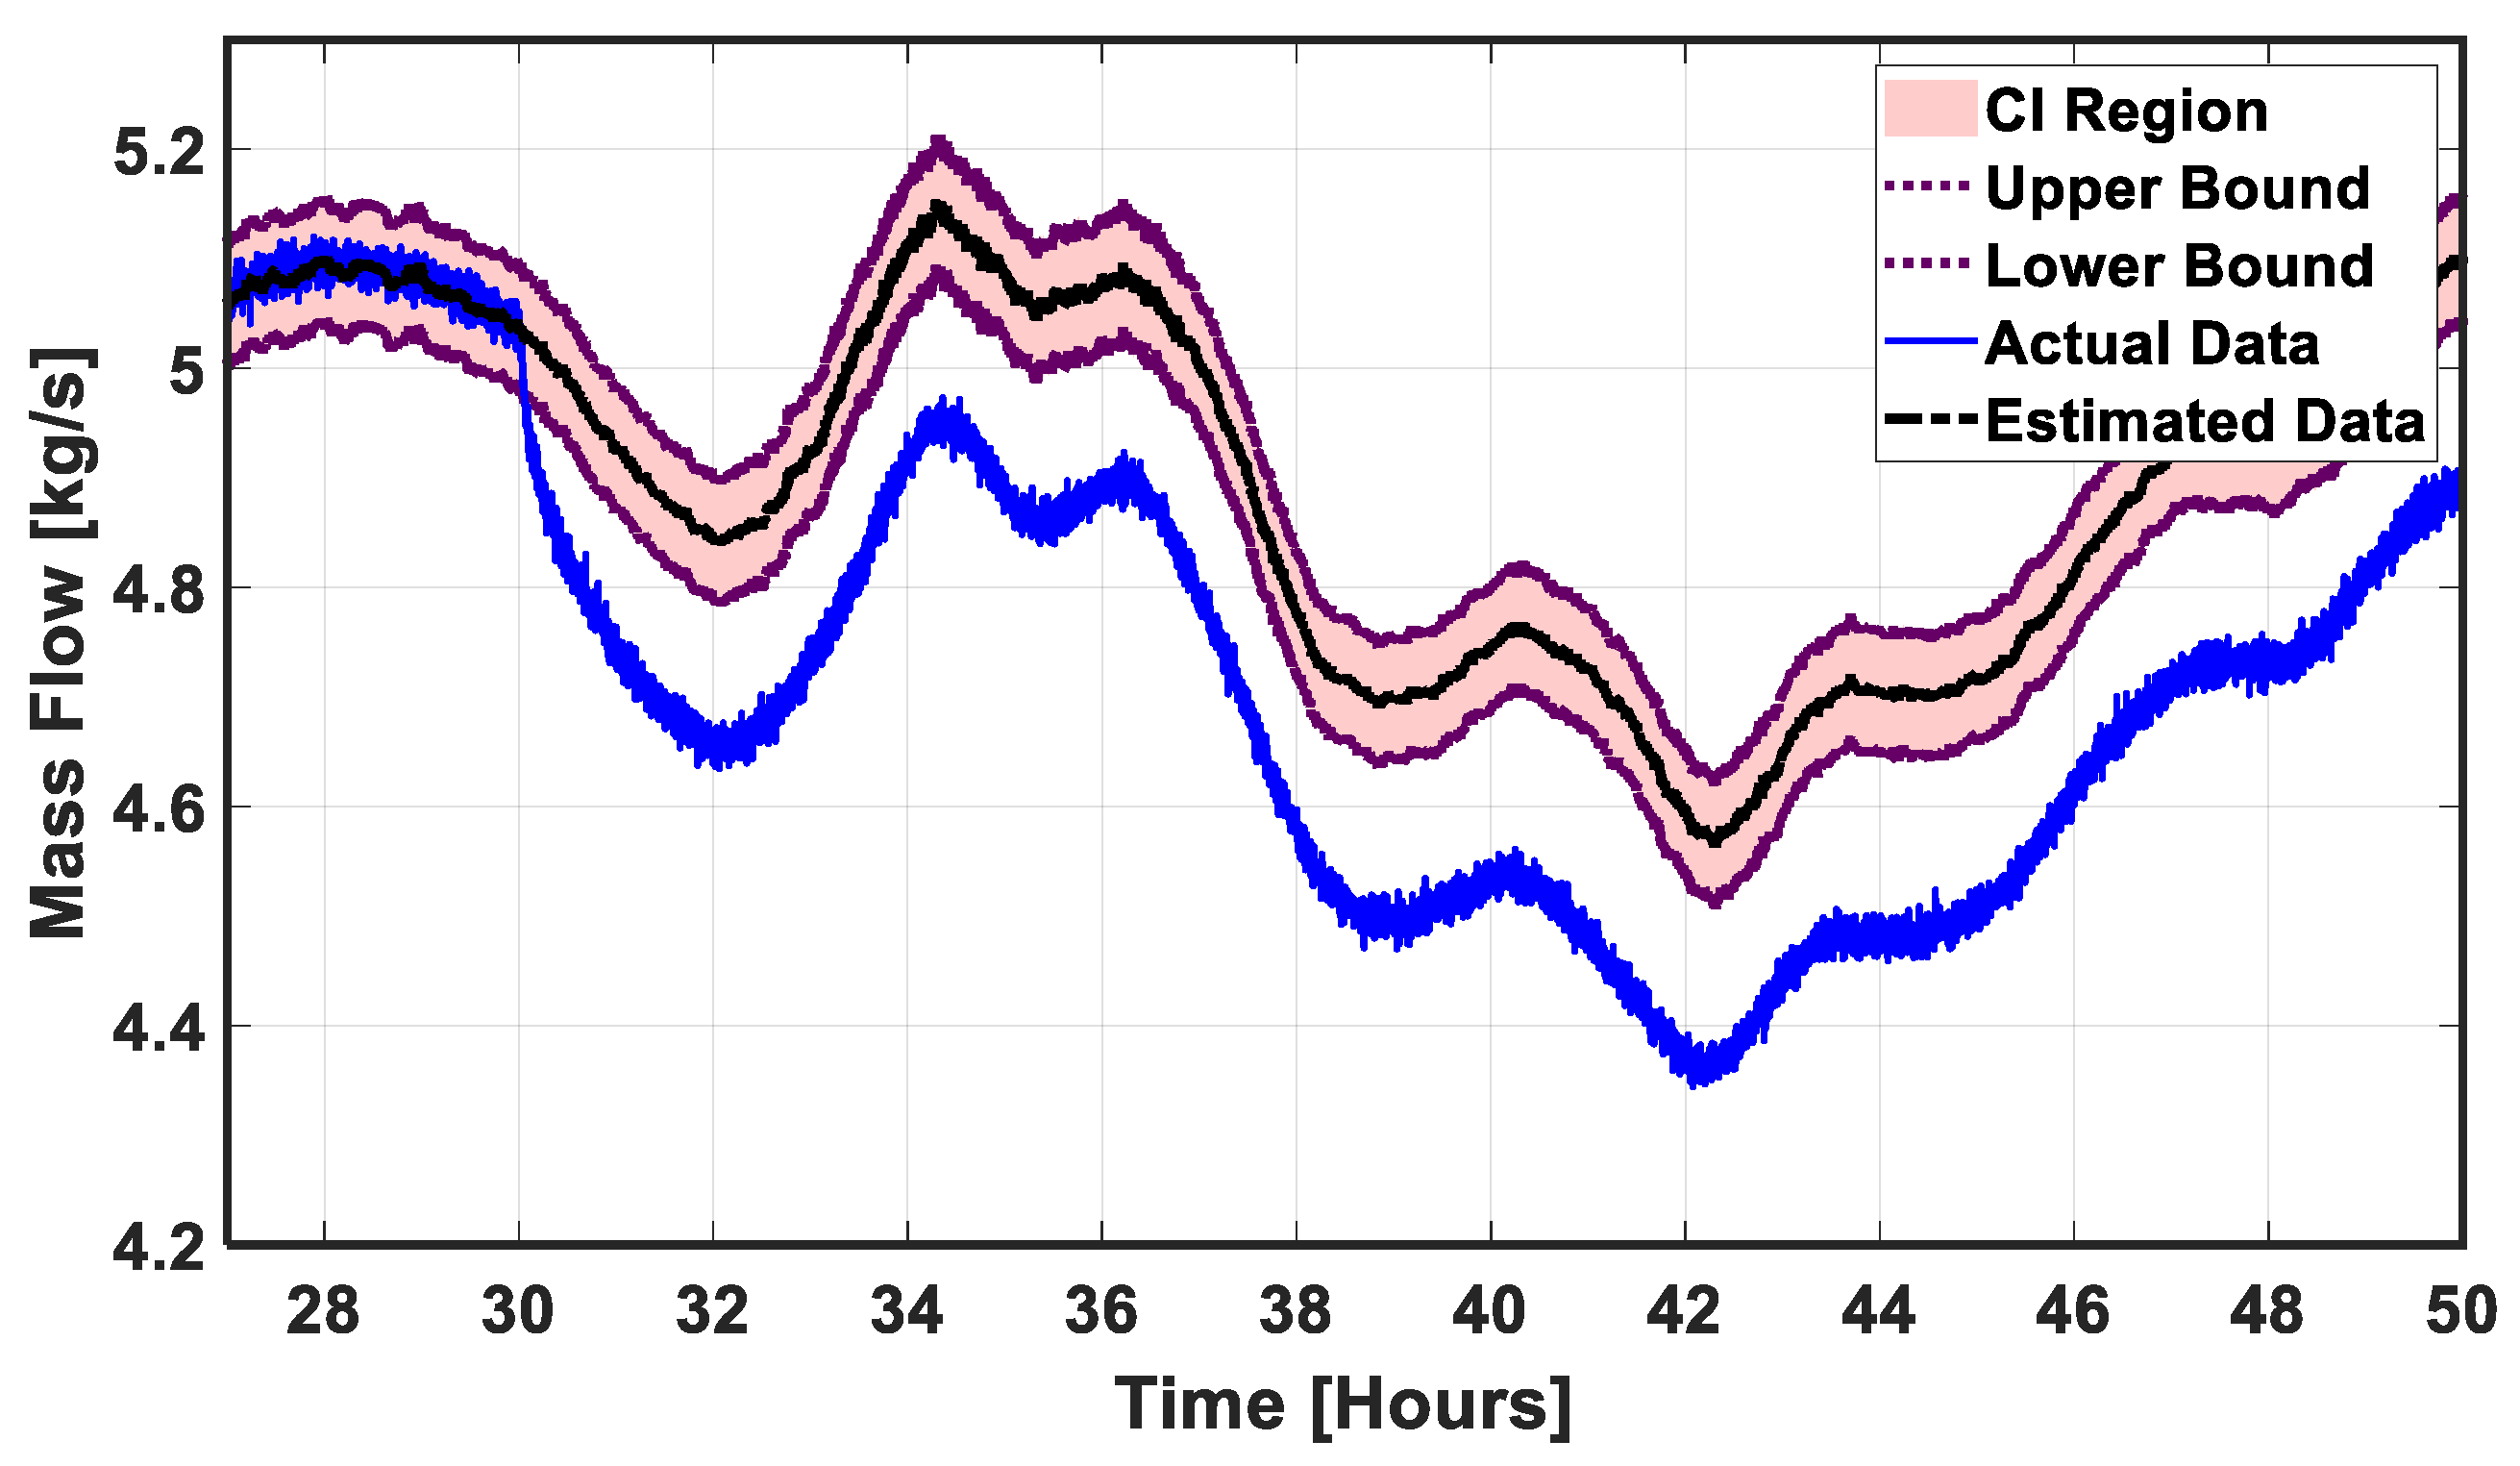
Figure 9.
Testing of Hammerstein model with 5% leak at 30 h, 1201 parameters and 0.2% noise ratio.
Figure 9.
Testing of Hammerstein model with 5% leak at 30 h, 1201 parameters and 0.2% noise ratio.
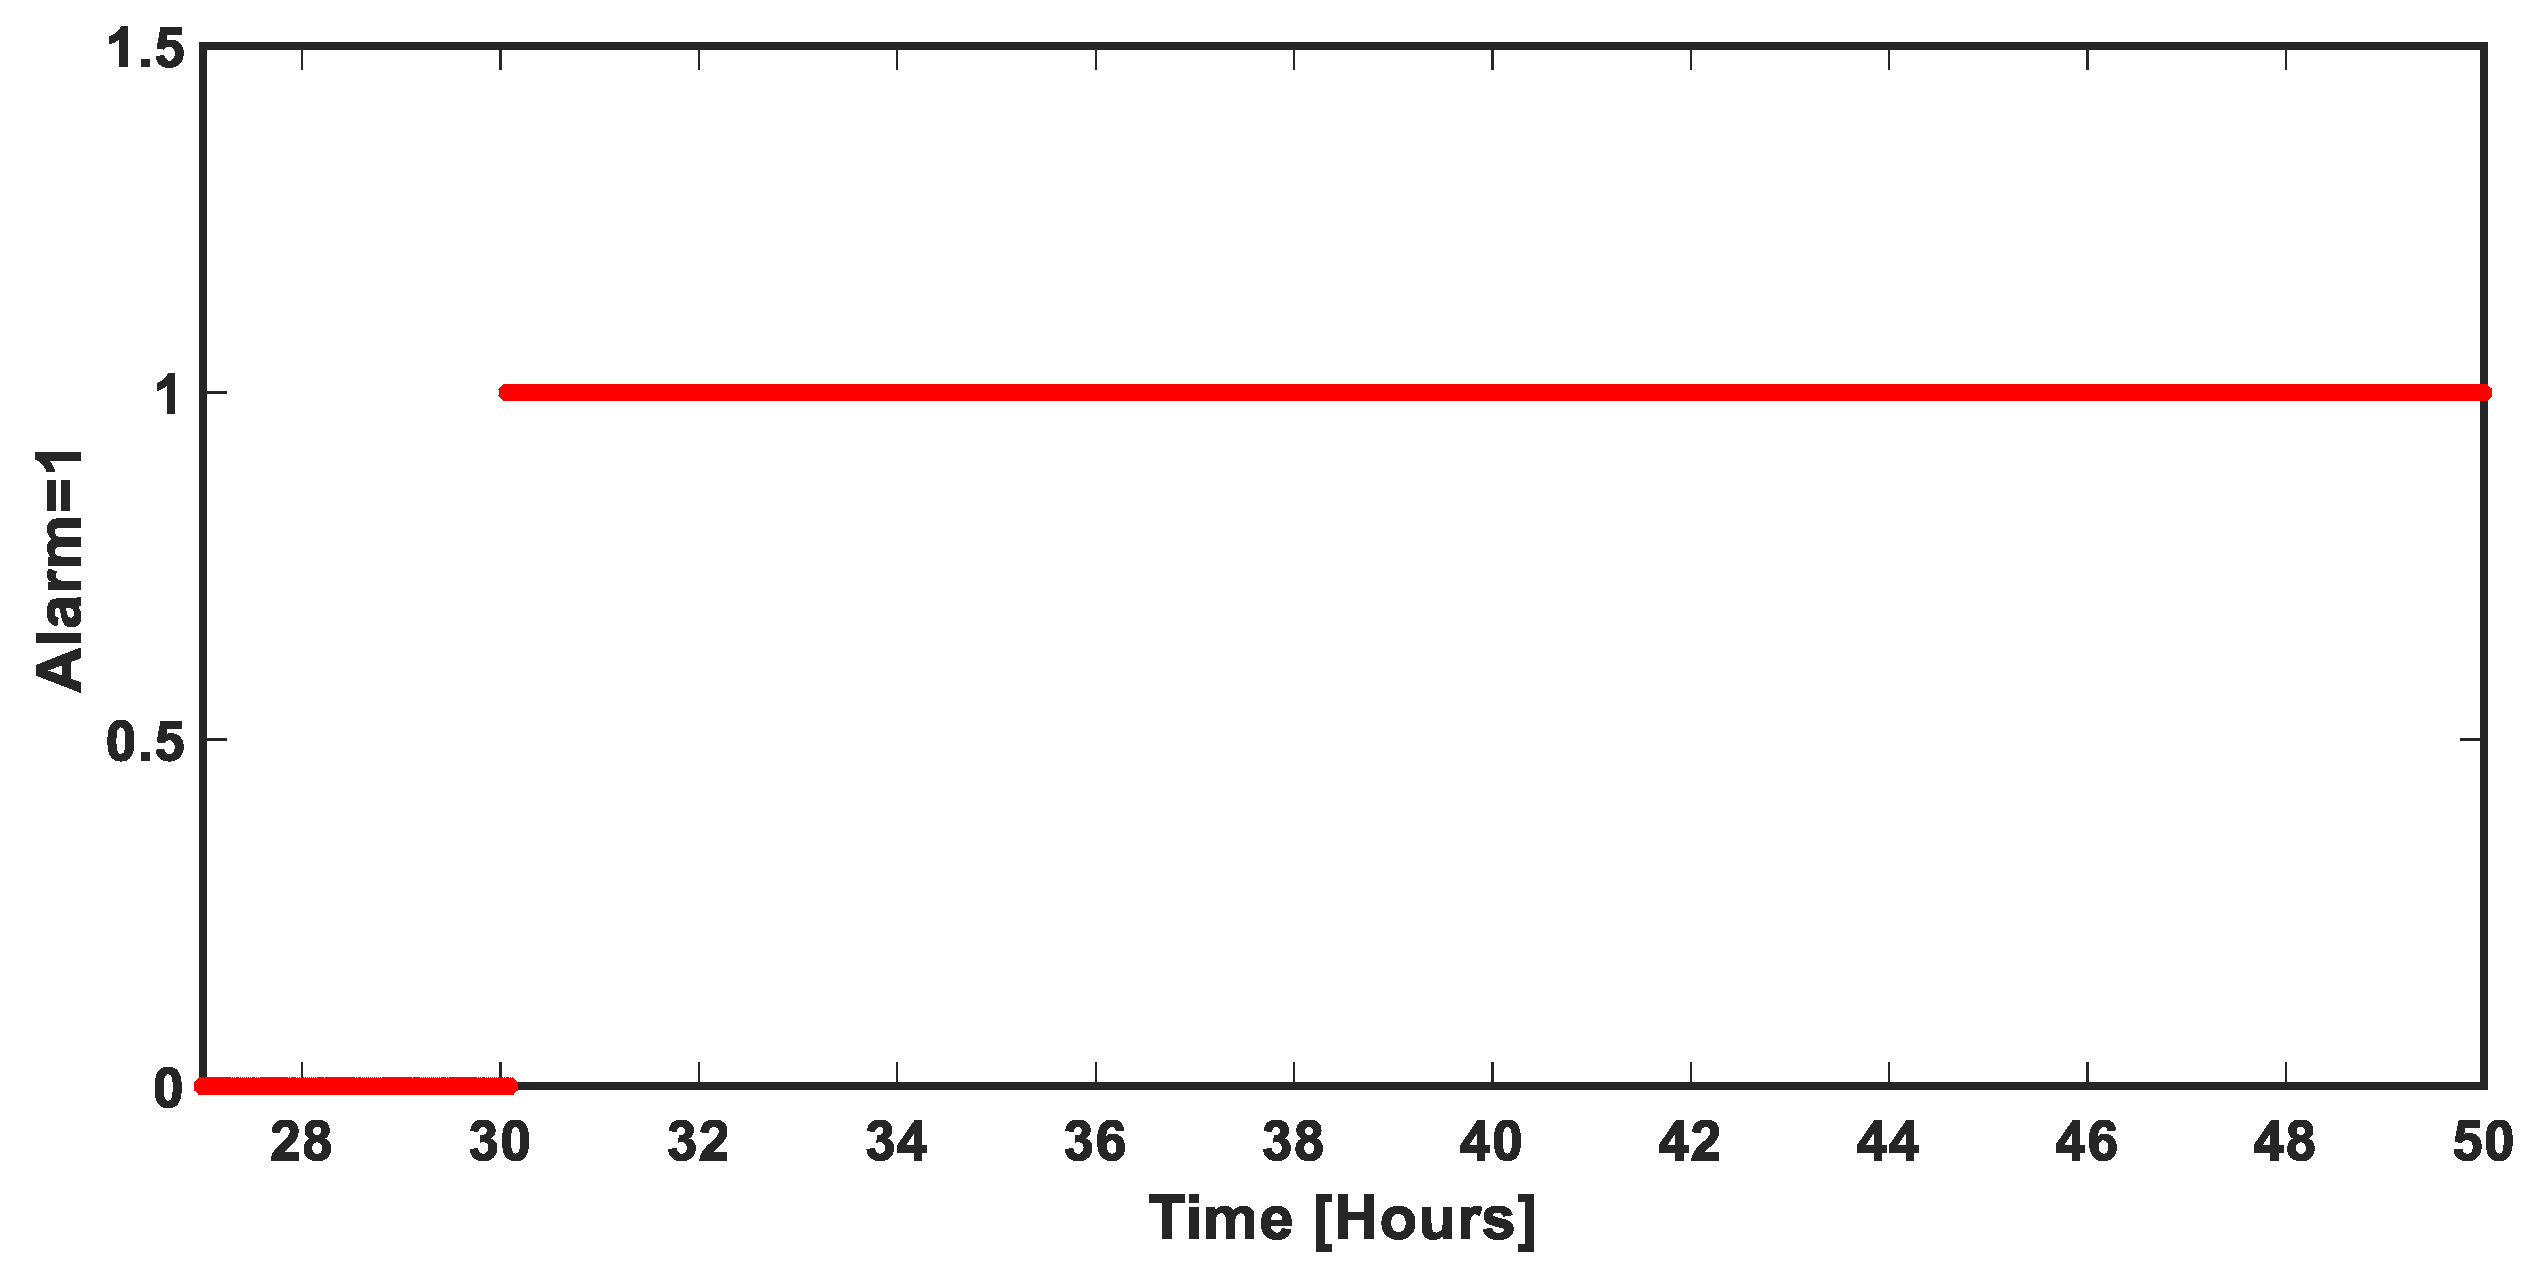
Figure 10.
Binary signals indicating normal and leakage conditions.
Figure 10.
Binary signals indicating normal and leakage conditions.
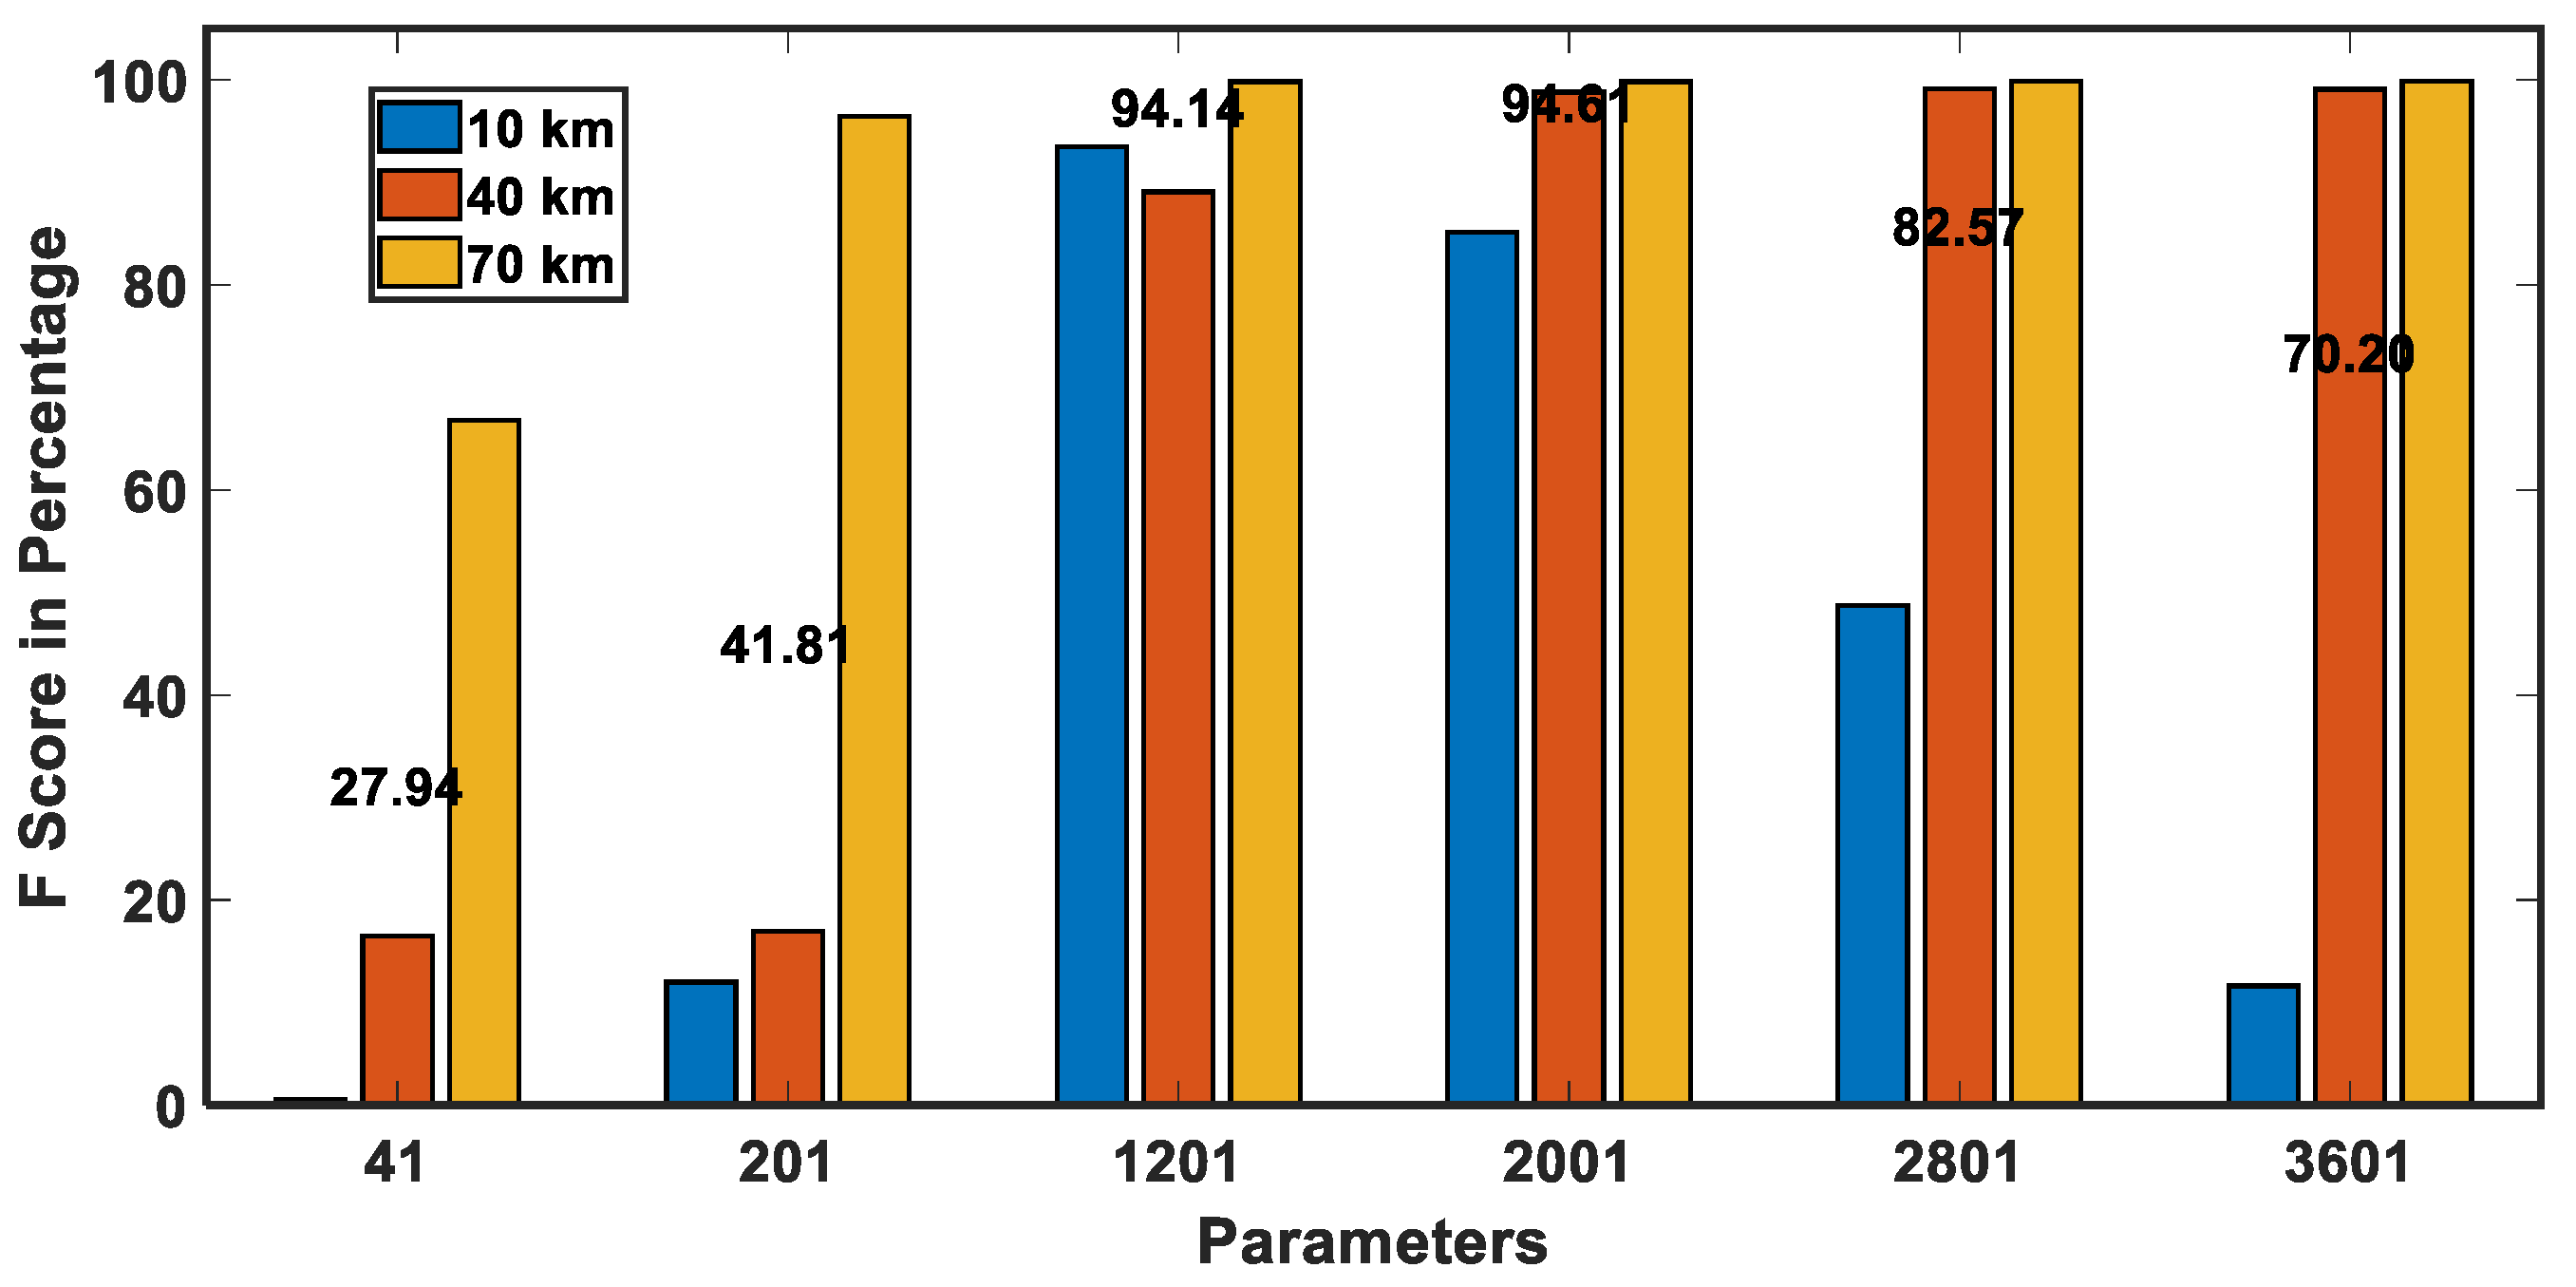
Figure 11.
F-Score of 5% leak detection using various parameters at different locations.
Figure 11.
F-Score of 5% leak detection using various parameters at different locations.
Table 1.
Variations in the parameters used by previous studies on pipeline leak detection.
Table 1.
Variations in the parameters used by previous studies on pipeline leak detection.
| Fluid | Length (km) | 1 Fluid
Compr. | 2 Temp.
Variation | Detection Method | Noise (%) | Leak in Terms of | Fault Detection | References |
|---|
| Range/Value | Accuracy (%) |
|---|
| Liquid | 10 | Constant | Constant | SVM | No | Velocity | (1–20)% | 99 | [19] |
| Gas Mix | 10 | Transient | Transient | Observer | 0.5 | Mass Flow | 0.7–1.5 | - | [14] |
| Gas Mix | 0.014 | Constant | Constant | RTTM | Yes | Opening | 30 to 60 degree | 94 | [31] |
| Multiphase | 20 | Transient | Transient | ANN | Yes | Opening | 0.5 inch | 95 | [24] |
| Liquid | 0.0578 | Constant | Constant | PCA | Yes | Mass Flow | (4–5)% | - | [27] |
| Gas Mix | 35 | Constant | Constant | Observer | No | Mass Flow | 4.1% | - | [34] |
| Liquid | 37 | Transient | Constant | Particle Filter | Yes | Mass Flow | 10% | - | [37] |
| Gas Mix | 0.6 | Transient | Constant | RTTM | No | Mass Flow | 30% | - | [32] |
| Liquid | 0.011 | Constant | Constant | IRF | Yes | Opening | (1–2) mm | - | [38] |
| Liquid | 40 | Constant | Constant | Distance | Yes | Mass Flow | 1% | - | [16] |
| Gas Mix | 80 | Transient | Transient | HM | 0.0–0.5% | Mass Flow | (2–5)% | >95 | This study |
Table 2.
Indicators used to evaluate the performance of leak detection system.
Table 2.
Indicators used to evaluate the performance of leak detection system.
| Performance Measure | Formula |
|---|
| Accuracy (percentage of correct classification) | |
| Error rate (percentage of incorrect classification) | |
| Sensitivity to fault | |
| Specificity (true normal condition detection) | |
| False alarm rate | |
| Precision (true fault detection) | |
| F-score | |
Table 3.
Boundary conditions and other parameters used in case study.
Table 3.
Boundary conditions and other parameters used in case study.
| Parameters | Case Study |
|---|
| Length, Diameter | 80 km, 0.20701 m |
| Thickness of Wall | 0.101 m (4 inches) |
| Pipe material | Carbon Steel |
| Flowing fluid | Natural Gas |
| Surface roughness | 0.617 mm |
| Ambient temperature | 283.15 K |
| Heat transfer coefficient | |
| Inlet temperature | 293.15 K |
| Inlet pressure | - |
| Inlet mass flow | APRBS |
| Outlet pressure | 2 MPa |
| Outlet temperature | 283 K |
| Outlet mass flow | - |
| Friction factor | Colebrook |
| Compressibility | GERG-2008 |
Table 4.
Leak detection system performance measures with several parameters at 10 km, leak size was 5% of the nominal flow and, noise ratio was 0.2%.
Table 4.
Leak detection system performance measures with several parameters at 10 km, leak size was 5% of the nominal flow and, noise ratio was 0.2%.
| Number of Parameters | Ac (%) | ER (%) | Se (%) | Sp (%) | Pr (%) | FS (%) | LDT (min) |
|---|
| 41 | 13.29 | 86.70 | 0.29 | 100 | 100 | 0.518 | 541.67 |
| 81 | 13.38 | 86.62 | 0.38 | 100 | 100 | 0.77 | 1083.20 |
| 201 | 18.59 | 81.40 | 6.38 | 100 | 100 | 12.00 | 62.83 |
| 401 | 83.48 | 16.51 | 81.00 | 100 | 100 | 89.50 | 12.00 |
| 801 | 92.36 | 7.63 | 91.22 | 100 | 100 | 95.41 | 20.67 |
| 1201 | 89.37 | 10.62 | 87.77 | 100 | 100 | 93.49 | 33.17 |
| 1601 | 85.98 | 14.02 | 83.87 | 100 | 100 | 91.23 | 36.00 |
| 2001 | 77.99 | 22.00 | 74.69 | 100 | 100 | 85.16 | 22.17 |
| 2401 | 64.13 | 35.86 | 58.75 | 100 | 100 | 74.02 | 76.33 |
| 2801 | 41.00 | 58.96 | 32.19 | 100 | 100 | 48.72 | 48.70 |
| 3601 | 18.35 | 81.64 | 6.17 | 99.53 | 99.88 | 11.63 | 16.67 |
| 4801 | 70.70 | 29.29 | 66.40 | 99.35 | 99.85 | 79.76 | 79.76 |
Table 5.
Leak detection system performance measures with several parameters at 45 km, leak size was 5% of the nominal flow and, noise ratio was 0.2%.
Table 5.
Leak detection system performance measures with several parameters at 45 km, leak size was 5% of the nominal flow and, noise ratio was 0.2%.
Number of
Parameters | Ac (%) | ER (%) | Se (%) | Sp (%) | Pr (%) | FS (%) | LDT (min) |
|---|
| 41 | 20.86 | 79.13 | 8.99 | 100 | 100 | 16.51 | 121.50 |
| 81 | 20.73 | 79.26 | 8.84 | 100 | 100 | 16.25 | 113.67 |
| 201 | 21.10 | 78.89 | 9.27 | 100 | 100 | 16.97 | 103.33 |
| 401 | 35.38 | 64.61 | 25.69 | 100 | 100 | 40.87 | 26.00 |
| 801 | 58.24 | 41.75 | 51.97 | 100 | 100 | 68.40 | 14.67 |
| 1201 | 82.90 | 17.00 | 80.33 | 100 | 100 | 89.09 | 11.00 |
| 1601 | 94.28 | 5.71 | 93.43 | 100 | 100 | 96.60 | 9.50 |
| 2001 | 97.98 | 2.01 | 97.68 | 100 | 100 | 98.82 | 8.33 |
| 2401 | 98.65 | 1.34 | 98.45 | 100 | 100 | 99.22 | 7.33 |
| 2801 | 98.50 | 1.497 | 98.30 | 100 | 100 | 99.13 | 6.33 |
| 3601 | 98.45 | 1.547 | 98.26 | 99.72 | 99.95 | 99.10 | 12.00 |
| 4801 | 98.56 | 1.43 | 98.44 | 99.35 | 99.90 | 99.16 | 3.83 |
Table 6.
Leak detection system performance measures with several parameters at 70 km, leak size was 5% of the nominal flow and, noise ratio was 0.2%.
Table 6.
Leak detection system performance measures with several parameters at 70 km, leak size was 5% of the nominal flow and, noise ratio was 0.2%.
Number of
Parameters | Ac (%) | ER (%) | Se (%) | Sp (%) | Pr (%) | FS (%) | LDT (min) |
|---|
| 41 | 56.65 | 43.34 | 50.15 | 100 | 100 | 66.80 | 91.50 |
| 81 | 62.34 | 37.65 | 56.70 | 100 | 100 | 72.36 | 80.00 |
| 201 | 94.08 | 5.91 | 93.19 | 100 | 100 | 96.47 | 10.33 |
| 601 | 99.42 | 0.58 | 99.33 | 100 | 100 | 99.66 | 5.50 |
| 801 | 99.68 | 0.314 | 99.63 | 100 | 100 | 99.81 | 4.00 |
| 1201 | 99.72 | 0.27 | 99.68 | 100 | 100 | 99.84 | 3.00 |
| 1601 | 99.78 | 0.21 | 99.75 | 100 | 100 | 99.87 | 2.83 |
| 2001 | 99.73 | 0.26 | 99.69 | 100 | 100 | 99.84 | 2.67 |
| 2401 | 99.79 | 0.20 | 99.76 | 100 | 100 | 99.88 | 2.50 |
| 2801 | 99.75 | 0.241 | 99.72 | 100 | 100 | 99.86 | 3.00 |
| 3601 | 99.78 | 0.217 | 99.75 | 100 | 100 | 99.87 | 3.00 |
| 4801 | 99.57 | 0.42 | 99.75 | 98.42 | 99.76 | 99.75 | 2.50 |
Table 7.
Leak detection system performance measures with increasing noise. Leak size was 5% of the nominal flow; 1201 parameters are used for the mass flow rate estimation.
Table 7.
Leak detection system performance measures with increasing noise. Leak size was 5% of the nominal flow; 1201 parameters are used for the mass flow rate estimation.
| Noise (%) | Ac (%) | ER (%) | Se (%) | Sp (%) | Pr (%) | FS (%) | LDT (min) |
|---|
| 0.0 | 99.73 | 0.26 | 99.69 | 100 | 100 | 99.84 | 0.17 |
| 0.1 | 99.77 | 0.22 | 99.73 | 100 | 100 | 99.86 | 3.00 |
| 0.2 | 99.75 | 0.24 | 99.72 | 100 | 100 | 99.86 | 3.00 |
| 0.3 | 99.64 | 0.35 | 99.59 | 100 | 100 | 99.79 | 3.17 |
| 0.4 | 99.56 | 0.43 | 99.50 | 100 | 100 | 99.79 | 4.00 |
| 0.5 | 99.27 | 0.72 | 99.16 | 100 | 100 | 99.58 | 3.67 |
| Average | 99.62 | 0.37 | 99.565 | 100 | 100 | 99.78667 | 2.835 |
Table 8.
Leak detection system performance measures with ascending leak sizes, noise was kept 0.2%; 1201 parameters are used for the mass flow rate estimation.
Table 8.
Leak detection system performance measures with ascending leak sizes, noise was kept 0.2%; 1201 parameters are used for the mass flow rate estimation.
| Leak Size (%) | Ac (%) | ER (%) | Se (%) | Sp (%) | Pr (%) | FS (%) | LDT (min) |
|---|
| 1 | 32.99 | 67.00 | 22.94 | 100 | 100 | 37.32 | 73.33 |
| 2 | 95.95 | 4.06 | 95.32 | 100 | 100 | 97.60 | 8.83 |
| 3 | 99.48 | 0.51 | 99.40 | 100 | 100 | 99.70 | 4.67 |
| 4 | 99.70 | 0.33 | 99.61 | 100 | 100 | 99.80 | 4.17 |
| 5 | 99.75 | 0.24 | 99.72 | 100 | 100 | 99.86 | 3.00 |
Table 9.
Comparison between our work and recent leak detection studies.
Table 9.
Comparison between our work and recent leak detection studies.
| Year | Detection Technique | Advantage | Disadvantage | Best Performance Under | Reference |
|---|
| 2020 | Model Identification and ATBLD | - -
High accuracy under transient conditions - -
Less amount of data required for training - -
Low Cost - -
Easily extended for leak localization and size estimation - -
Easy to make physical interpretations
| - -
Requires detailed study on design of experiment and selection of parameters - -
Detailed tuning is required for new system
| Transient conditions | This Study |
| 2019 | SVM | - -
Good classifier for high dimensional faults - -
Low Cost
| - -
Detailed tuning is required for new system - -
Difficult to make physical interpretations - -
FAR in Transients
| Steady state conditions | [19] |
| 2018 | PCA | - -
Low Cost - -
Good for Multivariate systems
| - -
Detailed tuning is required for new system - -
Requires addition effort to combine with other techniques, e.g., Q-Statistics - -
FAR in Transients
| Steady state conditions | [27] |
| 2018 | IRF | - -
Less amount of data are required for training - -
Low Cost - -
Easily extended for leak localization and size estimation
| - -
Requires detailed study on design of experiment and selection of parameters - -
Detailed tuning is required for new system
| Transient conditions | [38] |
| 2017 | ANN | - -
Low Cost - -
Once trained, then have high speed
| - -
Large data sets are required for training - -
Detailed tuning is required for new system - -
Very difficult to make physical interpretations - -
FAR in Transients
| Steady state conditions | [24] |
| 2017 | Observer | - -
High accuracy - -
Generic: Easily applied to any pipeline - -
Easily extended for leak localization and size estimation
| - -
Advanced computational facility is required - -
Required complex modeling for good results
| Transient conditions | [14] |
| 2015 | RTTM | - -
High accuracy - -
Generic: Easily applied to any pipeline - -
Easily extended for leak localization and size estimation
| - -
Advanced computational facility is required - -
Required complex modeling for good results
| Transient conditions | [31] |

 ,
, 


