Article

Water Droplets Translocation and Fission in a 3D Bi-Planar Multifurcated T-Junction Microchannels

1
Faculty of Engineering and the Built Environment, SEGi University, Kota Damansara, Petaling Jaya 47810, Selangor, Malaysia
2
Department of Chemical Engineering, Universiti Teknologi PETRONAS, Seri Iskandar 32610, Perak Darul Ridzuan, Malaysia
3
School of Engineering and Physical Sciences, Heriot-Watt University Malaysia Campus, Putrajaya 62200, Wilayah Persekutuan Putrajaya, Malaysia
4
School of Applied Sciences, Department of Chemical Sciences, University of Huddersfield, Queensgate, Huddersfield HD1 3DH, UK
*
Authors to whom correspondence should be addressed.
Processes 2020, 8(5), 510; https://doi.org/10.3390/pr8050510
Submission received: 5 February 2020 / Revised: 11 April 2020 / Accepted: 24 April 2020 / Published: 26 April 2020
(This article belongs to the Section Chemical Processes and Systems)

Abstract

:
Droplet fission has gained notable interest in drug delivery applications due to its ability to perform parallel operations in single device. Hitherto, droplet flow behavior in a 3D constriction was scarcely investigated. This study aims to investigate droplets fission inside a 3D bi-planar multifurcated microfluidic device. The flow behavior and droplet size distribution were studied in trifurcated microchannels using distilled water as dispersed phase (1 mPa·s) and olive oil (68 mPa·s) as continuous phase. Various sizes of subordinate daughter droplets were manipulated passively through the modulation of flowrate ratio (Q) (0.15 < Q < 3.33). Overall, we found droplet size coefficient of variations (CV%) ranging from 0.72% to 69%. Highly monodispersed droplets were formed at the upstream T-junction (CV% < 2%) while the droplet fission process was unstable at higher flowrate ratio (Q > 0.4) as they travel downstream (1.5% < CV% < 69%) to splitting junctions. Complex responses to the non-monotonic behavior of mean droplet size was found at the downstream boundaries, which arose from the deformations under nonuniform flow condition. CFD was used as a tool to study the preliminary maximum velocity (Umax) profile for the symmetrical (0.01334 m/s < Umax < 0.0153 m/s) and asymmetrical branched channels (0.0223 m/s< Umax < 0.00438 m/s), thus complementing the experimental model studies.

1. Introduction

Microfluidics is defined as the technology that manipulates an extremely small amount of fluid by exploiting microchannels with dimensions of tens to hundreds of micrometers. The advancement in the field of microfluidics since the late 1980s has been significant. Considerable research efforts have been directed towards the development in microfluidics for drug delivery systems, medical diagnostics, and integration with biosensors [1,2,3,4,5,6,7,8]. Rapid development of droplet formation techniques in microfluidic devices has occurred as they provide robust and highly controllable platforms for droplet creation and manipulation. These have been used in a diverse range of applications including the production of monodispersed micro particles [9,10,11,12,13,14], enhancement of mixing [15], crystallization of proteins [16], synthesis of nanoparticles [17] and microchemical analysis [18].
In microfluidic systems, the analysis of droplet formation is imperative to understand the device operation and its process control [19]. Additionally, various operations of droplet manipulation such as fusion [20], fission [21,22], mixing [23,24], and sorting [25,26], with high precision and flexibility constitutes essential issue, at which extensive investigations have been directed. Among the distinctive approaches of droplet manipulation, hydrodynamic stress [27,28,29] is a simple and effective approach to accomplish droplet manipulation relating to the geometrical characteristics of microchannel. In this mode of manipulation, various mechanisms have been employed in the formation of droplets in microfluidics device, including co-flowing mechanisms [30,31], flow-focusing mechanisms [32], as well as cross-flowing mechanisms [33,34,35], Each of these mechanisms enable the formation of dispersions and precise control over droplet size distribution [7] with the aid of their unique designs of microchannel geometry.
In recent years, researches in the field of microfluidics have shown great interest in droplet fission due to the throughput of experiments and its ability to conduct multiple operation within the same device. Furthermore, a single droplet can be used as a vessel for reagents—and by splitting the droplet into sub-droplets—allowing to perform more parallel experiments and obtain more precise measurements. Methods for droplet fission can be either passive or active, where the former induce splitting by the geometric features of the microchannel and the latter employs the use of electricity or localized heating in promoting the interfacial instabilities for droplet splitting. Sub-nanoliter droplets after fission also advantageous in handling highly exothermic and hazardous chemical reactions in batches. The processes can be scaled down to enhance safety and shorten the reaction time [36]. Multiplex screening for blood is a potential development though droplet splitting, allowing a single droplet to be used to perform multiple tests simultaneously. This will yield the time saving factor in bio-medical screening and allow rapid diagnosis.
Passive droplet fission is achieved by the shearing force from the channel design to split the droplet into multiple daughter droplets. The splitting of droplet at the bifurcated junction can be manipulated by different continuous phase flow rates as well as channel resistance due to channel geometry [37]. Passive fission can be achieved with several channel designs, such as T-junction [2,38] bifurcating channels and channels with obstructions [39]. Meanwhile, active fission relies on external power, heat or electrical control of the splitting system. Electro-Wetting on Dielectric (EWOD) is one of the significant active fission mechanisms, where droplets lie on a dielectric surface respond to electric field and deformed towards its respective ends, initiating drops to pinch and split at the middle [40].
Yap et al. [41] controls droplet fission in T-junction using a microheater. The unequal division of the droplet in a system where heat is induced could be explained by the combined effects of thermos-capillary forces and reduction in fluidic resistance. Chen et al. [42] investigated the controlled breakup of double emulsion droplets as they pass flow through constriction feature formed by an orifice of a tapered nozzle. Rosenfeld et al. [43] investigated splitting and deformations of many drops in a concentrated emulsion when flowing through a narrow constriction in single planar PDMS microchannel, the structure is easy to replicate, facilitating scale-up for mass production of microdroplets. However, the relevant techniques to manipulate droplet fission by constriction are commonly performed in such a single planar microdevice. Sun and Liu [44] exploited the μPIV (microscale particle image velocimetry) analysis to investigate the internal flow field of a dividing droplet in a bifurcating microchannel. Herein, droplets are generated by a flow focusing scheme and sent downstream toward an asymmetric bifurcation. In the past recent years, Ren et al. [45] studied the formation and fission of droplet in shear-thinning/Newtonian system using bilayer bifurcating microchannel. They discovered that the droplet size and the generation rate were larger than that of Newtonian system across increasing shear rate. Furthermore, Ren et al. [46] also investigated the droplet breakup of Newtonian multiphase system in bilayer bifurcating microchannel. Monodispersed daughter droplets were formed with the average size differed in both layers. They also concluded that droplet fission in single layer bifurcating microchannel is achieved at high pressure drop than bilayer bifurcating microchannel at the same flow condition.
Existing researches for droplet fission process are commonly performed in a 2-D single planar microchannel. In this research, we have principally demonstrated a simple and versatile droplet fission scheme, from which a bifurcation junction is attached onto an extended T-junction to form a double planar microfluidic chip with distributary channels. Utilizing this geometrical scheme, the breakup phenomena of droplet at the 3-D branching point were studied under the influence of flow rates of continuous (Qc) and dispersed phase (Qd) fluids. Olive oil (µ = 0.068 Pa.s) was selected as continuous phase while water (µ = 0.0093 Pa.s) was used as the dispersed phase. For the two-phase flow system that neglects the Marangoni effect, present investigations enhanced the understanding of the splitting mechanism that govern the water droplet characteristics in different flow conditions and bifurcated channels aspect ratio. Droplet fission mechanism was investigated through the modulation of flow rate ratio in both symmetrical and asymmetrical bifurcation junction microchannel, whereby the flow rate ratio represents the quotient of dispersed phase and continuous phase (Q = Qd/Qc). Subsequently, the distribution of droplet size was quantified by the effective diameter of 30 daughter droplets in each region of interests. These preliminary key studies shed a new light on droplet-based microfluidic system with 3-D distributary network, which allow multiple droplet operation to be performed simultaneously.

2. Methodology

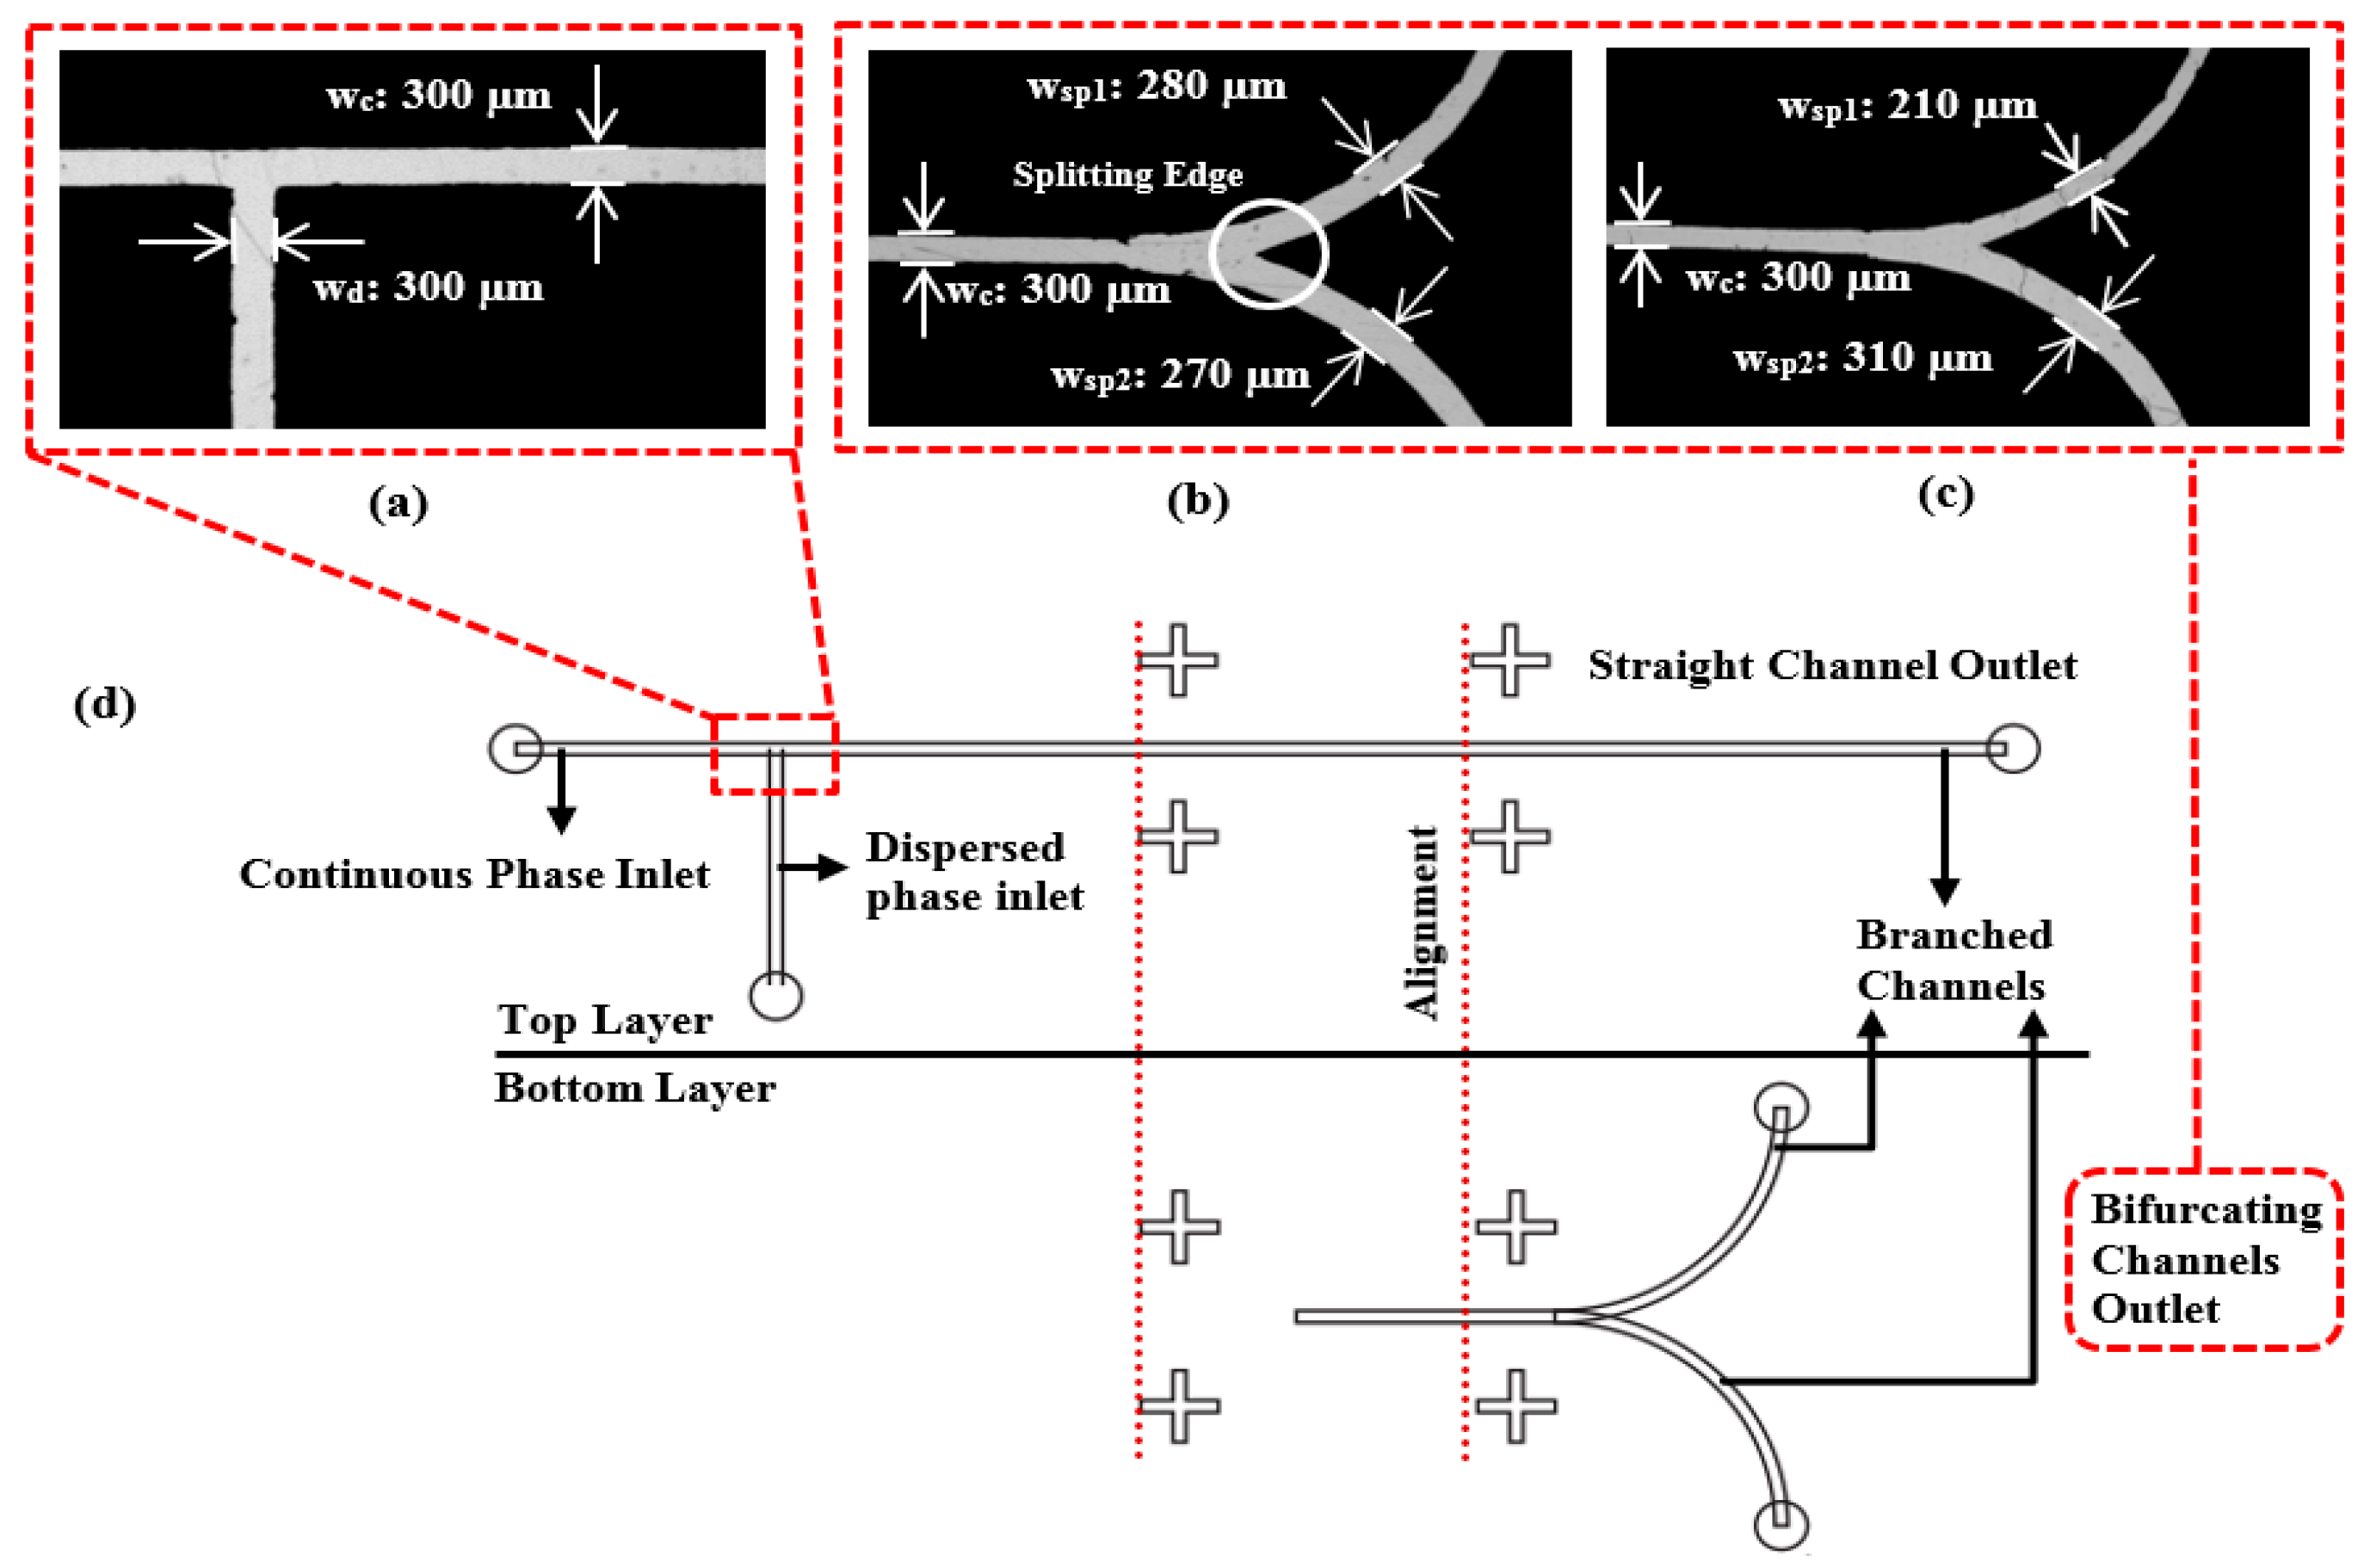
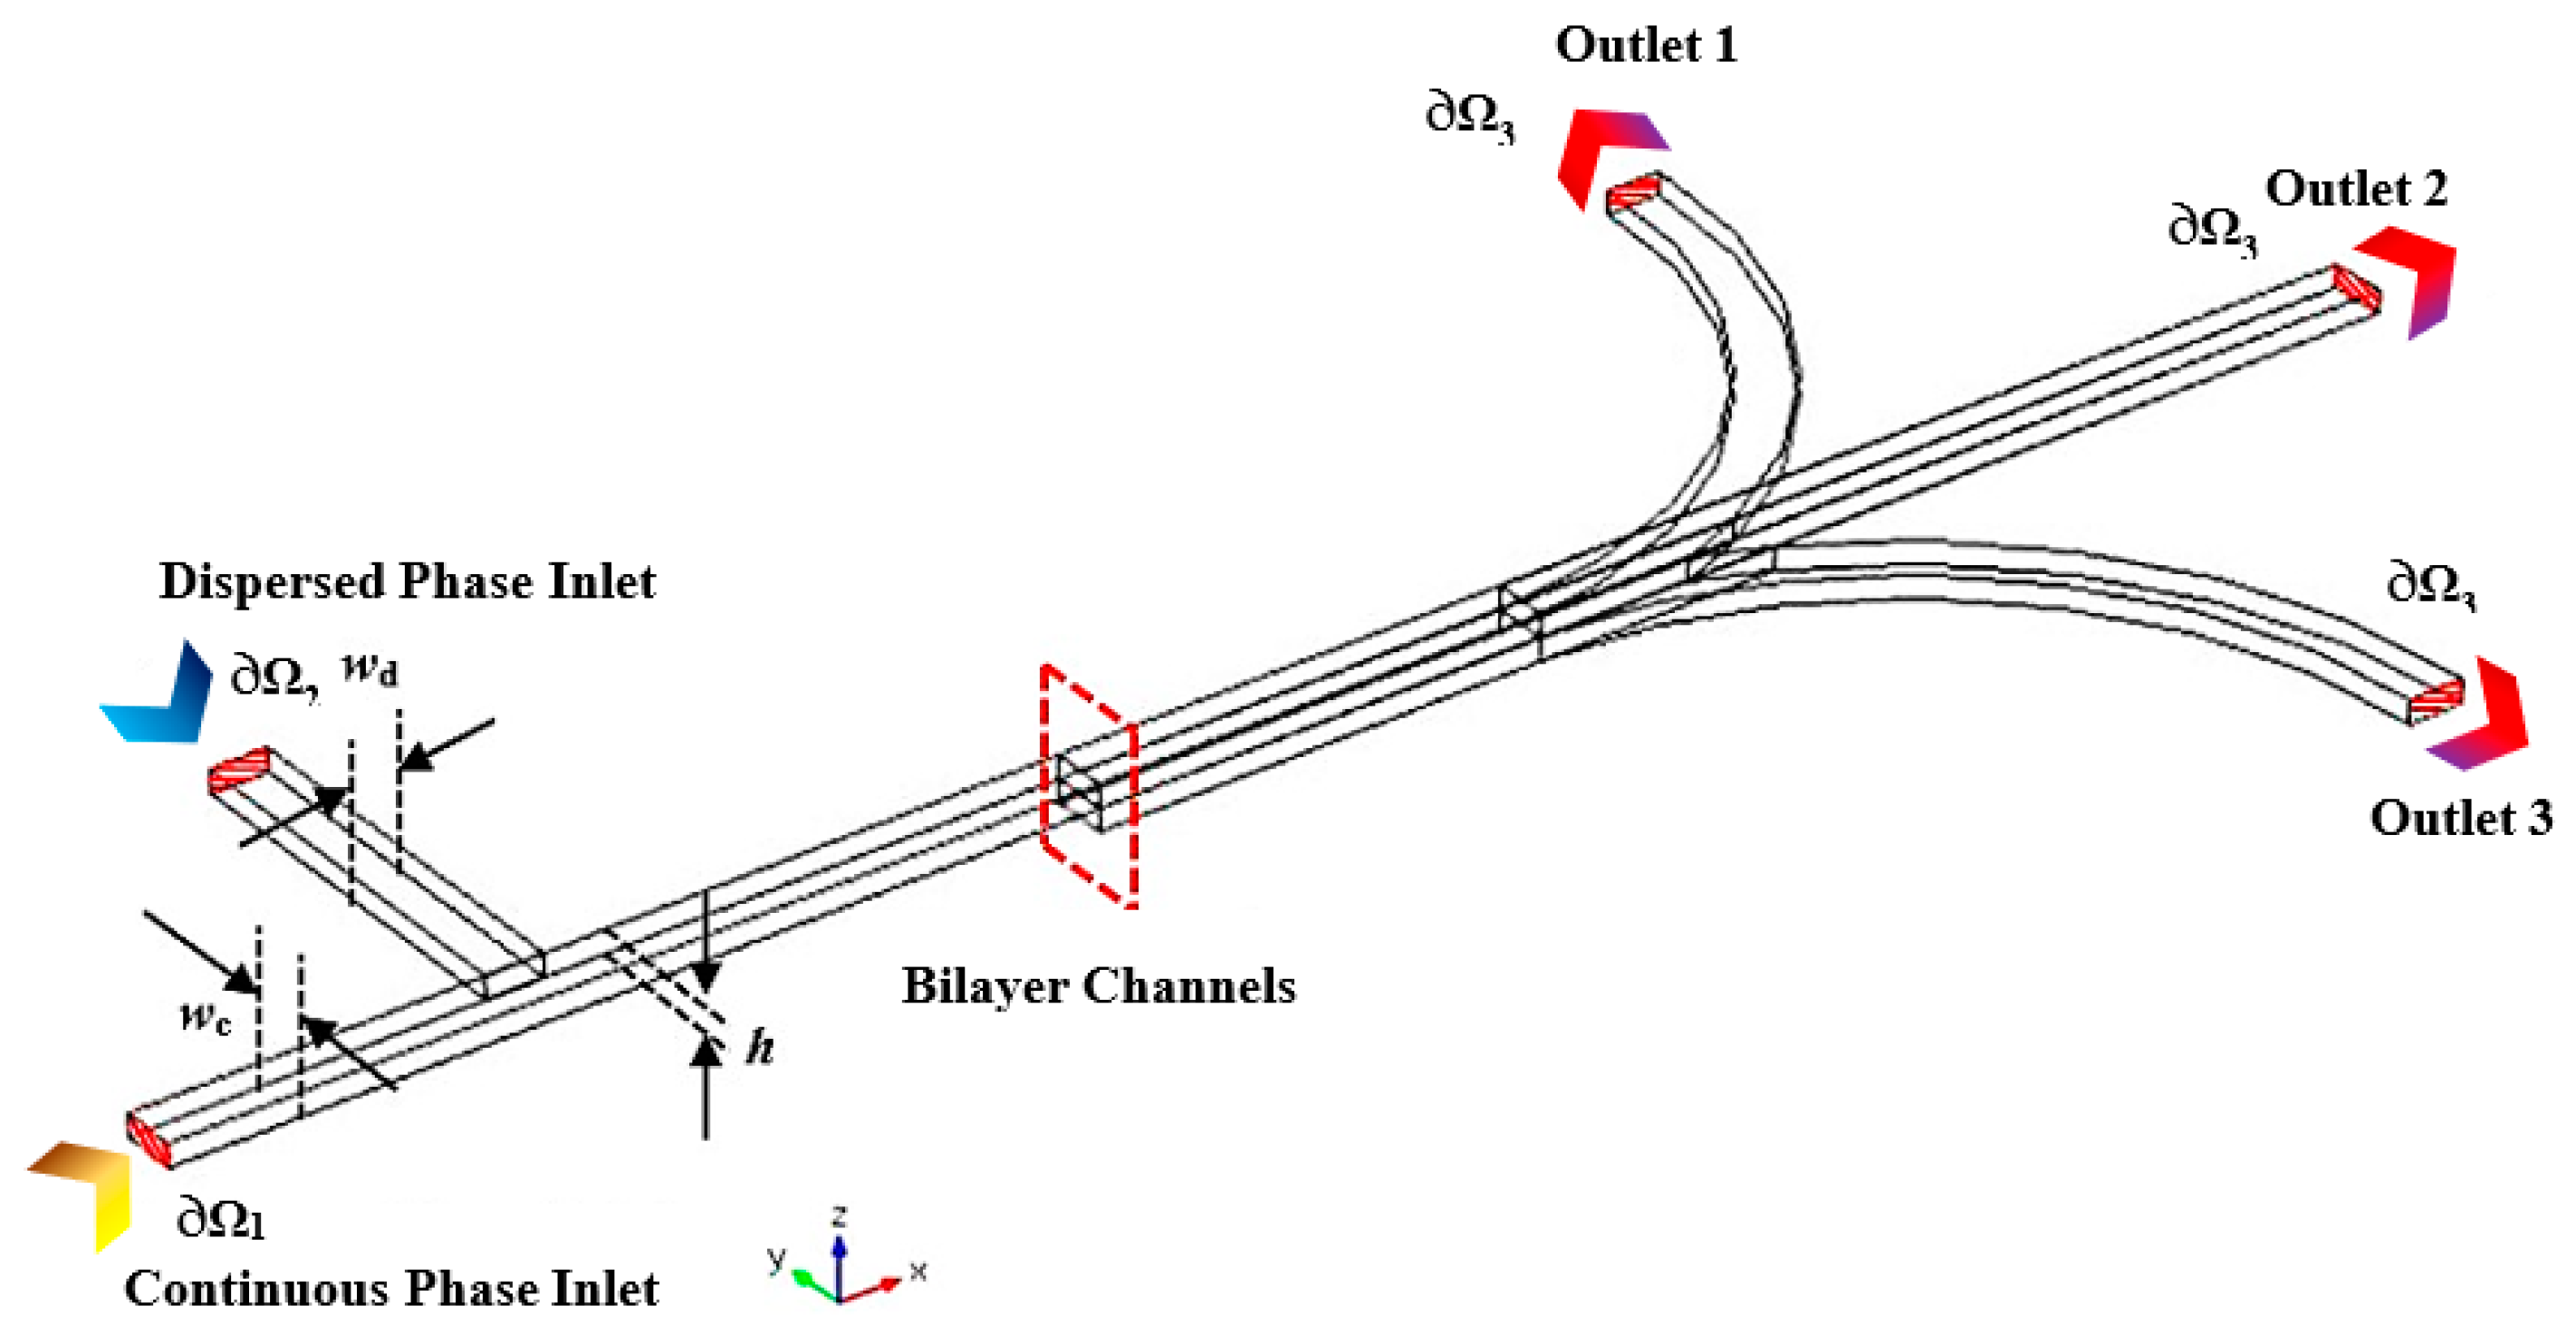
2.1. Microchannel Geometry

The double planar microfluidics device primarily consists of a T-junction microchannel as the top layer and a bifurcation junction as the bottom layer, with the desired width of 300 µm. Both layers were aligned and sealed, forming trifurcation channels with 3D splitting. Figure 1 illustrates the microchannel design of T-junction and bifurcated junctions with different aspect ratios of 1:1 and 2:3 (the quotient of width of first downstream splitting junction with the width of second splitting junction), respectively. The length of the branched channels is identical after the splitting edge at the highlighted region of interest as shown in Figure 1. Additionally, a schematic diagram of the microchannel is represented in Figure 2.

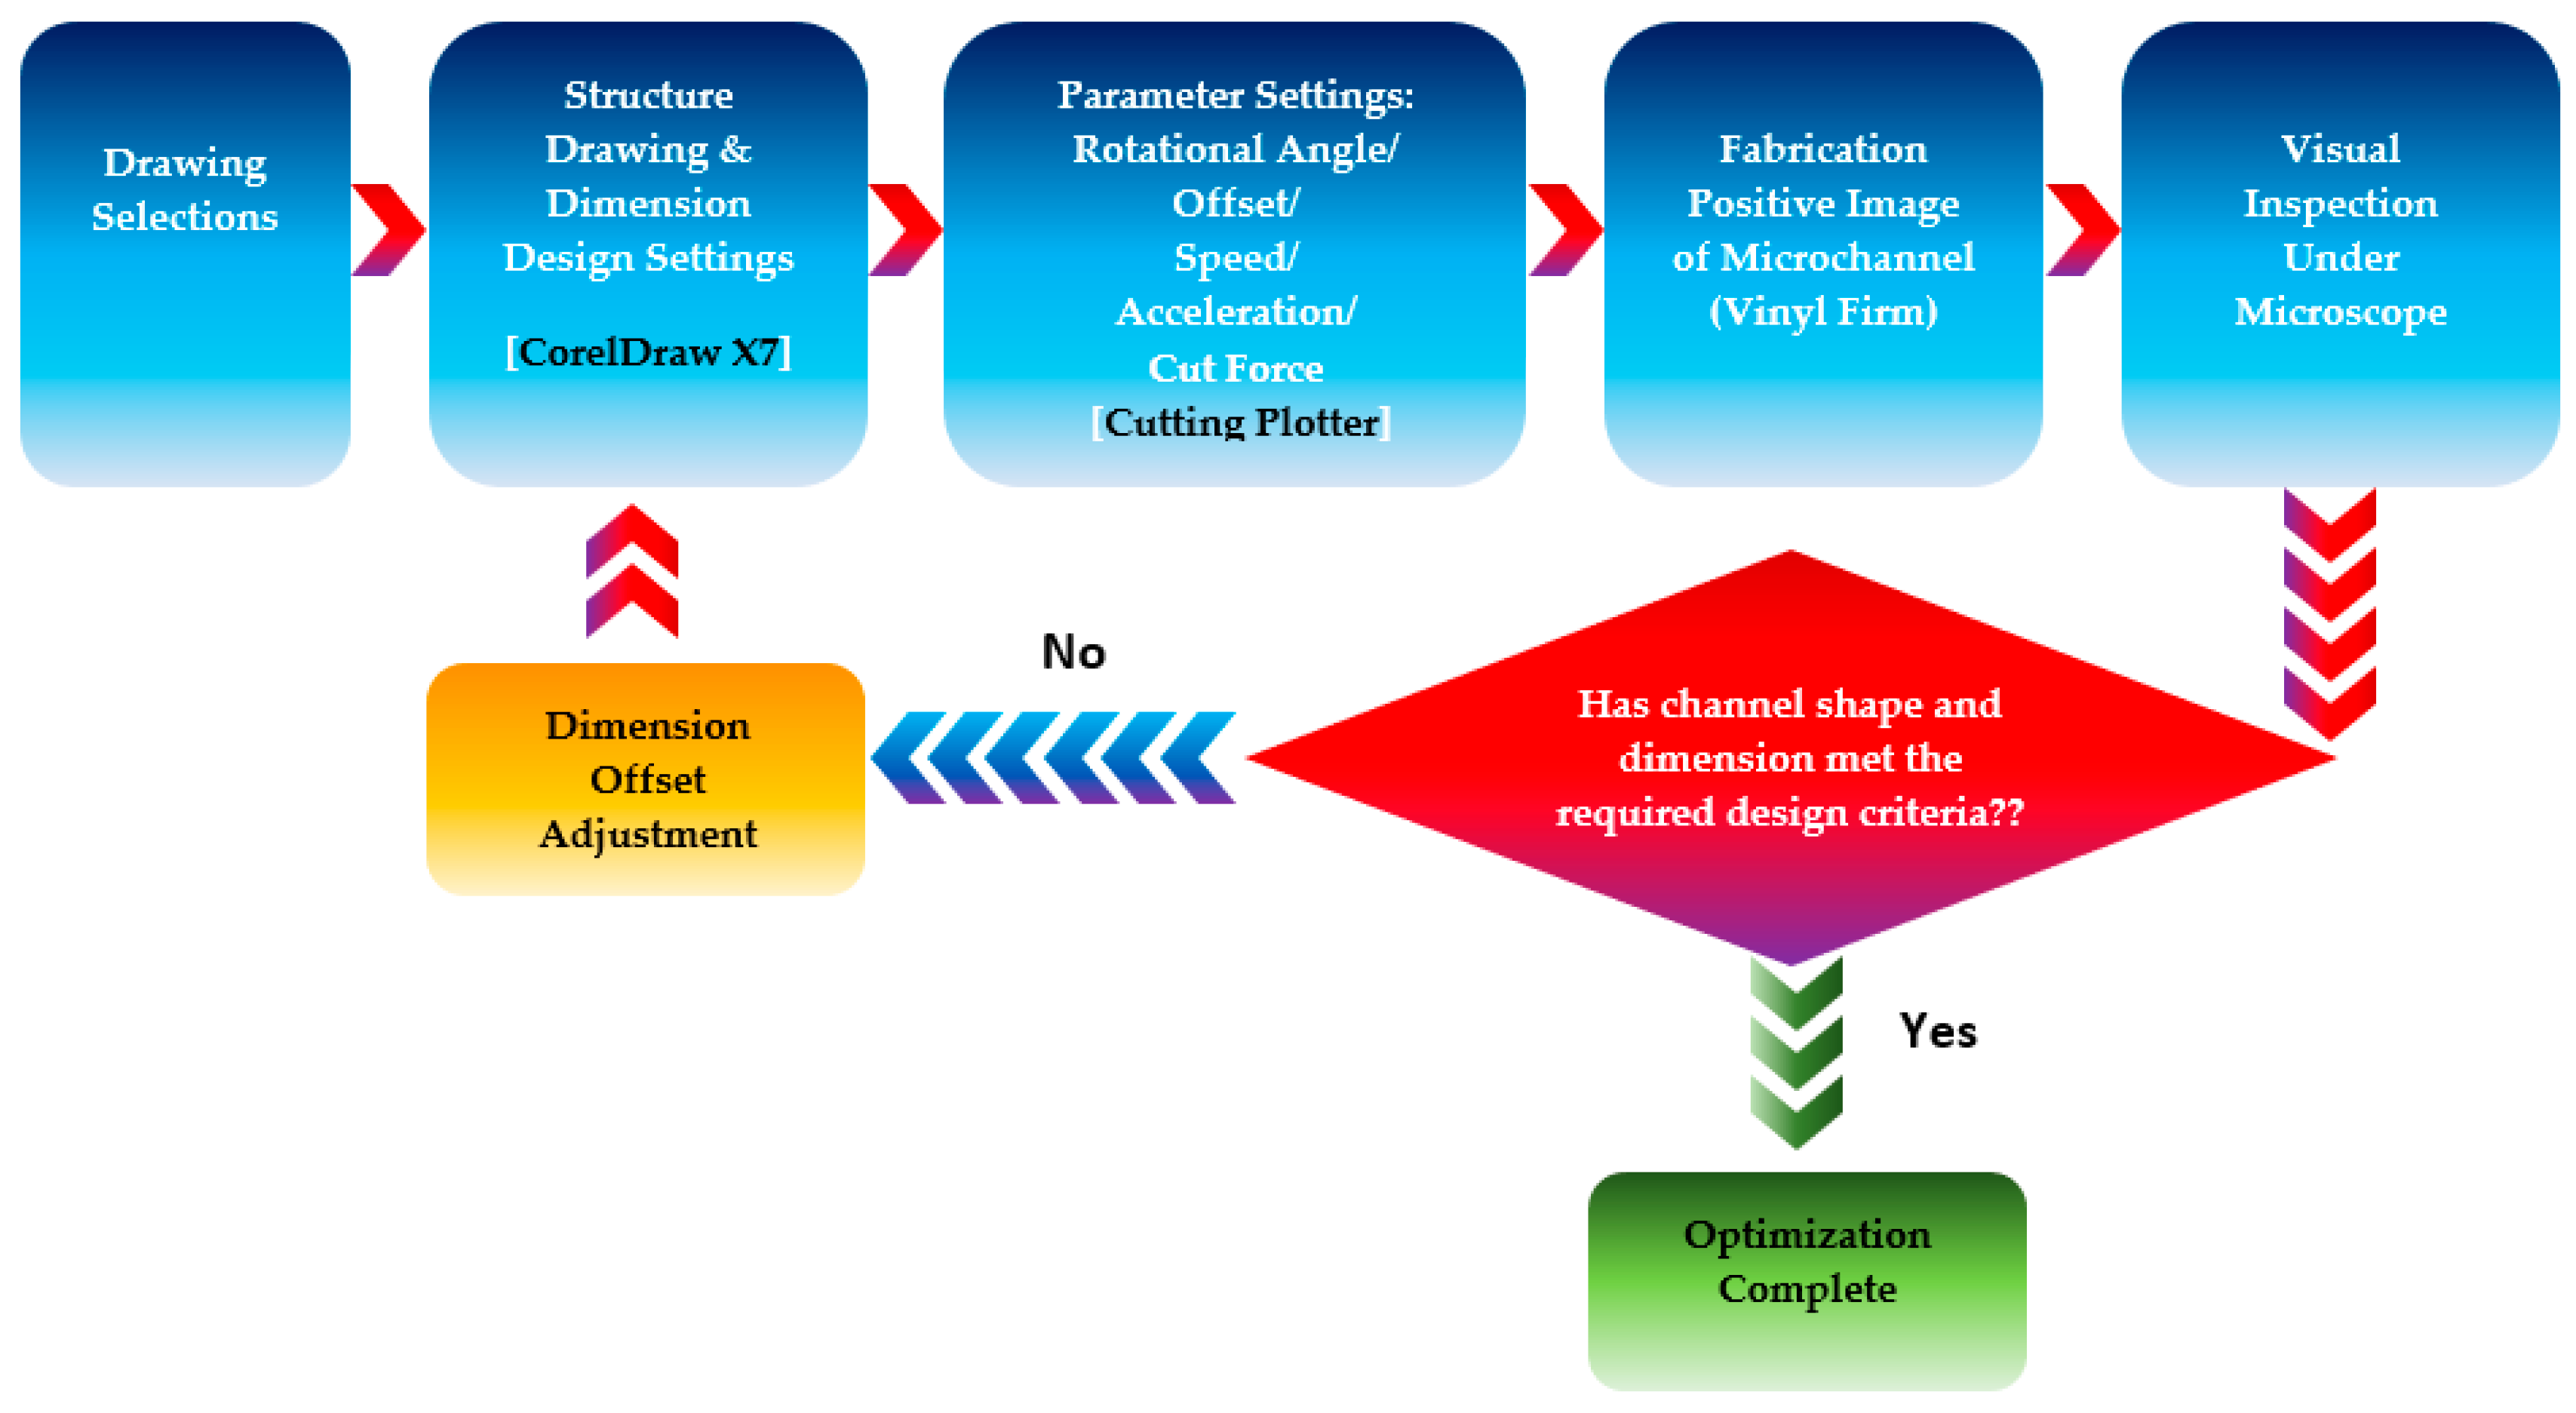
2.2. Polydimethylsiloxane (PDMS) Microfluidics Device Fabrication

Xurography, a rapid prototyping approach, was employed in cutting the design of a T-shaped and splitting junctions’ microstructures [47]. Various settings such as offset, cutting speed, acceleration, cut force, etc. were set to an appropriate parameter to obtain the optimum size of microchannel [48]. The dimension of channel geometry was created with the aid of a computer aided design (CorelDRAW Graphics Suite X7). Figure 3. shows the procedure of xurographic microchannel optimization. Subsequently, the xurographic positive tones with accurate dimensions were used to fabricate epoxy master molds. Epoxy master molds were then fabricated by mixing epoxy resin and its hardener (CP362 A/B, Oriental Option Sdn Bhd, Penang, Malaysia) in a solution at the ratio of 2:1. After curing, the xurographic positive tone was then removed before the soft-lithography approach was conducted. Soft-lithography is a simple and conventional technique used in the fabrication of polydimethylsiloxane (PDMS) microfluidic device that enables high reproducibility [49]. In present studies, PDMS is selected as the potential polymeric material for rapid prototyping of microfluidics device as it is optically transparent, flexible and low-cost. Thus, a PDMS microfluidic device was fabricated by molding a mixture of PDMS liquid pre-polymer (Sylgard 184, Dow Corning, Midland, MI, USA) at ratio of 10:1 (w/w) onto the epoxy mold.

2.3. Experimental Setup

Droplet flow experiment was then carried out by altering the flow rate of one phase while fixing the other phase. The inlet of the continuous phase (olive oil) and the dispersed phase (water) was introduced using two syringe pumps (KD Scientific 200, Holliston, MA, USA and NE-4000, Farmingdale, New York, USA) at prescribed flow rate into the microchannel, respectively. The formation and behavior of droplets was observed using epifluorescence microscope (Olympus IX51, Shinjuku, Tokyo, Japan) incorporated with high speed camera (Phantom Miro M110, Vision Research, Wayne, NJ, USA). The formation of droplets in the PDMS-based microchannel was allowed to stabilize and reach steady-state for predetermined time intervals of 20 min. Videos were recorded at 300 frames per second (fps) after each flow rates of either continuous or dispersed phase were adjusted. The images of droplets were used to measure the size of droplets formed with the aid of MATLAB R2012a image processing tools to determine the droplet size distribution, as shown in Figure 4. Each droplet size can be tuned by adjusting the flow rate of continuous phase and dispersed phase in microchannel. Since the formed droplets/plugs are almost always confined by channel walls and their interfaces may depart significantly from a spherical shape, the size of droplet or plug will be having different major (dmajor) and minor (dminor) axis length of droplet (see Figure 4a). Thus, the measurement of dmajor and dminor of droplet observed to be either inadequate or less accurate. Effective droplet diameter (deff) denotes the apparent diameter of droplets with the equivalent spherical area (Aeff) as the formed droplets/plugs was used to determine the droplet size according to the following Equation:
d eff = 2 1 π A eff
where Aeff is the projected area of a droplet or plug. Consequently, the droplets can be automatically traced and the size of droplet can be computed with an adequate accuracy.

2.4. Computational Model

In present microfluidics systems, all 3D flow tends to be laminar (Re < 1). The nonlinear partial differential momentum Navier–Stokes equation and continuity equation that describes incompressible Newtonian fluid flowing in microchannel are written as follows:
ρ u t + ρ ( u ) u = [ P I + η ( u + ( u ) T ] + f
u = 0
where u is average velocity characteristic of the flow, t is the time, fluid density and dynamic viscosity are given by ρ and η, respectively, P is the pressure and f is the body force that acts on the entire element inside the continuum. The domain boundary of the continuous (∂Ω1) and dispersed phase (∂Ω2) were set up with laminar inflow conditions by defining the volumetric flow rates of continuous phase and dispersed phase (see Figure 2) [35]:
Ω 1 = { u x = u n = u o u y = 0 h Ω 1 u n d y = Q c
Ω 2 = { u x = 0 u y = u n = u o h Ω 2 u n d x = Q d
where n is unit vector that has a direction normal to the inlet boundaries, h is the depth of microchannel, Qc and Qd denote the flow rates of the continuous and dispersed phase flow rates, respectively. No-slip boundary condition was enforced at all wall boundaries. The domain boundary condition at the three outlets (∂Ω3) is set to a pressure with no viscous stress (see in Figure 2).
P = 0 Pa

3. Results and Discussion

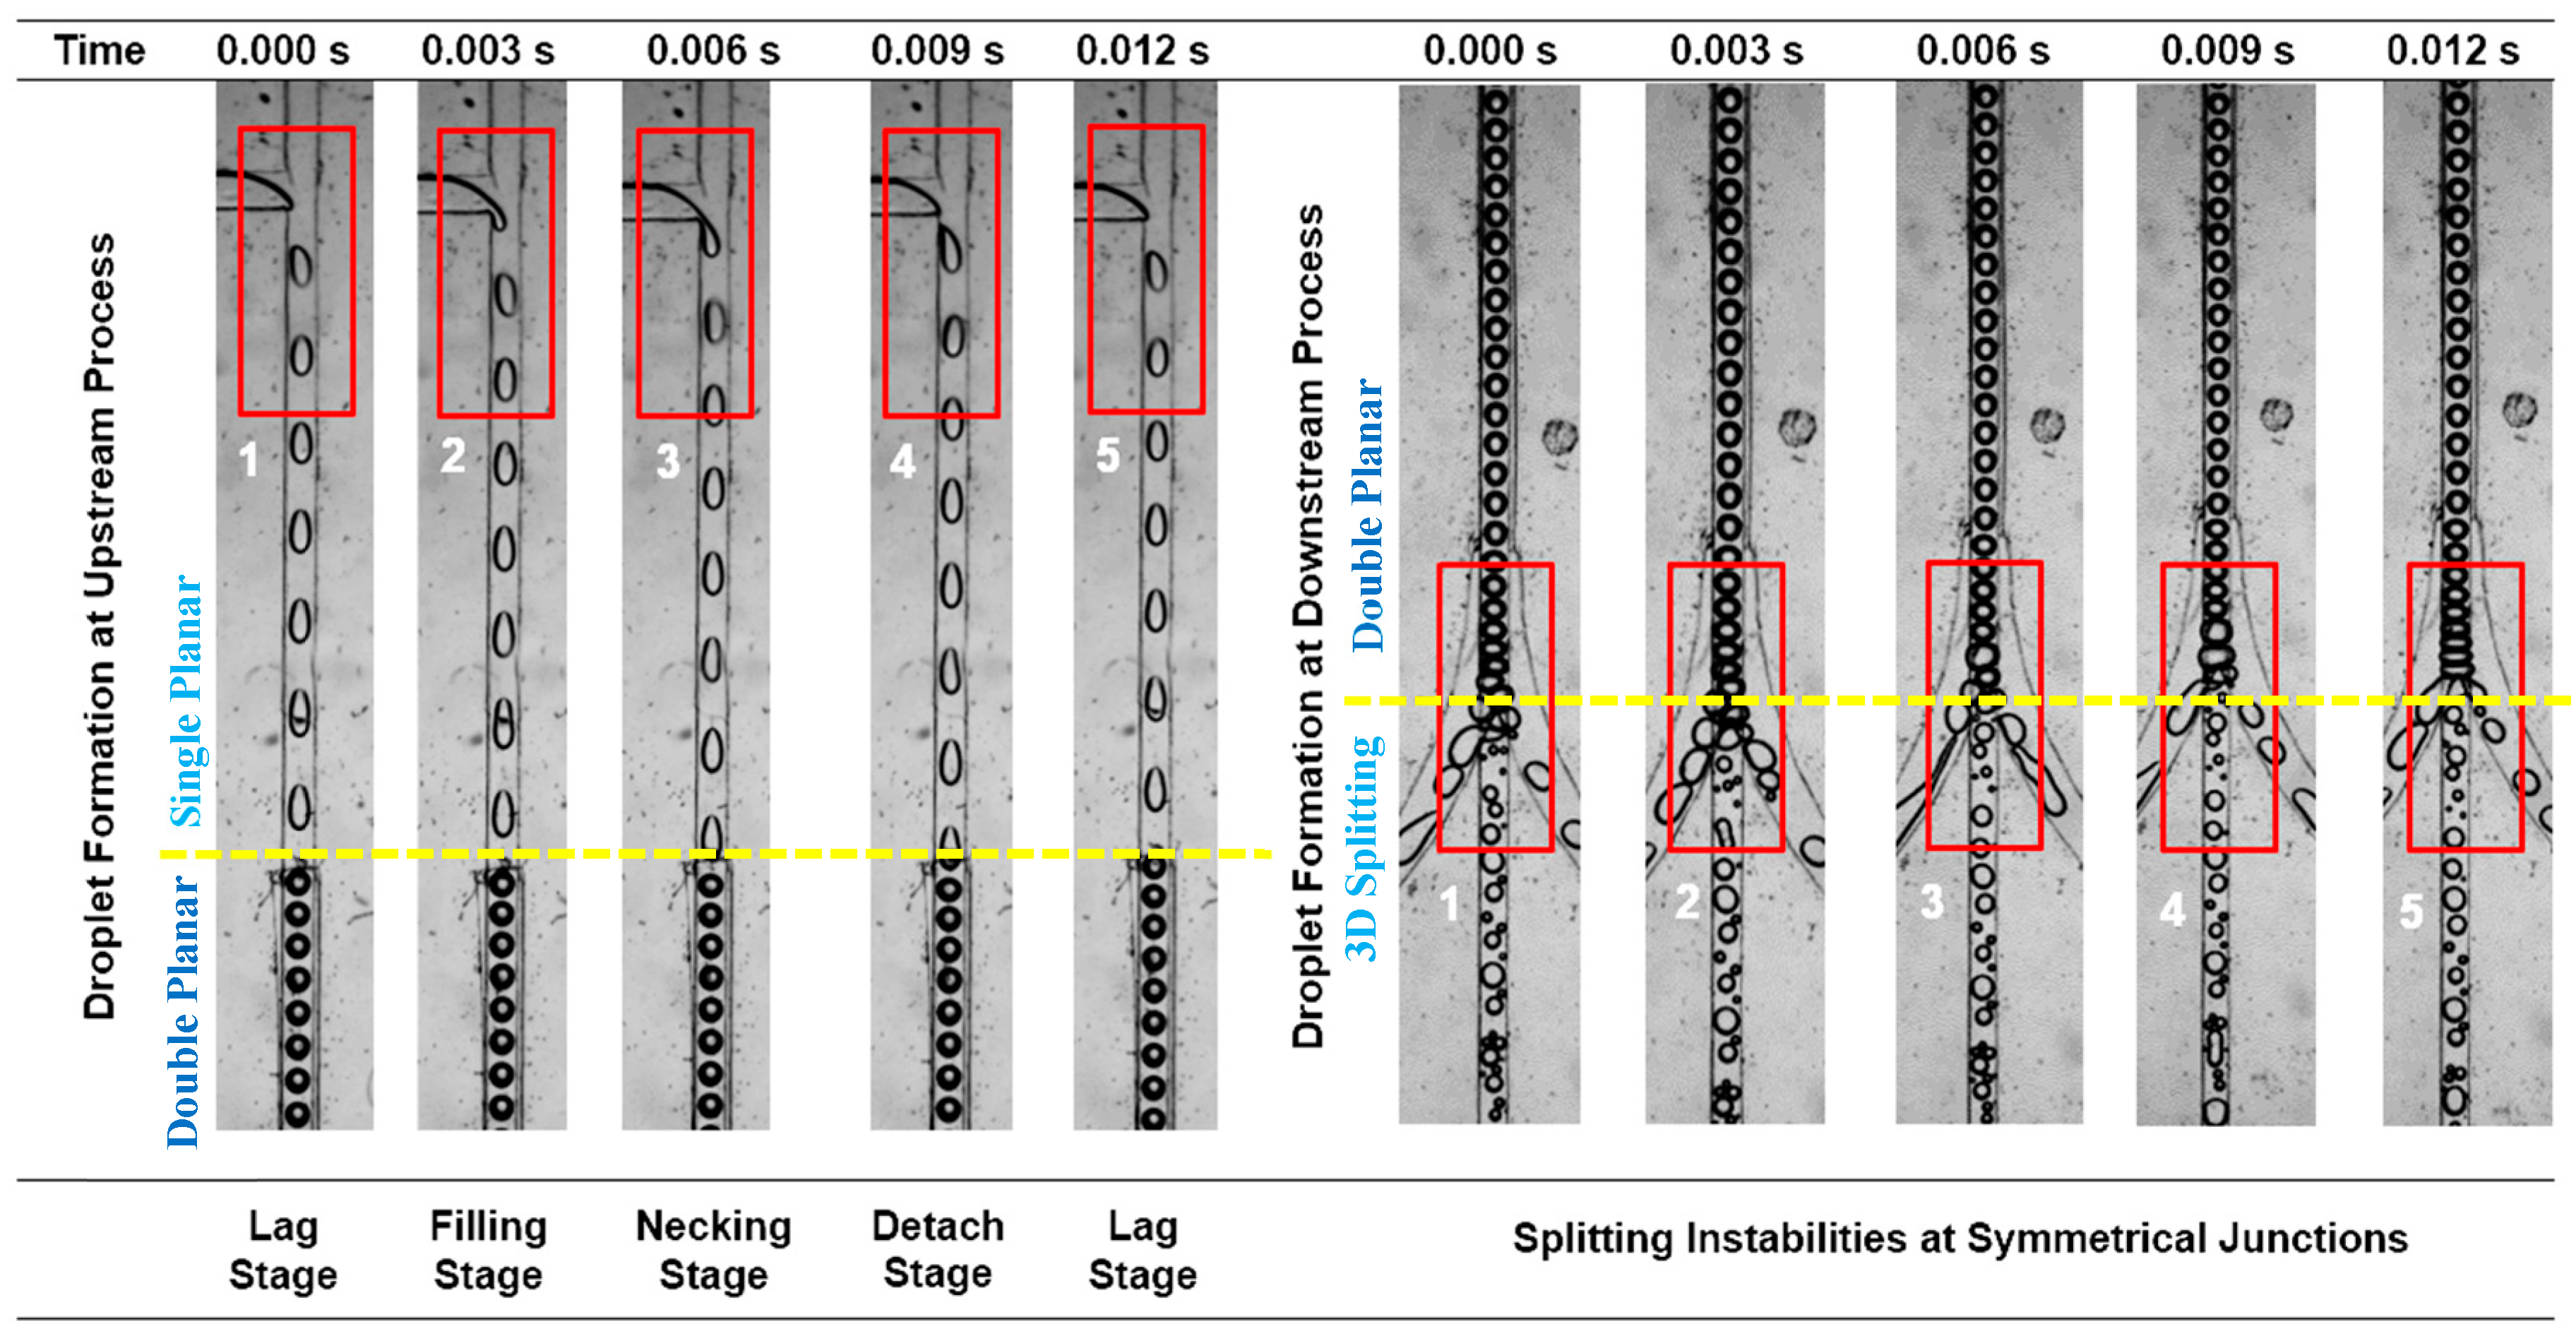
3.1. Dynamics of Droplet Translocation and Fission in Microchannel

Droplets are formed when the continuous phase and dispersed phase fluids contact at the T-junction. The fully detached droplets flow downstream in the main channel and the flows are directed towards the trifurcation fluid streams. A sudden change in the physical appearance of the droplets occurs at the middle of the channel between T-junction and trifurcation junction. This occurs at the point where double planar region begins with increased depth of the channel, resulting in droplets spanning the interface downwards to the extended depth while shrinking in width, which causes the droplet to transform from slug into spherical. At the bilayer splitting junctions, the splitting of carrier flow breaks mother droplets into daughter droplets and flows into three diversion channels. Figure 5 illustrates the droplet formation, merging and splitting phenomena in microchannels.
Droplet fission can be controllably affected by hydrodynamic stress and geometry mediated effect. When the two-phase fluids in the main channel flow toward trifurcating microchannels, the droplet is affected by the pressure and the shear strain arise from the flow. If the shear stress surpasses the interface tension, fission occurs [15,50]. At the splitting junctions, the relative sizes of daughter droplets depend on the symmetry of the flow. In general, if the flow is symmetric in a single planar microchannel, equal forces will be exerted onto the halves of the mother droplets, resulting in the creation of equal sized daughter droplets. As elucidated in Figure 5, although the microstructure of the splitting channels is arranged symmetrically, the shape and area of the cross section of the flow was changed along the stream at the double planar micro-channels. This may lead to nonuniform flow due to the unequal distribution of fluid flow in networks of channels and shear rate at different points in a flowing fluid.
As illustrated in Figure 6 and Figure 7, greater flow speed can be expected in bottom layer (Umax ~0.0153 m/s) of the bifurcation than the flow speed at top layer (Umax ~0.01334 m/s), and the high speed will of necessity when scaling to smaller dimensions of microchannel for asymmetrical junctions (Umax ~0.02932 m/s). This leads to higher shear rate distribution, as seen in Figure 8. Additionally, the shear rate distribution contours at various cross-sectional area indicated that the higher shear rate distributions in vicinity of wall boundary, while the region experiencing the lower shear stress near the center of microchannel. The inconsistent splitting can be influenced by shear rate for different droplet sizes and capillary numbers (Ca = µcUc/σ, where µc is dynamic viscosity of continuous phase, Uc is continuous phase’s velocity, and σ is interfacial tension between the two immiscible fluids (0.02074 N/m)).
When droplet emerges and flows downstream, it can be trisected into three unequal portions due to the uneven distribution of shear rate across the microchannel cross-section [46]. Apart from that, droplet collision event was also observed when the droplets come into contact upon arrival at the splitting junctions. The coalescence occurs spontaneously when the droplets meet, merging to form single larger size of droplets. This could also be one of the contributing factors of forming unequal portions of daughter droplets due to highly unsteady hydrodynamic resistances of the three paths. Additionally, the flow disturbances created by the presence of the obstacles may cause flow deflections in order to affect the even distribution of droplet sizes. The droplets at the splitting junction experience fluctuations in surface tension force as the surface curvature of the droplet was deformed and changed during distribution of flow, which leads to destabilization of the oil-water interface. As a result, emulsions of high polydispersity were formed at the downstream of three outlet channels. This phenomenon can be observed in all subsequent parametric studies.

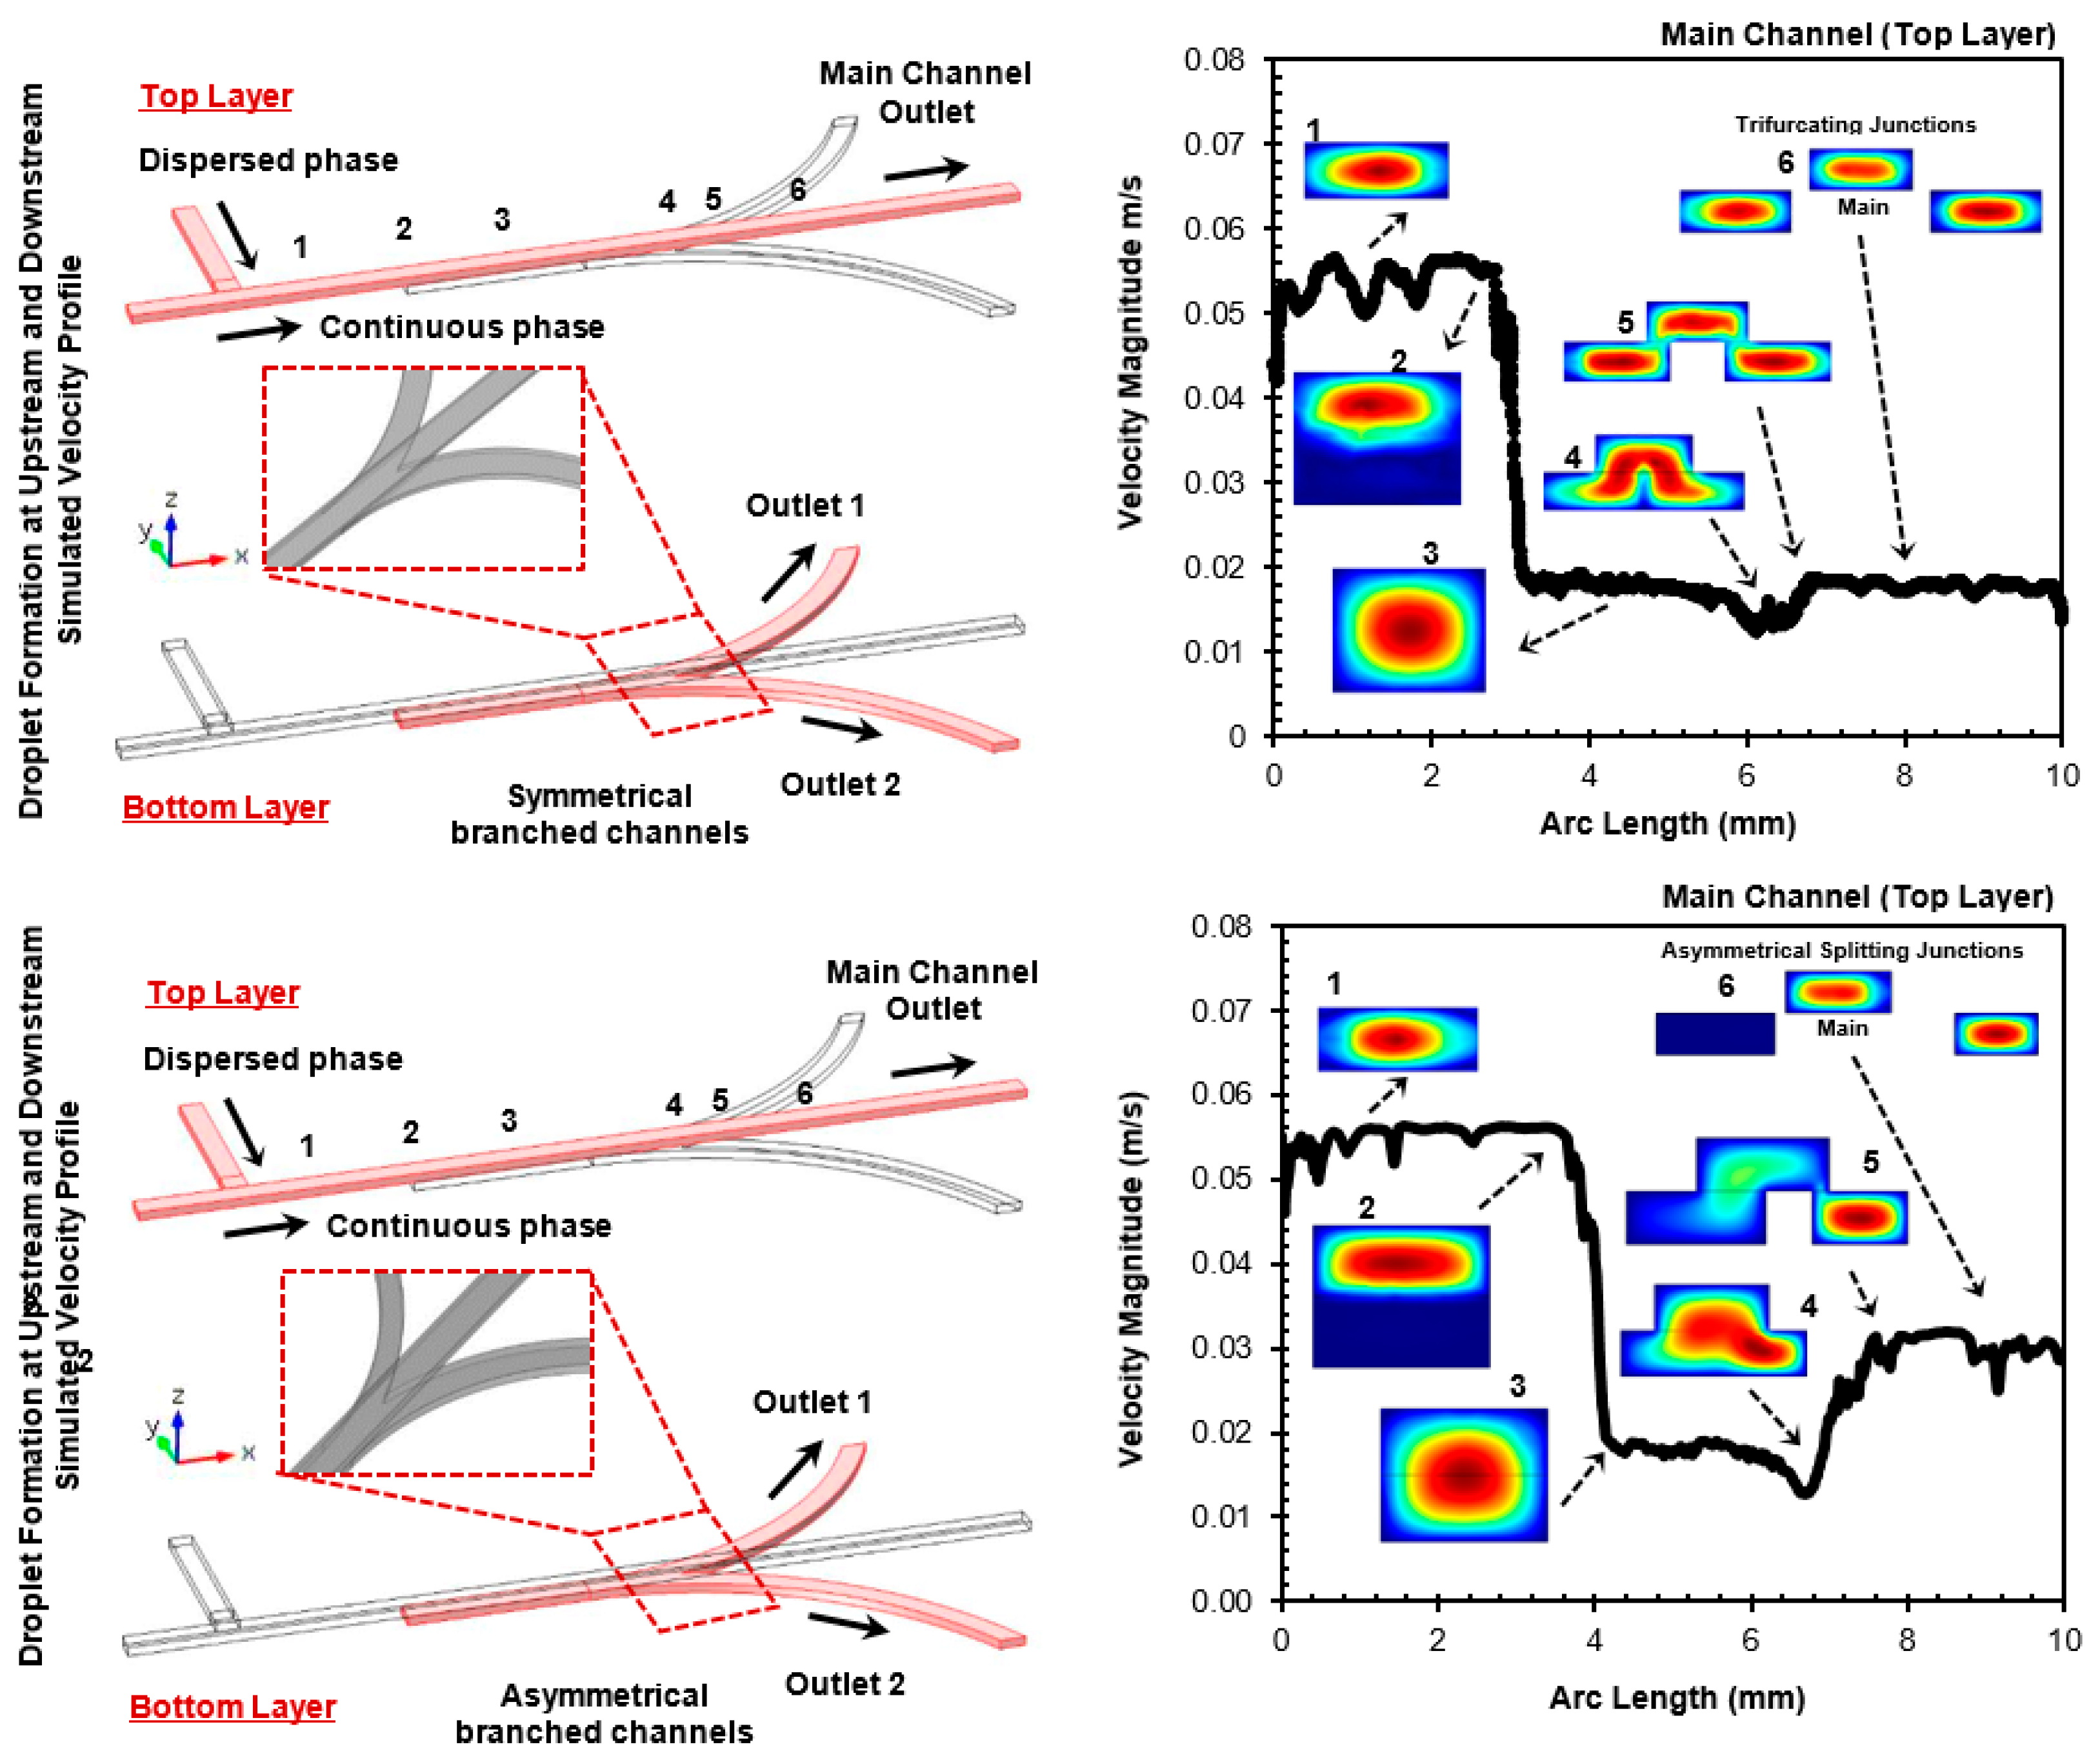
3.2. Effect of Qc on Droplet Fission at Symmetrical Bifurcating Junction

The first parametric study was carried out by altering the Qc (0.5 to 2.5 mL/h) in a symmetrical splitting junction, in which both bifurcating junctions have the similar dimension at fixed Qd (1 mL/h). Figure 9 illustrates the distribution of droplet size in each region of interest in the microchannel. As can be seen in Figure 9, the size of droplets decreases in each of the region of interest as the flow rate of continuous phase increases. Formation of droplets is the result of fluid shear stress acting on the dispersed phase flow by the continuous phase fluid. As Qc increases, stronger shear stress exerted by continuous phase acts on the dispersed phase fluid that penetrates the continuous phase. This results in necking occurs on the interface of the dispersed phase fluid and eventually snapped into droplet [33]. Moreover, fluctuation in droplet size distribution in splitting junction 2 and splitting junction 3 can be observed although a decline in trend is observed. This is a consequence of nonuniform flow of droplet after the splitting at the bifurcating junction. Figure 10 illustrates droplet collision and merging phenomena at different Q. Additionally, the size distribution of droplets in each region of interest for each flow rate of continuous phase is shown in Figure 11.
In T-junction, a uniform distribution of droplet size was observed regardless of the increase in the flow rate of continuous phase. This is mainly due to the steady flow in the confined T-junction. The constant velocity and flow rate of the moving droplet to flow in a steady manner. In contrast, the distribution downstream of droplet size in the region of interest shows significant fluctuation as portrayed in Figure 11 in a wavy manner. As the droplet flow towards the branching channels of uniform depth, the confined droplets are appearing fall in slow motion because the droplets are found to collide and coalesce at 3D constriction (see Figure 10). In microscopic studies, when the two droplets touched, an infinitesimal liquid bridge connecting between them forms and rapidly grows as the two drops merge into one. This dynamic is mainly driven by the Laplace pressure due to high curvature of the liquid interface at the contact point [51]. Additionally, this may also due to the unsteady hydrodynamic force acting on the droplet interface after splitting at the bifurcating junction. As the droplets approach the bifurcated splitting junctions, the pressure drop occurs within the droplet and subsequently induce energy losses due to sudden change of flow directions. Therefore, the flow of droplets become nonuniform and unsteady.

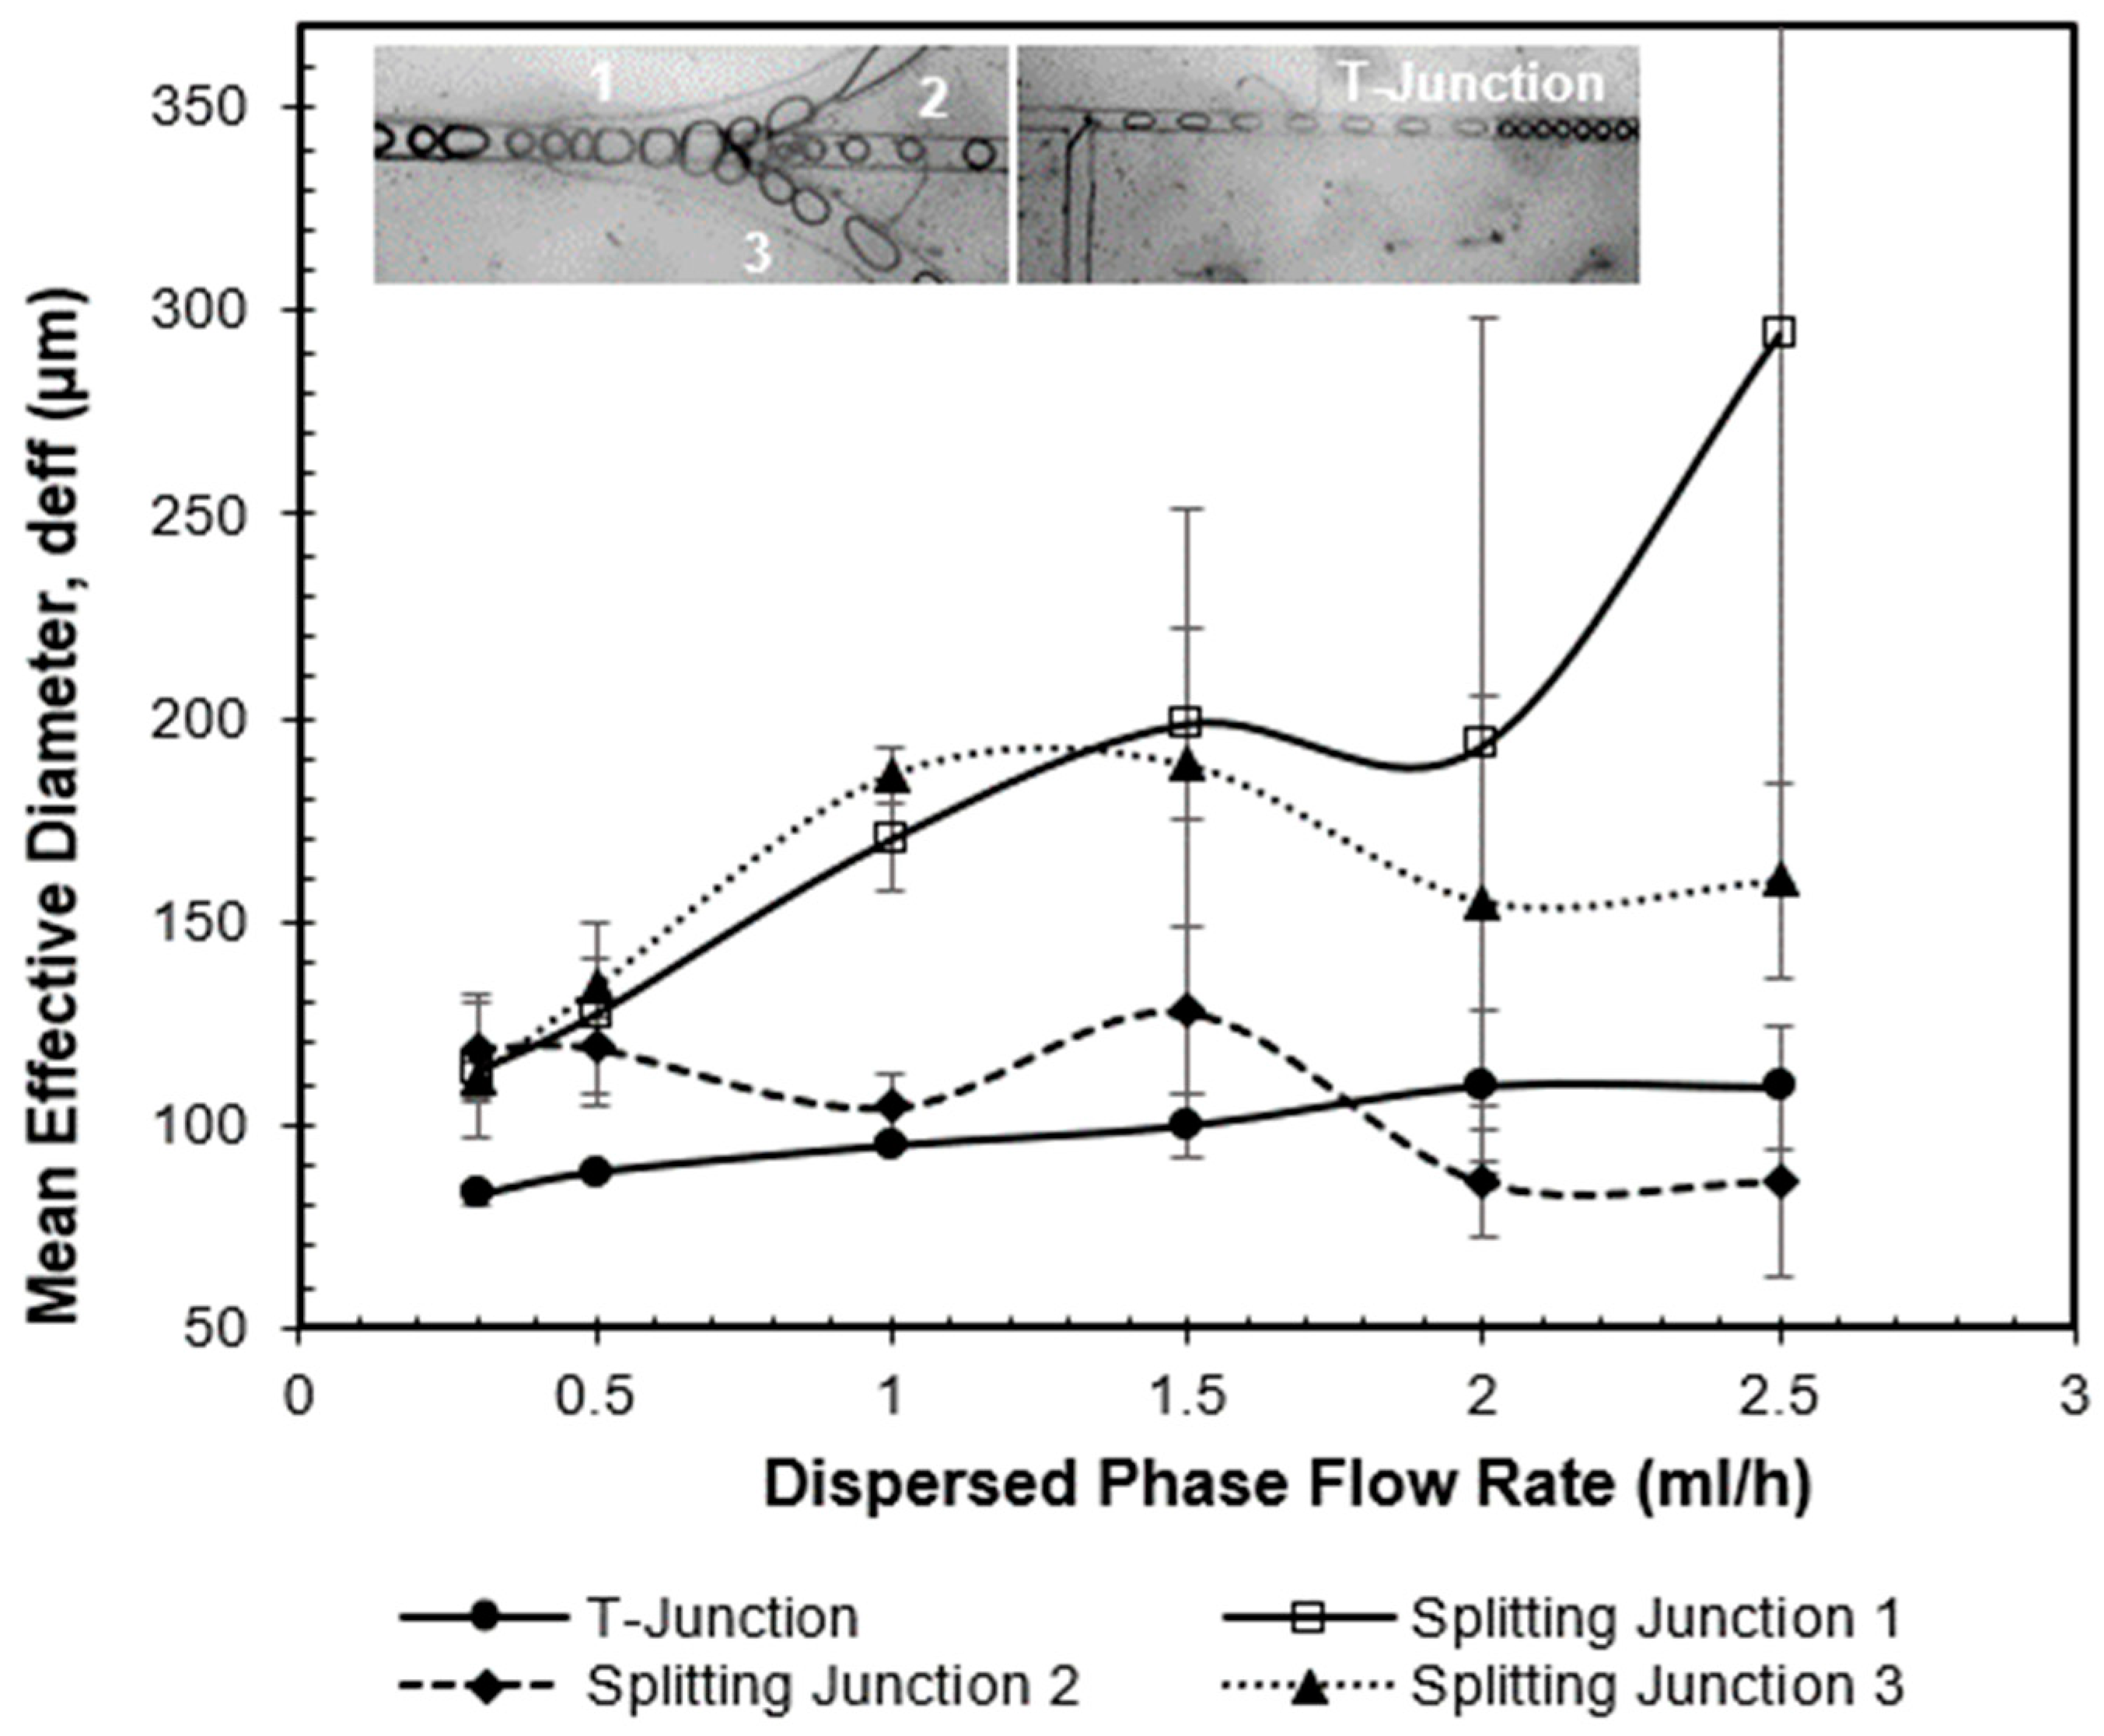
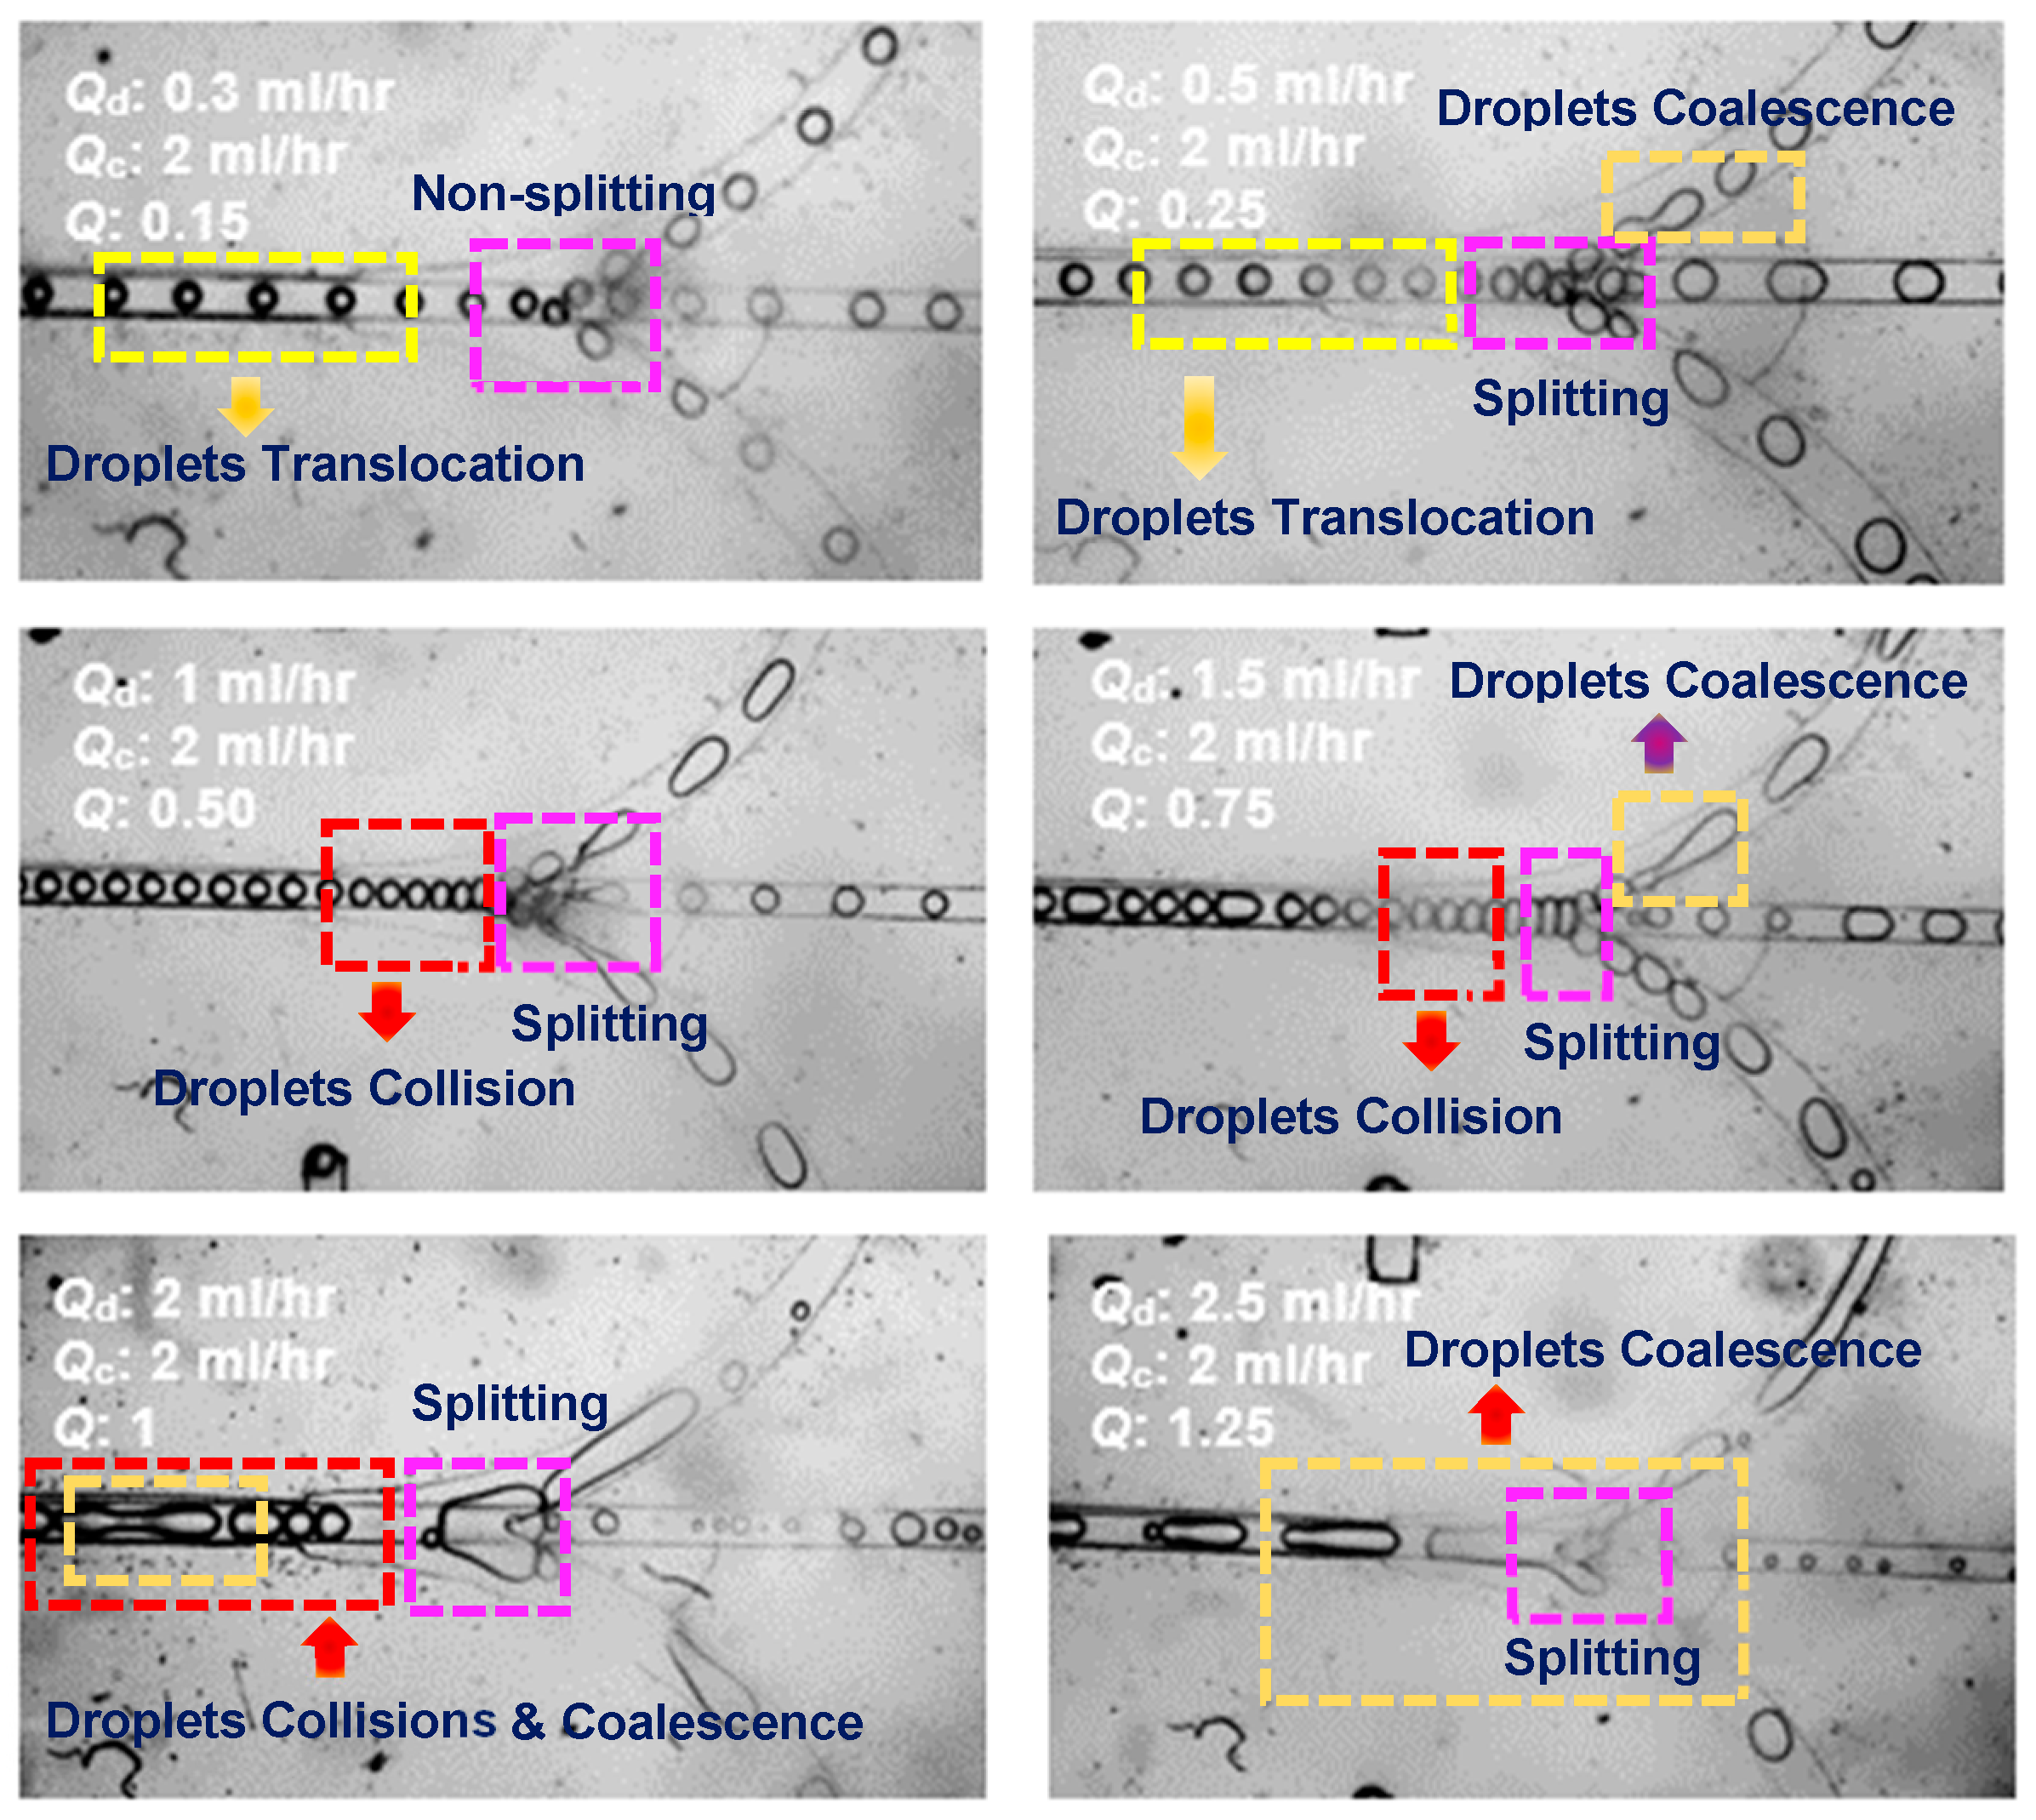
3.3. Effect of Qd on Droplet Fission at Symmetrical Bifurcating Junction

At fixed Qc (2 mL/h), droplet formation was investigated by varying the flow rate of the dispersed phase. The droplet size distribution over the range of Qd from 0.3 mL/h to 2.5 mL/h is illustrated in Figure 12. The droplets in the T-junction gradually increase as the flow rate of dispersed phase is increased as opposed to the effect of Qc. As elucidated in Figure 12, increasing the flow rate of dispersed phase results in a longer shear residence time. For larger Qd, the dispersed phase drop continues to grow, and the droplet detachment process is extended under the constant shear forces induced by continuous phase flow. Subsequently, droplet continues necking to the flow and eventually snaps into droplets [19,33]. Since the Qc was fixed, a longer time is required for the shear stress to create necking on the dispersed phase fluid as the flow rate increases, therefore resulting in increase in emerging of droplet volume. However, the droplet size in the splitting junctions downstream shows inconsistent distribution, especially the drastic increase in splitting junction 1. The distribution of droplet sizes in all three splitting junctions at different Qd is illustrated in Figure S1 (see Supplementary Files).
The generated droplet size at the corner of T-junction are evenly distributed due to the steady flow in the T-junction. It allows droplets to travel at constant velocity at low Qd. For larger Qd, the distribution of droplet size becomes less consistent due to coalescence as indicated by some extremely large droplet which causes a substantial increase in droplet size. At higher flow rates, greater size and volume of droplets are formed because shear stress is reduced and becomes less dominate than lower range of Qd [52]. On top of that, higher frequency of droplet production is achieved at higher Qd [35]. Thus, the high production rate causes a reduction in gap between each droplet, allowing them to collide between each other and possibly merge into a larger droplet as they travel downstream [53]. Furthermore, in microfluidics, the level of confinement could provide compulsive droplet collisions, which could develop to emulate the droplet coalescence process in the early stage before the droplet fission event.
Moreover, the inconsistency of the overall droplet size distribution in the splitting junctions downstream was also observed (see Figure S1). At larger Qd, the inconsistency in the droplet size distribution is more significant than the distribution in lower flow rate. As droplets travel along the channel towards bifurcated junction, droplet fission occurs at the bifurcated junctions. This phenomenon occurs due to the hydrodynamic force acting on droplets by the continuous phase fluid as they approach the bifurcation with the aid of bifurcation design [54].
When Qd << Qc, the droplets undergo passive fission under the influence of shearing force induced by the continuous phase flow [55]. Therefore, the larger shear stress is acting on the droplet interface and subsequently splitting the parent drops into daughter droplets with the aid of the geometrical effects and evenly distribute them into each of the junction. In contrast, droplets are split into larger and uneven daughter droplets by the continuous phase fluid in the case of large Qd as the degree of confinement decreases at the splitting joint [36]. As the droplets are pushed against the branching point, the droplets are split by shear stress induced at the multifurcated junctions. Additionally, the number of droplets rises with increasing Qd and generated droplets are traveling vigorously downstream before entering the bifurcation junction, allowing the interface of droplets to interact with each other which results in merging of droplets into a long stream of fluid. Thus, in the case of high Qd, droplet coalescence occurs, and droplet fission is induced by the junction geometry, the daughter droplets are distributed into the bifurcated channels [54], as shown in Figure 13. Moreover, it is also noticed that majority portion of the droplets are distributed into splitting junction 1 and 3 at higher Qd, resulting in decrease in the droplet size distributed into splitting junction 2. This phenomenon can be similarly observed in the application of fluidic oscillator governed by the Coanda effect [56,57,58], which refers to the tendency of a fluid jet to adhere and flow along a curved surface [59]. Higher pressure drops caused by the increase of Qd enhances the Coanda effect [60]. Thus, greater portion of mother droplet is distributed into curved splitting junction 1 and 3, resulting in significantly larger droplet size at higher Qd.
In order to evaluate the droplets size distribution, a coefficient of variation (CV%), which is a measure of the statistical dispersion of sets of data points around the mean, is quantified. Values for analytical CV% given in Table 1 show that, for most of the measured effective droplet diameter, this source of variation indicate a CV% of 2% or less for most conditions at upstream of the T-junction microchannels. For a constant Qc of 2 mL/h, the presence of highly polydisperse system (CV% > 20%) is found at off-axis branched channels. This is because the emulsion is thermodynamically unstable when the droplets coalesce to form bigger droplets when larger volumes of the dispersed phase fluid enter the main channel, in which the phenomenon can be similarly observed in low Qc (<1.00 mL/h) conditions. On top of that, this does not help facilitate the shear flow generation of monodispersed droplets in microfluidic devices.
Figure 14 shows the distribution of droplet size on the effect of flow rate ratio (Q) and capillary number (Ca) at symmetrical bifurcation junction. Low polydispersity in the distribution of droplet size was found at higher capillary number system as indicated in Figure 14a. The flow in high Ca system is dominated by the effect of viscous force due to higher Qc. Therefore, mother droplets were split at the bifurcation point by the increased shear stress of the continuous phase fluid and resulted in a more uniform droplet size. This can be seen similarly in Figure 14b where low polydispersity distribution was found in low Q systems, in which the strengthened flow of Qc resulted in a more uniform distribution of droplet size. On the other hand, high polydispersity of size distribution was observed in existing systems with Ca less than 0.065. The droplets formed under these flow conditions have higher tendency to collide and coalesce with one another to form a long stream of droplet (see Figure 13). The fluid flow and splitting were dominated by the effect of surface tension, in which the resulting shear stress from low Qc is ineffective in evenly splitting the large mother droplet. This can be similarly observed in systems with high Q of 0.5 and above as illustrated in Figure 14b. Thus, the current system performs well on uniform splitting at low flow rate ratios (Q < 0.4) and higher Ca (Ca > 0.075). Additionally, a lower range of Q can be further examined by controlling flow rates down to the microliter per hour range (<300 µL/h for both Qc and Qd).

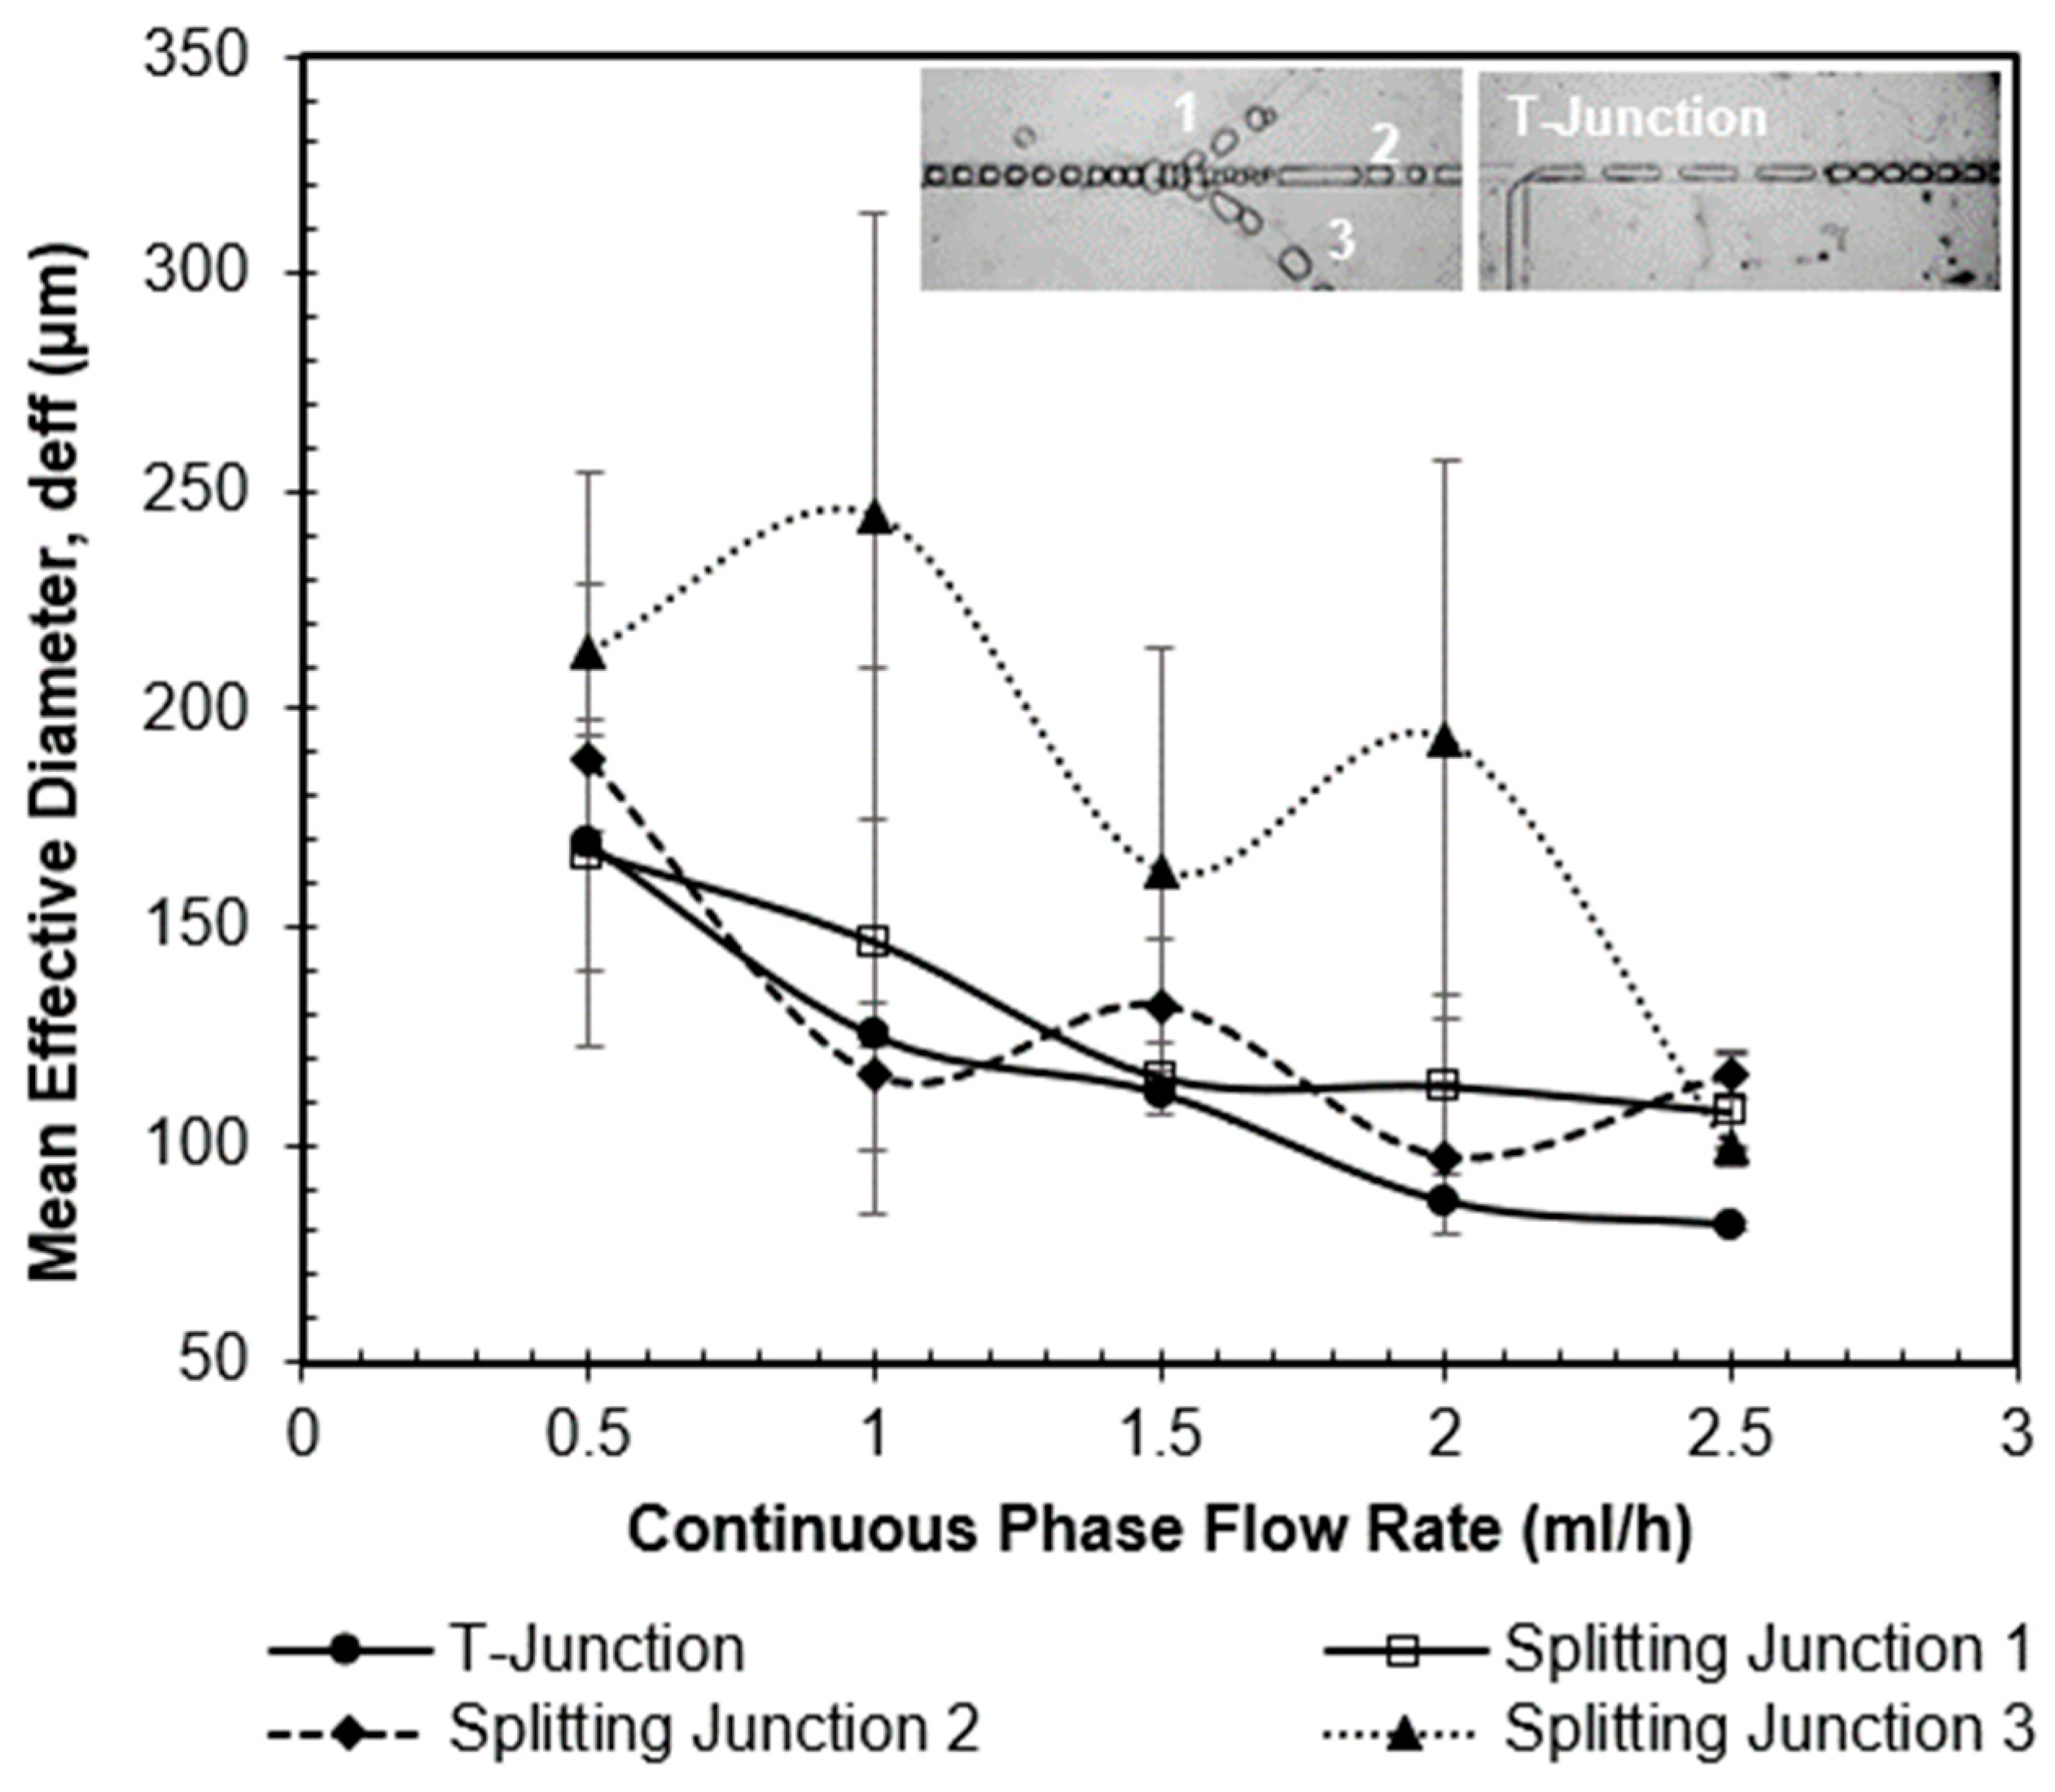
3.4. Effect of Qc on Droplet Fission at Asymmetrical Bifurcating Junction

The behavior of droplet fission was also investigated in an asymmetrical bifurcating junction where the distribution of daughter droplet into the bifurcating junction is uneven due to uneven width of channel dimension. The overall droplet size is illustrated in Figure 15, in which a decrease in droplet size profile is observed in the T-junction similar to the effect of continuous phase in symmetrical bifurcating junction earlier. As the Qc increases, the continuous phase fluid tends to split the dispersed phase fluid into a smaller size droplet due to greater shear stress acting on the interface of dispersed phase fluid and the right-angle geometry of T-junction [31]. Similar observation is found in the previous section. Thus, at higher Qc, greater shear stress caused by the continuous phase breaks the dispersed phase fluid that penetrates the bulk phase into smaller volumes and sizes, which results in a reduction in droplet size profile. Distribution of droplet size in each of the region of interest for each flow rate of continuous phase is shown in Figure S2 (see Supplementary Files).
Likewise, the size of droplets in the T-junction shows consistency throughout the increase in Qc. The steady flow of fluid in the T-junction allows droplet to move at desired constant flow rate and velocity, thus resulting in consistent formation of droplets in a uniform distribution of size. Moreover, droplet size consistency was also investigated in the splitting junction 2 with slight discrepancy, where the discrepancy is observed to be less significant at higher flow rate. This is due to the steady droplet translocation in smaller sizes from the upstream. When approaching the bifurcation joint, the droplets tend to coalesce into a larger droplet at lower Qc and the coalesced drops were split at bifurcating junctions, leaving a small portion of the mother droplet to be split and enter the downstream of the main channel in splitting junction 2, which results in a rather consistent in droplet size.
In contrast, splitting junction 1 and 3 show greater inconsistency in droplet size distribution, notably at the lower flow rate of continuous phase. At lower Qc, the droplets formed at the T-junction is observed to be larger and sometimes merged due to interaction between the interfaces. Therefore, the droplets become greater in volume and size and split into splitting junction 1 and 3 in a larger size than splitting junction 2 due to the effect of unsteady hydrodynamic force of the droplet acting on the bifurcation geometry. Coanda effect is also observed where most of the mother droplets are distributed into splitting junction 1 and 3, notably at low Qc. However, in higher continuous phase flow rate, the discrepancy in droplet size in the bifurcating junction becomes less significant due to smaller droplet formed at the T-junction. Thus, the steady flow of mother droplets results in a more even splitting, producing smaller daughter droplets in uniform size distribution. As observed from Figure S2, the size of droplets in splitting junction 3 are much larger than the droplets in splitting junction 1 even at higher continuous phase flow rate. This is because of a lower pressure drop in a wider channel that results in more droplets going into it. Due to the interaction between the droplet interfaces that contact with each other, droplets are coalesced prior to splitting. Figure 16 illustrates the droplet collision and coalesces at different flow rate ratios.

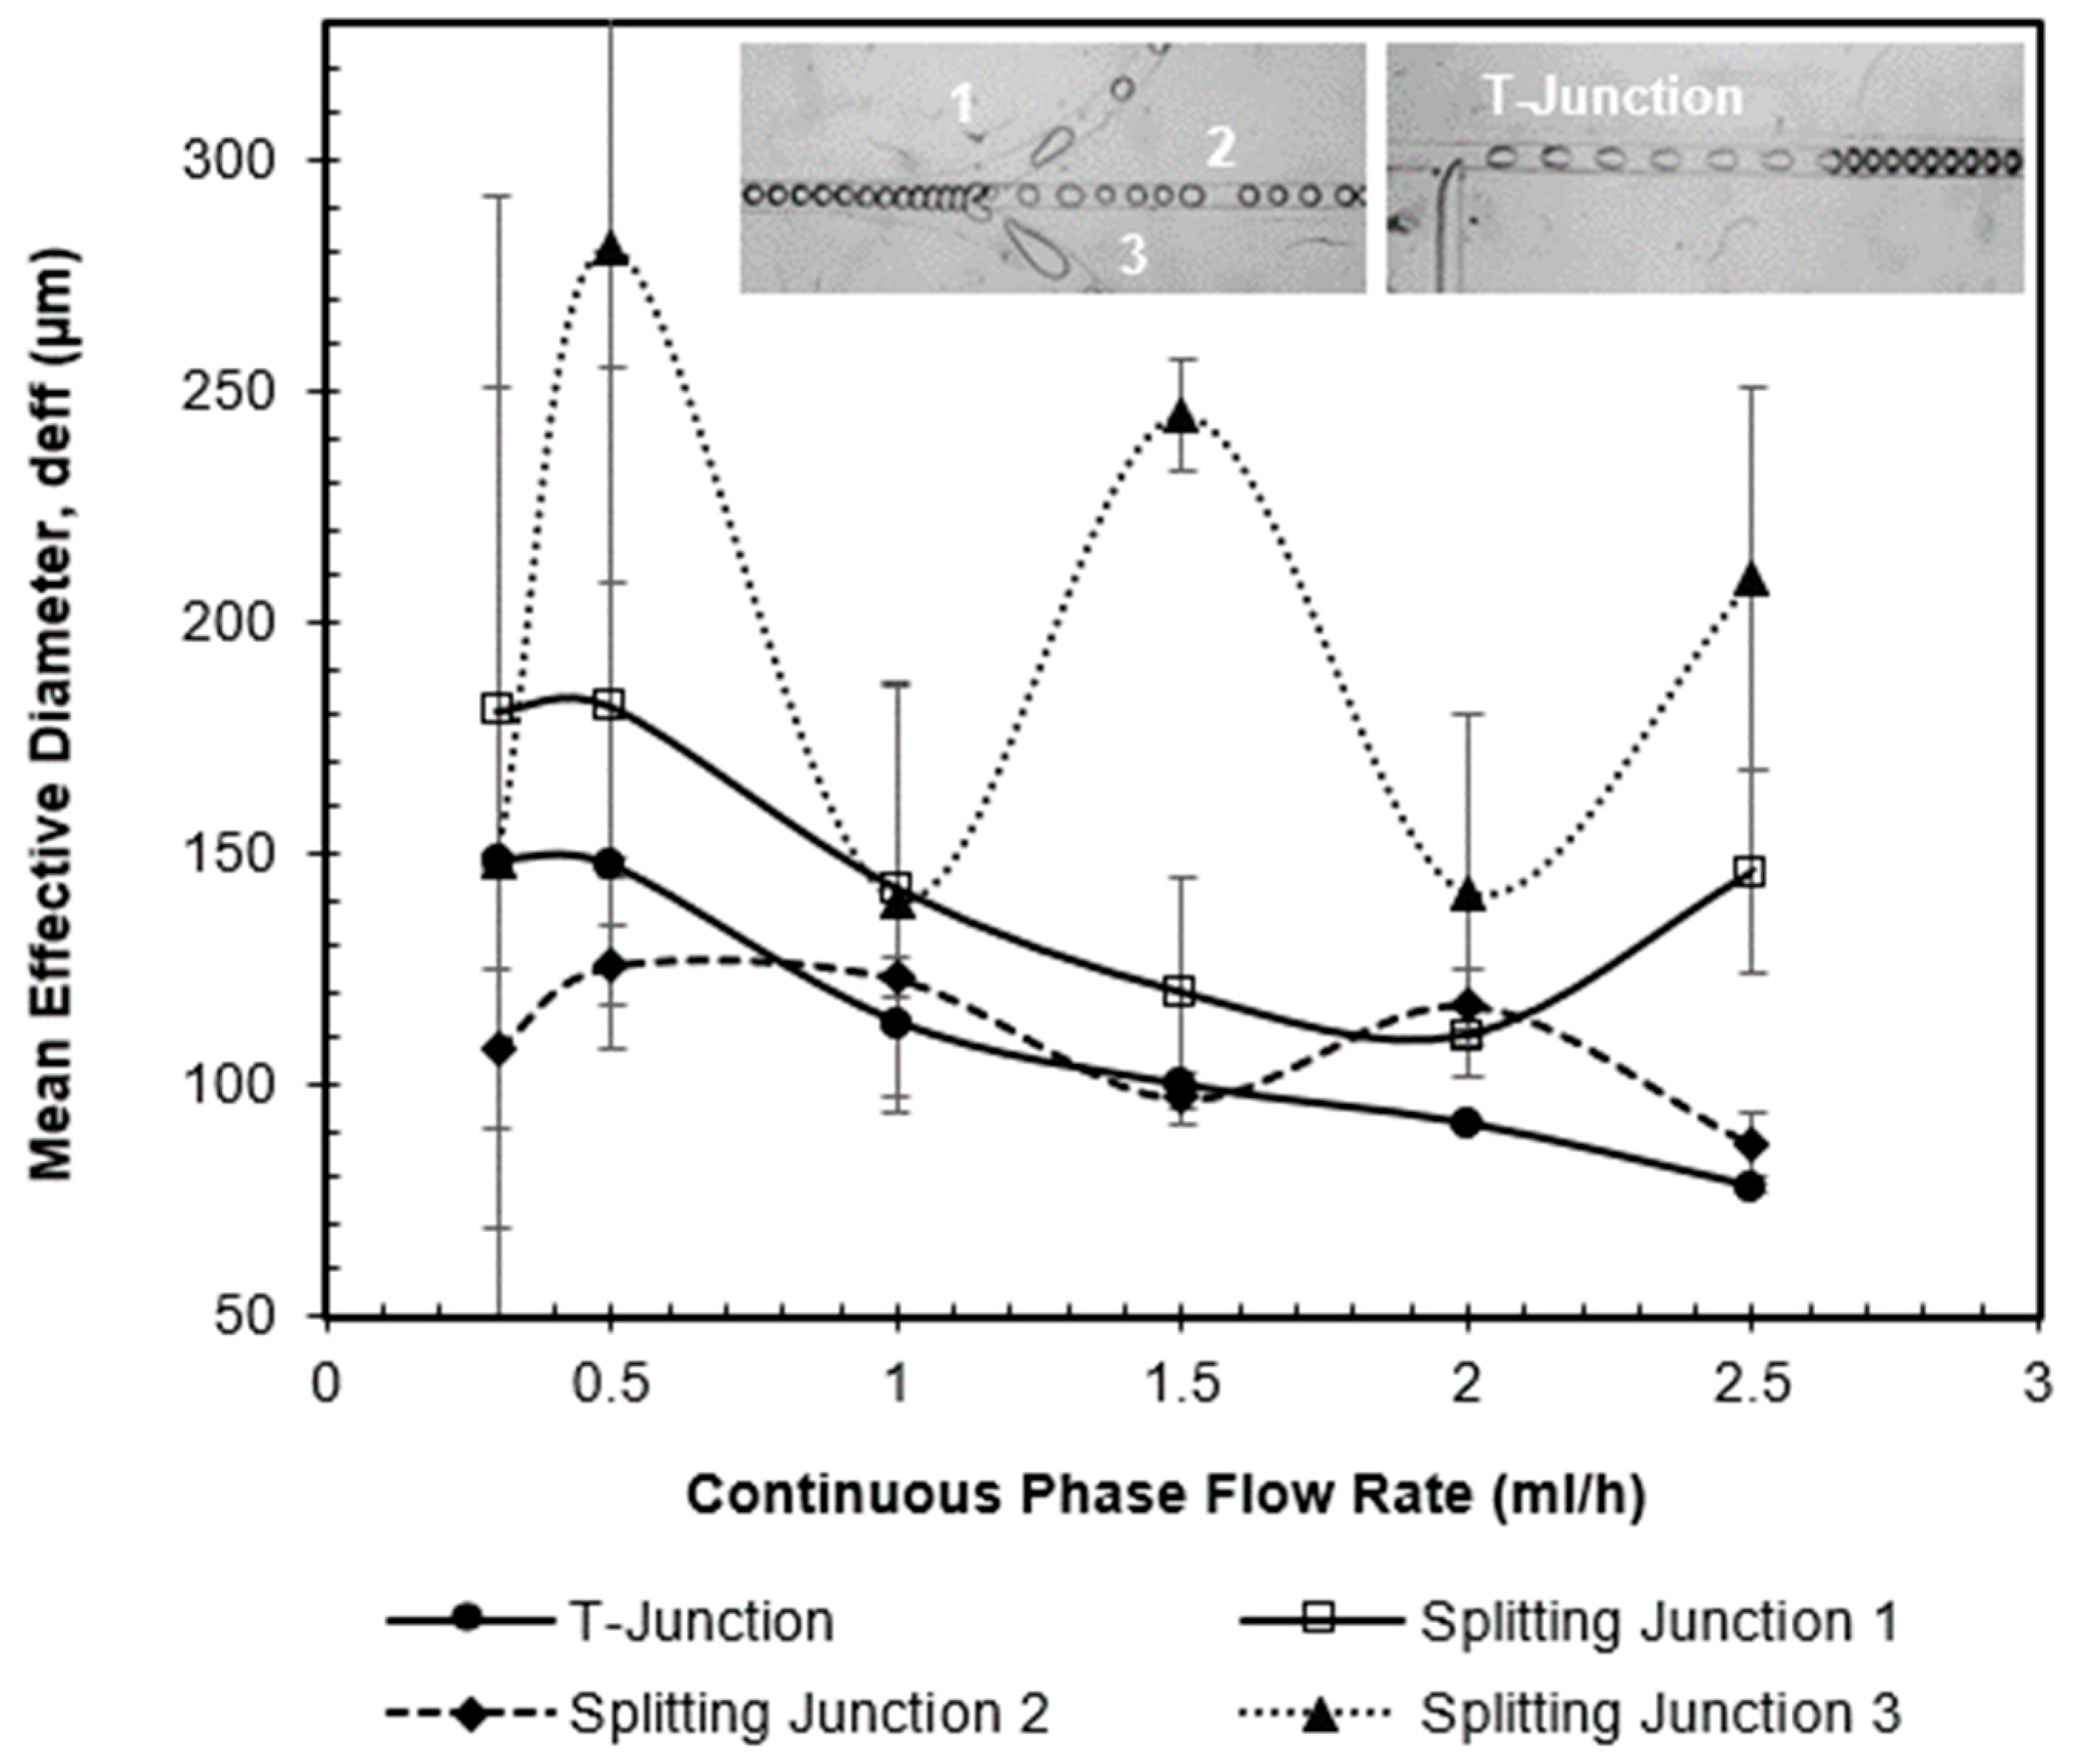
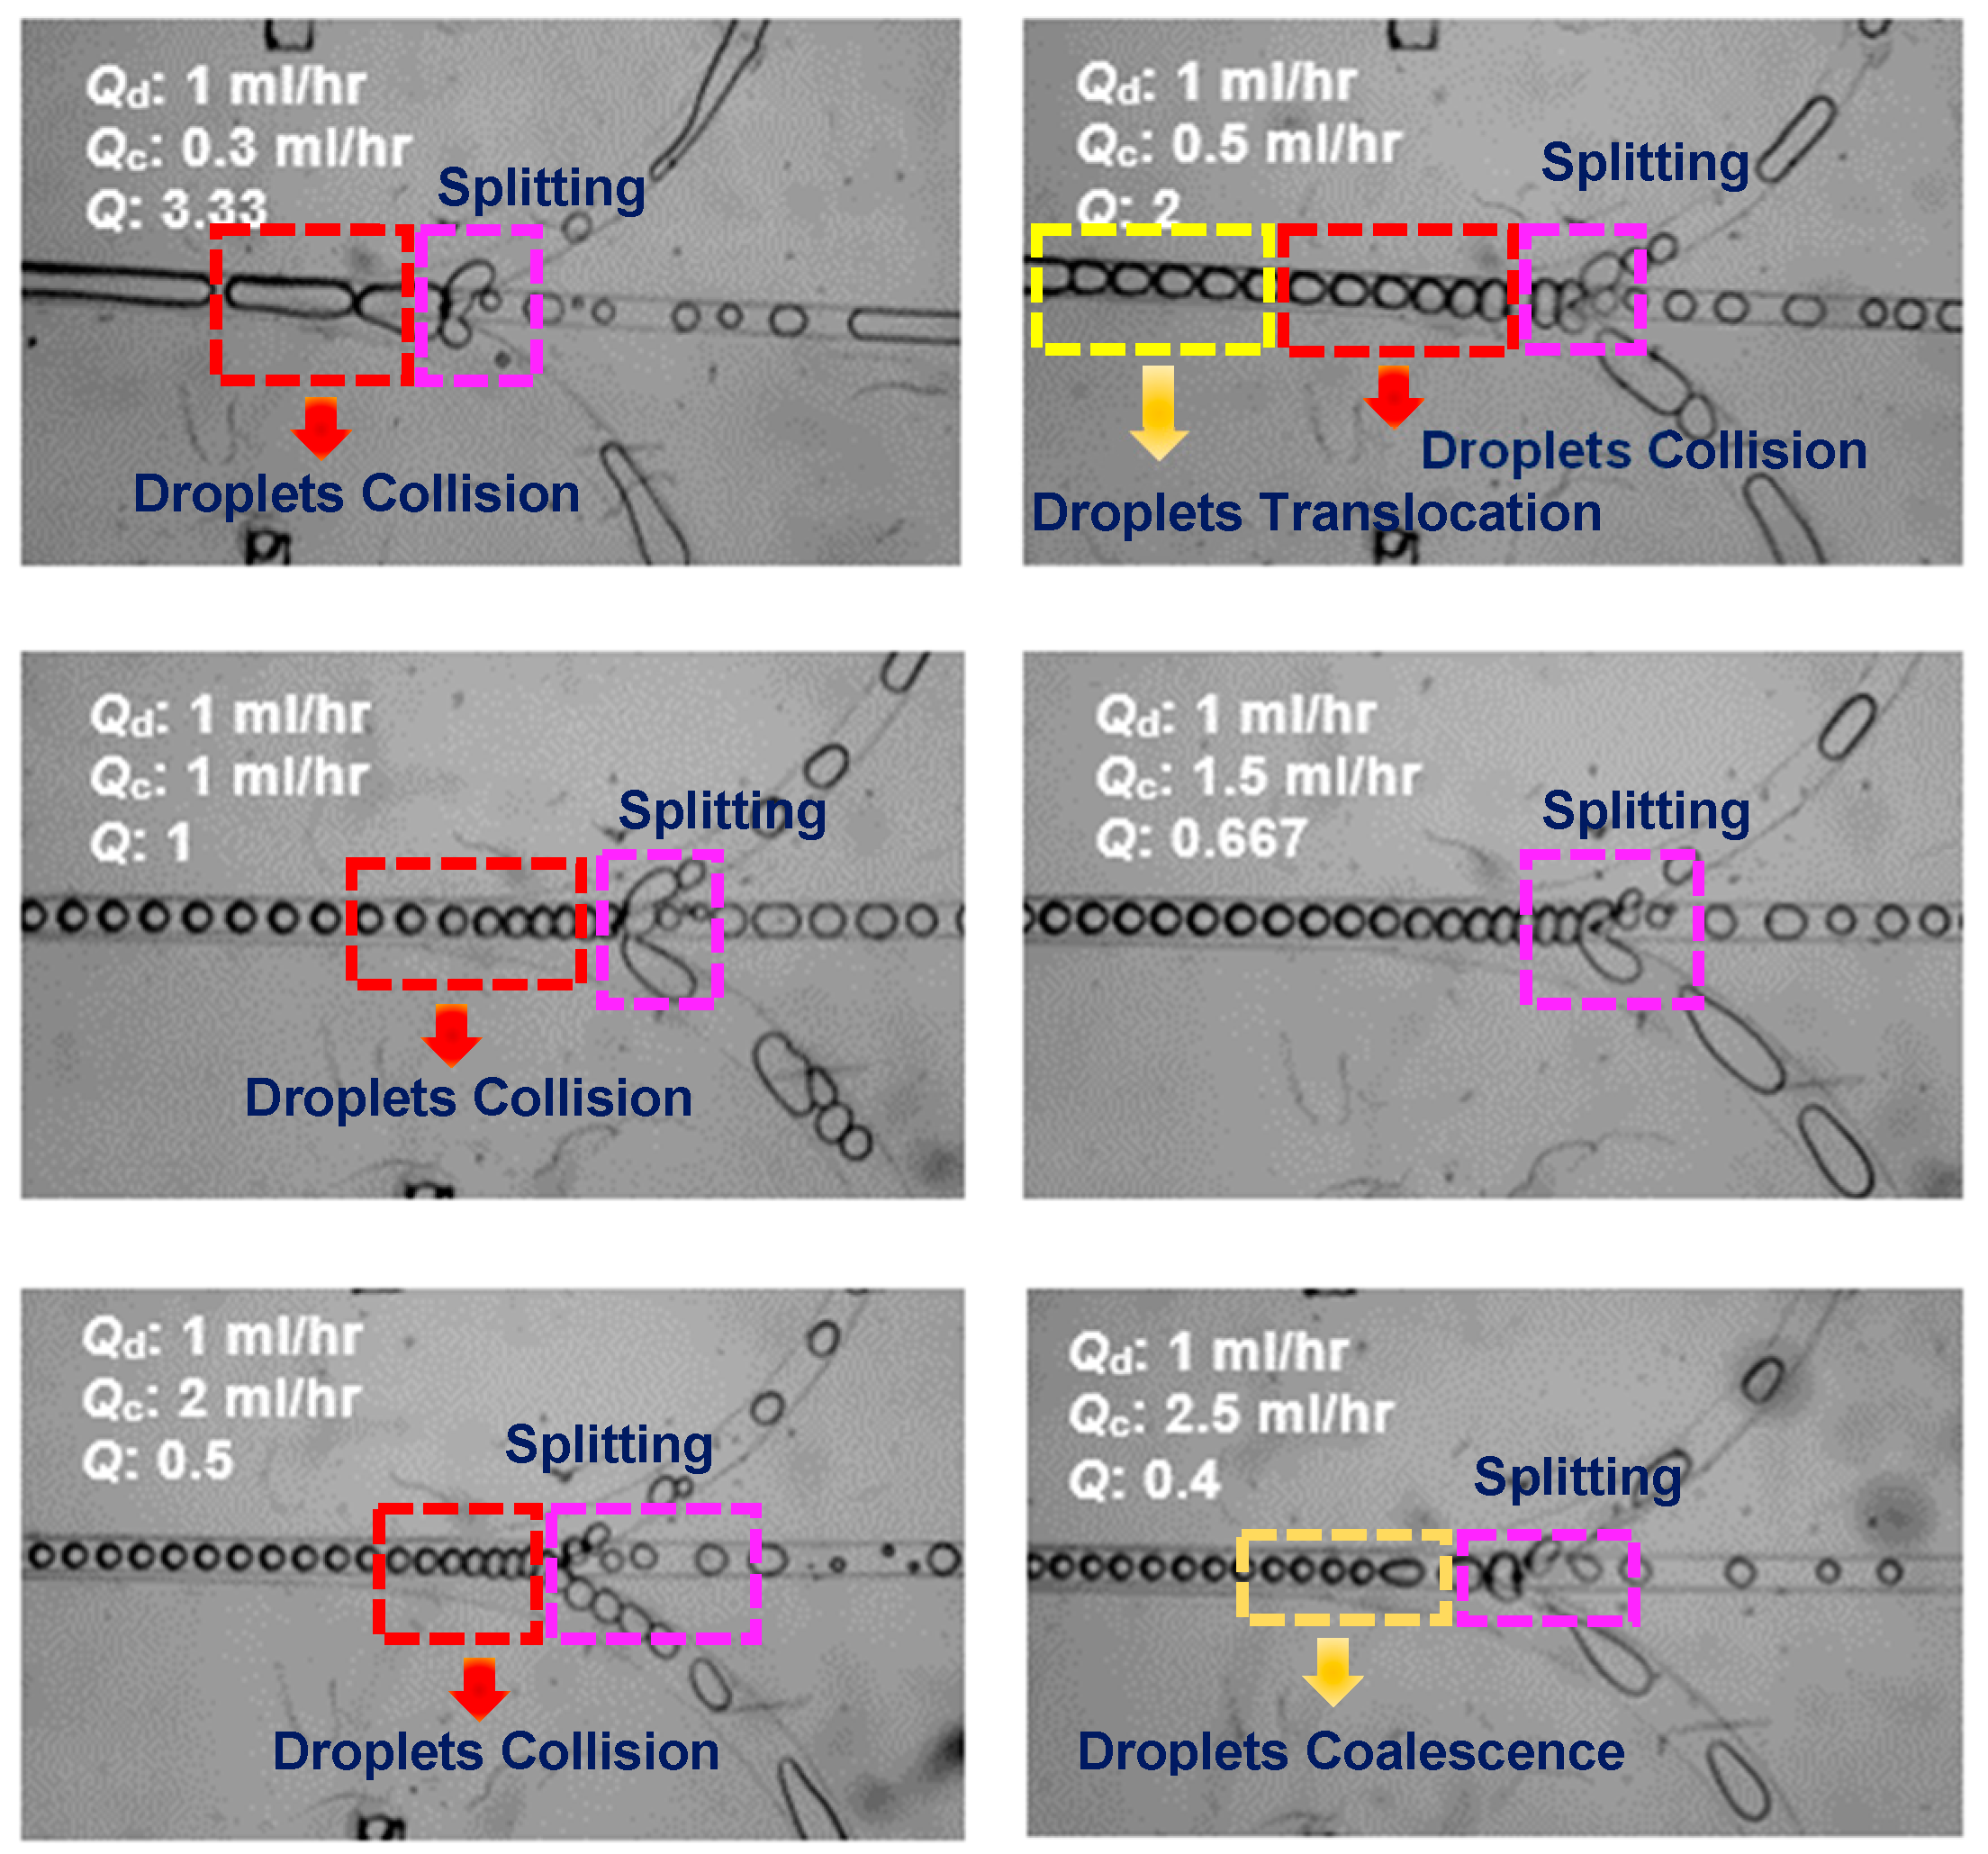
3.5. Effect of Qd on Droplet Fission at Asymmetrical Bifurcating Junction

The asymmetrical bifurcating junction was also designed for evaluating the effect of Qd on droplet generation. Figure 17 shows the average size of droplets at each desired flow rates. As can be seen in Figure 17, the average size of droplets in the T-junction gradually increases as opposed to the study of the effect of Qc. However, the inconsistency in the droplet size distribution is also found for the downstream splitting junctions. Similarly, the droplets in the T-junction show uniform in size and nearly monodispersed for all Qd as depicted in Figure S3 (see supplementary files). A similar observation is investigated due to the steady flow in T-junction at respective flow rate and velocity. As Qd increases, the shear stress exerted by continuous phase become less significant and the dispersed phase fluid less easy to break into droplets [51]. Hence, a longer residence time is required for necking process and allowing the dispersed phase fluid to grow into a larger size and volume.
The average size of droplets in the downstream splitting junctions shows inconsistency, which is same as the previous parametric studies. In second splitting junction, the droplet sizes distribution is more stable than first and third splitting junction, which shows that the droplets are formed within a specific range. This is because the bifurcating junctions evenly splits the droplet into three splitting junctions. However, due to instabilities flow occurring towards the obstruction at the branching point, the droplets favor coalescences when multiple droplets collide and crash into each other. This is also attributed to the Coanda effect, where majority of the mother droplets are split into the curved junction 1 and 3. Figure 18 illustrates the droplet flow behavior at different flow conditions. The inconsistency in the droplet size is also due to the pressure drop and distributed forces over the entire region, which causes the flow after splitting to become instabilities.
As compared to symmetrical splitting systems, the values for analytical coefficient of variation (CV%) given in Table 2 show better performance. CV% of less than 3% found at the T-junction indicates the formation of monodispersed droplet which can be observed similarly in the counterpart symmetrical splitting systems. Moreover, overall values of CV% obtained at the downstream splitting were found to be lower than the symmetrical splitting system. For instance, CV% value of about 25% or lower was found at the downstream splitting junctions for asymmetrical splitting systems for constant Qc of 2.0 mL/h, notably at high flow rate ratio condition. This may due to the velocity distribution of splitting junction 3 than splitting junctions 1 and 2 in asymmetrical splitting systems as depicted in Figure 7. Higher maximum velocity diverted a greater portion of droplet flow into splitting junction 3, resulting in a more uniform splitting in splitting junction 1 and 2 than the counterpart. Moreover, similar behavior of high polydispersity was observed in flow conditions with low Qc as indicated by increased CV% values, where the emulsions generated were unstable and coalesces into bigger size when approaching the splitting point. Therefore, the improved overall performance of asymmetrical splitting system than the counterpart would make the control of droplet consistency easier.
Figure 19 shows the distribution of droplet size on the effect of Q and Ca at asymmetrical bifurcation junction. As shown in Figure 19a, the Ca of first splitting junction (1) is higher than that of the corresponding splitting junctions 2 and 3 due to asymmetrical bifurcation junction (see A.3). This is due to higher maximum velocity in splitting junction 1 as shown in Figure 7 that is attributed to its smaller dimension, which leads to higher Ca than splitting junction 2 and 3. High polydispersity in droplet size distribution is observed across all Ca range in asymmetrical bifurcation junctions notably in low Ca, which can be seen in high Q condition as portrayed in Figure 19b. However, splitting junction 2 shows rather uniform in the distribution of droplet size as shown in Figure 19a. Attributed to the Coanda effect and the higher velocity in splitting junction 1, the remaining minor portion of mother droplets were distributed into splitting junction 2, which resulted in a more uniform distribution in droplet size. According to Figure 19b, droplet size in splitting junction 2 also shows nearly monodispersed droplet sizes across all Q than splitting junctions 1 and 3. Moreover, the polydispersity of the droplet size distribution becomes higher as the Q increases. This is due to the reduced effect of shear stress from Qc as Qd increases, whereby the effect of shear stress is insufficient to facilitate the fission process of mother droplet into even daughter droplets at the bifurcation point.

4. Conclusions

Water droplet fission process involving the severe moving boundaries and interfaces in an oil phase at the bilayer splitting joint of microchannel was investigated and successfully achieved. Parametric studies were done to observe the effect of Qc and Qd on droplet size at symmetrical and asymmetrical downstream splitting junctions in microchannel. A series of continuous flowing highly monodisperse droplets were generated at the T-junction by adjusting the desired flow rate of one phase while leaving the other phase constant. Nevertheless, uneven distribution of droplet size is significant due to flow instabilities along the shear edges of trifurcation at downstream channels, notable at high flow rate ratio where the droplets generated at T-junction were more likely to coalesce. In contrast, low Q generally resulted in a more even distribution of droplet size represented by lower fluctuation observed in splitting junction 1 and 2. Hence, droplet fission event in 3D bifurcation point is more favorable in systems with high Ca or low Q, where Qc >> Qd. The concerning factors on the production of highly polydispersed droplets at the outlet of multiple distributary channels was due to the interplay between bulk fluid forces, which affected droplet morphology and surface area. Hence, differences in bulk shear, pressure drop and velocity distribution were resulted notably at the splitting point of trifurcation. However, further investigation is required as it is incredibly vital to control the consistency of droplet size in a microchannel network in order to ensure a continuous uniform distribution of substances for samplings. Future works will focus more on the computed flow fields that needs for any forthcoming experimental flow models and designs, as well as the application of the model to unsteady flow conditions. The outcomes of the present study in a novel geometric structure of the double planar microchannels can deliver a comprehension on droplet fission behavior.

Supplementary Materials

The following are available online at https://www.mdpi.com/2227-9717/8/5/510/s1, Figure S1: Droplet size distribution in different region of interests at Qd of (a) 0.5 mL/hr; (b) 1.5 mL/hr; and (c) 2.0 mL/hr, respectively. The images were taken under the optical microscope using high speed camera, Figure S2: Droplet size distribution in different region of interests at Qc of (a) 0.5 mL/hr; (b) 1.5 mL/hr; and (c) 2.0 mL/hr, respectively. The images were taken under the optical microscope using high speed camera, Figure S3: Droplet size distribution in different region of interests at Qd of (a) 0.5 mL/hr; (b) 1.5 mL/hr; and (c) 2.0 mL/hr, respectively. The images were taken under the optical microscope using high speed camera.

Author Contributions

I.-L.L. conducted the experiment and analyzed the experimental results while V.-L.W. performed the preliminary numerical analysis and supervised the entire research progress. This manuscript was written by I.-L.L. and V.-L.W., J.-K.C. provided the conceptualization, the experimental materials and equipment. K.K. proofread the manuscript. All authors have read and agreed to the published version of the manuscript.

Funding

This research project was financially supported by SEGi University’s Research Fund (SEGIRF/2016-07/FOEBE-21/98).

Conflicts of Interest

The authors declare no conflict of interest.

References

  1. Kumar, V.; Paraschivoiu, M.; Nigam, K.D.P. Single-phase fluid flow and mixing in microchannels. Chem. Eng. Sci. 2011, 66, 1329–1373. [Google Scholar] [CrossRef]
  2. Shilpiekandula, V.; Burns, D.J.; Rifai, K.E.; Yousef-Toumi, K.; Li, S.; Reading, I.; Yoon, S.F. Metrology of microfluidic devices: A review. In Proceedings of the ICOMM International Conference of Micromanufacturing, Urbana-Champaign, IL, USA, 2006. [Google Scholar]
  3. Beebe, D.J.; Mensing, G.A.; Walker, G.M. Physics and applications of microfluidics in biology. Ann. Rev. Biomed. Eng. 2002, 4, 261–286. [Google Scholar] [CrossRef] [PubMed]
  4. Weigl, B.H.; Bardell, R.L.; Cabrera, C.R. Lab-on-a-chip for drug development. Adv. Drug Deliv. Rev. 2003, 55, 349–377. [Google Scholar] [CrossRef]
  5. Terry, S.C.; Jerman, J.H.; Angell, J.B. A gas chromatographic air analyzer fabricated on a silicon wafer. IEEE Trans. Electron. Devices 1979, 26, 1880–1886. [Google Scholar] [CrossRef]
  6. Whitesides, G.M. The origins and the future of microfluidics. Nature 2006, 442, 368. [Google Scholar] [CrossRef] [PubMed]
  7. Xu, J.H.; Li, S.W.; Tan, J.; Luo, G.S. Correlations of droplet formation in T-junction microfluidic devices: From squeezing to dripping. Microfluid Nanofluidics 2008, 5, 711–717. [Google Scholar] [CrossRef]
  8. Mulligan, M.K.; Rothstein, J.P. Scale-up and control of droplet production in coupled microfluidic flow-focusing geometries. Microfluid Nanofluidics 2012, 13, 65–73. [Google Scholar] [CrossRef]
  9. Nisisako, T.; Torii, T.; Higuchi, T. Novel microreactors for functional polymer beads. Chem. Eng. J. 2004, 101, 23–29. [Google Scholar] [CrossRef]
  10. Kim, S.H.; Jeon, S.J.; Jeong, W.C.; Park, H.S.; Yang, S.M. Optofluidic Synthesis of Electroresponsive Photonic Janus Balls with Isotropic Structural Colors. Adv. Mater. 2008, 20, 4129–4134. [Google Scholar] [CrossRef]
  11. Kim, S.H.; Sim, J.Y.; Lim, J.M.; Yang, S.M. Magnetoresponsive Microparticles with Nanoscopic Surface Structures for Remote-Controlled Locomotion. Angew. Chem. Int. Ed. 2010, 49, 3786–3790. [Google Scholar] [CrossRef]
  12. Zhao, Y.; Zhao, X.; Sun, C.; Li, J.; Zhu, R.; Gu, Z. Encoded Silica Colloidal Crystal Beads as Supports for Potential Multiplex Immunoassay. Anal. Chem. 2008, 80, 1598–1605. [Google Scholar] [CrossRef] [PubMed]
  13. Razaghi, R.; Saidi, M.H. Transportation and Settling Distribution of Microparticles in Low-Reynolds-Number Poiseuille Flow in Microchannel. J. Dispers. Sci. Technol. 2016, 37, 582–594. [Google Scholar] [CrossRef]
  14. Razaghi, R.; Shirinzadeh, F.; Zabetian, M.; Aghanoorian, E. Velocity domain and volume fraction distribution of heavy microparticles in low reynolds number flow in microchannel. J. Dispers. Sci. Technol. 2017, 38, 374–380. [Google Scholar] [CrossRef]
  15. Song, H.; Tice, J.D.; Ismagilov, R.F. A Microfluidic System for Controlling Reaction Networks in Time. Angew. Chem. Int. Ed. 2003, 42, 768–772. [Google Scholar] [CrossRef]
  16. Zheng, B.; Tice, J.D.; Roach, L.S.; Ismagilov, R.F. A Droplet-Based, Composite PDMS/Glass Capillary Microfluidic System for Evaluating Protein Crystallization Conditions by Microbatch and Vapor-Diffusion Methods with On-Chip X-Ray Diffraction. Angew. Chem. Int. Ed. 2004, 43, 2508–2511. [Google Scholar] [CrossRef]
  17. Takagi, M.; Maki, T.; Miyahara, M.; Mae, K. Production of titania nanoparticles by using a new microreactor assembled with same axle dual pipe. Chem. Eng. J. 2004, 101, 269–276. [Google Scholar] [CrossRef]
  18. Sun, M.; Du, W.B.; Fang, Q. Microfluidic liquid–liquid extraction system based on stopped-flow technique and liquid core waveguide capillary. Talanta 2006, 70, 392–396. [Google Scholar] [CrossRef]
  19. Chen, N.; Wu, J.; Jiang, H.; Dong, L. CFD Simulation of Droplet Formation in a Wide-Type Microfluidic T-Junction. J. Dispers. Sci. Technol. 2012, 33, 1635–1641. [Google Scholar] [CrossRef]
  20. Jin, B.J.; Kim, Y.W.; Lee, Y.; Yoo, J.Y. Droplet merging in a straight microchannel using droplet size or viscosity difference. J. Micromech. Microeng. 2010, 20, 035003. [Google Scholar] [CrossRef]
  21. Dong, C.; Jia, Y.; Gao, J.; Chen, T.; Mak, P.I.; Vai, M.I.; Martins, R.P. A 3D microblade structure for precise and parallel droplet splitting on digital microfluidic chips. Lab Chip 2017, 17, 896–904. [Google Scholar] [CrossRef] [Green Version]
  22. Link, D.R.; Anna, S.L.; Weitz, D.A.; Stone, H.A. Geometrically Mediated Breakup of Drops in Microfluidic Devices. Phys. Rev. Lett. 2004, 92, 054503. [Google Scholar] [CrossRef] [PubMed] [Green Version]
  23. Wang, J.; Wang, J.; Feng, L.; Lin, T. Fluid mixing in droplet-based microfluidics with a serpentine microchannel. RSC Adv. 2015, 5, 104138–104144. [Google Scholar] [CrossRef]
  24. Yesiloz, G.; Boybay, M.S.; Ren, C.L. Effective Thermo-Capillary Mixing in Droplet Microfluidics Integrated with a Microwave Heater. Anal. Chem 2017, 89, 1978–1984. [Google Scholar] [CrossRef] [PubMed]
  25. Lee, C.; Lee, J.; Kim, H.H.; The, S.Y.; Lee, A.; Chung, I.Y.; Park, J.Y.; Shung, K.K. Microfluidic droplet sorting with a high frequency ultrasound beam. Lab Chip. 2012, 12, 2736–2742. [Google Scholar] [CrossRef] [PubMed]
  26. Hatch, A.C.; Patel, A.; Beer, N.R.; Lee, A.P. Passive droplet sorting using viscoelastic flow focusing. Lab. Chip 2013, 13, 1308–1315. [Google Scholar] [CrossRef]
  27. Sivasamy, J.; Wong, T.N.; Nguyen, N.T.; Kao, L.T.H. An investigation on the mechanism of droplet formation in a microfluidic T-junction. Microfluid Nanofluidics 2011, 11, 1–10. [Google Scholar] [CrossRef] [Green Version]
  28. Nooranidoost, M.; Izbassarov, D.; Muradoglu, M. Droplet formation in a flow focusing configuration: Effects of viscoelasticity. Phys. Fluids. 2016, 28, 123102. [Google Scholar] [CrossRef] [Green Version]
  29. Bolognesi, G.; Hargreaves, A.; Ward, A.D.; Kirby, A.K.; Bain, C.D.; Ces, O. Microfluidic generation of monodisperse ultra-low interfacial tension oil droplets in water. RSC Adv. 2015, 5, 8114–8121. [Google Scholar] [CrossRef] [Green Version]
  30. Cramer, C.; Fischer, P.; Windhab, E.J. Drop formation in a co-flowing ambient fluid. Chem. Eng. Sci. 2004, 59, 3045–3058. [Google Scholar] [CrossRef]
  31. Utada, A.S.; Fernandez-Nieves, A.; Stone, H.A.; Weitz, D.A. Dripping to Jetting Transitions in Coflowing Liquid Streams. Phys. Rev. Lett. 2007, 99, 094502. [Google Scholar] [CrossRef]
  32. Peng, L.; Yang, M.; Guo, S.S.; Liu, W.; Zhao, X.Z. The effect of interfacial tension on droplet formation in flow-focusing microfluidic device. Biomed. Microdevices 2011, 13, 559–564. [Google Scholar] [CrossRef] [PubMed]
  33. Garstecki, P.; Fuerstman, M.J.; Stone, H.A.; Whitesides, G.M. Formation of droplets and bubbles in a microfluidic T-junction-scaling and mechanism of break-up. Lab Chip 2006, 6, 437–446. [Google Scholar] [CrossRef] [PubMed]
  34. Qiu, D.; Silva, L.; Tonkovich, A.L.; Arora, R. Micro-droplet formation in non-Newtonian fluid in a microchannel. Microfluid Nanofluidics 2010, 8, 531–548. [Google Scholar] [CrossRef]
  35. Wong, V.L.; Loizou, K.; Lau, P.L.; Graham, R.S.; Hewakandamby, B.N. Numerical studies of shear-thinning droplet formation in a microfluidic T-junction using two-phase level-SET method. Chem. Eng. Sci. 2017, 174, 157–173. [Google Scholar] [CrossRef]
  36. Ratner, D.M.; Murphy, E.R.; Jhunjhunwala, M.; Snyder, D.A.; Jensen, K.F.; Seeberger, P.H. Microreactor-based reaction optimization in organic chemistry-glycosylation as a challenge. Chem. Commun. 2005, 36, 578–580. [Google Scholar] [CrossRef]
  37. Teh, S.Y.; Lin, R.; Hung, L.H.; Lee, A.P. Droplet microfluidics. Lab Chip 2008, 8, 198–220. [Google Scholar] [CrossRef]
  38. Loizou, K.; Wong, V.L.; Thielemans, W.; Hewakandamby, B. Effect of Fluid Properties on Droplet Generation in a Microfluidic T-Junction. In Proceedings of the ASME 4th Joint US-European Fluids Engineering Division Summer Meeting 2014, Chicago, IL, USA, 3–7 August 2014. [Google Scholar]
  39. Lee, W.; Son, G. Numerical study of obstacle configuration for droplet splitting in a microchannel. Comput. Fluids 2013, 84, 351–358. [Google Scholar] [CrossRef]
  40. Yi, U.C.; Kim, C.J. Characterization of electrowetting actuation on addressable single-side coplanar electrodes. J. Micromech. Microeng. 2006, 16, 2053. [Google Scholar] [CrossRef] [Green Version]
  41. Yap, Y.F.; Tan, S.Y.; Nguyen, N.T.; Murshed, S.M.S.; Wong, T.N.; Yobas, L. Thermally mediated control of liquid microdroplets at a bifurcation. J. Phys. D 2009, 42, 065503. [Google Scholar] [CrossRef]
  42. Chen, H.; Li, J.; Shum, H.C.; Stone, H.A.; Weitz, D.A. Breakup of double emulsions in constrictions. Soft Matter. 2011, 7, 2345–2347. [Google Scholar] [CrossRef] [Green Version]
  43. Rosenfeld, L.; Fan, L.; Chen, Y.; Swoboda, R.; Tang, S.K.Y. Break-up of droplets in a concentrated emulsion flowing through a narrow constriction. Soft Matter. 2014, 10, 421–430. [Google Scholar] [CrossRef] [PubMed]
  44. Sun, C.L.; Liu, S.L. μPIV study of droplet fission in a bifurcating microchannel. In Proceedings of the 10th International Symposium on Particle Image Velocimetry, Delft, The Netherlands, 2–4 July 2013. [Google Scholar]
  45. Ren, Y.; Koh, K.S.; Chin, J.K.; Wang, J.; Wen, C.; Yan, Y. Droplet formation and fission in shear-thinning/Newtonian multiphase system using bilayer bifurcating microchannel. J. Heat Transfer. 2017, 140, 012405. [Google Scholar] [CrossRef]
  46. Ren, Y.; Koh, K.S.; Yew, M.; Chin, J.K.; Chan, Y.; Yan, Y. Droplet breakup dynamics in bi-layer bifurcating microchannel. Micromachines 2018, 9, 57. [Google Scholar] [CrossRef] [PubMed] [Green Version]
  47. Bartholomeusz, D.A.; Boutté, R.W.; Andrade, J.D. Xurography: Rapid Prototyping of Microstructures Using a Cutting Plotter. J. Microelectromech. S 2005, 14, 1364–1366. [Google Scholar] [CrossRef]
  48. Lim, C.N.; Koh, K.S.; Ren, Y.; Chin, J.K.; Shi, Y.; Yan, Y. Analysis of Liquid–Liquid Droplets Fission and Encapsulation in Single/Two Layer Microfluidic Devices Fabricated by Xurographic Method. Micromachines 2017, 8, 49. [Google Scholar] [CrossRef] [Green Version]
  49. Xia, Y.; Whitesides, G.M. Soft Lithography. Ann. Rev. Mater. Sci. 1998, 28, 153–184. [Google Scholar] [CrossRef]
  50. Yang, C.G.; Xu, Z.R.; Wang, J.H. Manipulation of droplets in microfluidic systems. TrAC Trends Anal. Chem. 2010, 29, 141–157. [Google Scholar] [CrossRef]
  51. Paulsen, J.D.; Carmigniani, R.; Kannan, A.; Burton, J.C.; Nagel, S.R. Coalescence of bubbles and drops in an outer fluid. Nat. Commun. 2014, 5, 3182. [Google Scholar] [CrossRef] [Green Version]
  52. Pit, M.A.; Duits, H.M.; Mugele, F. Droplet Manipulations in Two Phase Flow Microfluidics. Micromachines 2015, 6, 1768–1793. [Google Scholar] [CrossRef] [Green Version]
  53. Christopher, G.F.; Bergstein, J.; End, N.B.; Poon, M.; Nguyen, C.; Anna, S.L. Coalescence and splitting of confined droplets at microfluidic junctions. Lab Chip 2009, 9, 1102–1109. [Google Scholar] [CrossRef]
  54. Tan, Y.C.; Fisher, J.S.; Lee, A.I.; Cristini, V.; Lee, A.P. Design of microfluidic channel geometries for the control of droplet volume, chemical concentration, and sorting. Lab Chip 2004, 4, 292–298. [Google Scholar] [CrossRef] [PubMed]
  55. Wong, V.L.; Loizou, K.; Lau, P.L.; Graham, R.S.; Hewakandamby, B.N. Characterizing droplet breakup rates of shear-thinning dispersed phase in microreactors. Chem. Eng. Res. Des. 2019, 144, 370–385. [Google Scholar] [CrossRef]
  56. Li, Y.; Someya, S.; Koso, T.; Aramaki, S.; Okamoto, K. Characterization of periodic flow structure in a small-scale feedback fluidic oscillator under low-reynolds-number water flow. Flow Meas. Instrum. 2013, 33, 179–187. [Google Scholar]
  57. Pitton, G.; Quaini, A.; Rozza, G. Computational reduction strategies for the detection of teady bifurcations in incompressible fluid-dynamics: Applications to coanda effect in cardiology. J. Comput. Phys. 2017, 344, 534–557. [Google Scholar] [CrossRef] [Green Version]
  58. Wang, S.; Batikh, A.; Baldas, L.; Kourta, A.; Mazellier, N.; Colin, S.; Orieux, S. On the modelling of the switching mechanisms of a coanda fluidic oscillator. Sens. Actuator A Phys. 2019, 299, 111618. [Google Scholar] [CrossRef]
  59. Yang, J.T.; Chen, C.K.; Tsai, K.J.; Lin, W.Z.; Sheen, H.J. A novel fluidic oscillator incorporating step-shaped attachment walls. Sens. Actuator A Phys. 2007, 135, 476–483. [Google Scholar] [CrossRef]
  60. Chekifi, T.; Dennai, B.; Rachid, K. Computational investigation of droplets behavior inside passive microfluidic oscillator. Fluid Dyn. Mater. Process. 2017, 13, 173–187. [Google Scholar]
Figure 1. Images of xurographic positive-tone microchannel: (a) T-junction and bifurcated junction with (b) even (1:1) and (c) uneven aspect ratio (2:3) (where wd denotes as the dispersed phase channel, wc denotes as continuous phase channel, wsp1 denotes as first splitting junction and wsp2 denotes as second splitting junction, respectively). The sample images were taken using optical microscope using 2× magnification. (d) Design of the microchannels composed of T-shaped and bifurcating channels using CorelDraw Graphics Suites X7. The red dotted line denotes the alignment profile of the bilayer microchannels.
Processes 08 00510 g001
Figure 2. Schematic diagram of double planar microchannel. The droplets are subject to the 3D splitting point at the microchannel downstream where the mother droplets undergo fission and distributed into the trifurcation channels.
Processes 08 00510 g002
Figure 3. Algorithm of optimizing the design precision of xurographic microchannel.
Processes 08 00510 g003
Figure 4. (a) Schematic diagram of the shape of confined droplets and plugs in microchannel. Major droplet diameter (dmajor) denotes the longest dimension of the projected area of droplet/plug whereas the minor droplet diameter (dminor) indicates the shortest dimension of the projected area of droplet/plug. The depth of the microchannel was denoted as h. (b) Image thresholding analysis of droplet or plug diameter in microchannel using MATLAB.
Processes 08 00510 g004
Figure 5. Evolution of droplet breakup and fission process at the upstream T-Junction and downstream of symmetrical splitting junctions (for system: Qc = 2 mL/h; Qd = 1 mL/h).
Processes 08 00510 g005
Figure 6. Evolution of flow profile at the upstream T-Junction and downstream of symmetrical and asymmetrical splitting junctions (for system: Qc = 2 mL/h).
Processes 08 00510 g006
Figure 7. The simulated profile of velocity magnitude distribution along the direction of the continuous phase flow at the top layer of extended T-junction (for system: Qc = 2 mL/h). The numbers indicate locations at which image profiles were taken.
Processes 08 00510 g007
Figure 8. The simulated profile of shear rate distribution along the direction of the continuous phase flow at the top layer of extended T-junction (for system: Qc = 2 mL/h). The numbers indicate locations at which image profiles were taken.
Processes 08 00510 g008
Figure 9. Average droplet size distribution with respect to different Qc ranging from 0.5 to 2.5 mL/h in symmetrical bifurcating junction. Image indicates the region of interest for the droplet measurement. Error bars indicate the standard deviation in effective droplet size measurement of 30 droplets under fixed experimental condition.
Processes 08 00510 g009
Figure 10. Droplet collision and coalescence phenomena in symmetrical splitting junctions at different flow rate ratio (0.4 < Q < 2) by fixing the Qd and varying the Qc.
Processes 08 00510 g010
Figure 11. Droplet size distribution in different region of interests at Qc of (a) 0.5 mL/h; (b) 1.5 mL/h; and (c) 2.0 mL/h, respectively. The images were taken under the optical microscope using high speed camera.
Processes 08 00510 g011
Figure 12. Average droplet size distribution with respect to different Qd ranging from 0.3 to 2.5 mL/h in symmetrical bifurcating junction. Image indicates the region of interest for the droplet measurement. Error bars indicate the standard deviation in effective droplet size measurement of 30 droplets under fixed experimental condition.
Processes 08 00510 g012
Figure 13. Droplet collision and coalescence phenomena in symmetrical splitting junctions at different flow rate ratio (0.15 < Q < 1.25) by fixing the Qc and varying the Qd.
Processes 08 00510 g013
Figure 14. Distribution of droplet size in various regions of interest with respect to: (a) Capillary number and (b) flow rate ratio at symmetrical bifurcating junction.
Processes 08 00510 g014
Figure 15. Average droplet size distribution with respect to different Qc ranging from 0.5 mL/h to 2.5 mL/h in asymmetrical bifurcating junction. Image indicates the region of interest for the droplet measurement. Error bars indicate the standard deviation in effective droplet size measurement of 30 droplets under fixed experimental condition.
Processes 08 00510 g015
Figure 16. Droplet collision and coalescence phenomena in asymmetrical splitting junctions at different flow rate ratio (0.4 < Q < 3.33) by fixing the Qd and varying the Qc.
Processes 08 00510 g016
Figure 17. Average droplet size distribution with respect to different Qd ranging from 0.5 mL/h to 2.5 mL/h in asymmetrical bifurcating junction. Image indicates the region of interest for the droplet measurement. Error bars indicate the standard deviation in effective droplet size measurement of 30 droplets under fixed experimental condition.
Processes 08 00510 g017
Figure 18. Droplet collision and coalescence phenomena in asymmetrical splitting junctions at different flow rate ratio (0.15 < Q < 1.25) by fixing the Qc and varying the Qd.
Processes 08 00510 g018
Figure 19. Distribution of droplet size in various regions of interest with respect to: (a) Capillary number and (b) Flow rate ratio at asymmetrical bifurcating junction.
Processes 08 00510 g019
Table 1. Coefficient of variation (CV%) of effective droplet diameters in symmetrical multifurcated channels at different flow conditions.
Qc (mL/h)Qd (mL/h)T Junction (Upstream)Splitting Junction 1 (Downstream)Straight Junction 2 (Downstream)Splitting Junction 3 (Downstream)
Coefficient of Variation (CV%)
2.000.303.1414.61 *11.15 *3.96
2.000.500.7317.87 *9.225.38
2.001.001.667.487.543.65
2.001.507.5411.85 *16.10 *33.14 *
2.002.0017.27*54.45 *15.40 *32.38 *
2.002.5013.96*45.89 *27.73 *25.50 *
0.501.001.5616.10 *35.19 *7.16
1.001.002.0242.72 *14.99 *28.46 *
1.501.001.107.0511.33 *31.62 *
2.001.001.1418.07 *17.55 *33.31 *
2.501.001.2011.76 *4.660.72
* Note: CV% values greater than 10% indicate that the system is highly polydisperse. CV% derived from the averaged diameter measurement of at least 30 droplets.
Table 2. Coefficient of variation (CV%) of effective droplet diameters in asymmetrical multifurcated channels at different flow conditions.
Qc (mL/h)Qd (mL/h)T Junction (Upstream)Splitting Junction 1 (Downstream)Straight Junction 2 (Downstream)Splitting Junction 3 (Downstream)
Coefficient of Variation (CV%)
2.000.301.7611.87 *9.1317.76 *
2.000.502.133.474.9423.30 *
2.001.002.579.7813.83 *22.48 *
2.001.500.8512.30 *7.7519.21 *
2.002.001.087.3012.04 *11.63 *
2.002.502.3917.38 *7.3226.19 *
0.301.001.1661.95 *16.22 *69.38 *
0.501.001.3940.44 *6.6125.83 *
1.001.000.9931.64 *3.6032.71 *
1.501.001.5020.71 *5.935.00
2.001.001.351.506.1727.75 *
2.501.001.1814.86 *7.9119.75 *
* Note: CV% values greater than 10% indicate that the system is highly polydisperse. CV% derived from the averaged diameter measurement of at least 30 droplets.

