Abstract
Statistical-based study using response surface methodology (RSM) was conducted to study the effects of process parameters towards biomass hydrogenation. Using Malaysian oil palm empty fruit bunches (EFB) fibres as feedstock, the central composite design (CCD) technique was employed and 18 runs were generated by CCD when four parameters (mass ratio of binary catalyst, hydrogen pressure, temperature and mass ratio of catalyst to feedstock) were varied with two center points to determine the effects of process parameters and eventually to get optimum ethylene glycol (EG) yield. RSM with quadratic function was generated for biomass hydrogenation, indicating all factors except temperature, were important in determining EG yield. Analysis of variance (ANOVA) showed a high coefficient of determination (R2) value of >0.98, ensuring a satisfactory prediction of the quadratic model with experimental data. The quadratic model suggested the optimum EG yield should be >25 wt.% and the EG yield results were successfully reproduced in the laboratory.
1. Introduction
Using catalysts and agricultural lignocellulosic waste as feedstock, bio-based ethylene glycol (EG) could be produced. A research team in China filed a patent in 2008 indicating ethylene glycol could be produced from cellulose under a catalytic hydrogenation process [1]. Using cellulose, glucose or biomass as feedstock, extensive work has been carried out by researchers around the world who have studied the effect of process parameters to EG yield [2,3,4,5,6,7,8,9,10,11,12,13,14,15,16,17,18,19,20,21,22,23,24,25]. Tai et al. (2012) reported that when 1.2% Ru/MC coupling was used with tungstic acid at a mass ratio of 2:1, maximum EG yield was achieved at 58.5% [2]. Wang and Zhang (2013) mentioned that by fine-tuning tungsten (W) content to transition metals, up to 60% EG yield could be attained [3]. Zheng et al. (2014) indicated that EG yield could be improved from 67% to 76% using more efficient tungstenic acid [4]. The work from Ji et al. (2008) showed that a maximum of 61% EG yield was possible when 2% Ni-30% W2C/AC-973 were used as catalyst [5] whereas using 5% Ni-15%W/SBA-15 and 10% Ni-30% W2C/AC, (both with mass ratio of Ni to W = 1:3), 76.1% and 73% EG yield could be achieved, respectively [6,7]. When Raney nickel to tungstic acid was used in a mass ratio of 2:3, maximum EG yield was achieved at 65.4% [8]. 61.0% EG yield was possible when 2% Ni-W2C/AC-973 was used [9]. Xiao et al. (2013) reported that a maximum of 31.6% EG yield was attained when CuCr (4) was coupled with 0.06 g Ca whereas with this system of catalysts at 10% cellulose loading, maximum EG yield of 7.6% was attained [10]. Using Jurusalem artichoke tuber, 14.1% EG yield was attained with 4% Ni-20% W2C/AC [11]. Using ammonium metatungstate (AMT) coupling with 4% Ru/AC as the catalyst system and glucose as feedstock in a semi-continuous batch reactor, maximum EG yield of 50.2% could be attained, whereas using cellulose in a batch reactor, a maximum yield of 46.7% EG was possible [12]. 8% Ru/C would give maximum EG selectivity of 5.9% [13] whereas Pt-SnOx (0.3)/Al2O3 and Pt-SnOx (3.8)/Al2O3 would give maximum EG selectivity of 22.0% [14]. Using tungstic acid coupling with 1% Ru/C as the catalyst system, when 0.03 parts of sulfuric acid with respect to tungstic acid was added to the system, EG yield could be improved from 32.6% to 52.6% [15]. Phototungstic acid coupling with Ru/AC would give a maximum EG yield of 53.1% [16]. Baek et al. (2012) discovered that using different molar fractions of Al in a catalyst system of Ni/W/SiO2-Al2O3, EG yield could be improved from 17.3% to 23.3% when 0.6 molar fraction of Al was used [17]. Using WO3 with 3% Ru/C, a maximum of 51.5% and 59.4% EG selectivity were achieved when using cellulose and glucose as feedstock, respectively [18]. A maximum of 51.0% EG yield was achieved when Ni-W/β was used with glucose as feedstock [19]. Ooms et al. (2014) discovered that when 2% Ni-30% W2C/AC-973 was used, with glucose as feedstock, 47% EG yield was possible in a fed-batch reactor when the batch reactor only gave 8% EG yield; higher EG yield of 49% could be achieved when erythrose was used as feedstock [20]. When different parameters (temperature, initial hydrogen pressure, continuous hydrogen pressure, glucose feeding rate and mass ratio of 2% Ni/AC-973 with 30% of W2C/AC-973) were studied, maximum EG yield of 66% was possible at 533 K [20]. When a mass ratio of cellulose to La(OH)3 was used at 2.5, in combination with 0.15 g of 10% Ni/AC, EG yield could be achieved at 38%, whereas a reaction at 518 K for 110 min further boosted EG yield to 39% [21]. You et al. (2013) mentioned that using Pt/Cs (2.0), 5.6% EG yield was achieved whereas at 493 K, 15% EG selectivity was achieved [22]. Xi et al. (2014) reported that using glucose as feedstock, maximum EG yield of 36.9% was possible in a 3% Ru/NbOPO4 catalyst system [23]. Wang et al. (2012) reported that using 4% Ru/CNTs and cellulose as feedstock, when temperature increased from 205 °C to 235 °C, cellulose conversion increased from 62.2% to 82.2%; and to achieve optimum C2-C3 yield of 38.7%, an optimum temperature of 225 °C should be maintained [24]. Using CuO/ZnO/Al2O3 and xylitol as feedstock for 4 h, 33% EG selectivity was reported [25]. Using Ni-W2C/AC, Ashtree in a batch reactor and glucose in a semi-batch reactor, 53% and 47% EG yield was achieved, respectively [25]. Corn stalk gave 18% EG yield in 2% Ni-30% W2C/AC and in a batch reactor [25].
In summary, among all the aforementioned studies, 13 papers reported findings on the effect of different catalyst types to EG yield [3,4,5,7,9,10,11,12,17,18,22,23,25]. Nine papers reported on the effect of reaction temperatures [9,11,12,13,16,20,21,22,24] whereas eight papers reported on the effect of different catalyst loading [2,6,14,16,19,20,23,24] to EG yield. The effect of initial hydrogen pressure [9,11,12,20,24] as well as reaction duration [9,11,16,21] to EG yield was also widely reported. The finding of effects of different biomass loading [3,10], feeding speed [12,20], effect of additive/co-catalyst effect [15,19], cellulose to catalyst loading [16,21], different feedstock [23,25], reactor type [12] and continuous hydrogen feeding [20] towards EG yield were also reported. Li et al. (2016) consolidated a table summarizing the EG yield from various types of precious metal catalysts (Pd, Pt, Ru, Ir) and a nickel-tungsten based catalyst with various types of feedstock (cellulose, xylose, glucose, corn stalk) [26]. Using cellulose as feedstock, an EG yield of up to 76% was achieved, making Raney nickel coupling with tungstic acid a good low-cost binary catalyst to produce promising EG yield for commercialization purpose [4,8].
Although high numbers of papers and patents were published for EG conversion for more than one decade, most research groups performed their studies using the one-factor-at-a-time (OFAT) approach. A statistical model capable of predicting EG yield is therefore necessary. As mentioned by Czitrom (1999), design of experiment (DOE) when comparing with OFAT, has the following four advantages [27]:
- It requires less resources (experiments, time, material, man hours, etc.) to get meaningful information;
- The estimates of effects of each factor are more precise;
- Interaction between factors can be estimated systematically; and
- Experimental information in a larger region of the factor space could be obtained.
In addition, oil palm empty fruit bunches (EFB) fibres are regional-specific agricultural wastes, therefore none of the work published so far is able to predict EG yield when EFB is used as feedstock.
Since response surface methodology (RSM), specifically central composite design (CCD) has been widely used in biohydrogen [28] and biodiesel [29,30,31,32,33] production process optimization, it should therefore be used in this work to determine the effects of process parameters (binary catalyst ratio, temperature, pressure and tungstic acid to EFB ratio) of biomass hydrogenation to EG yield and eventually optimize EG yield.
2. Materials and Methods
2.1. Materials and Chemicals
All materials and chemicals were used as received unless stated otherwise. Empty fruit bunches (EFB) fibres were sourced from a local mill located in Selangor, Malaysia. The fibres were hydrothermally processed and hence free from oil and dirt, and were cut to a 1-inch length. Upon receiving, the fibres were further milled to 1-mm fibre length using a lab-scale grinder (IKA Labortechnik, Staufen, Germany) with a 1-mm sieve to get the desired fibre length of 1-mm and below. Raney Nickel was obtained from W.R. Grace and Company, Columbia, Maryland, USA. Analytical grade sodium hydroxide (NaOH) and tungstic acid were obtained from Sigma Aldrich (Subang Jaya, Selangor, Malaysia). Purified hydrogen was obtained from Mox-Linde, (Petaling Jaya, Malaysia).
2.2. Alkaline Pre-Treatment of Empty Fruit Bunches (EFB) Fibres
All EFB fibres used in this study had undergone alkaline pre-treatment in accordance to work reported by Zawawi et al. [34]. Alkaline pre-treatment of untreated EFB was carried out in a 1.5-L pressure vessel (PARR, Moline, Illinois, USA). 20 g of EFB and 180 g of 0.438 mol L−1 of NaOH solution at a ratio of one to nine parts of EFB to base solution were typically used. Alkaline pre-treatment of EFB was conducted at 423 K for 90 min at a stirring rate of 500 rpm. Upon cooling of the reactor, pre-treated EFB was obtained via filtration. The solid samples were washed repeatedly until neutralized pH was obtained. They were then dried in an oven until the moisture content was <10 wt. % and kept in a fridge until use. The characterization protocol of the pre-treated EFB was performed in accordance with the work reported by Zawawi et al. [34].
2.3. Catalytic Biomass Hydrogenation
Catalytic conversion of pre-treated EFB was carried out in a 1.5-L pressure vessel and 18.75-L pressure vessel (PARR, Moline, Illinois, USA). 20 g of pre-treated EFB and 180 g of deionized water at a ratio of one to nine parts of EFB to water were typically used in a 1.5-L pressure vessel, whereas 500 g of pre-treated EFB and 4500 g of deionized water were typically used in a 18.75-L pressure vessel. The mass ratio of Raney Nickel to tungstic acid varied from 0.80 to 1.20, temperature varied from 503 to 523 K, initial hydrogen pressure at ambient condition of 303 ± 2 K varied from 18 to 25 bar (g), whereas mass ratio of tungstic acid to EFB varied from 0.060 to 0.100. Residence time was fixed at 120 min and stirring rate was fixed at 500 rpm. After completion of catalytic biomass hydrogenation, the pressure vessel was depressurized, product gas was released as waste gas, product liquor was collected using vacuum filtration through 0.45 µm nylon filter, and proceed to EG yield quantification.
2.4. EG Yield Quantification
Polyhydric alcohol yield quantification was conducted using high-performance liquid chromatography (HPLC) (Agilent Technologies 1260 series) equipped with a refractive index detector (RID). Two (2) units of Shodex SC-1011 (8.0 mm I.D., 300 mm length) analytical columns connected in series, equipped with its guard column SC-LC (6.0 mm I.D., 50 mm length) (Showa Denko, Toyama-shi, Japan) were installed in a column holder with a column temperature set at 353 K. Deionized water was flowed at a flow rate of 0.4 mL min−1 and RID temperature was maintained at 313 K while 10 µL of product liquor was injected into the system.
2.5. Design of Experiment, Statistical Analysis and Optimization
In this study, process parameters binary catalyst ratio (Raney Nickel to tungstic acid, RN:TA), temperature, pressure and ratio of tungstic acid to EFB (TA:EFB) were represented with codes A, B, C and D. The relative contributions of process parameters to response EG yield were determined using RSM. A CCD was employed to investigate the optimal process parameters for EG yield, and 18 experiments with two replicated at the center point were carried out. A statistical software, Design-Expert®®8 (DX8®®), developed by Stat-Ease, U.S.A. was used to generate randomized experimental conditions used for this work so that the effect of unexplained variability on the observed responses could be minimized. Table 1 summarizes the range and levels of each of the variables.

Table 1.
Range and levels of variables.
The default CCD option for alpha set was to get a rotatable design with the axial (star) points set at 1.68179 coded unit from the center. This is a conventional choice for CCD and this should produce less extreme and hence a more practical value for our factors A-D [35].
Then RSM analysis was performed to obtain 3D surface graphs between variables (factors A, B, C, D) and response (EG yield). Analysis of variance (ANOVA) was used to statistically test the experimental results at a significance level of p = 0.05. It was also important to have a high p-value for Lack of Fit (LOF) before accepting the model. If p-value of LOF is low, i.e., ≤ 0.05, a check on residual plots is necessary to identify possible outliers and got them removed from the model in order to get an adequate model. Additionally, coefficient of determination (R2) could be used to check the model adequacy.
Once model was ascertained, using the “Optimization” feature of DX8®®. Process parameters optimizing EG yield can be generated after the following is defined:
- Determine goal of each factor and response to be either maximize, minimize or in range;
- Set upper and lower limit for each factor and response;
- Set importance weightage for each factor and response (1 being least important, 5 being paramount).
From the solutions generated by “Optimization”, desirability closest to 1 were chosen to validate the model using the experiment.
3. Results and Discussion
3.1. Empty Fruit Bunches (EFB) Characterisation
The untreated and pre-treated EFB fibre characteristics were tabulated in Table 2. EFB characterization in this work wwas done in accordance to the method reported by Zawawi et al. [34]. Alkaline pre-treatment managed to give 54.31% delignification efficiency and comparatively increased cellulose content to 62.31% from its initial cellulose content before alkaline pre-treatment. These results further confirmed the EFB delignification model developed by Zawawi et al. was functional and the model developed was comparable with the pre-treatment work done by other groups of researchers that had a delignification efficiency between 10% and 71% [34,36,37,38,39,40,41,42].
Table 2.
Characteristics of untreated and pre-treated EFB.
3.2. Design of Experiments
Temperature (factor B) and hydrogen pressure (factor C) were chosen as parameters to study in this work because previously the work reported by Ji et al. and Luo et al. stated that they were the two main parameters affecting product yield and selectivity [9,13]. Moreover, hydrogen partial pressure would affect hydrogenation efficiency whereas temperature would affect retro-aldol reaction, and these two would eventually affect EG yield. The other two new parameters of mass ratio of binary catalyst (RN:TA) (factor A) as well mass ratio of catalyst to biomass (TA:EFB) (factor D) were chosen in this study due to their limited information reported. All 18 experiments run were completed and their respective EG yield was quantified. Factor A was 0.80–1.20, factor B was 18–25 bar (g), factor C was 230–250 °C (503–523 K) whereas factor D was 0.060–0.100. Table 3 summarizes the CCD experimental conditions and respective EG yield.
Table 3.
Central composite design (CCD) and EG yield.
EG yield for all runs were in the range of 10.73 to 26.54 wt.%, with run no. 10 giving the lowest EG yield. When biomass hydrogenation was conducted at a temperature below 230 °C (503 K), more than 80% of biomass was found to be unreacted after the reaction ended. These results echoed the findings reported by Luo et al. that reaction temperatures above 503 K were required for stronger acidity that would favor cellulose hydrolysis, which was reflected by the disappearance of the partially hydrolysed products cellobiose and cellotriose [13]. Yu and Wu also reported that temperature played a vital role in hydrothermal conversion of cellulose, a temperature of 473–643 K and a pressure of 4–20 MPa were required to maintain water in its liquid state [43]. Ion product of water, H3O+ and OH−, defined as the product of the concentration of acidic and basic forms of water, can be formed at this temperature range [43,44]. Massive ion product formation of water happened between 473 K and 643 K and achieved its maximum at 523 K [44,45]. This allowed water to produce H3O+ protons at elevated temperatures, and promoted cellulose hydrolysis even without the presence of a catalyst [44].
At temperatures above 250 °C (523 K), sticky char formation was observed. The increase in temperature led to more water ion product formation, and higher acidity resulted in more C–C bond formation hence increasing the formation of sticky char. The remaining 11.08% lignin that was still present in the pre-treated EFB might have formed intramolecular condensation that led to sticky char formation. Through glycome profiling, Sebran et al. [46] discovered that 6.19 wt.% of lignin would still be present after harsh alkaline pre-treatment was performed on EFB, as alkaline pre-treatment could only remove the outer layer of lignin completely but the inner lignin structure would still remain intact.
3.3. Response Surface Analysis and Analysis of Variance (ANOVA)
The RSM model generated was first checked by examining the residuals plot and external studentized residuals plot, as shown in Figure 1A,B, respectively. Residuals showed the difference between actual and predicted response values [35]. Assuming the model holds, external studentized residual was used to check whether a run was consistent with other runs, whereas the model coefficients were calculated based on all design points except one and a prediction of the response at this point was made, where any value greater than the calculated standard error, usually between absolute value of 3 and 4, meant that this point should be examined as a possible outlier [35].
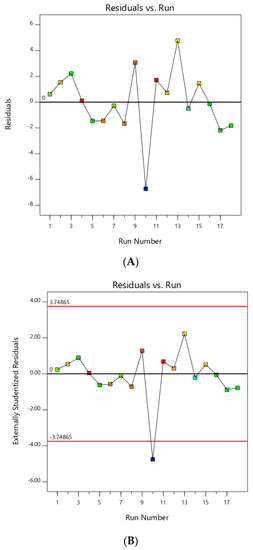
Figure 1.
(A) Residuals plot; (B) externally studentized residuals plot before outlier elimination.
Referring to Figure 1B, run no. 10 appeared to be an outlier as it estimated standard errors of −4.752, which was larger than the calculated standard error of ±3.748. Figure 1A further confirmed that run no. 10 was an outlier due to its large difference between actual and predicted values of −6.71. This explained why an EG yield of run no. 10 showed abnormal results of lower-than-normal EG yield. Therefore, run no. 10 was subsequently ignored and new plots were generated in Figure 2 showing no outliers in these plots.
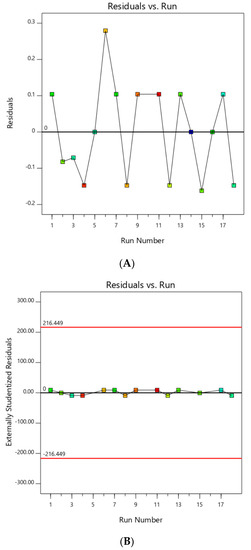
Figure 2.
(A) Residuals plot; (B) Externally studentized residuals plot after outlier elimination.
Table 4 shows the fit summary of the response surface model upon removing the outlier. The linear model and quadratic model were suggested by DX8®® due to their model p-value that was below 0.05. Although the linear model had a lower p-value of 0.0019, its lower p-value of 0.0241 for lack of fit (LOF) and lower adjusted R2 value of 0.6455 were however not desirable for a good model. Hence, the quadratic model with a p-value of 0.0227 but higher adjusted R2 value of 0.9845 and higher p-value of 0.0697 for LOF, would be desirable for our application. Selection criteria is the model with the highest order of polynomial where the additional terms are significant, and the model should not be aliased [35].
Table 4.
Fit summary of response surface model.
In order to obtain a more significant model and improve LOF (by having higher p-value of LOF), ANOVA was reduced by removing one insignificant factor, i.e., A2 (the second-order term confounded with main factor A). ANOVA of the reduced quadratic model and its fit statistics are summarized in Table 5.
Table 5.
ANOVA for reduced quadratic model and its fit statistics.
The model had an F-value of 112.13, indicating the model was significant. There was only a 0.12% chance that an F-value this large could occur due to noise. The Lack of Fit (LOF) of this model had an F-value of 43.88, implying that the LOF was not significant relative to the pure error. There was a 10.61% chance that a LOF with the F-value this large could occur due to noise. An insignificant LOF was good as we wanted the model to fit [35]. Insignificant LOF indicates that our model does not have unexplainable differences between replicates [35].
The reduced quadratic model had an adjusted R2 value of 0.9890, and this adjusted R2 calculated the percentage of response variation contributed by significant factors, i.e., factors with a p-value < 0.05. Adequate Precision measures the signal to noise ratio and a ratio greater than 4 is desirable for a good prediction model [35]. This reduced quadratic model had an adequate precision of 38.885, and therefore it could be used to navigate the design space and also to optimize EG yield by varying the four factors studied [35].
The ANOVA summary showed that EG yield was highly dependent on all four factors studied, i.e., A, B, C, D and second order terms confounded with main factors like AC, AD, BC, BD, CD, B2, C2, D2 were also significant model terms. Figure 3 shows the factor interaction contour between A and C as well as C and D, with respect to EG yield. Operating factors that led to the red zone would lead to the desired outcome of higher EG yield of above 25 wt.%.
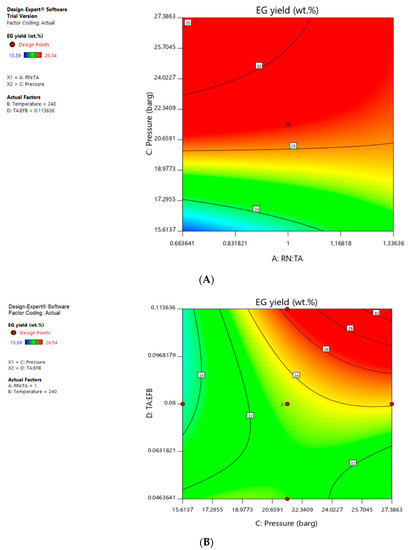
Figure 3.
(A) Factor interaction contour between factor A (Raney Ni to tungstic acid) and factor C (pressure) when factor B is 240 °C and factor D is 0.114; (B) Factor interaction contour between factor C (Pressure) and factor D (tungstic acid to EFB) when factor A is 1.00 and factor B is 240 °C.
The RSM proposed the following equation to predict EG yield for given levels of each factor, in their original units:
EG yield = −764.52 + 11.51A + 5.58B + 6.18C + 647.95D + 0.23AB − 1.86AC −
261.31AD − 0.02BC – 3.85BD + 17.95CD – 0.01B2 – 0.04C2 + 1299.77D2
261.31AD − 0.02BC – 3.85BD + 17.95CD – 0.01B2 – 0.04C2 + 1299.77D2
3.4. EG Yield Optimization and Verification
By using this model and employing “Optimization” feature of DX8®®, we set constraints for each factor which included their corresponding goal, limit and importance, in order to maximize EG yield, as shown in Table 6.
Table 6.
Constraints for each of the factors used in the Optimization feature of DX8®®.
By applying the desirability function method, the optimal process parameters that gave a desirability of 1 suggested optimal EG yield to be at 26.89 wt.% with the following conditions:
- Mass ratio for Raney nickel to tungstic acid = 0.96;
- Temperature = 240 °C;
- Pressure = 24.8 bar(g); and
- Mass ratio of tungstic acid to EFB = 0.10.
Pressure vessel with different sizes (1.5-L and 18.75-L) were used to verify the suggested optimal process parameters and Table 7 shows the results of these verification runs.
Table 7.
Verification runs for model validation.
Under the optimal conditions, the predicted and actual EG yield were very close and within the standard deviation of the data. The suggested optimum EG yield from this quadratic model is >25 wt.% and our RSM model was successfully ascertained and reproduced in the laboratory. This quadratic model could be used to predict EG yield for future work.
4. Conclusions
Using DX8®®, a quadratic model was developed which identifies factors like binary catalyst ratio (A), pressure (C) and catalyst to feedstock ratio (D), and their confounding factors as significant. Temperature (B) was comparatively less significant due to the narrow temperature range that we studied. As suggested by DX8®®, one of the optimum parameters to obtain an optimized EG yield of 26.89 wt.% would be having a binary catalyst ratio (Raney Nickel to tungstic acid) of 0.96, a temperature of 240 °C (513 K), a pressure of 24.8 bar (g) and catalyst (tungstic acid) to EFB ratio of 0.10.
Having a high coefficient of determination (R2) value of more than 0.98, the quadratic model developed in this study could be used to give a precise EG yield prediction even when the four parameters are being modified in the future. Although many research groups had reported their findings on glucose, cellulose or biomass hydrogenation for EG production, there wasn’t any literature reporting effects of factors as well as effects of confounding factors affecting EG yield. This study has been able to fill in this missing gap nicely.
Author Contributions
Conceptualization, A.S.H. and P.G.L.; methodology, investigation, validation and writing—original draft preparation, P.G.L.; resources and formal analysis, P.G.L. and N.H.S.; data curation and visualization, P.G.L. and A.Z.Z.; writing—review and editing, A.S.H., P.G.L. and N.H.S.; project administration, supervision and funding acquisition, A.S.H. All authors discussed the results and contributed to the final version of the manuscript.
Funding
This research was supported by PETRONAS and PETRONAS Chemical Group Bhd (PCGB).
Acknowledgments
The authors would like to acknowledge PETRONAS and PETRONAS Chemical Group Bhd (PCGB) for funding this work.
Conflicts of Interest
The authors declare no conflicts of interest.
References
- Zhang, T.; Zheng, M.; Ji, N.; Wang, A.; Shu, Y.; Wang, H.; Wang, X.; Chen, J.; Inventor. Dalian Institute of Chemical Physics, Chinese Academy of Sciences, Assignee. Method of Preparing Ethylene Glycol from Cellulose. U.S. Patent No. US7960594 B2, 24 October 2008. [Google Scholar]
- Tai, Z.; Zhang, J.; Wang, A.; Zheng, M.; Zhang, T. Temperature-controlled phase-transfer catalysis for ethylene glycol production from cellulose. Chem. Commun. 2012, 48, 7052–7054. [Google Scholar] [CrossRef]
- Wang, A.; Zhang, T. One-pot conversion of cellulose to ethylene glycol with multifunctional tungsten-based catalysts. Acc. Chem. Res. 2013, 46, 1377–1386. [Google Scholar] [CrossRef]
- Zheng, M.; Pang, J.; Wang, A.; Zhang, T. One-pot catalytic conversion of cellulose to ethylene glycol and other chemicals: From fundamental discovery to potential commercialization. Chin. J. Catal. 2014, 35, 602–613. [Google Scholar] [CrossRef]
- Ji, N.; Zhang, T.; Zheng, M.; Wang, A.; Wang, H.; Wang, X.; Chen, J. Cover picture: direct catalytic conversion of cellulose into ethylene glycol using nickel-promoted tungsten carbide catalysts. Angew. Chem. Int. Ed. 2008, 47, 8321–8534. [Google Scholar] [CrossRef]
- Zheng, M.; Wang, A.; Ji, N.; Pang, J.; Wang, X.; Zhang, T. Transition metal-tungsten bimetallic catalysts for the conversion of cellulose into ethylene glycol. ChemSusChem 2010, 3, 63–66. [Google Scholar] [CrossRef]
- Ji, N.; Zheng, M.; Wang, A.; Zhang, T.; Chen, J. Nickel promoted tungsten carbide catalysts for cellulose conversion: effect of preparation methods. ChemSusChem 2012, 5, 939–944. [Google Scholar] [CrossRef] [PubMed]
- Tai, Z.; Zhang, J.; Wang, A.; Pang, J.; Zheng, M.; Zhang, T. Catalytic conversion of cellulose to ethylene glycol over a low-cost binary catalyst of Raney Ni and tungstic acid. ChemSusChem 2013, 6, 652–658. [Google Scholar] [CrossRef] [PubMed]
- Ji, N.; Zhang, T.; Zheng, M.; Wang, A.; Wang, H.; Wang, X.; Shu, Y.; Stottlemyer, A.L.; Chen, J. Catalytic conversion of cellulose into ethylene glycol over supported carbide catalysts. Catal. Today 2009, 147, 77–85. [Google Scholar] [CrossRef]
- Xiao, Z.; Jin, S.; Pang, M.; Liang, C. Conversion of highly concentrated cellulose to 1,2-propanediol and ethylene glycol over highly efficient CuCr catalysts. Green Chem. 2013, 15, 891–895. [Google Scholar] [CrossRef]
- Zhou, L.; Wang, A.; Li, C.; Zheng, M.; Zhang, T. Selective production of 1, 2-propylene glycol from Jerusalem Artichoke Tuber using Ni-W2C/AC catalysts. ChemSusChem 2012, 5, 932–938. [Google Scholar] [CrossRef]
- Zhao, G.; Zheng, M.; Zhang, J.; Wang, A.; Zhang, T. Catalytic conversion of concentrated glucose to ethylene glycol with semi-continuous reaction system. Ind. Eng. Chem. Res. 2013, 52, 9566–9572. [Google Scholar] [CrossRef]
- Luo, C.; Wang, S.; Liu, H. Cellulose conversion into polyols catalyzed by reversibly formed acids and supported ruthenium clusters in hot water. Angew. Chem. Int. Ed. 2007, 46, 7636–7639. [Google Scholar] [CrossRef]
- Deng, T.; Liu, H. Promoting effect of SnOx on selective conversion of cellulose to polyols over bimetallic Pt–SnOx/Al2O3catalysts. Green Chem. 2013, 15, 116–124. [Google Scholar] [CrossRef]
- Xu, G.; Wang, A.; Pang, J.; Zheng, M.; Yin, J.; Zhang, T. Remarkable effect of extremely dilute H2SO4 on the cellulose conversion to ethylene glycol. Appl. Catal. A Gen. 2015, 502, 65–70. [Google Scholar] [CrossRef]
- Zhang, K.; Wu, S.; Yang, H.; Yin, H.; Li, G. Catalytic conversion of cellulose for efficient ethylene glycol production and insights into the reaction pathways. RSC Adv. 2016, 6, 77499–77506. [Google Scholar] [CrossRef]
- Baek, I.G.; You, S.J.; Park, E.D. Direct conversion of cellulose into polyols over Ni/W/SiO2-Al2O3. Bioresour. Technol. 2012, 114, 684–690. [Google Scholar] [CrossRef]
- Liu, Y.; Luo, C.; Liu, H. Tungsten trioxide promoted selective conversion of cellulose into propylene glycol and ethylene glycol on a ruthenium catalyst. Angew. Chem. Int. Ed. 2012, 51, 3249–3253. [Google Scholar] [CrossRef]
- Gu, M.; Shen, Z.; Yang, L.; Dong, W.; Kong, L.; Zhang, W.; Peng, B.; Zhang, Y. Reaction route selection for cellulose hydrogenolysis into C2/C3 glycols by ZnO-modified Ni-W/β-zeolite catalyst. Sci. Rep. 2019, 9, 11938. [Google Scholar] [CrossRef]
- Ooms, R.; Dusselier, M.; Geboers, J.A.; Op de Beeck, B.; Verhaeven, R.; Gobechiya, E.; Martens, J.A.; Redl, A.; Sels, B.F. Conversion of sugars to ethylene glycol with nickel tungsten carbide in a fed-batch reactor: High productivity and reaction network elucidation. Green Chem. 2014, 16, 695–707. [Google Scholar] [CrossRef]
- Sun, R.; Wang, T.; Zheng, M.; Deng, W.; Pang, J.; Wang, A.; Wang, X.; Zhang, T. Versatile nickel–lanthanum(III) catalyst for direct conversion of cellulose to glycols. ACS Catal. 2015, 5, 874–883. [Google Scholar] [CrossRef]
- You, S.J.; Baek, I.G.; Park, E.D. Direct conversion of cellulose into polyols over Pt/CsxH3-xPW12O40. Clean Technol. 2013, 19, 13–21. [Google Scholar] [CrossRef]
- Xi, J.; Ding, D.; Shao, Y.; Liu, X.; Lu, G.; Wang, Y. Production of ethylene glycol and its monoether derivative from cellulose. ACS Sustain. Chem. Eng. 2014, 2, 2355–2362. [Google Scholar] [CrossRef]
- Wang, H.; Zhu, L.; Peng, S.; Peng, F.; Yu, H.; Yang, J. High efficient conversion of cellulose to polyols with Ru/CNTs as catalyst. Renew. Energy 2012, 37, 192–196. [Google Scholar] [CrossRef]
- Beine, A.K.; Hausoul, P.J.C.; Palkovits, R. Production of ethylene and propylene glycol from lignocellulose. In Chemicals and Fuels from Bio-Based Building Blocks; Chapter 10; Wiley-VCH Verlag GmbH & Co. KGaA: Weinheim, Germany, 2016; pp. 245–270. [Google Scholar] [CrossRef]
- Li, H.; Fang, Z.; Smith, R.L.; Yang, S. Efficient valorization of biomass to biofuels with bifunctional solid catalytic materials. Prog. Energy Combust. Sci. 2016, 55, 98–194. [Google Scholar] [CrossRef]
- Czitrom, V. One-Factor-at-a-time versus designed experiments. Am. Statist. 1999, 53, 126–131. [Google Scholar] [CrossRef]
- Asadi, N.; Zilouei, H. Optimization of organosolv pretreatment of rice straw for enhanced biohydrogen production using Enterobacter aerogenes. Bioresour. Technol. 2017, 227, 335–344. [Google Scholar] [CrossRef]
- Yasin, Y. Optimization of bio catalytic biodiesel production from pomace oil using response surface methodology. Fuel Process Technol. 2012, 99, 97–102. [Google Scholar] [CrossRef]
- Yatish, K.V.; Lalithamba, H.S.; Suresh, S.B.; Arun, S.B.; Vinay Kumar, P. Optimization of scum oil biodiesel production by using response surface methodology. Process Saf. Environ. 2016, 102, 667–672. [Google Scholar] [CrossRef]
- Silva, G.F.; Camargo, F.L.; Ferreira, A.L.O. Application of response surface methodology for optimization of biodiesel production by transesterification of soybean oil with ethanol. Fuel Process Technol. 2011, 92, 407–413. [Google Scholar] [CrossRef]
- Renita, A.A.; Amarnath, J.D.; Sivasubramanian, S. A study on the optimization of algal biodiesel reaction parameters using response surface methodology. Int. J. Chem. Eng. Appl. 2012, 3, 311–314. [Google Scholar] [CrossRef]
- Rajendran, R.; Kanimozhi, B.; Prabhavathi, P.; Dinesh Kumar, S.; Santhanam, P.; Abirami, M.; Karthik Sundaram, S.; Manikandan, A. A method of Central Composite Design (CCD) for optimization of biodiesel production from chlorella vulgaris. J. Pet. Environ. Biotechnol. 2015, 6. [Google Scholar] [CrossRef]
- Zawawi, A.Z.; Gaik, L.P.; Sebran, N.H.; Othman, J.; Hussain, A.S. An Optimisation study on biomass delignification process using alkaline wash. Biomass Conv. Bioref. 2017, 8, 59–68. [Google Scholar] [CrossRef]
- Vaughn, N.; Helseth, T. Design Expert 8 [Software]; Stat-Ease, Inc.: Minneapolis, MN, USA, 2016; Available online: https://www.statease.com/ (accessed on 31 August 2012).
- Nieves, D.C.; Karimi, K.; Horvath, I.S. Improvement of biogas production from oil palm empty fruit bunches (OPEFB). Ind. Crops Prod. 2011, 34, 1097–1101. [Google Scholar] [CrossRef]
- Whitcomb, P.J.; Larntz, K. The role of pure error on normal probability plots. In Proceedings of the Transactions of the 46th Annual Quality Congress, Milwaukee, WI, USA, 18–20 May 1992. [Google Scholar]
- Akhtar, J.; Teo, C.L.; Lai, L.W.; Hassan, N.; Idris, A.; Aziz, R.A. Factors affecting delignification of oil palm empty fruit bunch by microwave-assisted dilute acid/alkali pre-treatment. Bioresources 2015, 10, 588–596. [Google Scholar]
- Muryanto, E.T.; Haznan, A.; Agung, C.; Effendi, T.C.; Yanni, S. Alkaline delignification of oil palm empty fruit bunch using black liquor from pretreatment. Proced. Chem. 2015, 16, 99–105. [Google Scholar] [CrossRef]
- Hong, J.Y.; Kim, Y.S.; Oh, K.K. Fractionation and delignification of empty fruit bunches with low reaction severity for high sugar recovery. Bioresour. Technol. 2013, 146, 176–183. [Google Scholar] [CrossRef]
- Choi, W.I.; Park, J.Y.; Lee, J.P.; Oh, Y.K.; Park, Y.C.; Kim, J.S.; Park, J.M.; Kim, C.H.; Lee, J.S. Optimization of NaOH catalyzed steam pretreatment of empty fruit bunch. Biotechnol. Biofuels 2013, 6. [Google Scholar] [CrossRef]
- Hamisan, A.F.; Aziz, S.A.; Kamaruddin, K.; Md Shah, U.K.; Shahab, N.; Hassan, M.A. Delignification of oil palm empty fruit bunch using chemical and microbial pretreatment methods. Int. J. Agric. Res. 2009, 4, 250–256. [Google Scholar] [CrossRef]
- Yu, Y.; Wu, H. Understanding the primary liquid products of cellulose hydrolysis in hot-compressed water at various reaction temperatures. Energy Fuels 2010, 24, 1963–1971. [Google Scholar] [CrossRef]
- Kruse, A.; Dahmen, N. Water—A magic solvent for biomass conversion. J. Supercrit. Fluid. 2015, 96, 36–45. [Google Scholar] [CrossRef]
- Pang, J.; Zheng, M.; Sun, R.; Song, L.; Wang, A.; Wang, X.; Zhang, T. Catalytic conversion of cellulosic biomass to ethylene glycol: Effects of inorganic impurities in biomass. Bioresour. Technol. 2015, 175, 424–429. [Google Scholar] [CrossRef] [PubMed]
- Sebran, N.H.; Gaik, L.P.; Hussain, A.S. Structural analysis on the effect of base-catalysed delignification process parameters on palm oil empty fruit bunches fibres using glycome profiling. In IOP Conference Series: Materials Science and Engineering; IOP Publishing: Bristol, UK, 2018; Volume 458, p. 012070. [Google Scholar] [CrossRef]


© 2020 by the authors. Licensee MDPI, Basel, Switzerland. This article is an open access article distributed under the terms and conditions of the Creative Commons Attribution (CC BY) license (http://creativecommons.org/licenses/by/4.0/).