Article

Metabolic Regulation Analysis of Ajmalicine Biosynthesis Pathway in Catharanthus roseus (L.) G. Don Suspension Culture Using Nanosensor

1
Department of Botany, Aligarh Muslim University, Aligarh 202002, India
2
Botany and Microbiology Department, College of Science, King Saud University, P.O. Box. 2455, Riyadh 11451, Saudi Arabia
*
Author to whom correspondence should be addressed.
Processes 2020, 8(5), 589; https://doi.org/10.3390/pr8050589
Submission received: 24 April 2020 / Revised: 8 May 2020 / Accepted: 11 May 2020 / Published: 15 May 2020
(This article belongs to the Special Issue Production and Biomedical Applications of Bioactive Compounds)

Abstract

:
Ajmalicine is one of the most popular antihypertensive drugs obtained from the root barks of Cathranthus roseus (L.) G. Don and Rauvolfia serpentine (L.) Benth. ex Kurz. It has also potential antimicrobial, cytotoxic, central depressant and antioxidant activities. As the demand for the alkaloid is significantly high, metabolic engineering approaches are being tried to increase its production in both homologous and heterologous systems. The metabolic engineering approach requires knowledge of the metabolic regulation of the alkaloid. For understanding the metabolic regulation, fluxomic analysis is important as it helps in understanding the flux of the alkaloid through the complicated metabolic pathway. The present study was conducted to analyse the flux analysis of the ajmalicine biosynthesis, using a genetically encoded Fluorescent Resonance Energy Transfer FRET-based nanosensor for ajmalicine (FLIP-Ajn). Here, we have silenced six important genes of terpenoid indole alkaloid (TIA), namely G10H, 10HGO, TDC, SLS, STR and SDG, through RNA-mediated gene silencing in different batches of C. roseus suspension cells, generating six silenced cell lines. Monitoring of the ajmalicine level was carried out using FLIP-Ajn in these silenced cell lines, with high spatial and temporal resolution. The study offers the rapid, high throughput real-time measurement of ajmalicine flux in response to the silenced TIA genes, thereby identifying the regulatory gene controlling the alkaloid flux in C. roseus suspension cells. We have reported that the STR gene encoding strictosidine synthase of the TIA pathway could be the regulatory gene of the ajmalicine biosynthesis.

Graphical Abstract

1. Introduction

Ajmalicine is one of the most important monoterpenoid indole alkaloids. It is isolated from the root barks of Catharanthus roseus (L.) G. Don and Rauvolfia serpentina (L.) Benth. ex Kurz, where its synthesis occurs through the terpenoid indole alkaloid (TIA) pathway [1,2,3]. It is a well-known antihypertensive drug, and has also been utilized in the treatment of cardiovascular disorders [1,4]. Interestingly, it is also known to exhibit antimicrobial [5], cytotoxic [6], antioxidant [7], and central depressant activities [8]. Moreover, as it increases the cerebral blood flow, leading to improved oxygen bioavailability, it possesses intriguing potential in the treatment of Alzheimer’s disease, because the reduction of cerebral blood flow is a common symptom associated with Alzheimer’s disease and different forms of dementia [9,10]. Due to its high pharmaceutical significance, significant interest has been recorded in increasing the production of ajmalicine [1,11,12]. However, the in planta production of the terpene alkaloids is low, and chemical synthesis is unavailable. Moreover, the chemical extraction of these alkaloids is also influenced by the harvest season, environmental conditions, and local habitat [13]. Therefore, different production systems based on plant cell and tissue culture have been examined, utilizing the methods of elicitation and metabolic engineering in both homologous (same plant cells/tissues) and heterologous systems (different plant or microbial system) [14,15,16,17,18,19,20,21,22].
Although the elucidation of the terpenoid indole alkaloid (TIA) pathway involved in the biosynthesis of ajmalicine has been the area of intensive research, there is still room for the exploration of the regulatory gene controlling the ajmalicine flux. Knowledge of the metabolic pathway regulation is of critical importance prior to the plant metabolic engineering approach, as it avoids the need for repetitive and tedious designing, construction, and testing of the production outcomes. Moreover, the measurement of the metabolite concentration in the bulk population of cells requires multiple reaction-based, time-consuming, and expensive chromatographic techniques, which further slows down the process [23]. Therefore, two critical needs stand in the path of enhanced metabolite production, i.e., the rapid analysis and the identification of the regulatory gene. A potential solution to the problem at hand is the fluxomics study, which promises to identify the regulatory element affecting the flux of the metabolite in a metabolic pathway. Although techniques like mass spectrometry and nuclear magnetic resonance have contributed their potentiality in the flux study, the limitations of invasiveness, and poor spatial and temporal resolution, remain on the counter. One of the best approaches to address these limitations is the development of genetically encoded FRET-based nanosensors. These nanosensors retain the ability to non-invasively measure the concentration of a metabolite with high spatial and temporal resolution, and provide a high throughput evaluation of the system in consideration. Therefore, it can enable rapid testing of a large number of metabolic pathway designs. Another exciting feature of these nanosensors is the capability to monitor the metabolite level in real-time with single cell resolution, which can enhance the understanding of the complex interconnected metabolic pathways.
The present study undertakes the task of contributing better understanding of the metabolic regulation of the ajmalicine synthesis by identifying the regulatory gene controlling the ajmalicine flux through the FRET-based nanosensor for ajmalicine (FLIP-Ajn). The FLIP-Ajn was developed in our previous study [24]. An overview of the strategy involved in identification of the regulatory switch through FLIP-Ajn is given in Figure 1.
A set of six transgenic cell lines of C. roseus was developed in this study through the RNA-mediated gene silencing strategy. Each cell line harboured one silenced gene of the TIA pathway, namely Geraniol-10-Hydroxylase (G10H), 10-hydroxygeraniol oxidoreductase (10HGO), Tryptophan decarboxylase (TDC), secologanin synthase (SLS), strictosidine synthase (STR) and strictosidine-O-beta-D-glucosidase (SDG). Real-time monitoring of the flux of ajmalicine was carried out in these cell lines using the FLIP-Ajn. The study promises to identify the regulatory gene controlling the synthesis of ajmalicine and, hence, gives an opportunity to enhance the production and yield of ajmalicine.

2. Materials and Methods

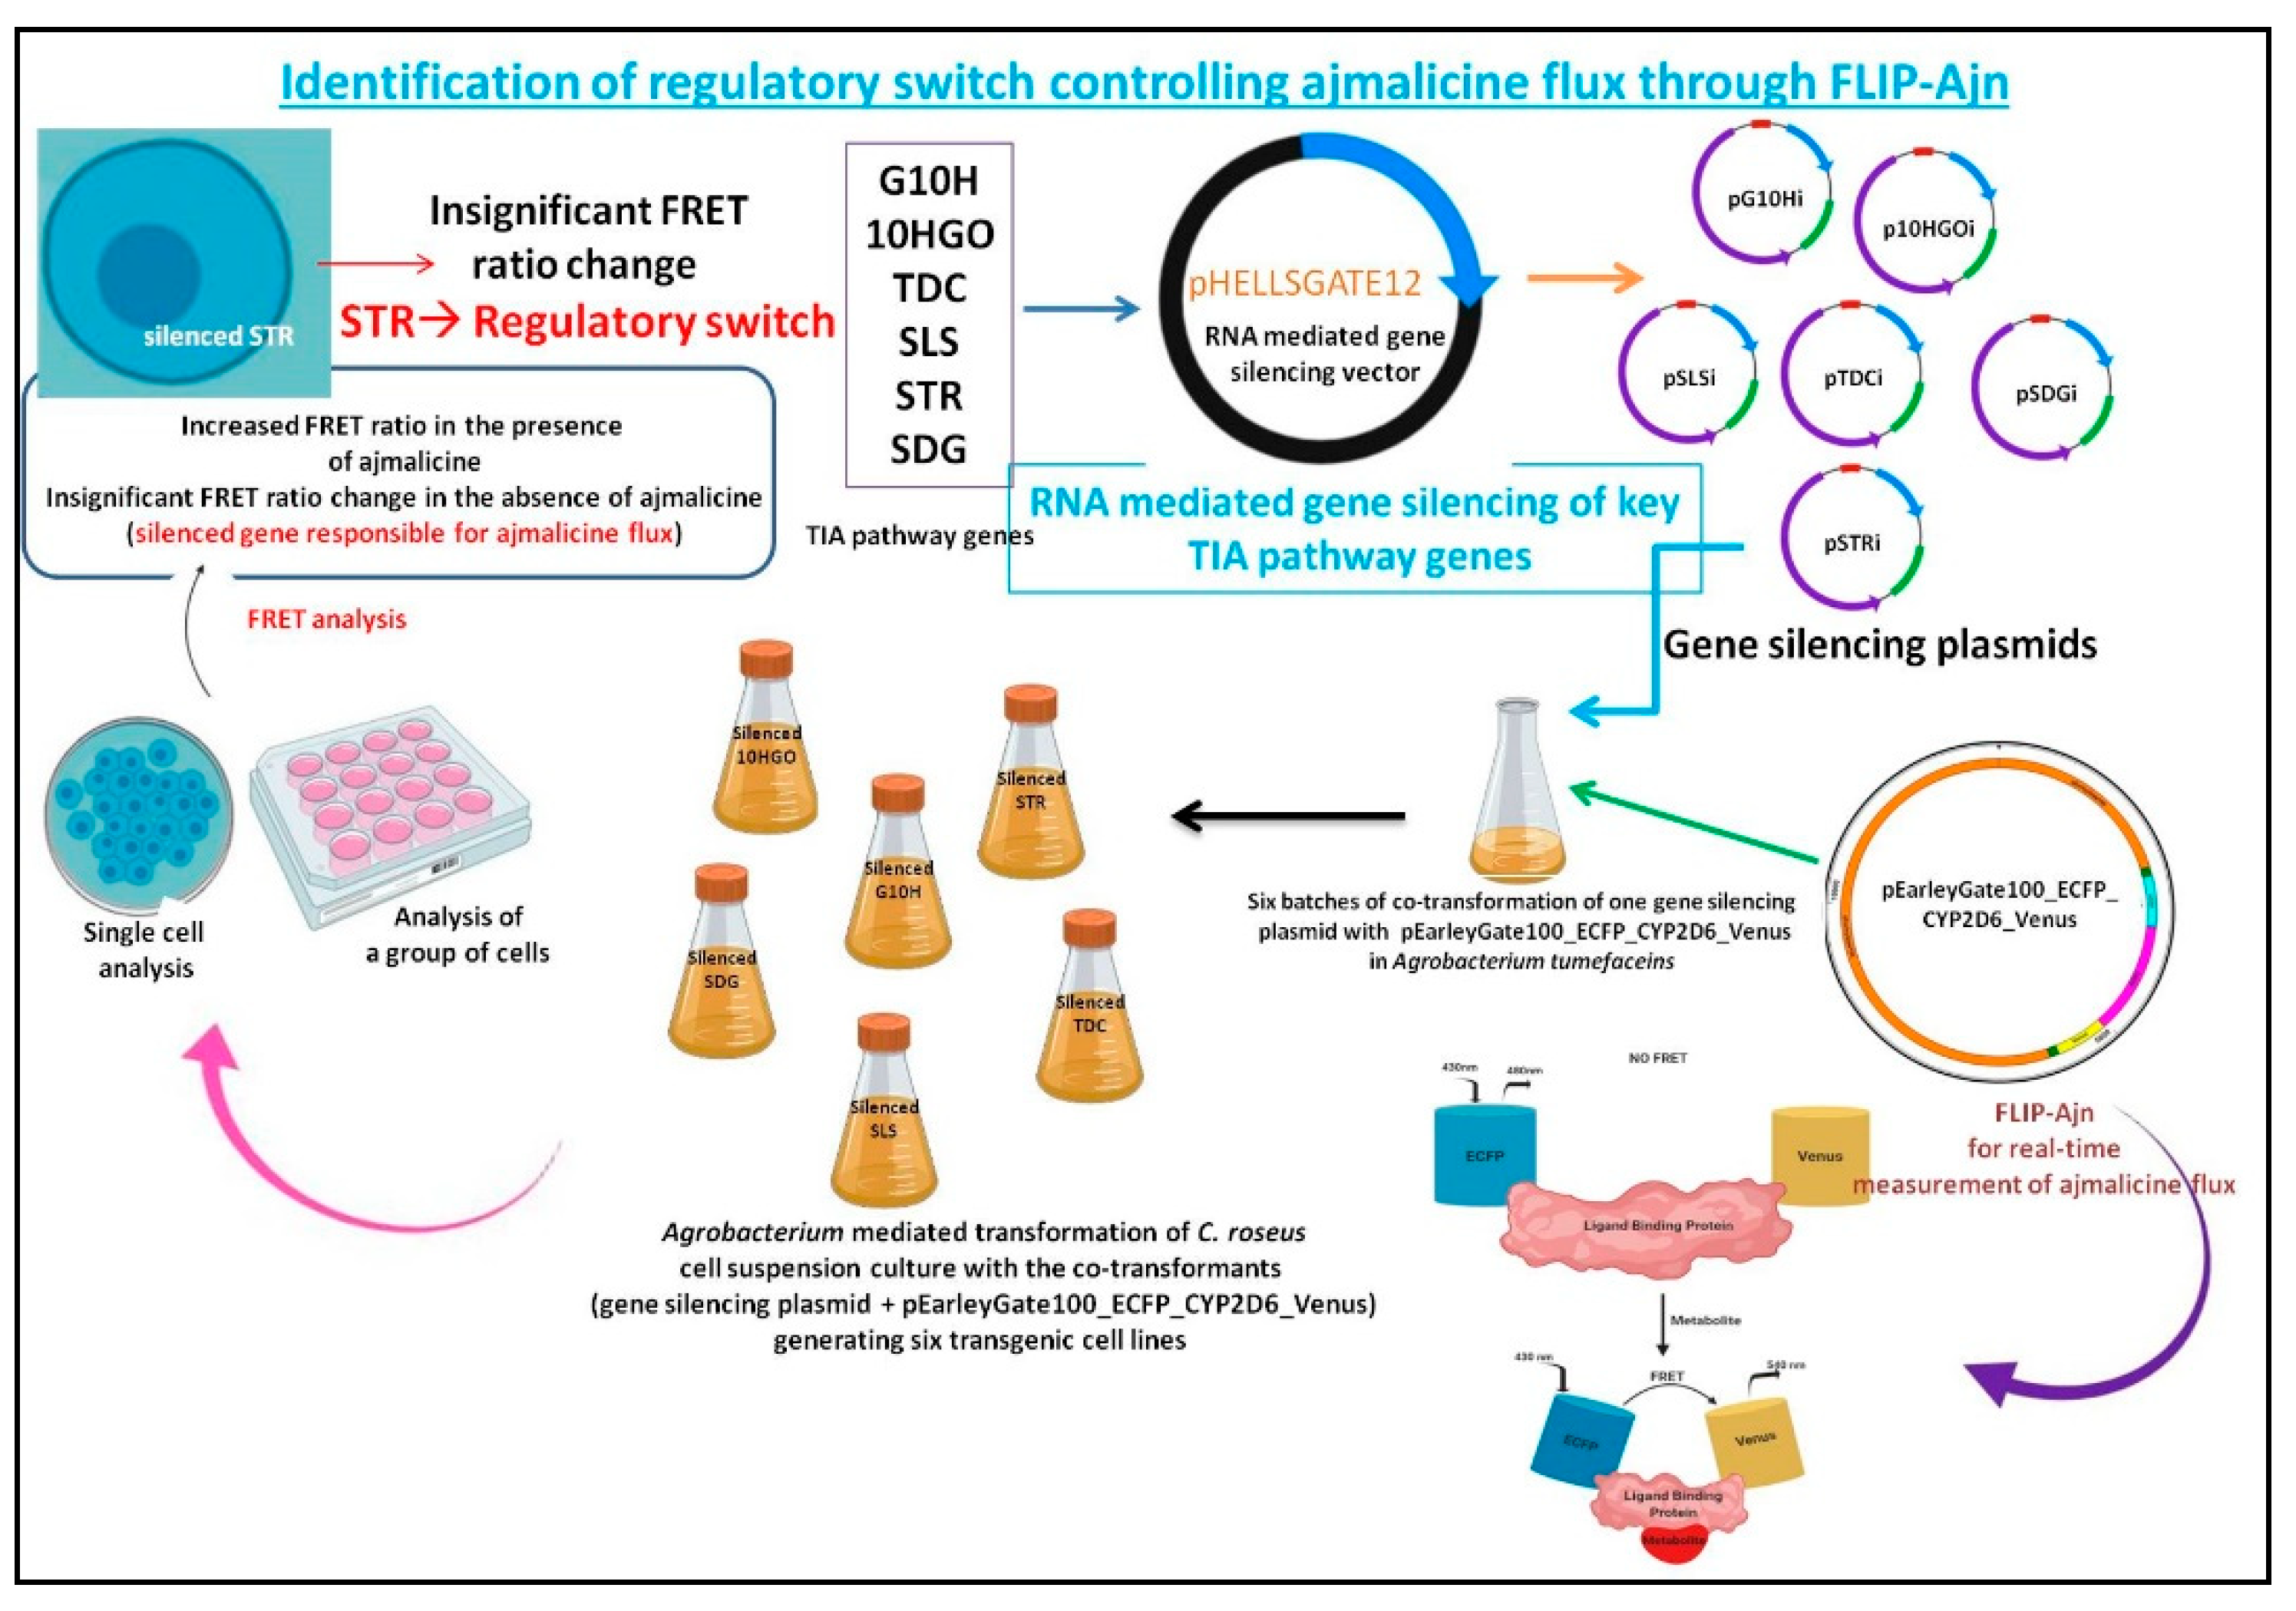
2.1. Development of the TIA Pathway Silenced Lines

The mRNA of the C. roseus seedling was used for reverse-transcription PCR (Polymerase Chain Reaction) amplification of the 5′ end of Geraniol 10 Hydroxylase (G10H) ORF, 10-hydroxygeraniol oxidoreductase (10HGO) ORF, Tryptophan decarboxylase (TDC) ORF, secologanin synthase (SLS) ORF, strictosidine synthase (STR) ORF, and strictosidine-O-beta-D-glucosidase (SDG) ORF. The amplified sequences showed no sequence homology to any known Catharanthus roseus gene. The forward and reverse primers included attB1 and attB2 sites, respectively, as listed in Supplementary Table S1. The amplified PCR products were cloned in pDONR 222 (Gateway donor vector) in a BP clonase-mediated recombination reaction for the generation of entry clones, namely, pDONR222_G10H, pDONR222_10HGO, pDONR222_TDC, pDONR222_SLS, pDONR222_STR and pDONR222_SDG. These entry clones were further inserted into pHELLSGATE12 (Addgene, Watertown, MA, USA), a binary gateway vector that silences genes in plants through intron containing hairpin RNA. The reaction was mediated by LR clonase, and a set of six gene-silencing pG10Hi, p10HGOi, pTDCi, pSLSi, pSTRi, and pSDGi expression clones were generated as described in the earlier study [25].
The recombinant construct of the FLIP-Ajn (pEarleyGate100_ECFP_CYP2D6_Venus) for the real-time visualization of ajmalicine flux in plant cells was employed here. The Agrobacterium tumefaceins EHA105 strain was co-transformed with the pEarleyGate100_ECFP_CYP2D6_Venus and gene-silencing plasmids pG10Hi, p10HGOi, pTDCi, pSLSi, pSTRi, and pSDGi separately, through electroporation, as described earlier [25]. Separate batches for co-transformations were conducted for pEarleyGate100_ECFP_CYP2D6_Venus and one gene-silencing plasmid at a time, yielding six bacterial cell lines transformed with pEarleyGate100_ECFP_CYP2D6_Venus and pG10Hi/p10HGOi/pTDCi/pSLSi/pSTRi/pSDGi.

2.2. Generation of Transgenic C. roseus Cell Lines

To determine the regulatory gene involved in the biosynthesis of ajmalicine through the genetically encoded FRET based nanosensor for ajmalicine, a set of six transgenic cell lines of C. roseus were generated. The suspension culture of Symphytum officinale was also established as per the method reported earlier [26], and used as control.

2.3. Explant

For the growth of callus, leaf explants were selected in the study. Fresh leaves were collected from the C. roseus plants grown in the herbal garden of Jamia Hamdard, New Delhi. The collected leaves were washed under tap water consistently for 20 min, after which they were sterilized by the treatment of 0.5% cetrimide for 10 min. The leaves were also given treatment with 0.1% HgCl2 for 5 min in the following step. Next, the explants were soaked in 70% alcohol for 1 min, and finally, the alcohol was removed by washing the explants with sterilized, double distilled water for 1 min. The callus was produced in culture tubes containing Murashige and Skoog (MS) medium, supplemented with 0.5 μM2, 4-dichlorophenoxyacetic acid (2, 4-D). The MS medium also contained 3% sucrose and 0.62% agar, and the pH was set to 5.65. The culturing was performed at 25 ± 2 °C in the culture room.

2.4. Transformation and Co-Cultivation

The method of transformation and co-cultivation was followed as per our previous study [24]. A single colony of A. tumefaceins EHA105, co-transformed with the nanosensor construct (pEarleyGate100_ECFP_CYP2D6_Venus) and the gene-silencing plasmid (pG10Hi/p10HGOi/pTDCi/pSLSi/pSTRi/pSDGi), was inoculated in Luria Bertani (LB) media containing 50 mg/L spectinomycin, 50 mg/L kanamycin and 50 mg/L rifampicin. Separate transformation and co-cultivation batches were carried out for the different gene-silencing constructs. The transformed cells were allowed to grow in an incubator shaker (150 rpm) at 28 °C for 36 h. After that, the callus lines maintained in the culture room were collected and dipped in the agrobacterial suspension culture. The culture was then kept in an incubator shaker at 28 °C (150 rpm) till optical density (O.D.600) reached 0.6. Further, the calluses were dried by placing onto a sterile filter paper, and thereafter co-cultured with the Agrobacterial suspension culture containing MS and 100 μM acetosyringone at 25 ± 2 °C for 3 days. In the following steps, the calluses were washed with 500 mg/L cefotaxime and distilled water to remove the excess bacteria. Finally, the explants were dried and transferred to a selection medium comprised of MS, 0.5 μM 2, 4-D, 50 mg/mL spectinomycin, 10 mg/L BASTA®, and 250 mg/L cefotaxime. Further, the antibiotic and cefotaxime were removed from the medium, and the culture was kept at 25 ± 2 °C under a 16 h photoperiod. Six sets of cell lines harboring the nanosensor (pEarleyGate100_ECFP_CYP2D6_Venus) and each gene-silencing plasmid (pG10Hi/p10HGOi/pTDCi/pSLSi/pSTRi/pSDGi) were generated in the study.

2.5. Elicitation

The elicitation was performed with 14 day-old suspension culture of each cell line in a fresh medium, supplemented with 50 mM β-CD (Sigma-Aldrich, St. Louis, MO, USA) and 100 µM Methyl Jasmonate (Sigma-Aldrich, St. Louis, MO, USA), as described in previous study [12]. The cells from all the six cell lines were separately washed with cold distilled water and then transferred to separate elicitation mediums. The culturing was performed in dark at 25 °C with constant shaking at 110 rpm.

2.6. FRET Analysis

The elicited plant cell culture containing the transiently expressed FLIP-Ajn (pEarleyGate100_ECFP_CYP2D6_Venus) and the gene-silencing plasmid (pG10Hi/p10HGOi/pTDCi/pSLSi/pSTRi/pSDGi) was pipetted in a 96 well microplate for FRET analysis. The Phosphate Buffer Saline (PBS) buffer was used as a control. The analysis was performed in a microplate reader wherein the donor fluorophore (ECFP) of the nanosensor was excited at 430 nm, and the Venus/ECFP emission intensity ratio was recorded at every 5 min interval for 40 min. The analysis was conducted in triplicates, and the filters used for the excitation of ECFP and emission of ECFP and Venus were 430/20 nm, 485/20 nm, and 540/20 nm, respectively.
The elicited culture was also observed under a confocal microscope (Leica, Germany) using a 10× objective. The FRET was recorded using 430 nm excitation, and a spectral scan was collected. Imaging was performed by 430 nm excitation filter and two emission filters, i.e., 485 nm (ECFP) and 540 nm (Venus). The Venus/ECFP emission intensity ratio was recorded by using LAS-AF software (Leica, Germany). The cell culture of Symphytum officinale was used as control.

2.7. PCR Analysis

Firstly, the genomic DNA was isolated from the frozen suspension cells of the C. roseus. The genomic DNA isolation was performed with 0.5 g of the cells using DNeasy Plant Mini Kit (Qiagen, Germany). Amplification of the G10H, 10HGO, TDC, SLS, STR, SDG and CYP2D6 genes was carried out using gene-specific primers in a thermal cycler (Bio-Rad, Hercules, CA, USA) to confirm the transformation of the genes (Supplementary Figures S1 and S2). Expressions of these genes were analysed using real time PCR. Total RNA was extracted from the suspension cells using RNeasy Plant Mini Kit (Qiagen, Germany). The synthesized synthesized complementary DNA (cDNA) were then subjected to Reverse Transcription Polymerase Chain Reaction (RT-PCR) analysis with SYBR Green RT-PCR Reagents Kit (Life Technologies, Thermo Fisher, Waltham, MA, USA) and LightCycler® Software 4.1 (Roche Life Science, Penzberg, Germany). The cycle with signal higher than the background and 10× standard deviation was determined as the threshold cycle (CT). The house-keeping gene, Catharanthus roseus 40S ribosomal protein S9 (Rps9), was used for normalizing the expression levels in all samples. As mentioned above, different samples of the transformed suspension cells were taken at every 20 min interval for 130 min, and the mRNA expression levels of the silenced genes were analyzed to investigate the temporal expression of TIA pathway genes in C. roseus suspension cells, and further lay the foundation for understanding the RNA silencing process.

3. Results

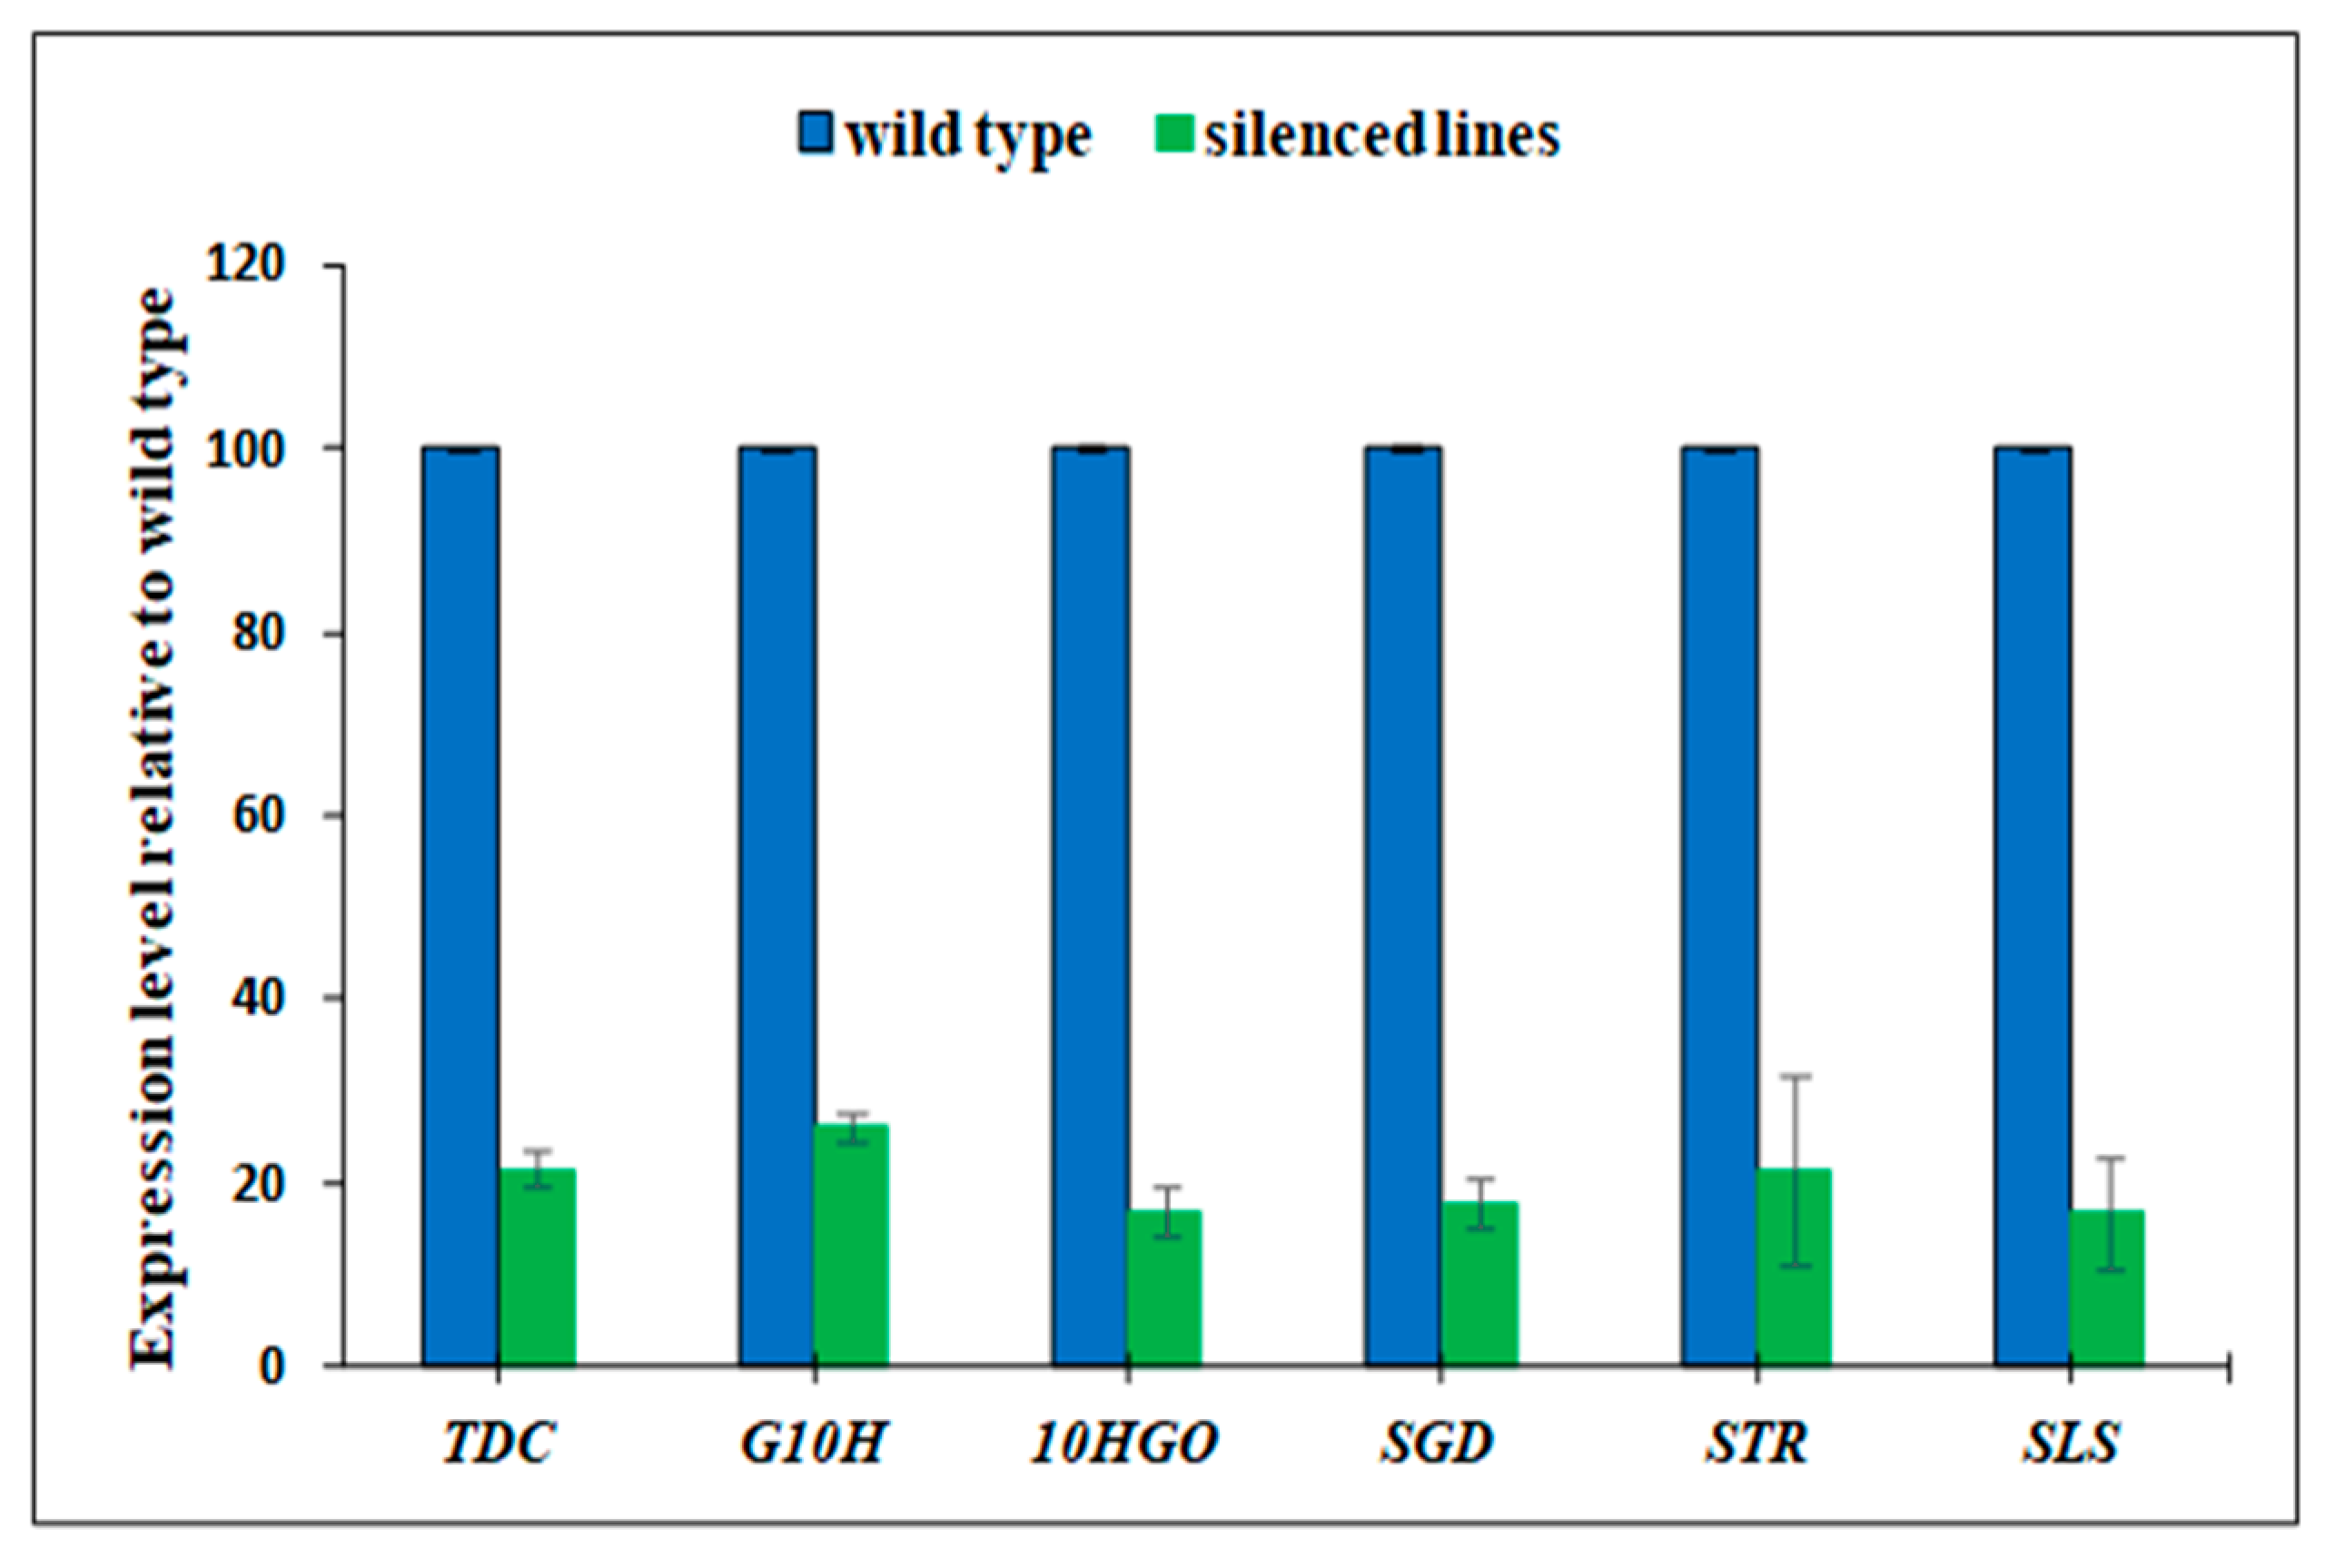
3.1. Gene Silencing and Validation

Six silenced cell lines were generated through Agrobacterium tumefaceins-mediated transformation, wherein the transformed gene-silencing plasmids, pG10Hi, p10HGOi, pTDCi, pSLSi, pSTRi and pSDGi, suppressed the TIA pathway genes G10H, 10HGO, TDC, SLS, STR, and SDG, respectively. The cell lines were also successfully transformed with the recombinant construct of FLIP-Ajn (pEarleyGate100_ECFP_CYP2D6_Venus) for real-time visualization of ajmalicine flux [24]. The PCR analysis of genomic DNA isolated from frozen culture cells validated the transformation of the G10H, 10HGO, TDC, SLS, STR, SDG and CYP2D6 (Figure S1). The relative mRNA expression levels of the TIA pathway genes at varying intervals showed the significant silencing of all the genes around 50 min after transformation. The gene expressions levels of all the genes were found high in the first 10 min of transformation. However, at 30 min the expression level sharply declined, and further continued to decline till 70 min, after which stability in the expression level was seen. Therefore, it was determined that the RNA silencing in the suspension cells was completely achieved at 70 min of transformation with the gene-silencing plasmids. Although the initial expression level of all the genes differed, the induction of RNA silencing resulted in similar expression levels beyond 50 min (Figure S3). Real-time RT-PCR analysis showed that the Geraniol-10-Hydroxylase, 10-hydroxygeraniol oxidoreductase, Tryptophan decarboxylase, secologanin synthase, strictosidine synthase, and strictosidine-O-beta-D-glucosidase genes were down-regulated in the plant cell lines harboring pG10Hi-, p10HGOi-, pTDCi-, pSLSi-, pSTRi-, and pSDGi-silencing plasmids (Figure 2).

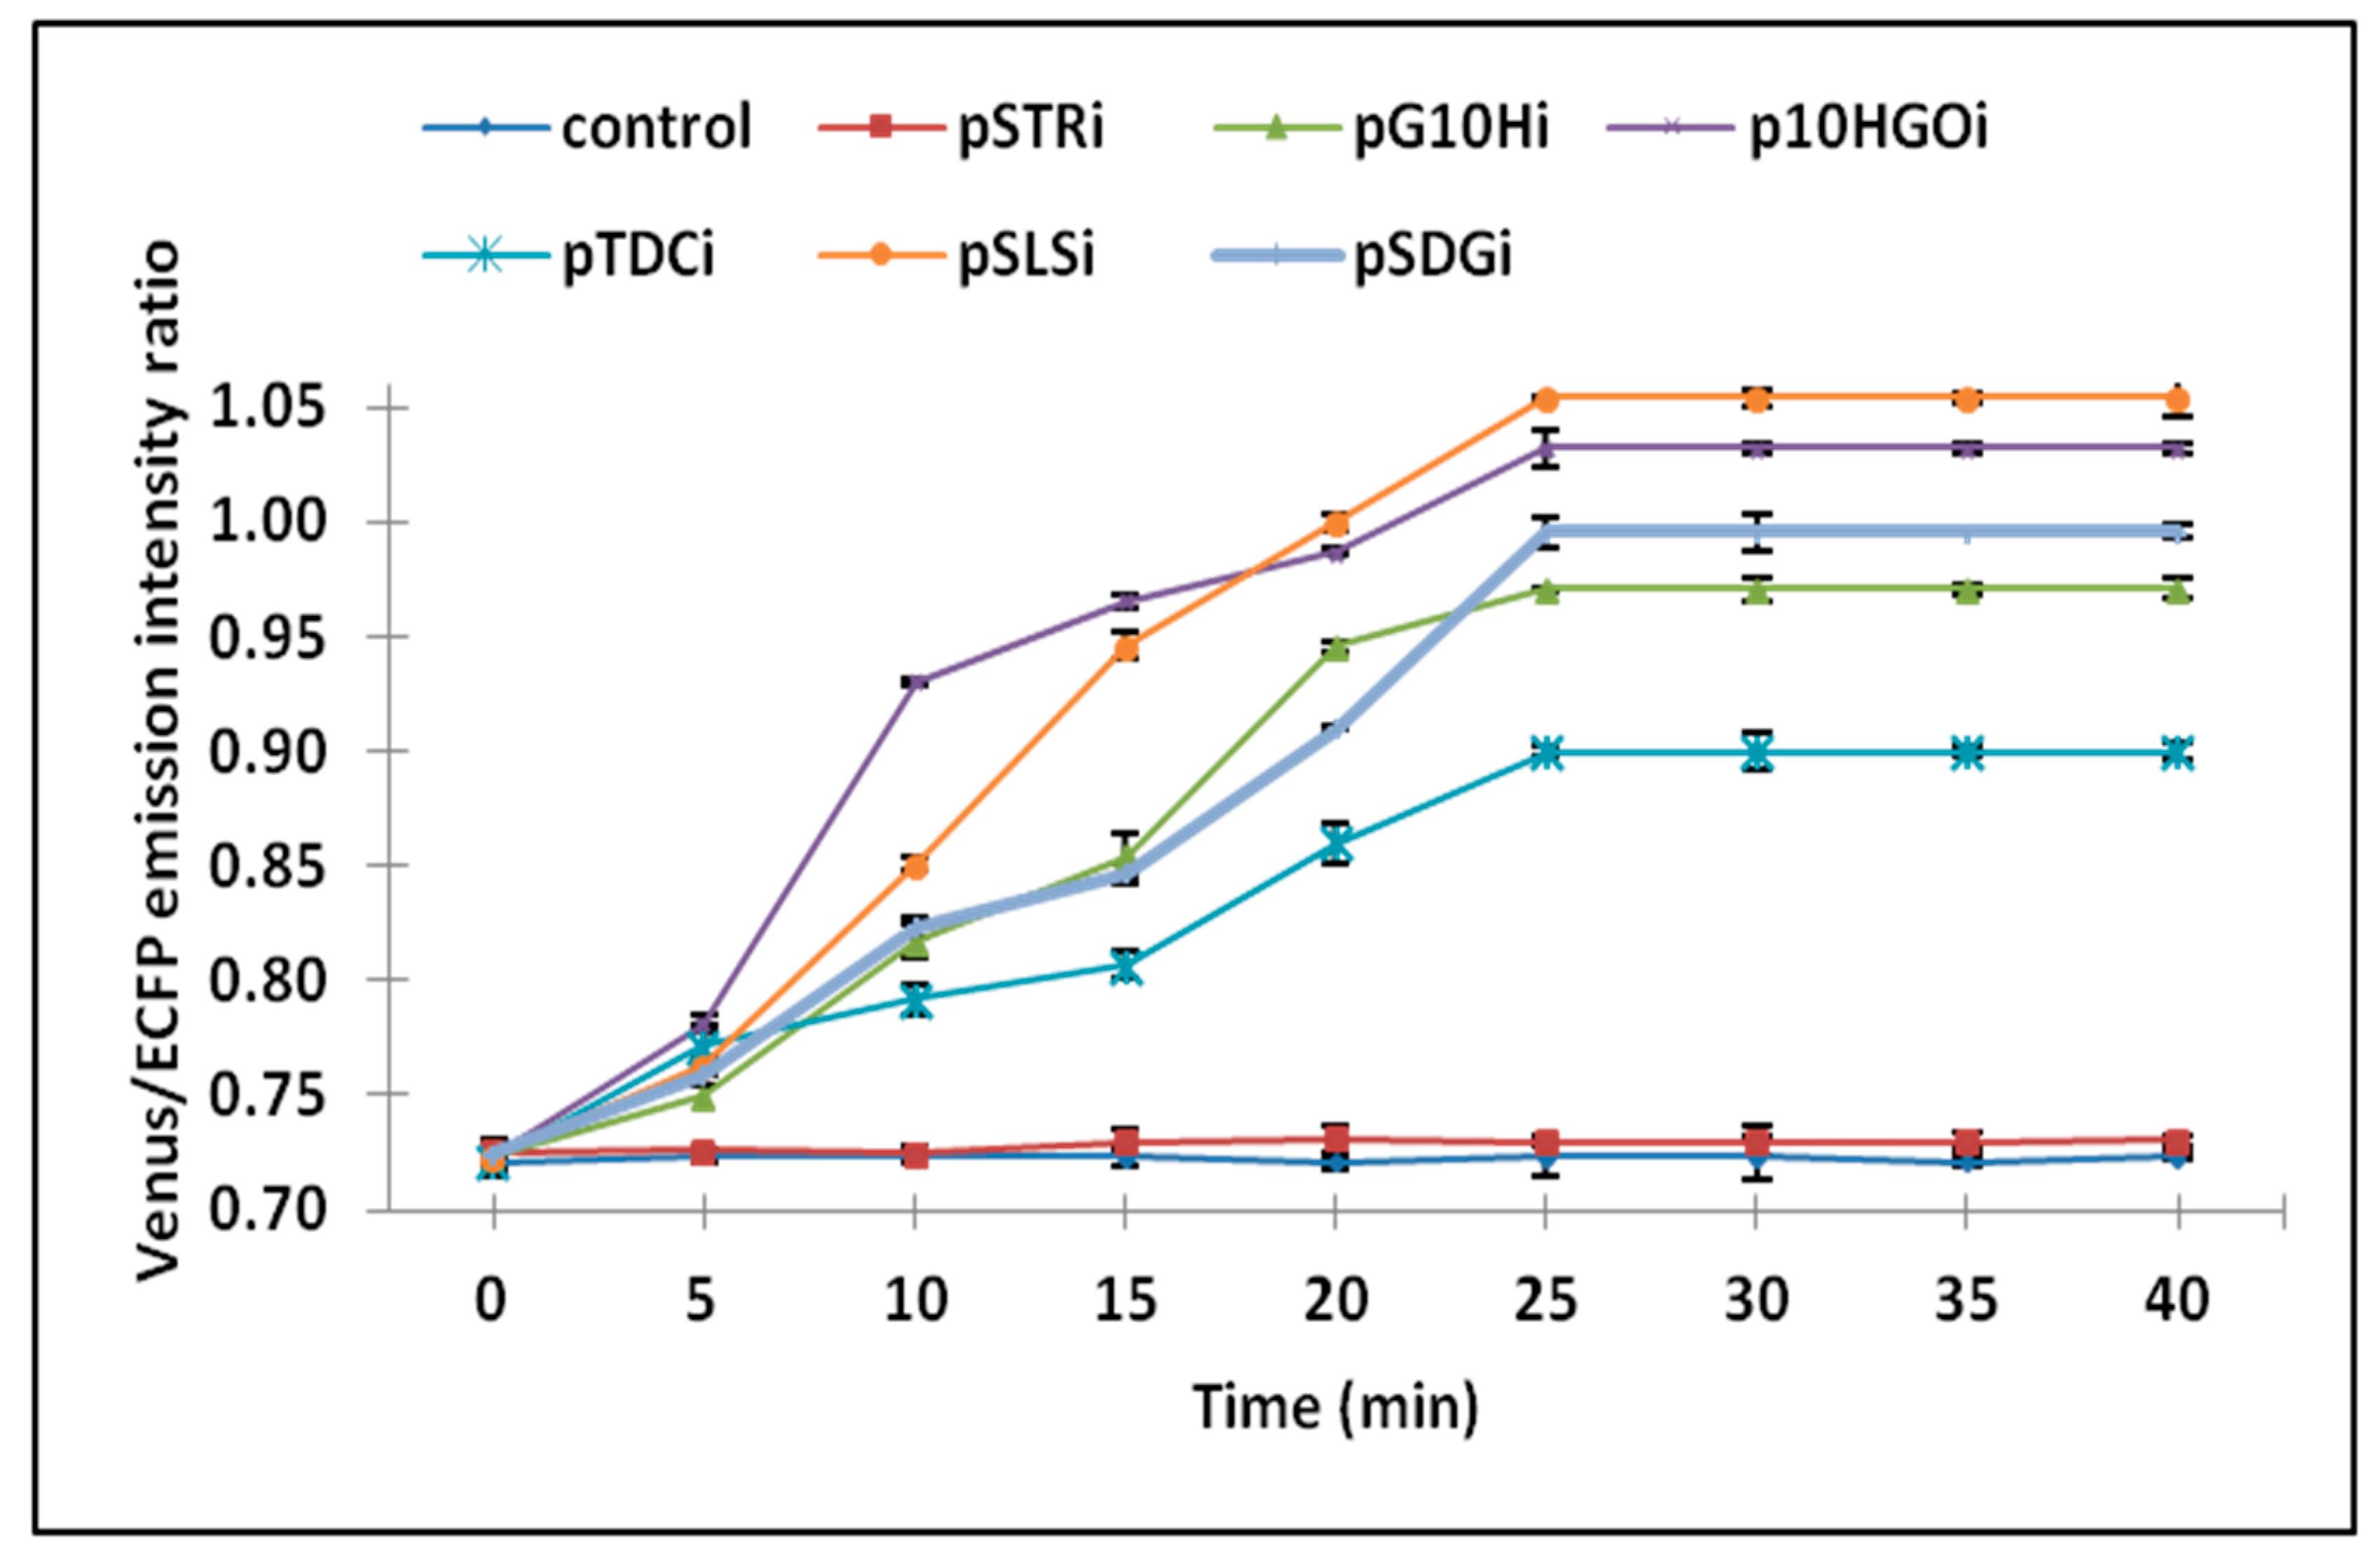
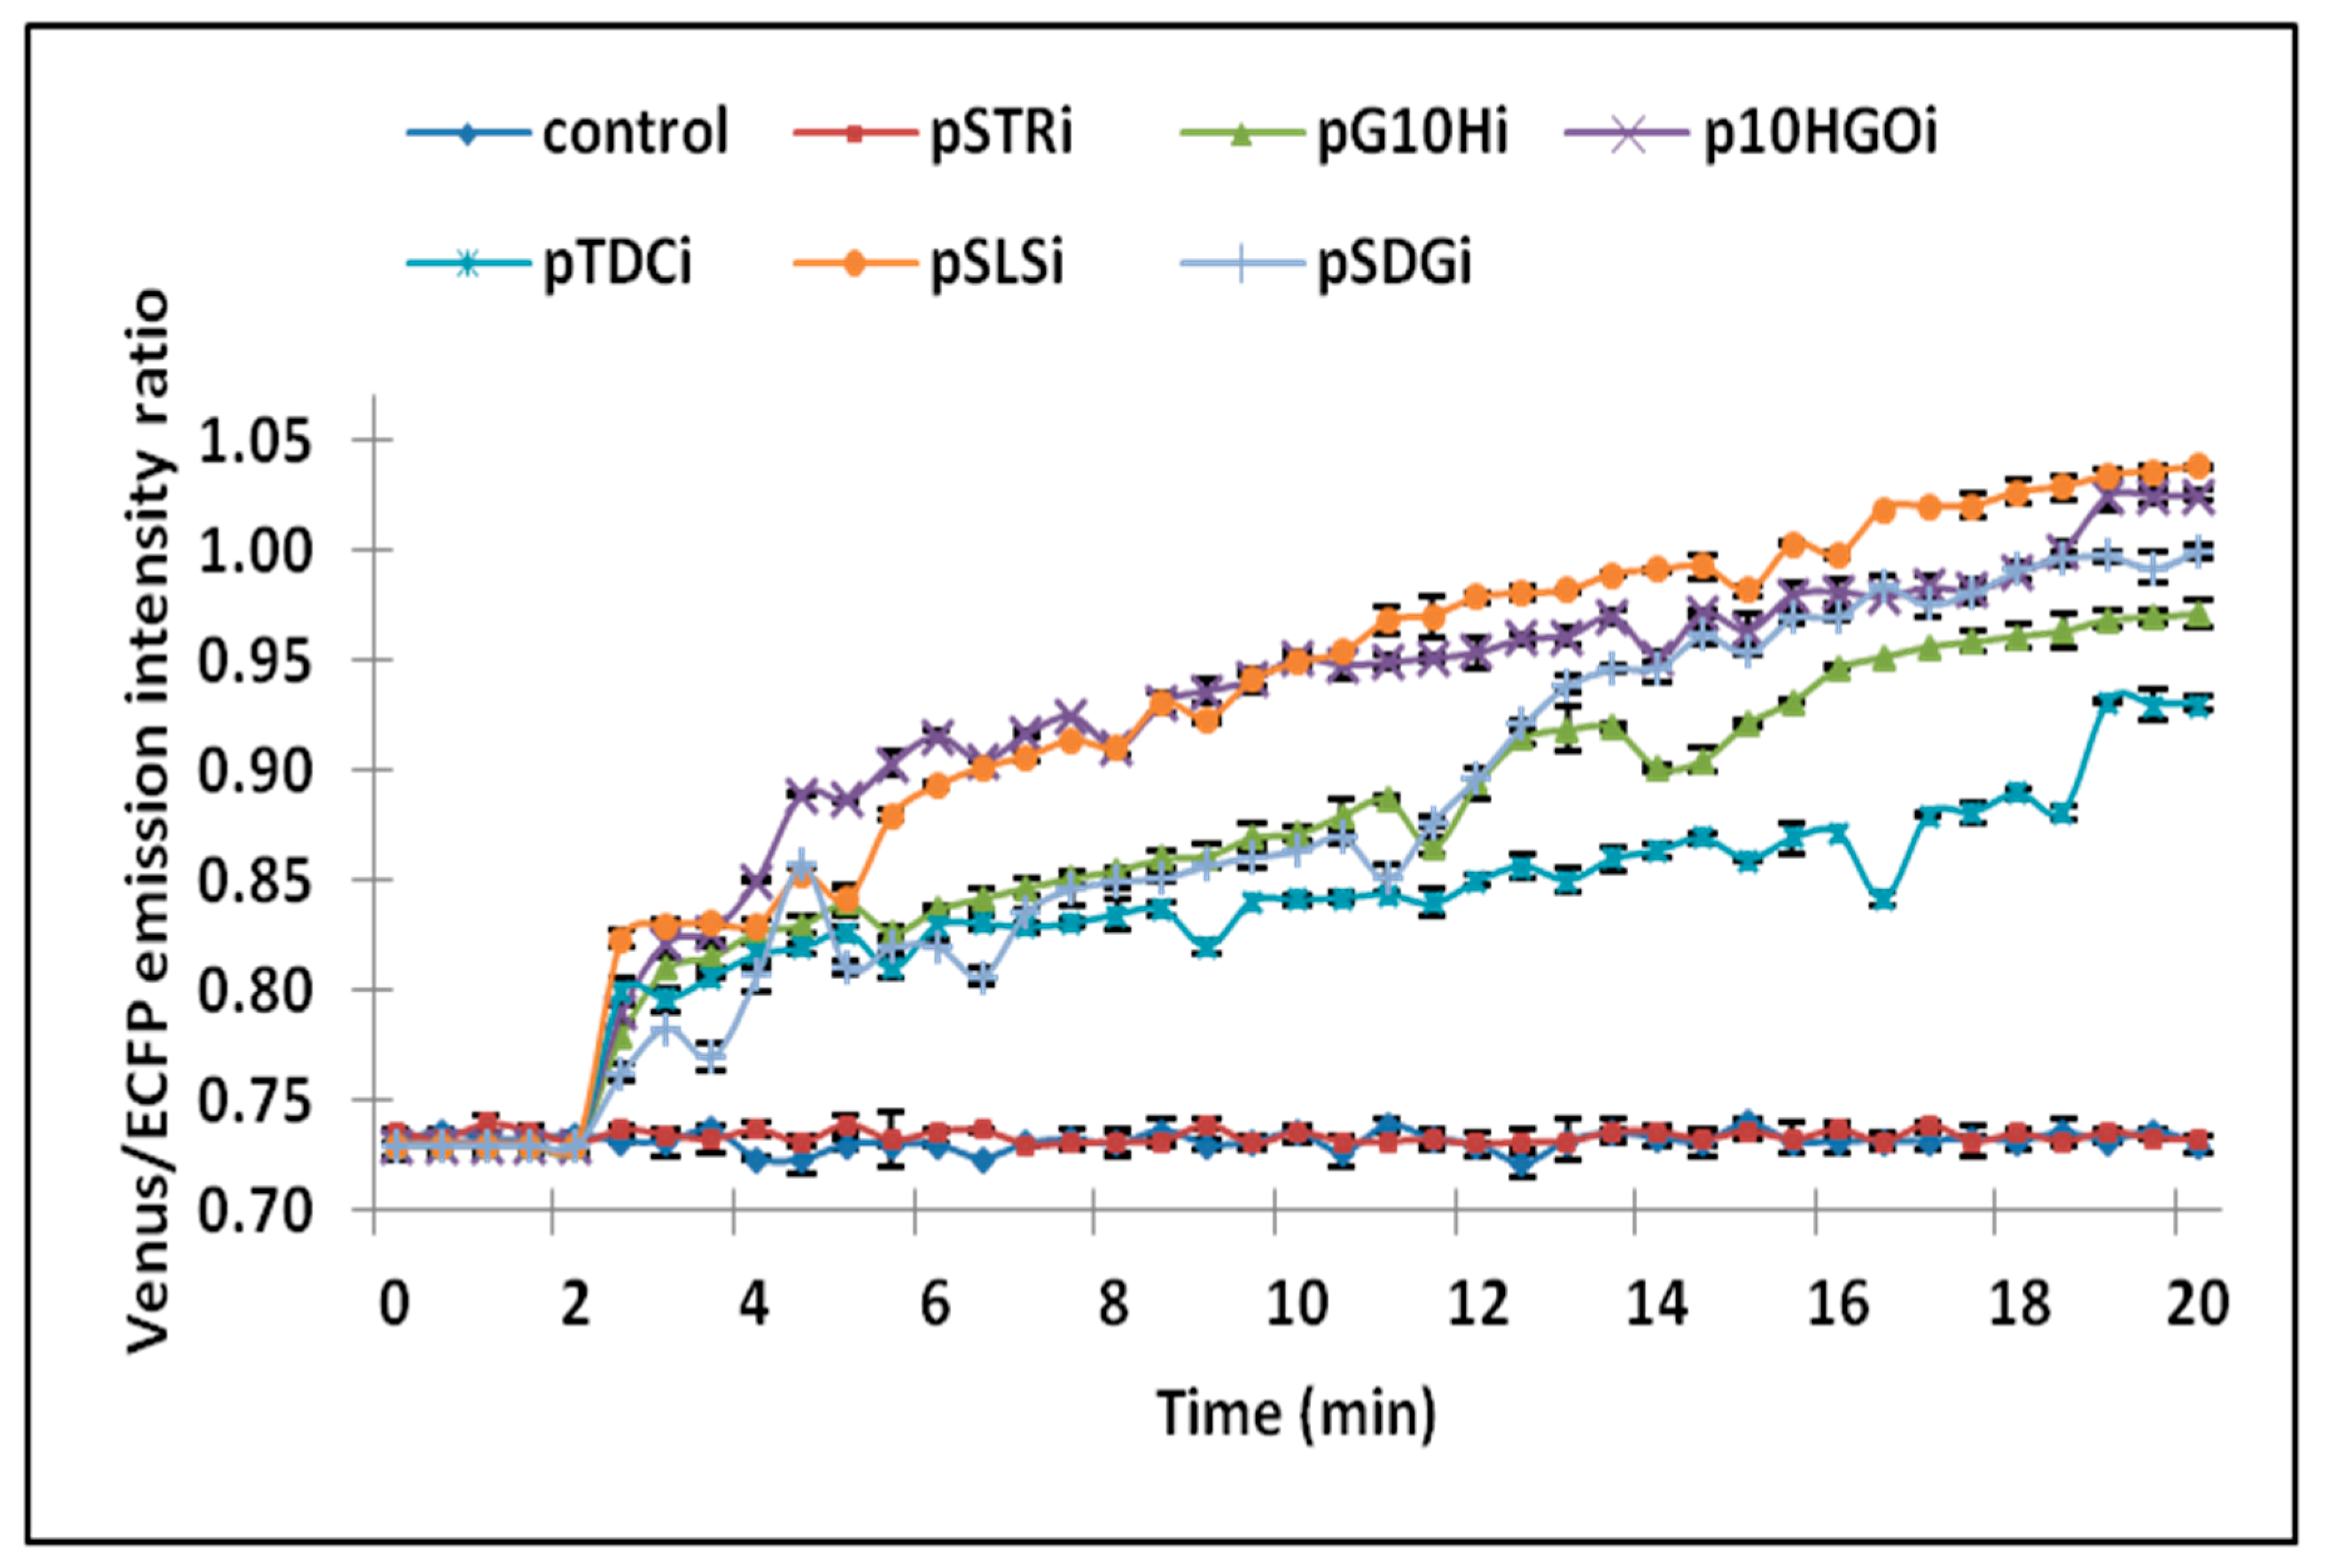
3.2. Analysis of Ajmalicine Dynamics

The FRET analysis in the C. roseus transgenic cell lines by the FLIP-Ajn nanosensor helped in the study of the ajmalicine dynamics, and in the identification of the regulatory gene controlling flux of ajmalicine. Ratiometric analysis of different FRET-based nanosensors for real-time monitoring of the flux of maltose [27], glucose [28] and vitamin B12 [29], glutamate [30] and ribose [31] showed that the FRET ratio (acceptor/donor emission intensity) corresponded to the substrate concentration in the presence of the target substrate. In the present study, the FRET analysis conducted in the microplate reader showed high Venus/ECFP emission intensity (FRET) ratio change relative to the control in the transgenic cell lines harbouring pG10Hi, p10HGOi, pTDCi, pSLSi, and pSDGi (Figure 3). A FRET ratio change of 0.35, 0.33, 0.29, 0.27 and 0.20 was observed for the cells transformed with pG10Hi, p10HGOi, pTDCi, pSLSi, and pSDGi, respectively. A similar trend of increased FRET ratio change within the time length of 40 min was observed in all the cell lines. In the first 25 min, a constant increase in the FRET ratio was observed, which saturated after 25 min. On the contrary, insignificant FRET ratio change was observed in the pSTRi-harbouring cells. The pSTRi line graph showed a constant reading near 0.70, similar to control. Since, no change in the FRET ratio was obtained in the pSTRi-containing cell line, during the entire duration of analysis, it can be inferred that the silencing of STR negatively regulated the synthesis of ajmalicine. As the FRET ratio reports the change in the substrate (ajmalicine) concentration, it can be concluded that the pSTRi cells had little to no traces of ajmalicine. Further, the FRET ratio change was found similar to that of the control (PBS buffer), therefore, it can be suggested that STR has a high probability of controlling or regulating the ajmalicine synthesis.
The transient expression of the nanosensor in single cells harboring pG10Hi/p10HGOi/pTDCi/pSLSi/pSTRi/pSDGi-silencing plasmids was studied with the help of a confocal microscope for 20 min (Figure 4). The FRET ratio reported the change in the concentration/flux of ajmalicine in response to the silenced genes. In the different elicited cells subjected to FRET analysis, no change in the FRET ratio was observed for the first 2.5 min, and the FRET ratio value was recorded near 0.73. Maximum FRET ratio change of ~0.3 was recorded for the pSLSi-containing cell. A sharp increase in the FRET ratio, i.e., 0.83, was observed after 2.5 min, which gradually increased to reach the maximum value (1.03) at 20 min. In the p10HGOi-harbouring cell, FRET ratio change increased to 0.82 after 2.5 min. Gradual increase in the FRET ratio was recorded, which reached the maximum (1.02) at 20 min. Next, the FRET ratio change of ~0.26 was recorded for pSDGi-containing cell. A similar trend of sharp increase in the FRET ratio (0.81) was observed that gradually increased to 0.99 in the 20 min analysis. Similar increase in FRET ratio was also observed for the pG10Hi-harbouring cell, i.e., a rise in the FRET ratio value was seen near 0.83 after 2.5 min, which gradually increased to 0.97. The FRET ratio change of ~0.24 was recorded in this case. Further, the pTDCi-containing cell showed comparatively lower FRET ratio change: ~0.20 in the entire duration of analysis. The first increase in the FRET ratio (0.79) was observed after 2.5 min, which reached 0.92 in 20 min. In contrast, insignificant FRET ratio change was observed for the cell harbouring pSTRi. The FRET ratio value ~0.73 was observed in the 20 min of analysis. The observation was similar to that of the control, i.e., the S. officinale cell (devoid of ajmalicine). The result suggests the important role of STR in the synthesis of ajmalicine.

4. Discussion

The biosynthesis of terpenoid indole alkaloids in Catharanthus roseus follows an intricate pathway, comprising a highly compartmentalized system. The metabolic pathway genes have been previously characterized and the function was elucidated. Geraniol 10-hydroxylase encoded by G10H is a cytochrome P450 monooxygenase (CYP76B6) enzyme and involves oxidation of geraniol to 10-hydroxygeraniol [32]. The 10-hydroxygeraniol oxidoreductase encoded by 10HGO catalyzes the oxidation of 10-hydroxygeraniol to produce aldehyde 10-oxogeraniol [33,34,35,36]. Later, in the pathway secologanin synthase (SLS) catalyzes the production of iridoid secologanin [37]. The tryptophan decarboxylase (TDC), a pyridoxal phosphate-dependent enzyme of the indole pathway, decarboxylates tryptophan and produces tryptamine. This is believed to be the connecting link between primary and secondary metabolism [38]. Further, the central monoterpenoid indole alkaloid (MIA) precursor, strictosidine, is formed by the catalysis of strictosidine synthase (STR) [39]. In the following step, strictosidine is deglycosylated to produce a series of intermediates, including strictosidine aglycone, catalyzed by the enzyme strictosidine β-glucosidase (SDG). The steps further lead to the formation of various monoterpenoid indole alkaloids including ajmalicine [40]. An overview of ajmalicine biosynthesis is given in Figure 5.
Our study was aimed at suppressing the key genes (G10H, 10HGO, TDC, SLS, STR, SDG) of the TIA pathway through RNA-mediated gene silencing in cell suspension culture, and studying the response of ajmalicine flux through a FLIP-Ajn nanosensor. The FLIP-Ajn nanosensor was earlier developed and characterized by our group [24]. Six silenced cell lines were generated in the study. Each cell line suppressed one key gene of the TIA pathway (Figure 2). Real-time monitoring of the ajmalicine level in the silenced cell lines by the FLIP-Ajn nanosensor showed an order of the possible regulatory role of the key TIA pathway genes. The FRET ratio was established as the criterion to identify the regulatory role of the genes. The FLIP-Ajn comprises of a ligand binding protein (CYP2D6) sandwiched between a FRET pair (ECFP and Venus). In the presence of ajmalicine, the CYP2D6 undergoes conformational changes and brings the FRET pair closer to each other. The excitation of ECFP at 430 nm caused the fluorescence resonance energy transfer to take place, and energy was transferred to Venus. This transfer of energy led a change in the emission intensities of ECFP and Venus, i.e., reduced emission intensity of ECFP and increased emission intensity of Venus. The FLIP-Ajn follows a ratiometric analysis, and measures the ajmalicine concentration/flux as a function of Venus/ECFP emission intensity (FRET) ratio. As observed from Figure 3 and Figure 4, little to no change in the FRET ratio was observed in the STR-silenced lines. The order of the response of different genes was STR > TDC > G10H > SDG > 10HGO > SLS. Therefore, it has been suggested that the down-regulation of STR caused little to no production of ajmalicine in the elicited cell culture, due to which the FLIP-Ajn reported a fixed FRET ratio (Figure 3 and Figure 4). Moreover, in all the other cell lines (G10H, 10HGO, TDC, SDG and SLS), increase in the FRET ratio was observed after 2.5 min, which suggests that the synthesis of ajmalicine started after 2.5 min of elicitation with β -CD and MJ (Figure 4).
Earlier different plant metabolic engineering strategies have been employed to identify the rate-limiting steps of TIA production in order to enhance the production of ajmalicine. These studies dealt with the over-expression of genes or transcription factors in hairy roots or cell suspension culture [3,20,22,41,42]. However, none of the strategies could monitor the level of production of the ajmalicine in real-time and in single cells. The FLIP-Ajn nanosensor monitored the single cell dynamics of ajmalicine in real-time in the silenced cell lines elicited with MJ and β-CD. Previous study showed that the elicitation through β-CD and MJ is associated with the upregulation of G10H, SLS, STR and TDC, and reported an increased ajmalicine production [18]. The regulatory role of STR as described in our study is in line with the earlier findings [20,43,44,45]. Moreover, our findings were also consistent with the other gene expression studies. As reported earlier, the over-expression of TDC enhanced the production of tryptophan, and no change in TIA accumulation was seen [46]. Further, over-expression of TDC was also reported to increase the production of tryptamine [47]. The transgenic hairy root lines of C. roseus, designed to over-express G10H alone, and the key transcription factor ORCA3 genes alongwith G10H, resulted in the production of more catharanthine than in the control [48]. The earlier findings, related to the transcriptomic analysis of C. roseus hairy roots overexpressing anthranilate synthase (AS) in the indole pathway, elucidated the complex regulation of the TIA pathway. The study showed that the overexpression of AS affected the metabolic network and the multiple signal transduction pathways [49]. Moreover, multigenic interactions were also assessed earlier [19]. It has been shown that the co-overexpression of MEP (Methylerythritol 4-phosphate) pathway genes, DXR and MECS or DXR/MECS and STR, is related to an increased yield of ajmalicine. Therefore, the multigenic interactions cannot be ruled out, and future similar experiments encompassing the entire known pathway genes could help in better understanding the metabolic regulation. The present study, however, validates one of the possible gene candidates, STR, as the regulatory element in ajmalicine synthesis, and presents a better picture of the complex metabolic regulation.
Fluxomic analysis of the ajmalicine biosynthesis in transgenic C. roseus cell lines, by the use of a FRET-based genetically encoded nanosensor (FLIP-Ajn), revealed that the order of the regulatory activity of the key genes of the TIA pathway was STR > TDC > G10H > SDG > 10HGO > SLS. The strictosidine synthase was found to be the potential regulatory gene in controlling the ajmalicine biosynthesis. The information of the regulatory gene of the ajmalicine biosynthesis pathway can be applied to a metabolic engineering approach to improve the production of ajmalicine. The work represents the first report of identification of the regulatory gene involved in the synthesis of ajmalicine through a FRET-based nanosensor. This study provided a cost-effective, rapid and high throughput strategy to study metabolic regulation. Further, the multigenic interaction involved in the TIA pathway regulation, along with the future discovery of new pathway genes, can also be studied by the present method.

Supplementary Materials

The following are available online at https://www.mdpi.com/2227-9717/8/5/589/s1, Figure S1. PCR amplified DNA fragments of the TIA pathway genes, Figure S2. PCR amplified DNA fragments of the CYP2D6, Figure S3. Temporal mRNA expression levels of the silenced genes in transformed suspension cells. Values are mean of three independent replicates. Vertical bars show the standard deviation. Table S1: Primers used in the amplification of the TIA pathway genes.

Author Contributions

Conceptualization, G.A. and A.A.; methodology, G.A. and A.A.; software, G.A., H.M.A. and A.A.; validation, G.A., H.M.A. and A.A.; formal analysis, G.A. and A.A.; investigation, G.A., H.M.A. and A.A.; resources, H.M.A. and A.A.; data curation, G.A., H.M.A.; writing—original draft preparation, G.A., and A.A.; writing—review and editing, G.A, H.M.A. and A.A.; supervision, A.A.; project administration, H.M.A. and A.A.; funding acquisition, H.M.A. and A.A. All authors have read and agreed to the published version of the manuscript.

Acknowledgments

The authors would like to extend their sincere appreciation to the King Saud University, Riyadh, Saudi Arabia for its support to the Researchers Supporting Project number (RSP-2019/123).

Conflicts of Interest

The authors declare no conflict of interest.

References

  1. Fulzele, D.P.; Namdeo, A.G. Cost effective pilot-scale ajmalicine production by Catharanthus roseus cell suspension cultures in a 100 L bioreactor. Biotechnol. J. 2018, 21, 1–15. [Google Scholar] [CrossRef]
  2. Mallick, S.R.; Jena, R.C.; Samal, K.C. Rapid in vitro multiplication of an endangered medicinal plant sarpgandha (Rauwolfia serpentina). Am. J. Plant Sci. 2012, 3, 437–442. [Google Scholar] [CrossRef] [Green Version]
  3. Oksman-Caldentey, K.M. Metabolic engineering of terpenoid indole alkaloid pathway in Catharanthus roseus. Planta Med. 2013, 79, WS17. [Google Scholar] [CrossRef]
  4. Misra, N.; Kumar, S.; Luthra, R. Bioconversion of ajmalicine to serpentine in Catharanthus roseus roots. J. Plant Sci. 2006, 1, 340–347. [Google Scholar]
  5. Das, A.; Satyaprakash, K. Antimicrobial properties of natural products: A review. Pharma. Innov. J. 2018, 7, 532–537. [Google Scholar]
  6. Dey, A.; De, J.N. Anti-snake venom botanicals used by the ethnic groups of Purulia District, West Bengal, India. J. Herbs Spices Med. Plants 2012, 18, 152–165. [Google Scholar] [CrossRef]
  7. Jaleel, C.A.; Gopi, R.; Manivannan, P.; Sankar, B.; Kishorekumar, A.; Panneerselvam, R. Antioxidant potentials and ajmalicine accumulation in Catharanthus roseus after treatment with giberellic acid. Colloid Surf. B 2007, 60, 195–200. [Google Scholar] [CrossRef]
  8. Bhargava, K.P.; Borison, H.L. Comparative effects of various Rauwolfia alkaloids on centrally evoked vasopressor responses. J. Pharmacol. Exp. Ther. 1957, 119, 395–405. [Google Scholar]
  9. Li, S.; Long, J.; Ma, Z.; Xu, Z.; Li, J.; Zhang, Z. Assessment of the therapeutic activity of a combination of almitrine and raubasine on functional rehabilitation following ischaemic stroke. Curr. Med. Res. Opin. 2004, 20, 409–415. [Google Scholar] [CrossRef]
  10. Kehoe, P.G.; Passmore, P.A. The renin-angiotensin system and antihypertensive drugs in Alzheimer’s disease: Current standing of the angiotensin hypothesis? J. Alzheimer’s Dis. 2012, 30, S251–S268. [Google Scholar] [CrossRef]
  11. Zheng, Z.; Wu, M. Cadmium treatment enhances the production of alkaloid secondary metabolites in Catharanthus roseus. Plant Sci. 2004, 166, 507–514. [Google Scholar] [CrossRef]
  12. Almagro, L.; Perez, A.L.; Pedreño, M.A. New method to enhance ajmalicine production in cell cultures based on the use of cyclodextrins. Biotechnol. Lett. 2010, 33, 381–385. [Google Scholar] [CrossRef] [PubMed] [Green Version]
  13. Sharma, A.; Amin, D.; Sankaranarayanan, A.; Arora, R.; Mathur, A.K. Present status of Catharanthus roseus monoterpenoid indole alkaloids engineering in homo-and hetero-logous systems. Biotechnol. Lett. 2019, 1–13. [Google Scholar] [CrossRef]
  14. Singh, S.; Pandey, S.S.; Shanker, K.; Kalra, A. Endophytes enhance the production of root alkaloids ajmalicine and serpentine by modulating the terpenoid indole alkaloid pathway in Catharanthus roseus roots. J. Appl. Microbiol. 2020, 128, 1128–1142. [Google Scholar] [CrossRef]
  15. Srivastava, M.; Sharma, S.; Misra, P. Elicitation based enhancement of secondary metabolites in Rauwolfia serpentina and Solanum khasianum hairy root cultures. Pharmacogn. Mag. 2016, 12, S315. [Google Scholar]
  16. Paeizi, M.; Karimi, F.; Razavi, K. Changes in medicinal alkaloids production and expression of related regulatory and biosynthetic genes in response to silver nitrate combined with methyl jasmonate in Catharanthus roseus in vitro propagated shoots. Plant Physiol. Biochem 2018, 132, 623–632. [Google Scholar] [CrossRef]
  17. Zhou, P.; Yang, J.; Zhu, J.; He, S.; Zhang, W.; Yu, R.; Zi, J.; Song, L.; Huang, X. Effects of β-cyclodextrin and methyl jasmonate on the production of vindoline, catharanthine, and ajmalicine in Catharanthus roseus cambial meristematic cell cultures. Appl. Microbiol. Biotechnol. 2015, 99, 7035–7045. [Google Scholar] [CrossRef]
  18. Mehrotra, S.; Srivastava, V.; Rahman, L.U.; Kukreja, A.K. Overexpression of a Catharanthus tryptophan decarboxylase (tdc) gene leads to enhanced terpenoid indole alkaloid (TIA) production in transgenic hairy root lines of Rauwolfia serpentina. Plant Cell Tiss. Org. 2013, 115, 377–384. [Google Scholar] [CrossRef]
  19. Chang, K.; Qiu, F.; Chen, M.; Zeng, L.; Liu, X.; Yang, C.; Lan, X.; Wang, Q.; Liao, Z. Engineering the MEP pathway enhanced ajmalicine biosynthesis. Biotechnol. Appl. Bioc. 2014, 61, 249–255. [Google Scholar] [CrossRef]
  20. Chang, K.; Chen, M.; Zeng, L.; Lan, X.; Wang, Q.; Liao, Z. Abscisic acid enhanced ajmalicine biosynthesis in hairy roots of Rauvolfia verticillata by upregulating expression of the MEP pathway genes. Russ. J. Plant Physl. 2014, 61, 136–140. [Google Scholar] [CrossRef]
  21. Arafa, A.S.; Ragab, A.E.; Ibrahim, A.R.S.; Abdel-Mageed, W.S.; Nasr, M.E. Cloning and overexpression of strictosidine β-D-glucosidase gene short sequence from Catharanthus roseus in Escherichia coli. Adv. Pharm. Bull. 2019, 9, 655. [Google Scholar] [CrossRef] [PubMed] [Green Version]
  22. Qu, Y.; Thamm, A.M.; Czerwinski, M.; Masada, S.; Kim, K.H.; Jones, G.; Liang, P.; De Luca, V. Geissoschizine synthase controls flux in the formation of monoterpenoid indole alkaloids in a Catharanthus roseus mutant. Planta 2018, 247, 625–634. [Google Scholar] [CrossRef]
  23. Dietrich, J.A.; McKee, A.E.; Keasling, J.D. High-throughput metabolic engineering: Advances in small-molecule screening and selection. Annu. Rev. Biochem. 2010, 79, 563–590. [Google Scholar] [CrossRef]
  24. Ambrin, G.; Ahmad, M.; Alqarawi, A.A.; Hashem, A.; Abd_Allah, E.F.; Ahmad, A. Conversion of cytochrome P450 2D6 of human into a FRET-based tool for real-time monitoring of ajmalicine in living cells. Front. Bioeng. Biotechnol. 2019, 7, 375. [Google Scholar] [CrossRef] [Green Version]
  25. Runguphan, W.; Maresh, J.J.; O’Connor, S.E. Silencing of tryptamine biosynthesis for production of nonnatural alkaloids in plant culture. Proc. Natl. Acad. Sci. USA 2009, 106, 13673–13678. [Google Scholar] [CrossRef] [Green Version]
  26. Tanaka, H.; Machida, Y.; Tanaka, H.; Mukai, N.; Misawa, M. Accumulation of glutamine by suspension cultures of Symphytum officinale. Agric. Biol. Chem. 1974, 38, 987–992. [Google Scholar] [CrossRef]
  27. Fehr, M.; Frommer, W.B.; Lalonde, S. Visualization of maltose uptake in living yeast cells by fluorescent nanosensors. Proc. Natl. Acad. Sci. USA 2002, 99, 9846–9851. [Google Scholar] [CrossRef] [Green Version]
  28. Fehr, M.; Lalonde, S.; Lager, I.; Wolff, M.W.; Frommer, W.B. In vivo imaging of the dynamics of glucose uptake in the cytosol of COS-7 cells by fluorescent nanosensors. J. Biol. Chem. 2003, 278, 19127–19133. [Google Scholar] [CrossRef] [Green Version]
  29. Ahmad, M.; Mohsin, M.; Iqrar, S.; Manzoor, O.; Siddiqi, T.O.; Ahmad, A. Live cell imaging of vitamin B12 dynamics by genetically encoded fluorescent nanosensor. Sens. Actuators B. Chem. 2018, 257, 866–874. [Google Scholar] [CrossRef]
  30. Okumoto, S.; Looger, L.L.; Micheva, K.D.; Reimer, R.J.; Smith, S.J.; Frommer, W.B. Detection of glutamate release from neurons by genetically encoded surface-displayed FRET nanosensors. Proc. Natl. Acad. Sci. USA 2005, 102, 8740–8745. [Google Scholar] [CrossRef] [Green Version]
  31. Lager, I.; Fehr, M.; Frommer, W.B.; Lalonde, S. Development of a fluorescent nanosensor for ribose. FEBS Lett. 2003, 553, 85–89. [Google Scholar] [CrossRef] [Green Version]
  32. Meehan, T.D.; Coscia, C.J. Hydroxylation of geraniol and nerol by a monooxygenase from Vinca rosea. Biochem. Biophys. Res. Commun. 1973, 53, 1043–1048. [Google Scholar] [CrossRef]
  33. Sanchez-Iturbe, P.G.; Galaz-Avalos, R.M.; Loyola-Vargas, V.M. Determination and partial purification of 10-oxogeranial: Iridodial cyclase an enzyme catalyzing the synthesis of iridodial from Catharanthus roseus hairy roots. Phyton 2005, 54, 55–69. [Google Scholar]
  34. Salim, V.; Wiens, B.; Masada-Atsumi, S.; Yu, F.; De Luca, V. 7-deoxyloganetic acid synthase catalyzes a key 3 step oxidation to form 7-deoxyloganetic acid in Catharanthus roseus iridoid biosynthesis. Phytochemistry 2014, 101, 23–31. [Google Scholar] [CrossRef]
  35. Uesato, S.; Ikeda, H.; Fujita, T.; Inouye, H.; Zenk, M.H. Elucidation of iridodial formation mechanism-partial purification and characterization of the novel monoterpene cyclase from Rauwolfia serpentina cell suspension cultures. Tetrahedron Lett. 1987, 28, 4431–4434. [Google Scholar] [CrossRef]
  36. Geu-Flores, F.; Sherden, N.H.; Courdavault, V.; Burlat, V.; Glenn, W.S.; Wu, C.; Nims, E.; Cui, Y.; O’Connor, S.E. An alternative route to cyclic terpenes by reductive cyclization in iridoid biosynthesis. Nature 2012, 492, 138. [Google Scholar] [CrossRef]
  37. Irmler, S.; Schröder, G.; St-Pierre, B.; Crouch, N.P.; Hotze, M.; Schmidt, J.; Strack, D.; Matern, U.; Schröder, J. Indole alkaloid biosynthesis in Catharanthus roseus: New enzyme activities and identification of cytochrome P450 CYP72A1 as secologanin synthase. Plant J. 2000, 24, 797–804. [Google Scholar] [CrossRef]
  38. De Luca, V.; Marineau, C.; Brisson, N. Molecular cloning and analysis of cDNA encoding a plant tryptophan decarboxylase: Comparison with animal dopa decarboxylases. Proc. Natl. Acad. Sci. USA 1989, 86, 2582–2586. [Google Scholar] [CrossRef] [Green Version]
  39. Kutchan, T.M. Expression of enzymatically active cloned strictosidine synthase from the higher plant Rauvolfia serpentina in Escherichia coli. FEBS Lett. 1989, 257, 127–130. [Google Scholar] [CrossRef] [Green Version]
  40. Liu, D.H.; Jin, H.B.; Chen, Y.H.; Cui, L.J.; Ren, W.W.; Gong, Y.F.; Tang, K.X. Terpenoid indole alkaloids biosynthesis and metabolic engineering in Catharanthus roseus. J. Integr. Plant Biol. 2007, 49, 961–974. [Google Scholar] [CrossRef]
  41. Sun, J.; Peebles, C.A. Engineering overexpression of ORCA3 and strictosidine glucosidase in Catharanthus roseus hairy roots increases alkaloid production. Protoplasma 2016, 253, 1255–1264. [Google Scholar] [CrossRef] [PubMed]
  42. Pan, Q.; Wang, Q.; Yuan, F.; Xing, S.; Zhao, J.; Choi, Y.H.; Verpoorte, R.; Tian, Y.; Wang, G.; Tang, K. Overexpression of ORCA3 and G10H in Catharanthus roseus plants regulated alkaloid biosynthesis and metabolism revealed by NMR-metabolomics. PLoS ONE 2012, 7, e43038. [Google Scholar] [CrossRef] [PubMed]
  43. Julsing, M.K.; Koulman, A.; Woerdenbag, H.J.; Quax, W.J.; Kayser, O. Combinatorial biosynthesis of medicinal plant secondary metabolites. Biomol. Eng. 2006, 23, 265–279. [Google Scholar] [CrossRef] [PubMed]
  44. Leonard, E.; Runguphan, W.; O’Connor, S.; Prather, K.J. Opportunities in metabolic engineering to facilitate scalable alkaloid production. Nat. Chem. Biol. 2009, 5, 292–300. [Google Scholar] [CrossRef] [PubMed]
  45. Hallard, D.A.C. Transgenic Plant Cells for the Production of Indolealkaloids. Ph.D. Thesis, University of Leiden, Leiden, The Netherlands, 2000. [Google Scholar]
  46. Canel, C.; Lopes-Cardoso, M.I.; Whitmer, S.; van der Fits, L.; Pasquali, G.; van derHeijden, R.; Hoge, J.H.; Verpoorte, R. Effects of over-expression of strictosidine synthase and tryptophan decarboxylase on alkaloid production by cell cultures of Catharanthus roseus. Planta 1998, 205, 414–419. [Google Scholar] [CrossRef] [PubMed] [Green Version]
  47. Goddijn, O.J.; Pennings, E.J.; van der Helm, P.; Schilperoort, R.A.; Verpoorte, R.; Hoge, J.H.C. Overexpression of a tryptophan decarboxylase cDNA in Catharanthus roseus crown gall calluses results in increased tryptomine levels but not in increased terpenoid indole alkaloid production. Transgenic Res. 1995, 4, 315–323. [Google Scholar] [CrossRef]
  48. Wang, C.T.; Liu, H.; Gao, X.S.; Zhang, H.X. Overexpression of G10H and ORCA3 in the hairy roots of Catharanthus roseus improves catharanthine production. Plant Cell Rep. 2010, 29, 887–894. [Google Scholar] [CrossRef]
  49. Sun, J.; Manmathan, H.; Sun, C.; Peebles, C.A. Examining the transcriptional response of overexpressing anthranilate synthase in the hairy roots of an important medicinal plant Catharanthus roseus by RNA-seq. BMC Plant Biol. 2016, 16, 108. [Google Scholar] [CrossRef] [Green Version]
Figure 1. An overview of the methodology involved in the identification of the regulatory switch controlling ajmalicine flux through Fluorescent indicator protein for ajmalicine FLIP-Ajn.
Processes 08 00589 g001
Figure 2. Real-time reverse transcriptase PCR of the mRNA translating tryptophan decarboxylase (TDC), geraniol 10-hydroxylase (G10H), 10-hydroxygeraniol (10HGO), strictosidine β-glucosidase (SDG), strictosidine synthase (STR) and secologanin synthase (SLS). Levels of the silenced lines are normalized to 100% in the wild type line. The gene expression level of the silenced lines relative to the wild type is represented here. Values are mean of three independent replicates. Vertical bars show the standard deviation.
Processes 08 00589 g002
Figure 3. The FRET ratio analysis of the elicited C. roseus cell lines in microplate reader. The line graph represent increased FRET ratio in the cells harbouring silenced G10H, 10HGO, TDC, SLS and SDG, that reached saturation after 25 min. No significant change in the FRET ratio is observed in the silenced STR cells. Values are mean of three independent replicates. Vertical bars represent the standard error.
Processes 08 00589 g003
Figure 4. Confocal microscopy analysis, representing increased FRET ratio after 2.5 min in the elicited single cells harbouring pG10Hi, p10HGOi, pTDCi, pSLSi, and pSDGi. No significant FRET ratio change was seen in pSTRi-containing cell. Values are mean of three independent replicates. Vertical bars represent the standard error.
Processes 08 00589 g004
Figure 5. Overview of the biosynthesis of ajmalicine in C. roseus. (AS, anthranilate synthase; CPR, cytochrome P450 reductase; DXR, 1-deoxy-D-xylulose-5-phosphate reductoisomerase; DXS, 1-deoxy-D-xylulose-5-phosphate synthase; G10H, geraniol 10-hydroxylase; GES, geraniol synthase; GPPS, geranyl diphosphate synthase; IDI, isopentenyl diphosphate isomerase; LAMT, loganic acid O-methyltransferase; SDG, strictosidine glucosidase; SLS, secologanin synthase; STR, strictosidine synthase; TDC, tryptophan decarboxylase).
Processes 08 00589 g005

