Article

Fabrication of Biopolymer Based Nanoparticles for the Entrapment of Chromium and Iron Supplements

by
Nishay Patel
1,
Mohammed Gulrez Zariwala
2 and
Hisham Al-Obaidi
1,*
1
The School of Pharmacy, University of Reading, Reading RG6 6AD, UK
2
Faculty of Science & Technology, University of Westminster, 115 New Cavendish Street, London W1W 6UW, UK
*
Author to whom correspondence should be addressed.
Processes 2020, 8(6), 707; https://doi.org/10.3390/pr8060707
Submission received: 20 May 2020 / Revised: 8 June 2020 / Accepted: 15 June 2020 / Published: 19 June 2020

Abstract

:
The objective of this study was to encapsulate iron and chromium into novel nanoparticles formulated using chitosan (CS), dextran sulfate (DS) and whey protein isolate (WPI) for oral drug delivery. Empty and loaded CS-DS nanoparticles were prepared via complex coacervation whilst whey protein nanocarriers were produced by a modified thermal processing method using chitosan. The physiochemical properties of the particles were characterized to determine the effects of formulation variables, including biopolymer ratio on particle size and zeta potential. Permeability studies were also undertaken on the most stable whey protein–iron nanoparticles by measuring Caco-2 ferritin formation. A particle size analysis revealed that the majority of samples were sub-micron sized, ranging from 420–2400 nm for CS-DS particles and 220–1000 nm for WPI-CS samples. As expected, a higher chitosan concentration conferred a 17% more positive zeta potential on chromium-entrapped WPI nanoparticles, whilst a higher dextran volume decreased the size of CS-DS nanoparticles by 32%. The addition of iron also caused a significant increase in size for all samples, as seen where the loaded WPI samples were 296 nm larger than the empty particles. Caco-2 iron absorption revealed that one formulation, which had the lowest particle size (226 ± 10 nm), caused a 64% greater iron absorption compared to the ferrous sulfate standard. This study describes, for the first time, the novel design of chromium- and iron-entrapped nanoparticles, which could act as novel systems for oral drug delivery.

1. Introduction

Iron and chromium have major roles in the metabolism and oxygen exchange processes [1]. Chromium is a trace element that has received a significant interest in recent years. It aids in the metabolism of carbohydrates and is thought to impair glucose tolerance in those with chromium deficiencies. This can lead to the development of maturity-onset diabetes-a chronic condition costing the national health service (NHS) over nine billion Pounds sterling annually [2,3]. Chromium supplements can be used to prevent insulin resistance and may be seen in the future as a cost effective strategy to reduce the onset of type 2 diabetes [4]. Iron is an essential mineral that plays a vital role in oxygen transport and DNA replication [5]. Almost 20% of the world’s population is iron deficient—a condition that is prevalent in most countries [6]. Iron is lost from the body through the natural shedding of skin, during pregnancy and heavy menstruation but cannot be synthesized in vivo [7]. Iron is also poorly absorbed from dietary sources meaning that supplementation may be needed to maintain healthy levels. In previous studies, iron-entrapped nanoparticles were formulated using ascorbic acid which augments the absorption of dietary non-haem iron by reducing ferric iron to the bioavailable ferrous form [8,9,10].
Nanoparticles are defined as solid colloidal structures ranging in size from 1 to 1000 nm. They can be formed of natural polymers such as chitosan and have a number of advantages including enhancing the stability of drugs, increasing encapsulation efficiency and having better uptake in the small intestine. This is because nanoparticles can permeate enterocyte membranes easier than microparticles and can facilitate the controlled release of the encapsulated drug [11,12]. These qualities are of particular importance for this study because chromium is poorly absorbed (<2%) [13]. Therefore, nanoparticles were formulated because they can improve drug bioavailability and reduce toxicity whilst maintaining therapeutic effects [14].
Biopolymers are naturally abundant polymers and possess a broad range of attributes which can be used to optimize the properties of nanoparticles. In this study, chitosan (CS), dextran sulfate (DS) and whey protein isolate (WPI) were chosen due to them being cost effective and generally recognized as safe (GRAS) [15]. CS is a polysaccharide produced from the exoskeleton of crustaceans by the partial deacetylation of chitin [16]. It is composed of repeating glucosamine units and is a biodegradable and pharmaceutically acceptable excipient (Figure 1). CS has a pKa of 6.5 and possesses a high ratio of amino groups that undergo protonation in acidic conditions, making it soluble in water (Figure 1) [17]. It has mucoadhesive properties and can complex with chromium to produce nanoparticles. DS is a polyanionic polymer which possesses negatively charged sulfate groups, dictating its ability to form stable coacervates with CS [18]. It is highly hydrophilic and has been used to control the release of drugs such as doxorubicin [19]. Complex coacervation was chosen as opposed to ionic gelation because the nanoparticles have enhanced mechanical strength and stability than those traditionally produced using CS and sodium triphosphate [20].
Whey protein is a by-product of the cheese manufacturing process and consists of globular proteins, mainly β-lactoglobulin. It has excellent gelation properties and is widely used by athletes to stimulate muscle growth. Hence, it can work synergistically with chromium, which is suggested it can increase muscle mass, to improve nutritional health and athletic performance [21]. Therefore, chromium-entrapped nanoparticles were produced using whey protein isolate through thermal processing. Y. Chen was the first to fabricate and entrap an arginine-rich hexapeptide into CS-DS nanoparticles [22]. This increased the popularity of biopolymer-based nanoparticle research and led to further developments in the field such as the encapsulation of insulin into CS-based nanoparticles [23,24].
The aim of this study was to build on previous research by fabricating four types of novel chromium- and iron-entrapped nanoparticles using different ratios of biopolymers for oral drug delivery. The properties of the nanoparticles such as size, charge and stability were then assessed to find the optimum formulations. Permeability studies were also performed using Caco-2 cells to determine the differences in iron absorption between the formulations.

2. Materials and Methods

2.1. Materials

Low and medium molecular weight chitosan (75% deacetylated, 50/190 kDa), dextran sulfate (190 kDa), chromium (III) chloride hydrate (96%), acetic acid and ferrous sulfate heptahydrate were purchased from Sigma-Aldrich Co. (Dorset, UK). Unflavored whey protein isolate was obtained from Davisco Foods International Inc. (Eden Prairie, MN, USA). Sodium hydroxide pellets were purchased from VWR international (Philadelphia, PA, USA). All nanosuspensions were prepared using deionized water. Caco-2-cells (HTB-37) were obtained from ATCC (Manassas, VA, USA). Ferritin ELISA kit (Catalog Number: S22) was purchased from Ramco (Chichester, UK) and Pierce BCA protein assay kit was from Thermo Fisher Scientific (Cramlington, Northumberland, UK). Permeability studies were undertaken using Milli-Q water.

2.2. Preparation of the Nanoparticles

2.2.1. Preparation of CS–DS Nanoparticles

Empty CS–DS nanoparticles were prepared by complex coacervation method with some modification [19]. To study the effects of CS:DS ratio on particle properties, 0.1% (w/v) chitosan and dextran solutions were prepared. First 200 mg low molecular weight chitosan was dissolved in 0.175% (v/v) acetic acid whilst 200 mg dextran was dissolved in deionized water. Nanoparticles formed spontaneously when 10 mL chitosan was added to various volumes of dextran (Table 1) whilst magnetically stirring (300 rpm) for 15 min at room temperature. Chromium-entrapped nanoparticles were formulated by adding 0.1% (w/v) chromium hydrate to different volumes of 0.1% dextran solution. In total, 10 mL chitosan was then mixed with the chromium-dextran solution under magnetic stirring to form the nanoparticles. Iron-entrapped nanoparticles were produced in a similar fashion where ferrous sulfate was substituted for chromium. Additional formulations were also prepared using low molecular weight chitosan (LMW CS) and medium molecular weight chitosan (MMW CS) for all samples. Empty preparations were coded: LMW CS and MMW CS whilst chromium and iron-entrapped samples were called: LMW CS-Cr, MMW CS-Cr, LMW CS-Fe and MMW CS-Fe.

2.2.2. Preparation of Whey Protein-Chitosan Nanoparticles

Empty nanoparticles were produced using an adapted method developed by Giroux et al. [25]. First 2.5% (w/v) whey protein isolate solution was prepared by dispersing 2 g WPI in 80 mL deionized water. This was magnetically stirred at room temperature for 2 h to ensure complete dissolution of the WPI powder. Next, 0.1% (w/v) low molecular weight (LMW) chitosan solution was added dropwise to various volumes of the WPI solution whilst stirring at room temperature (Table 2). The sample was then heat-treated at 85 °C for 20 min and left to cool at room temperature for 15 min whilst magnetically stirring (~300 rpm). The pH was then adjusted to 7.5 using 10 mM NaOH. The same method was undertaken using medium MW chitosan.
Chromium-entrapped nanoparticles were produced using a similar procedure. First 5 mg chromium hydrate was fully dissolved into 2.5% WPI solution. Then 0.1% chitosan was added dropwise whilst stirring. The temperature was then increased to 85 °C and the pH adjusted.
Iron-entrapped nanoparticles were produced in a similar way to that stated above for chromium. Previous studies were used to determine the masses of iron and ascorbic acid to use [26,27]. These studies stated that an elemental iron to ascorbic acid ratio of 1:5 was required to sufficiently increase iron absorption. Therefore, since 10 mg ferrous sulfate contained 2 mg elemental iron, 10 mg ascorbic acid was used (Table 3). These were both dissolved in varying volumes of WPI solution following the same method shown above with a final iron concentration of 2.3 mM.
Additional formulations were produced for chromium and iron WPI-CS nanoparticles using 0.1% (w/v) medium MW chitosan (MMW CS-Cr, MMW CS-Fe) and 0.2% (w/v) low MW chitosan (0.2% LMW CS-Cr, 0.2% LMW CS-Fe) at each ratio. These were prepared using the same quantities and volumes as seen in Table 2 and Table 3.

2.3. Characterization of the Nanoparticles

2.3.1. Particle Size Analysis

Particle size was determined using dynamic light scattering (Zeta Plus analyzer, Brookhaven instruments, Holtsvilleg, Suffolk County, NY, USA). CS-DS nanoparticles were diluted appropriately with deionized water and sonicated (Fisher brand) at 80 kHz (pulse mode) for 1 min before measurement to prevent particle aggregation. WPI-CS nanoparticles were diluted in the same manner before analysis to avoid multiple scattering. All measurements were carried out at room temperature with each result being reported as the mean of 10 runs.

2.3.2. Zeta Potential Measurements

Zeta potential analysis was undertaken using electrophoretic light scattering (Zetasizer nanoseries, Malvern Instruments Ltd., Malvern, UK). Every sample was diluted to the same extent as in size analysis using deionized water before measurement. All results were recorded as the mean of three repeats.

2.3.3. Transmission Electron Microscopy (TEM)

The morphology of the nanoparticles was observed with a Philips Tecnai-12 FEI Transmission Electron Microscope (TEM) using an accelerating voltage of 120 kV. The TEM samples were prepared by depositing a drop of suspension on a carbon-coated copper grid and evaporating the liquid for 5–10 min prior to examination in the microscope.

2.4. Caco-2 Cell Iron Absorption

Iron absorption studies were undertaking using a method published by Zariwala et al. [8]. Four WPI-CS iron samples (which were the most physically stable over time) were assessed along with a ferrous sulfate standard. The four iron samples were—350:1 LMW CS-Fe, 350:1 MMW CS-Fe, 175:1 LMW CS-Fe and 125:1 LMW CS-Fe.
Caco-2 cells were seeded onto a 6-well plate with an initial seeding density of 5 × 10⁴ cells/cm2. Permeability studies commenced on day 13 post seeding so that the cells expressed characteristics of a fully matured enterocyte lining. First, the growth media was removed, and the cells were washed with wash solution (140 mM NaCl, 5 mM KCl, 10 mM piperazine-N,N′-bis (2-ethanesulfonic acid) buffer, pH 6.7, 37 °C). They were then incubated in serum-free Minimum Essential Media (MEM) for 24 h. On day 14, test media was prepared by adding 1 M NaOH to 250 mL serum free MEM until a pH 5.8 solution was obtained. This pH was chosen due to it mimicking the pH of the duodenum. The media was then filter sterilized (0.2 μm pore size) and aliquoted into centrifuge tubes. Next, 226 μL of each nanoparticle sample was added into the different tubes containing test media so that a final elemental iron concentration of 20 μM was achieved. This iron concentration was chosen due to it being the optimum conditions for the expression of divalent metal transporters in Caco-2 cells [26]. This meant that slight changes in iron absorption between the samples could be detected [8]. The cells were washed with wash solution before test media was added in duplicate to a 6-well plate. The plate was then incubated for 2 h at 37 °C in a rotary shaker (Thermo Scientific 4450, Waltham, Massachusetts, United States) at 6 rpm. Growth media (serum free MEM, pH 5.8) was then added and the cells were incubated for 24 h. After this period, removal solution (5 μM sodium hydrosulfite and 1 μM bathophenanthroline disulfonic acid) was added to remove surface bound iron. Cell lysis was then undertaken by adding 350 μL lysis buffer (50 mM NaOH, 10 μL protease inhibitor cocktail, 1 μL benzonase) to each well. The plate was then incubated at 4 °C on a plate rocker (8 rpm) for 25 min. A cell scraper was used to collect cell lysate which was pipetted into vials. Each lysate was then passed six times through a 1 mL syringe (25G needle) to reduce their viscosity.

2.5. Iron Absorption Analysis and Determination of Loading Efficiency

The total ferritin concentration was determined using a ferritin enzyme-linked immunosorbent assay. First, 8 standards (0–200 ng/mL) were produced using the kit diluent. In total, 30 μL of each standard and sample was pipetted into duplicate wells of a 96-well plate and 200 μL conjugated antihuman ferritin was then added into each well. The plate was incubated in a rotary shaker at 37 °C for 2 h after which 200 μL substrate solution was added into each well. After a further incubation period of 30 min at room temperature, 100 μL potassium ferricyanide was added to every well. A microplate reader (VersaMax, San Jose, CA, USA) was then used to measure the absorbance at 490 and 630 nm.
The total protein concentration was determined using a bicinchoninic acid assay. Pre-diluted bovine serum albumin was used as the standards. In total, 25 μL of the standards and samples were pipetted into duplicate wells. Working reagent was prepared and 200 μL added per well. After incubation (30 min, 37 °C) the absorbance was then read at 562 nm. These results were then used to standardize the ferritin concentration to calculate iron absorption. The loading efficiency of the nanoparticles (Table 1 and Table 3) was indirectly determined by preparing freeze dried samples of nanoparticles which were dissolved in in aqueous acetic acid solution (1% v/v) and the solutions were assayed for drug content using same essay above. The entrapment efficiency (%) was determined using the following equation:
Entrapment efficiency (%) = (weight of drug in nanoparticles)/(weight of initially used drug) × 100

2.6. Statistical Analysis

Particle size measurements were the mean of 10 replicates and zeta potential results were the mean of 3 replicates. Means and standard deviations were calculated using Microsoft Excel. Data were analyzed by one-way analysis of variance analysis of variance (ANOVA), followed by post-hoc Tukey’s HSD tests using SPSS (version 22, IBM, Armonk, NY, USA). Results were considered statistically significant if p ≤ 0.05.

3. Results

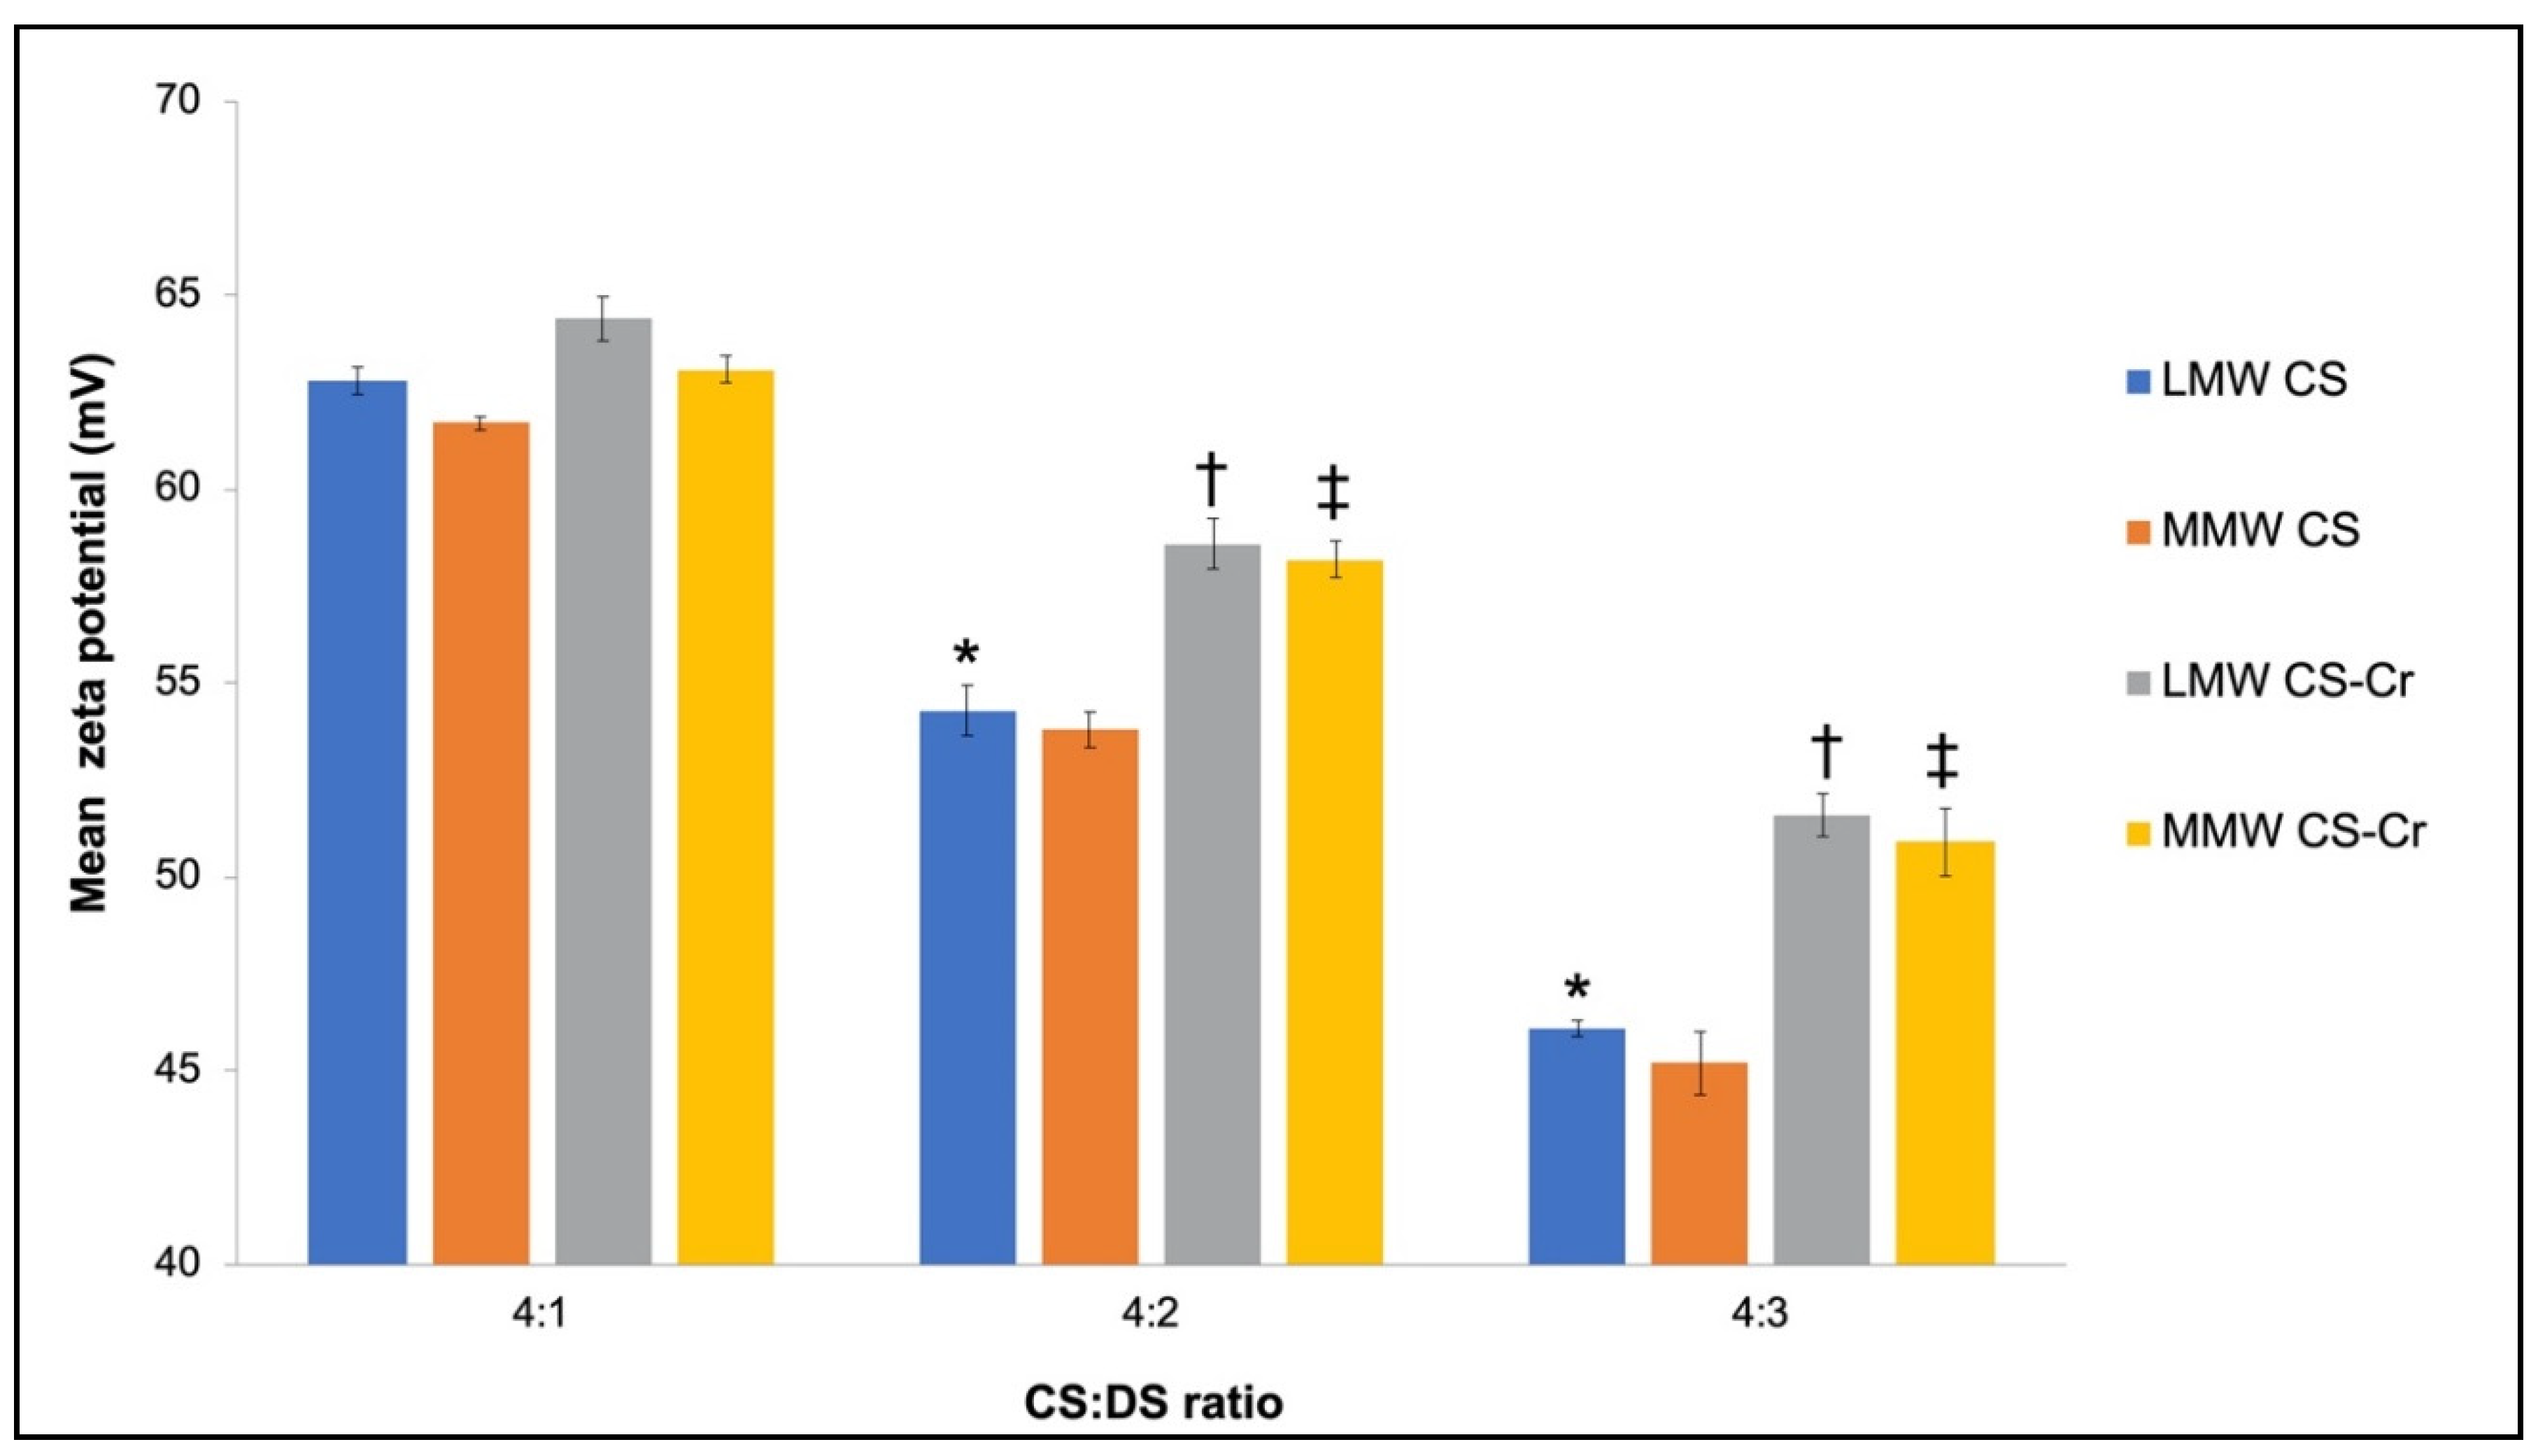
3.1. Physiochemical Characteristics of Chromium-Entrapped CS-DS Nanoparticles

The particle size of empty and chromium-entrapped CS-DS nanoparticles was the first dependent variable assessed. Figure 2 shows how the particle size changed as the ratio of CS:DS altered. Firstly, all samples were of submicron dimensions indicating the successful generation of nanoparticles. The largest particles (4:1 MMW CS-Cr) were 120% bigger than the smallest particles (4:3 LMW-CS). Secondly, as the molecular weight of chitosan increased, the particle size increased. This was seen at a 4:1 ratio where the MMW CS particles were 19% larger than the LMW CS particles. More so, as the volume of dextran increased, the size decreased. This was seen by there being a 32% decrease in size when comparing 4:1 MMW CS-Cr to 4:2 MMW CS-Cr. Generally, there was a narrow size distribution between the samples with minimal variation.
The zeta potential of chromium-entrapped particles was the second dependent variable studied. Figure 3 illustrates how particle charge was affected by different CS:DS ratios and molecular weights of CS. Firstly, all particles had positive zeta potentials with the charge of the most positive sample (4:1 LMW CS-Cr) being 1.4 times higher than that of the least positive sample (4:3 MMW CS). Secondly, the zeta potentials of the MMW CS samples were slightly lower than those produced using LMW CS. Furthermore, the chromium-entrapped samples had larger charges compared to empty samples at the same ratio. This was observed at 4:2 where the LMW CS-Cr sample had an 8% larger charge than LMW CS. Generally, when comparing Figure 2 and Figure 3 it was seen that the largest particles (produced at a CS:DS ratio of 4:1) also had the largest zeta potentials.

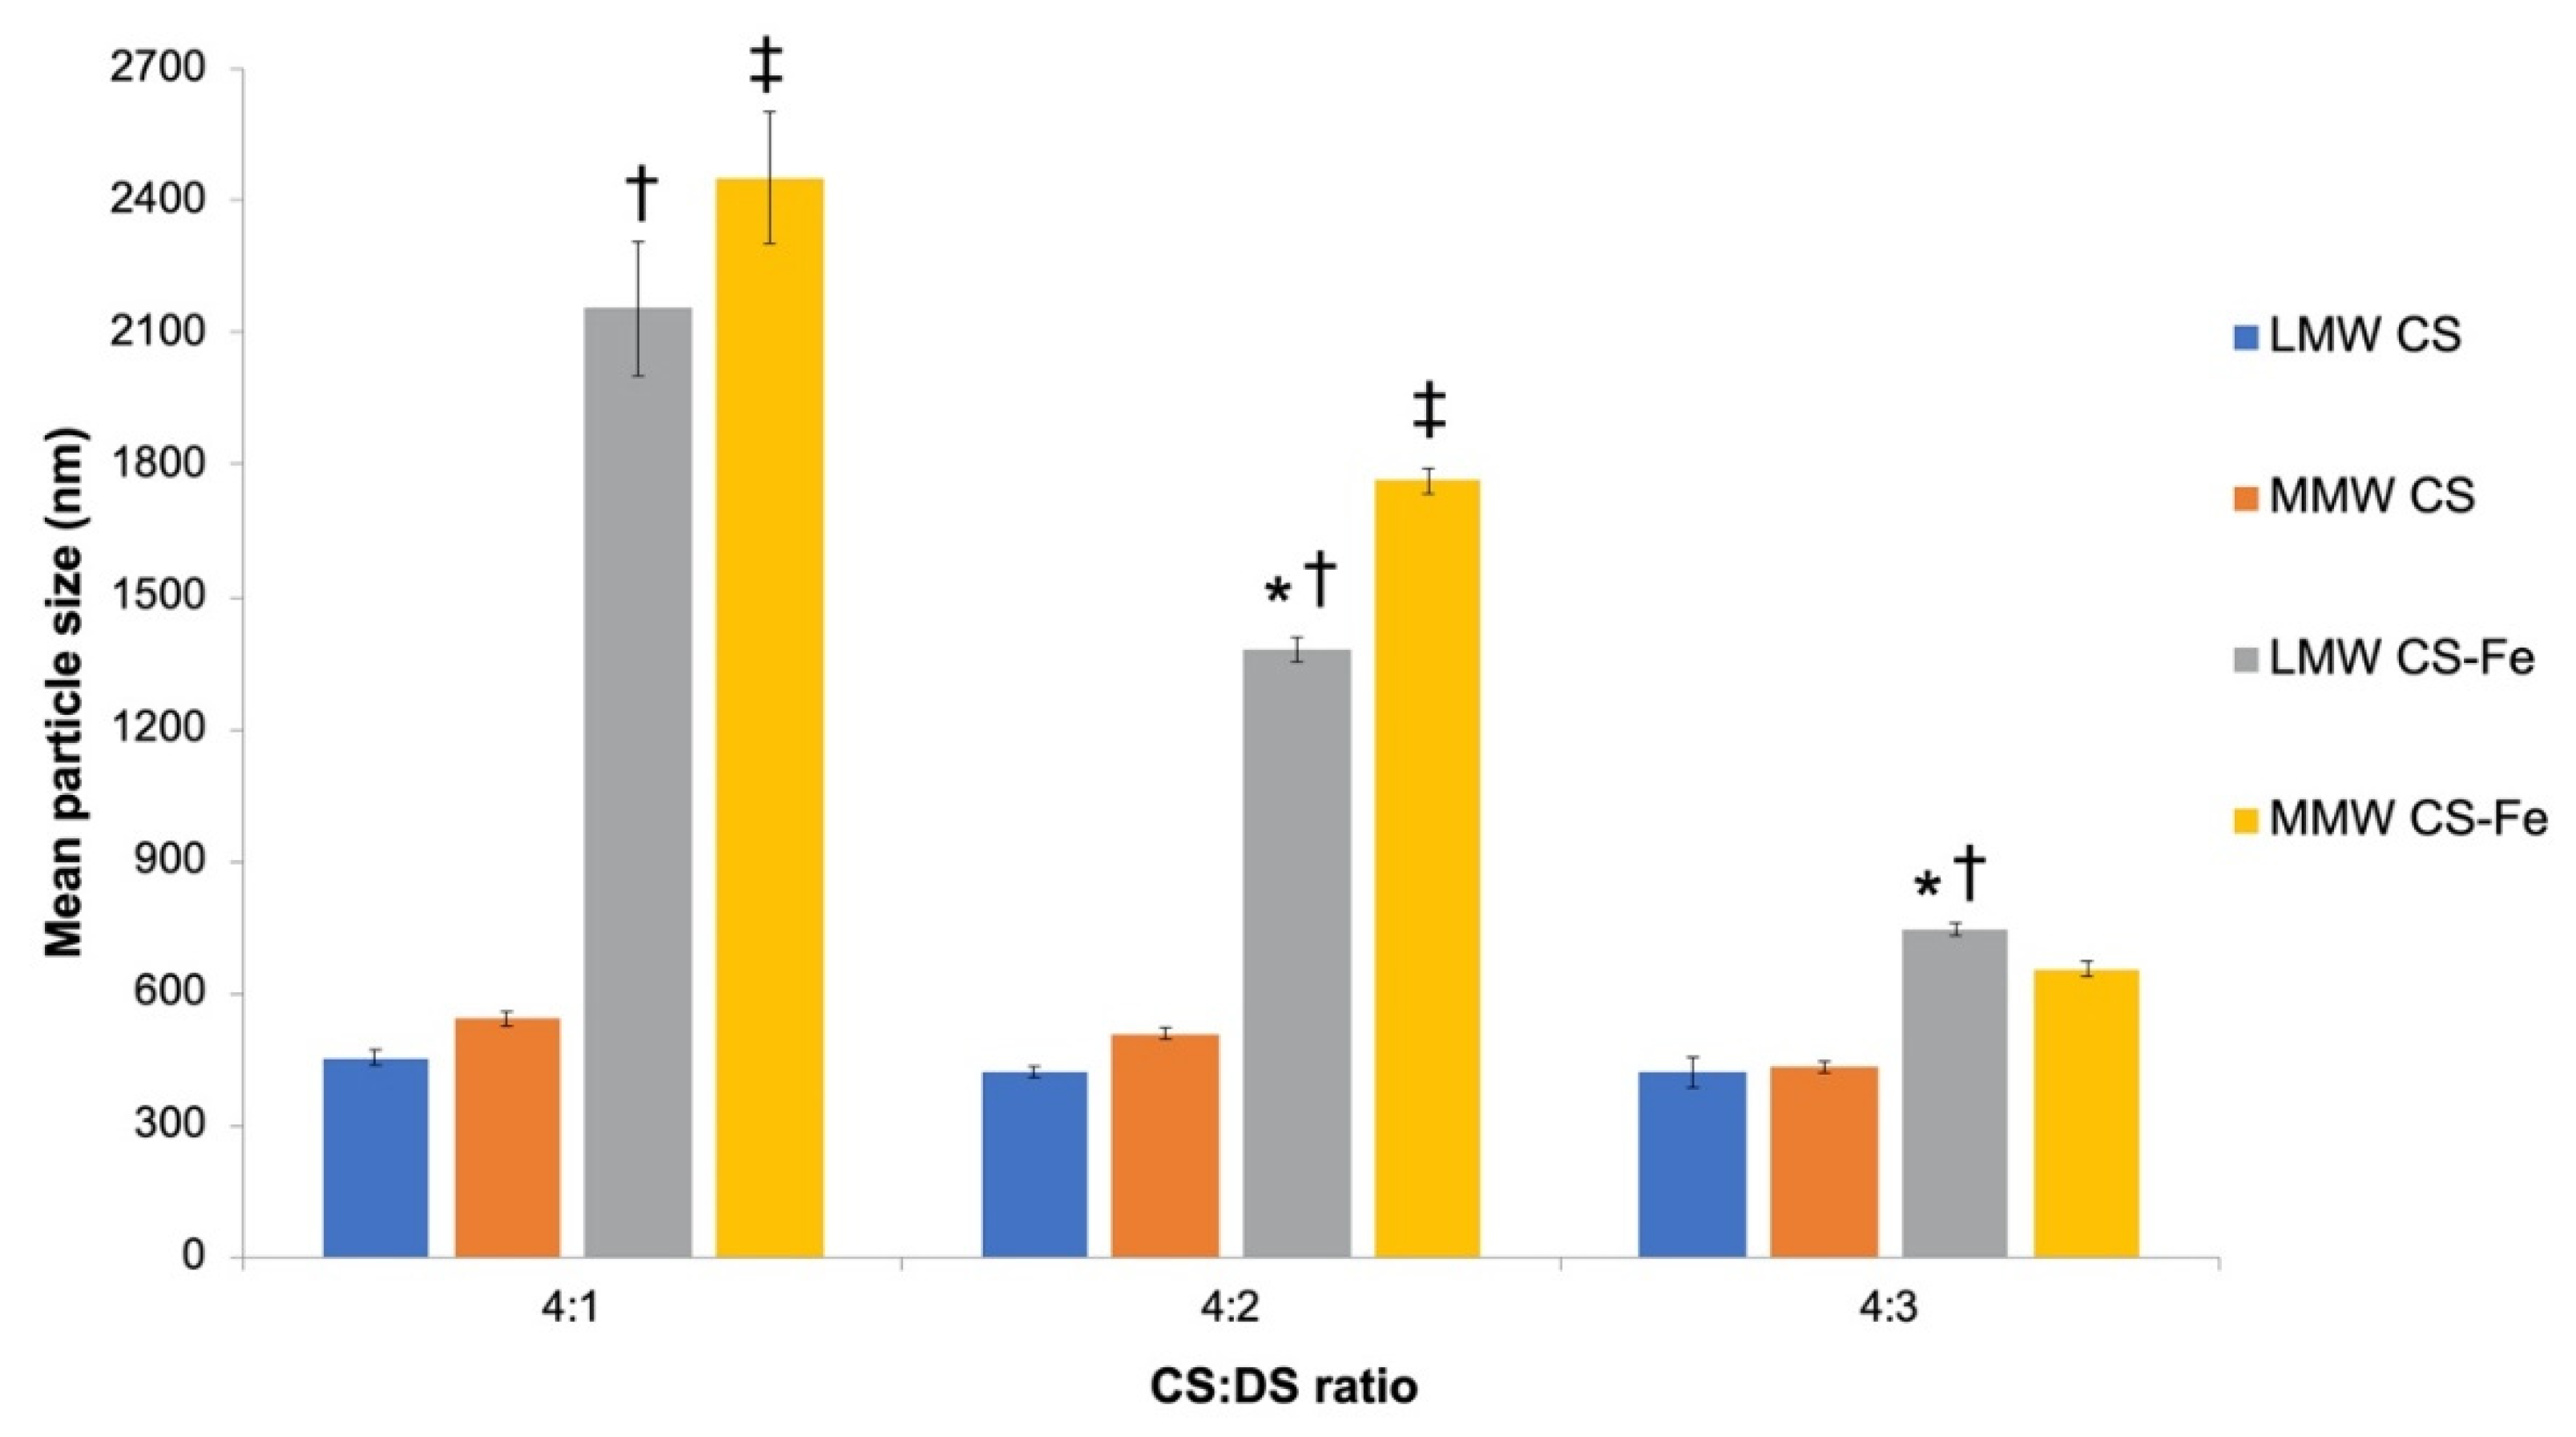
3.2. Physiochemical Characteristics of Iron-Entrapped CS-DS Nanoparticles and Submicron Particles

Iron-entrapped CS–DS nanoparticles and submicron particles were formulated, and their sizes measured using photon correlation spectroscopy (Figure 4). First, it was observed that iron nanoparticles were only formed at a 4:3 ratio as opposed to in Figure 2 where chromium nanoparticles were produced at all biopolymer ratios. Similarly, when comparing Figure 2 and Figure 4, all iron-entrapped nanoparticles were larger than those produced using chromium. More so, both Figures indicated that as the volume of dextran increased, the size decreased. Figure 4 also shows that as the molecular weight of chitosan increased, the particle size increased. However, this was not the case at a ratio of 4:3 where the opposite was true. Additionally, iron-entrapped particles were significantly larger than those which were empty at all ratios. This was seen at 4:1 where there was a 375% increase in size when iron was added to the LMW CS sample. Moreover, the iron-entrapped particles at a 4:1 ratio had a large size distribution as seen by large error bars.
The zeta potential of iron encapsulated CS-DS nanoparticles and submicron particles is shown in Figure 5. Several important observations can be made from the graph. First, the presence of iron led to a significant decrease in charge for all samples when compared to the empty particles. This is unlike Figure 3 where the opposite was true when chromium was added. Moreover, when comparing both figures it was seen that the iron-entrapped nanoparticles had lower zeta potentials at all biopolymer ratios than those made using chromium. A similarity between Figure 3 and Figure 5 is that samples produced using medium MW chitosan had slightly lower zeta potentials than those made using low MW chitosan. This was illustrated at 4:2 where MMW CS-Fe had an 11% lower charge than LMW CS-Fe. It was also the case that as the proportion of dextran increased, the charge decreased. Additionally, when comparing Figure 4 and Figure 5, the largest iron-entrapped particles (i.e., CS:DS 4:3) had the largest zeta potentials. This is reflected in loading efficiency as the CS:DS 4:3 sample showed highest loading efficiency (Table 1).

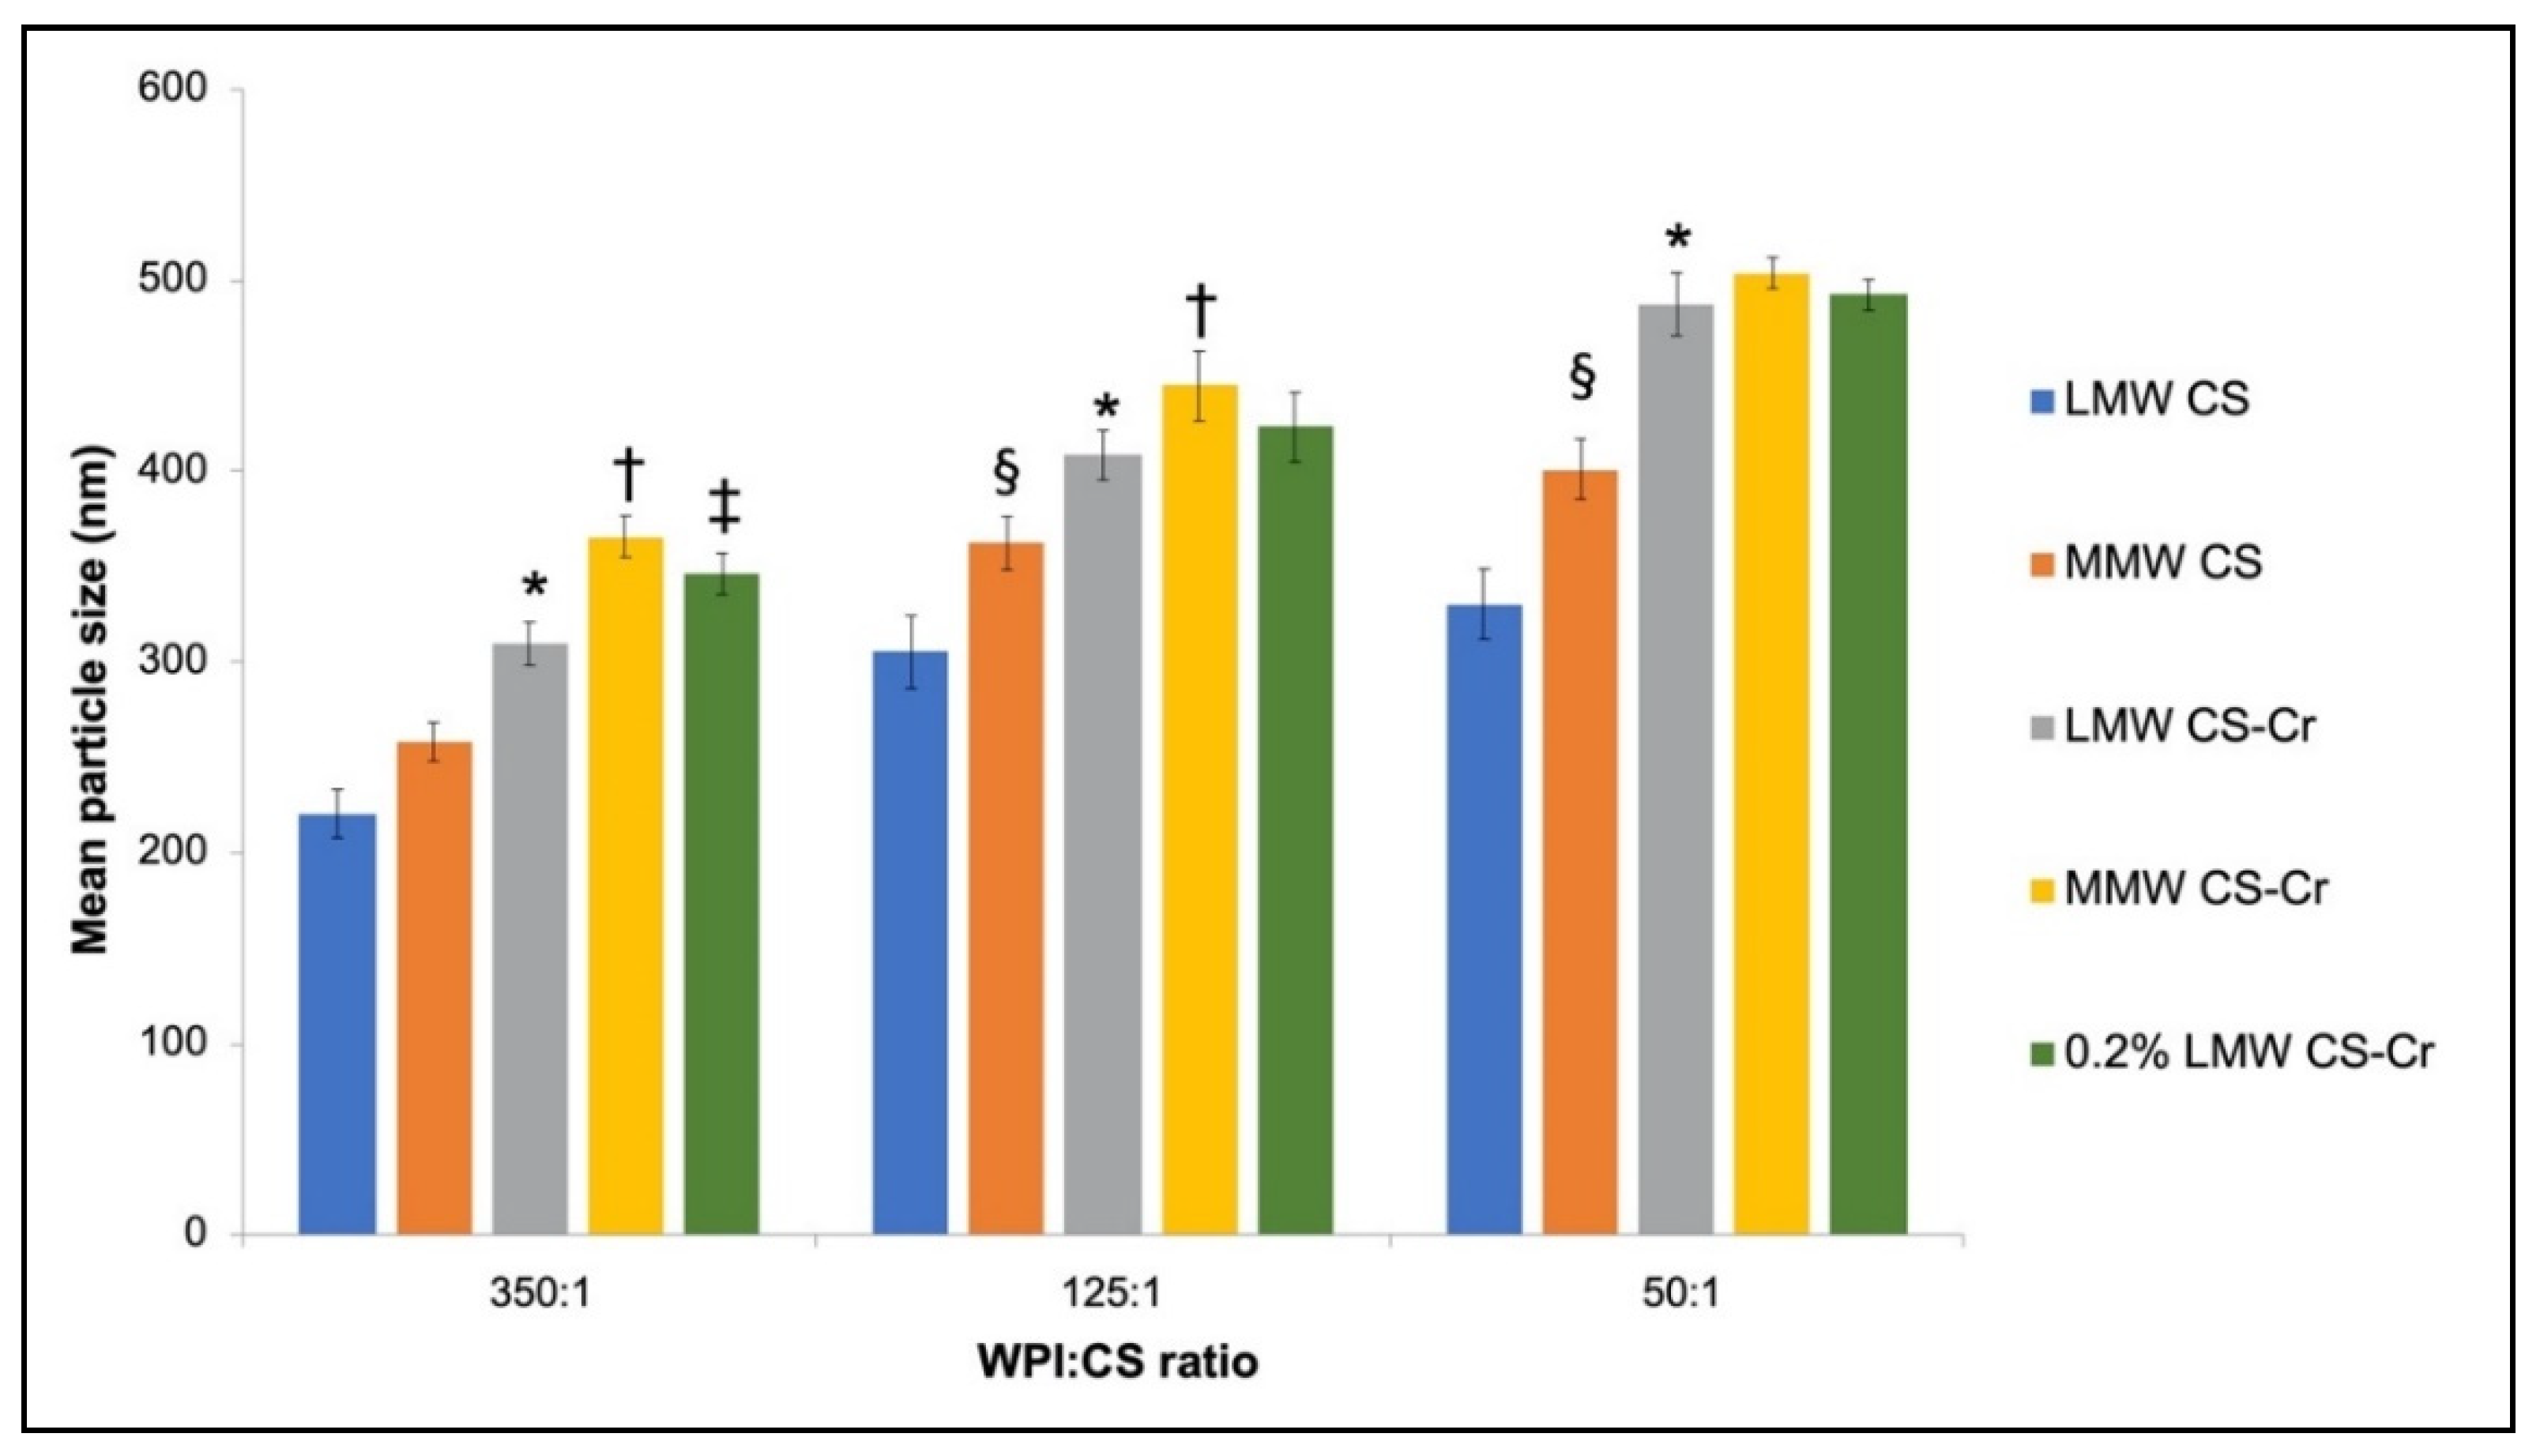
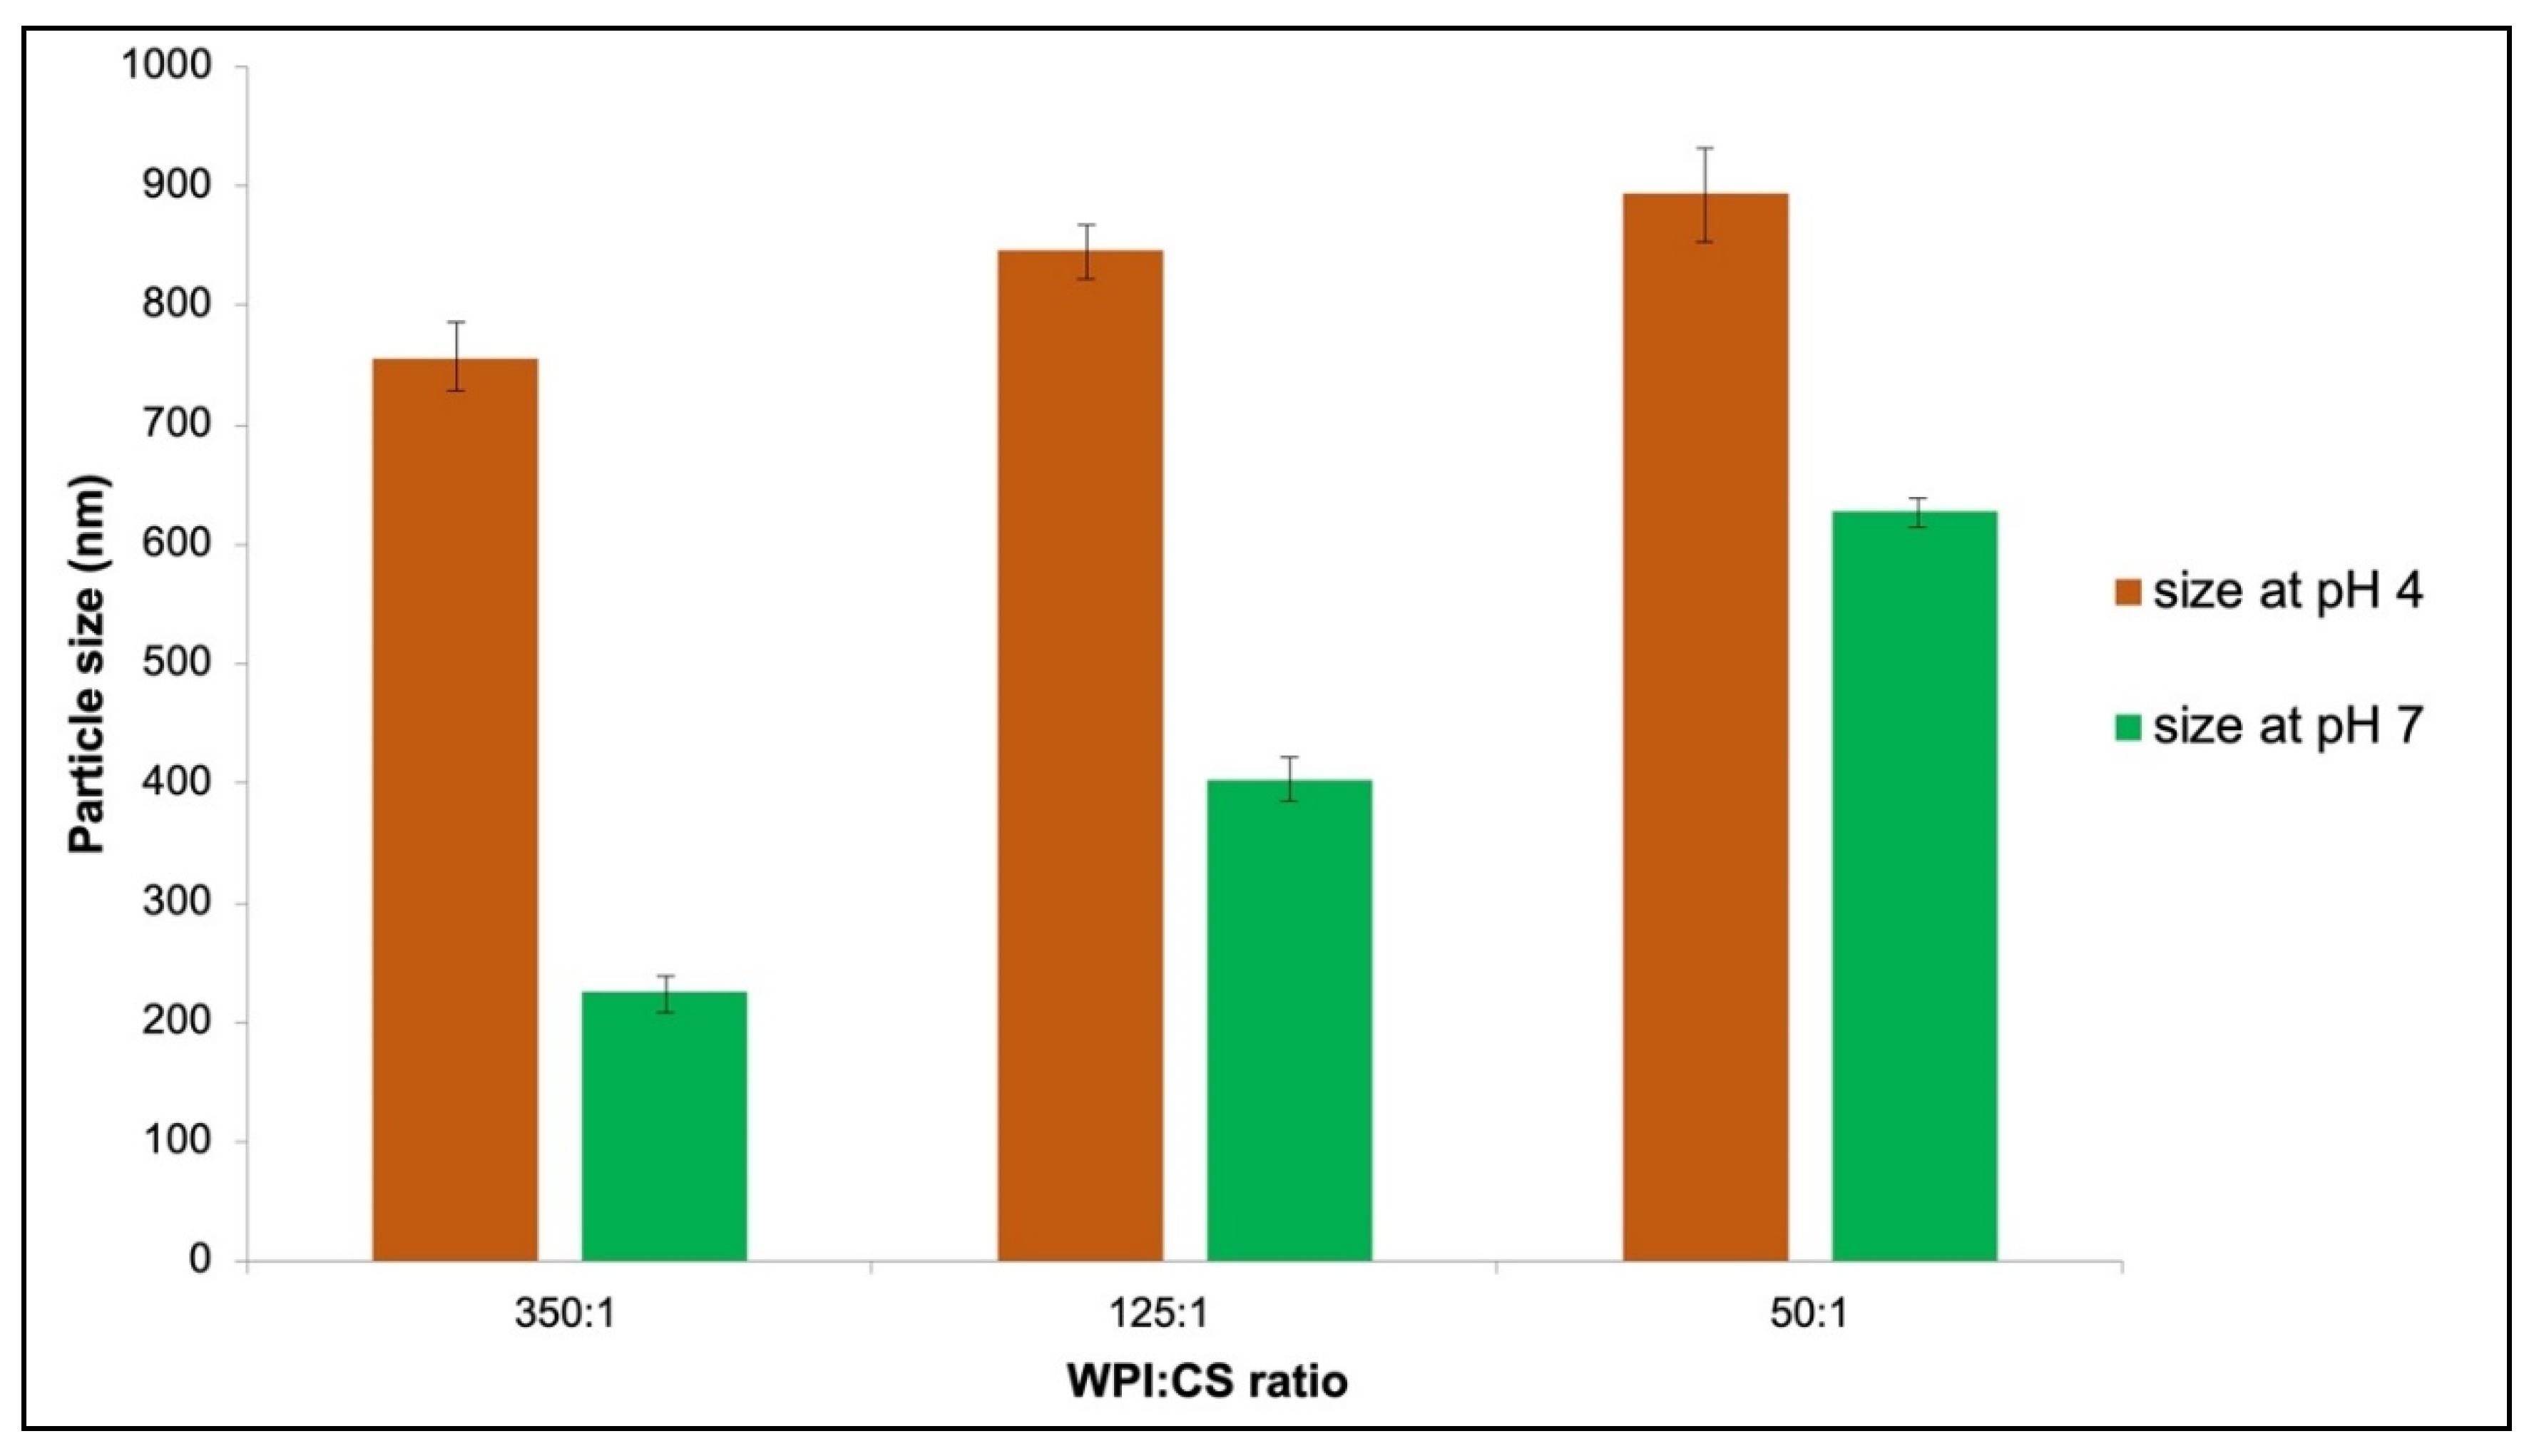
3.3. Physiochemical Characteristics of Chromium-Entrapped WPI-CS Nanoparticles

The sizes of chromium-entrapped whey protein nanoparticles are depicted in Figure 6. The Figure summarizes the variation in particle size as the volume of whey protein and CS changed. All the particles were submicron in size, ranging from 220 nm to 503 nm and as expected, the particle size increased with chromium entrapment. In addition, particle size increased as the volume of chitosan increased and when the molecular weight of CS was increased. Furthermore, it was observed that as the chitosan concentration increased from 0.1 to 0.2%, the particle size increased. This was seen at 350:1 where 0.2% LMW CS-Cr particles were 12% larger than those at LMW CS-Cr.
The zeta potential of chromium encapsulated WPI-CS nanoparticles is presented in Figure 7. As shown, it was observed that all particles exhibited a negative charge and that as the volume of chitosan increased, the charge increased. Similarly, particles produced using 0.2% CS had more positive zeta potentials than those produced using 0.1% CS. This was seen at 350:1 where 0.2% LMW CS-Cr was 17% more positive than LMW CS-Cr. More so, all particles produced using medium MW CS had a slightly more negative charge than those made using LMW CS. Moreover, chromium-entrapped samples were more positively charged than the empty formulations, similar to that seen in Figure 3.

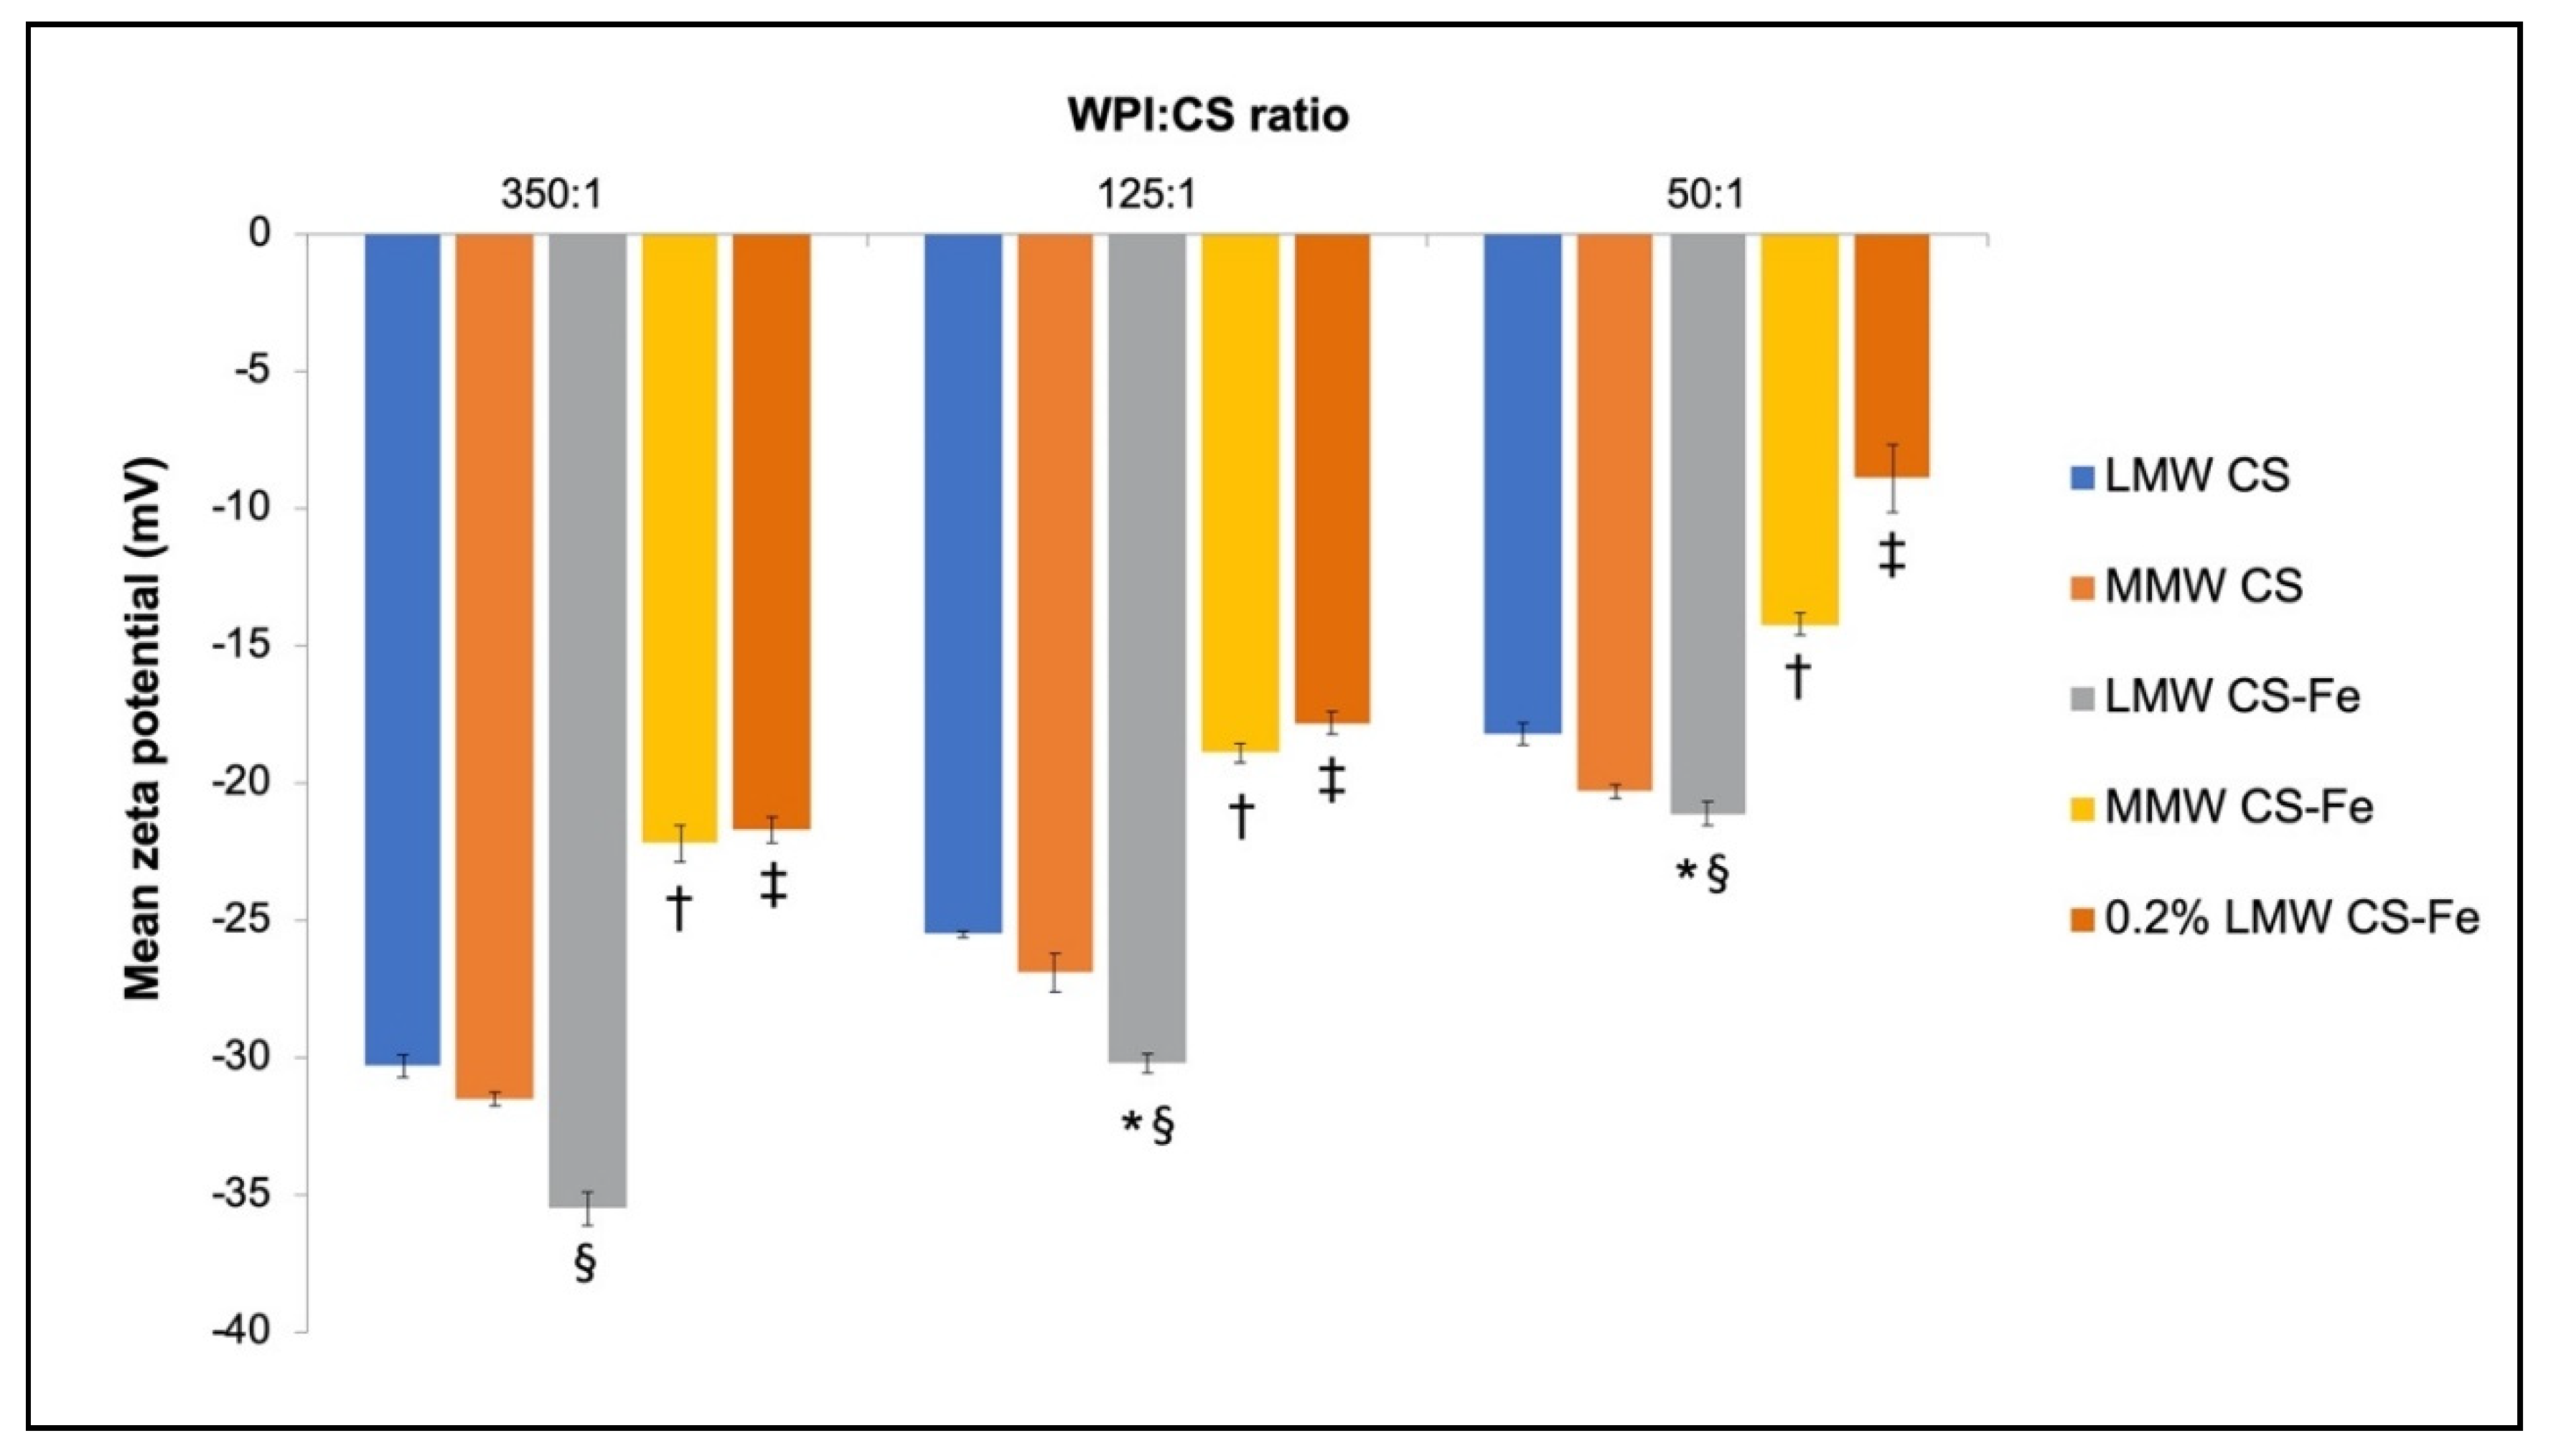
3.4. Physiochemical Characteristics of Iron-Entrapped WPI–CS Nanoparticles

The particle size for iron-entrapped WPI-CS nanoparticles was assessed, and the results depicted in Figure 8. The results showed that all except one sample produced particles smaller than 1000 nm. The largest iron encapsulated particles (50:1 MMW CS-Fe) were 4 times bigger than the smallest iron particles (350:1 LMW CS-Fe). Chitosan inclusion at 0.2% (w/v) resulted in the formation of larger particles, as seen at a 50:1 ratio where the particles were 1.3 times bigger than those at 0.1% LMW CS-Fe. Additionally, iron-entrapped samples were larger than those that were empty, as illustrated at 50:1 where the MMW CS-Fe particles were 2.5 times larger than the MMW empty particles. Lastly, as the molecular weight of CS increased, the size increased. This was seen at 350:1 where the MMW CS-Fe particles were 33% larger than the LMW CS-Fe particles.
The zeta potential of iron-entrapped WPI nanoparticles at pH 7.5 is displayed in Figure 9. Firstly, all the samples had a negative charge, with the most negative nanocarriers being produced using LMW CS-Fe. Secondly, as the CS concentration increased, the zeta potential became more positive. This was observed at 350:1 where 0.2% LMW CS-Fe was one time more positive than LMW CS-Fe. More so, the MMW CS-Fe formulations had significantly more positive charges than the LMW CS-Fe. This differed from data shown in Figure 7, where molecular weight generally had little effect on charge. Moreover, iron incorporation resulted in more positive zeta potentials for MMW particles but caused the opposite effect for LMW particles compared to the empty samples. The impact on loading efficiency can be clearly seen when varying the WPI:CS ratio (Table 3).

3.5. Caco-2 Cell Iron Permeability Studies

Permeability studies of the WPI-CS-Fe nanoparticles were undertaken using Caco-2 cells and the results shown in Figure 10. There was a large variation in iron uptake between the samples. The 350:1 LMW CS-Fe sample produced the highest iron absorption with 64% more ferritin being absorbed than from the ferrous sulfate reference. Similarly, the 175:1 LMW CS-Fe sample had an 8.7% higher iron absorption compared to the reference. In contrast, the sample produced using medium MW CS had the lowest iron absorption. Unexpectedly, the sample that contained a higher volume of chitosan (125:1 LMW CS-Fe) performed worse than the standard (a 7.7% decrease in absorption).

4. Discussion

Particle size was measured, as it can affect drug release and absorption. As seen in previous studies [7,8], smaller particles have larger surface area to volume ratios, leading to improvement in intestinal drug permeability and thus an increase in absorption. The intestinal clearance mechanisms are also minimized and this prolongs the residence time of the formulation [9]. The zeta potential is an important assessment of formulation stability and the extent to which particles permeate through membranes. Collectively, these factors play an integral role in the absorption of iron and chromium and can be tailored to give patients the most benefit from supplement therapies.

4.1. Properties of CS–DS Nanoparticles

Chitosan and dextran nanoparticles were produced via complex coacervation where the negatively charged sulfate groups of dextran interacted with the positively charge amino groups of chitosan (Figure 1). The properties of the particles were altered based on the biopolymer ratios used. Previous observations demonstrated that increasing dextran ratio in the system decreased particle size [18]. This was in accordance with Figure 2 and Figure 4 where there were inverse relationships between dextran ratio and size. A reason for this is due to the differing molecular weights of the two biopolymers [18]. In this study chitosan had a molecular weight of 50/190 kDa whilst that of dextran was 15.6 kDa. When chitosan ratio was high, there was repulsion between its cationic groups, leading to more cross linking sites becoming available to form hydrogen bonding with water [18]. This caused water to penetrate into the polymer matrices, causing the particles to swell and increase in size. However, when the ratio of dextran was lowered into the system, sites for electrostatic interactions were fully occupied with chitosan, leading to less hydration occurring [22]. These interactions also caused a decrease in the positive charge of chitosan, causing folding to occur and the formation of smaller particles with lower zeta potentials (Figure 2 and Figure 3). The higher levels of dextran also acted as a colloidal protectant, causing the retardation of inter/intra molecular interactions as a result of steric hindrance (1). This prevented aggregation occurring and could be the reason that smaller particles were formed at higher dextran volumes. As seen in other studies [28], particles made with MMW CS were larger than those produced with low MW CS. An explanation for this is that MMW CS contained longer chain meaning that the tertiary amine groups were harder to protonate. This meant that there were less electrostatic interactions between CS and DS, leading to the formation of larger particles [28]. The iron nanoparticles were generally considerably larger than those made using chromium. A reason for this is because rapid aggregation of the iron-entrapped particles occurred, as observed by the large error bars in Figure 4. Other studies have explored the use of polyethylene glycol-40 to improve colloidal stability [29]. However, this approach may affect drug release kinetics from the colloidal system.

4.2. Properties of WPI-CS Nanoparticles

Proteins contain both acidic and basic amino acids, giving them the unique ability to form nanoparticles with polysaccharides such as chitosan in certain environmental conditions. Whey protein was heat treated to 85 °C in order to denature the protein secondary structures and improve their solubility. When the pH was adjusted to 7.5 the secondary structures reorganized and unfolding occurred, leading to more cross linking sites becoming available [30]. There were also more thiol-disulfide exchange reactions occurring which caused further particle formation and the discouragement of aggregation. More so, chitosan and β-lactoglobulin had opposite charges at pH 7.5 causing electrostatic attraction and complexation to occur. This was clearly seen there was inverse correlation between the pH and size of formed nanoparticles (Figure 11). It is interesting to observe the impact of pH on size of the nanoparticles as chitosan is only soluble at lower pH values; however, the size of the particles has decreased at higher pH. This indicates favorable interactions with whey protein chains preventing precipitation of chitosan as separate colloidal particles.
Visual inspection of iron containing nanoparticles revealed stability dependent on WPI/CS ratio. As can be seen, there was a color change for samples that contained lower ratio of WPI/CS. WPI/CS 350:1 had similar color while the WPI/CS 50:1 showed noticeable color change. This is highlighted in Figure 12 where 50:1 LMW CS-Fe and 125:1 LMW CS-Fe changed color from orange to dark brown. As shown above, all samples contained similar amount of ascorbic acid which acts as antioxidant. Hence, this color change cannot be attributed to variable oxidation activity. Denaturing of whey protein isolate can also happen due to oxidative stress [31], which may contribute to this color change. This also highlights that using WPI/CS 350:1 has produced particles with optimum stability and encapsulation efficiency.
Larger particles were formed when the molecular weight of chitosan increased (Figure 6 and Figure 8). This agreed with previous work and occurred because the MMW CS had a lower aqueous solubility, meaning that aggregation was more likely to occur [32]. Conversely, LMW CS solution was less viscous, meaning that kinetic energy barrier for nanoparticle aggregation is enhanced which can promote formation of smaller nanoparticles. The same explanation was used to explain why the particle size increased as the concentration of chitosan increased; 0.2% CS was more viscous and less soluble, leading to inefficient particle formation. Furthermore, the zeta potential increased with increasing chitosan concentration (Figure 7 and Figure 9). This was because 0.2% chitosan imparted a more positive charge on the particle surfaces due to its positively charged amino groups [8]. Similarly, the particle size of iron and chromium-entrapped particles increased with an increased volume of CS (Figure 6 and Figure 8). Presence of chitosan chains and especially at the surface conferred the nanoparticles sufficient stability and promoted efficient encapsulation. This led to more chromium and iron being entrapped into particles, causing their size to increase. Moreover, when chromium and iron were added into the formulations, the sizes increased compared to empty samples. This is because chromium can adsorb to chitosan chains, leading to enhanced entrapment [33]. More so, the MMW CS-Fe particles had significantly higher zeta potentials than those produced with LMW CS-Fe (Figure 9). This was because MMW CS had a larger number of positively charged amine groups due to its longer chain lengths.

4.3. Iron Absorption in Caco-2 Cells

Caco-2 cells were used because they resemble intestinal enterocytes and the assay investigates the intestinal permeability of orally absorbed drugs [34]. As seen in Figure 10, both the 350:1 LMW CS and 175:1 CS samples caused higher iron absorptions compared to the ferrous sulfate standard. This was in agreement with the previous work which stated that ascorbic acid augments iron absorption [8]. Another reason for the enhancement is because chitosan was used in the formulations. Chitosan has mucoadhesive properties and as a result is a permeation enhancer which can cause the restructuring of tight junction-associated proteins [35]. Moreover, the low MW CS samples caused higher ferritin absorptions than the MMW CS sample because the particles exhibited smaller size. This meant they could permeate into the cells and the iron could interact with the divalent metal transporters [36]. The size of formed particles was submicron was in the nanometer range (Figure 13). This agreed with the size analysis results and confirmed that the formed nanoparticles exhibited a size range suitable for oral drug delivery. Due to challenges with the analysis of chromium, which requires the use of atomic absorption spectroscopy, our future work will focus on the analysis and optimization of chromium-loaded carriers.

5. Conclusions

This study reports the formation of novel iron and chromium-loaded nanoparticles using different biopolymers. The properties of the samples were characterized, culminating in an iron absorption assay. It was seen that increasing the chitosan volume and concentration significantly increased the particle size and zeta potential, whilst the opposite was true for dextran. Permeability studies showed that iron uptake was strongly correlated to particle size and that two samples produced higher absorptions than ferrous sulfate. The results demonstrate the ability of the nanoparticles to act as novel delivery vehicles for supplementary therapy in the future.

Author Contributions

Conceptualization, H.A.-O. and M.G.Z.; methodology, H.A.-O.; validation, H.A.-O., M.G.Z. and N.P.; formal analysis, H.A.-O., M.G.Z. and N.P.; investigation, H.A.-O., M.G.Z. and N.P.; resources, H.A.-O. and M.G.Z.; data curation, H.A.-O. and N.P.; writing—original draft preparation, H.A.-O. and N.P.; writing—review and editing, H.A.-O.; visualization, H.A.-O. and N.P.; supervision, H.A.-O.; project administration, H.A.-O. All authors have read and agreed to the published version of the manuscript.

Funding

This research received no external funding.

Conflicts of Interest

The authors declare no conflict of interest.

References

  1. Abbaspour, N.; Hurrell, R.; Kelishadi, R. Review on iron and its importance for human health. J. Res. Med. Sci. 2014, 19, 164–174. [Google Scholar]
  2. Singer, G.M.; Geohas, J. The effect of chromium picolinate and biotin supplementation on glycemic control in poorly controlled patients with type 2 diabetes mellitus: A placebo-controlled, double-blinded, randomized trial. Diabetes Technol. Ther. 2006, 8, 636–643. [Google Scholar] [CrossRef] [PubMed] [Green Version]
  3. Anderson, R.A.; Kozlovsky, A.S. Chromium intake, absorption and excretion of subjects consuming self-selected diets. Am. J. Clin. Nutr. 1985, 41, 1177–1183. [Google Scholar] [CrossRef]
  4. Hex, N.; Bartlett, C.; Wright, D.; Taylor, M.; Varley, D. Estimating the current and future costs of Type 1 and Type 2 diabetes in the UK, including direct health costs and indirect societal and productivity costs. Diabet. Med. 2012, 29, 855–862. [Google Scholar] [CrossRef] [PubMed]
  5. Lieu, P.T.; Heiskala, M.; Peterson, P.A.; Yang, Y. The roles of iron in health and disease. Mol. Aspects Med. 2001, 22, 1–87. [Google Scholar] [CrossRef]
  6. Zimmermann, M.B.; Hurrell, R.F. Nutritional iron deficiency. Lancet 2007, 370, 511–520. [Google Scholar] [CrossRef]
  7. Zariwala, M.G.; Somavarapu, S.; Farnaud, S.; Renshaw, D. Comparison study of oral iron preparations using a human intestinal model. Sci. Pharm. 2013, 81, 1123–1139. [Google Scholar] [CrossRef] [Green Version]
  8. Zariwala, M.G.; Farnaud, S.; Merchant, Z.; Somavarapu, S.; Renshaw, D. Ascorbyl palmitate/DSPE-PEG nanocarriers for oral iron delivery: Preparation, characterisation and in vitro evaluation. Colloids Surf. B Biointerfaces 2014, 115, 86–92. [Google Scholar] [CrossRef] [Green Version]
  9. Hallberg, L.; Brune, M.; Rossander-Hulthen, L. Is there a physiological role of vitamin C in iron absorption? Ann. N. Y. Acad. Sci. 1987, 498, 324–332. [Google Scholar] [CrossRef]
  10. Teucher, B.; Olivares, M.; Cori, H. Enhancers of iron absorption: Ascorbic acid and other organic acids. Int. J. Vitam. Nutr. Res. 2004, 74, 403–419. [Google Scholar] [CrossRef]
  11. Grenha, A. Chitosan nanoparticles: A survey of preparation methods. J. Drug Target. 2012, 20, 291–300. [Google Scholar] [CrossRef] [PubMed]
  12. Yue, Z.G.; Wei, W.; Lv, P.P.; Yue, H.; Wang, L.Y.; Su, Z.G.; Ma, G.H. Surface charge affects cellular uptake and intracellular trafficking of chitosan-based nanoparticles. Biomacromolecules 2011, 12, 2440–2446. [Google Scholar] [CrossRef] [PubMed]
  13. Jeejeebhoy, K.N. The role of chromium in nutrition and therapeutics and as a potential toxin. Nutr. Rev. 1999, 57, 329–335. [Google Scholar] [CrossRef] [PubMed]
  14. De Jong, W.H.; Borm, P.J. Drug delivery and nanoparticles: Applications and hazards. Int. J. Nanomed. 2008, 3, 133–149. [Google Scholar] [CrossRef] [Green Version]
  15. Joye, I.J.; McClements, D.J. Biopolymer-based nanoparticles and microparticles: Fabrication, characterization, and application. Curr. Opin. Colloid Interface Sci. 2014, 19, 417–427. [Google Scholar] [CrossRef]
  16. Bowman, K.; Leong, K.W. Chitosan nanoparticles for oral drug and gene delivery. Int. J. Nanomed. 2006, 1, 117–128. [Google Scholar] [CrossRef]
  17. Agnihotri, S.A.; Mallikarjuna, N.N.; Aminabhavi, T.M. Recent advances on chitosan-based micro- and nanoparticles in drug delivery. J. Control. Release 2004, 100, 5–28. [Google Scholar] [CrossRef]
  18. Chen, Y.; Mohanraj, V.J.; Wang, F.; Benson, H.A. Designing chitosan-dextran sulfate nanoparticles using charge ratios. AAPS PharmSciTech 2007, 8, E98. [Google Scholar] [CrossRef] [Green Version]
  19. Mitra, S.; Gaur, U.; Ghosh, P.C.; Maitra, A.N. Tumour targeted delivery of encapsulated dextran-doxorubicin conjugate using chitosan nanoparticles as carrier. J. Control. Release 2001, 74, 317–323. [Google Scholar] [CrossRef]
  20. Calvo, P.; Remuñán-López, C.; Vila-Jato, J.L.; Alonso, M.J. Novel hydrophilic chitosan-polyethylene oxide nanoparticles as protein carriers. J. Appl. Polym. Sci. 1997, 63, 125–132. [Google Scholar] [CrossRef]
  21. Ziegenfuss, T.N.; Lopez, H.L.; Kedia, A.; Habowski, S.M.; Sandrock, J.E.; Raub, B.; Kerksick, C.M.; Ferrando, A.A. Effects of an amylopectin and chromium complex on the anabolic response to a suboptimal dose of whey protein. J. Int. Soc. Sports Nutr. 2017, 14, 6. [Google Scholar] [CrossRef] [PubMed] [Green Version]
  22. Chen, Y.; Mohanraj, V.J.; Parkin, J.E. Chitosan-dextran sulfate nanoparticles for delivery of an anti-angiogenesis peptide. Lett. Pept. Sci. 2003, 10, 621–629. [Google Scholar] [CrossRef]
  23. Zamproni, L.N.; Teixeira, D.; Alliegro, A.A.; Maugeri, I.L.; des Rieux, A.; Porcionatto, M.A. Decreased viability and neurite length in neural cells treated with chitosan-dextran sulfate nanocomplexes. Neurotoxicology 2020, 76, 33–43. [Google Scholar] [CrossRef] [PubMed]
  24. Wang, F.; Li, J.; Tang, X.; Huang, K.; Chen, L. Polyelectrolyte three layer nanoparticles of chitosan/dextran sulfate/chitosan for dual drug delivery. Colloids Surf. B Biointerfaces 2020, 190, 110925. [Google Scholar] [CrossRef] [PubMed]
  25. Giroux., H.J.; Houde, J.; Britten, M. Preparation of nanoparticles from denatured whey protein by pH-cycling treatment. Food Hydrocoll. 2010, 24, 341–346. [Google Scholar] [CrossRef]
  26. Stekel, A.; Olivares, M.; Pizarro, F.; Chadud, P.; Lopez, I.; Amar, M. Absorption of fortification iron from milk formulas in infants. Am. J. Clin. Nutr. 1986, 43, 917–922. [Google Scholar] [CrossRef] [PubMed]
  27. Derman, D.P.; Bothwell, T.H.; MacPhail, A.P.; Torrance, J.D.; Bezwoda, W.R.; Charlton, R.W.; Mayet, F.G. Importance of ascorbic acid in the absorption of iron from infant foods. Scand. J. Haematol. 1980, 25, 193–201. [Google Scholar] [CrossRef]
  28. Maryam, K.; Avadi, M.; Abbaspour, M.; Jahangiri, A.; Boldaji, S. Effect of different molecular weights of chitosan on preparation and characterization of insulin loaded nanoparticles by ion gelation method. Int. J. Drug Dev. Res. 2012, 4, 271–277. [Google Scholar]
  29. Chaiyasan, W.; Srinivas, S.P.; Tiyaboonchai, W. Mucoadhesive chitosan-dextran sulfate nanoparticles for sustained drug delivery to the ocular surface. J. Ocul. Pharmacol. Ther. 2013, 29, 200–207. [Google Scholar] [CrossRef] [Green Version]
  30. Anal, A.K.; Tobiassen, A.; Flanagan, J.; Singh, H. Preparation and characterization of nanoparticles formed by chitosan-caseinate interactions. Colloids Surf. B Biointerfaces 2008, 64, 104–110. [Google Scholar] [CrossRef]
  31. Feng, X.; Li, C.; Ullah, N.; Cao, J.; Lan, Y.; Ge, W.; Hackman, R.M.; Li, Z.; Chen, L. Susceptibility of whey protein isolate to oxidation and changes in physicochemical, structural, and digestibility characteristics. J. Dairy Sci. 2015, 98, 7602–7613. [Google Scholar] [CrossRef] [PubMed] [Green Version]
  32. Guzey, D.; McClements, D.J. Characterization of β-lactoglobulin–chitosan interactions in aqueous solutions: A calorimetry, light scattering, electrophoretic mobility and solubility study. Food Hydrocoll. 2006, 20, 124–131. [Google Scholar] [CrossRef]
  33. Rojas, G.; Silva, J.; Flores, J.; Rodriguez, A.; Ly, M. Adsorption of chromium onto cross-linked chitosan. Sep. Purif. Technol. 2005, 44, 31–36. [Google Scholar] [CrossRef]
  34. Omar Zaki, S.S.; Ibrahim, M.; Katas, H. Particle Size Affects Concentration-Dependent Cytotoxicity of Chitosan Nanoparticles towards Mouse Hematopoietic Stem Cells. J. Nanotechnol. 2015, 2015, 919658. [Google Scholar] [CrossRef] [Green Version]
  35. Ma, Z.; Lim, L.Y. Uptake of chitosan and associated insulin in Caco-2 cell monolayers: A comparison between chitosan molecules and chitosan nanoparticles. Pharm. Res. 2003, 20, 1812–1819. [Google Scholar] [CrossRef] [PubMed]
  36. Hubert, N.; Hentze, M. Previously uncharacterized isoforms of divalent metal transporter (DMT)-1: Implications for regulation and cellular function. Proc. Natl. Acad. Sci. USA 2002, 99, 12345–12350. [Google Scholar] [CrossRef] [Green Version]
Figure 1. Chemical structures of (a) chitosan and (b) dextran sulfate with indication of their ionizable groups.
Processes 08 00707 g001
Figure 2. Particle size of empty and chromium-entrapped CS-DS nanoparticles when using different MWs of chitosan at various CS:DS ratios. Results are shown as mean ± standard deviation (SD) (n = 10). Data were considered statistically different when p < 0.05. * indicates significant difference comparing 4:1 medium molecular weight (MMW) CS-Cr to MMW CS-Cr at other ratios, † indicates a significant difference between low molecular weight (LMW) CS and MMW CS at the same ratio, ‡ indicates a significant difference between LMW CS and LMW CS-Cr at the same ratio.
Processes 08 00707 g002
Figure 3. Zeta potential of chromium-entrapped CS-DS nanoparticles when using different MWs of chitosan at various CS:DS ratios. Results are shown as mean ± SD (n = 3). Data were considered statistically different when p < 0.05. * indicates significant difference comparing 4:1 LMW CS to LMW CS samples at other ratios, † indicates a significant difference between LMW CS and LMW CS-Cr at the same ratio, ‡ indicates a significant difference between MMW CS and MMW CS-Cr at the same ratio.
Processes 08 00707 g003
Figure 4. Effects of CS:DS ratio, iron entrapment and chitosan molecular weight on particle size. Results are shown as mean ± SD (n = 10). Data were considered statistically different when p < 0.05. * indicates sig. difference comparing 4:1 LMW CS-Fe to LMW CS-Fe at other ratios, † indicates a significant difference between LMW CS and LMW CS–Fe at the same ratio, ‡ indicates a significant difference between LMW CS-Fe and MMW CS-Fe at the same ratio.
Processes 08 00707 g004
Figure 5. Zeta potential of iron-entrapped CS-DS nanoparticles when using different MWs of chitosan at various CS:DS ratios. Results are shown as mean ± SD (n = 3). Data were considered statistically different when p < 0.05. * indicates a significant difference between LMW CS and LMW CS-Fe at the same ratio, † indicates a significant difference between LMW and MMW CS-Fe at the same ratio, ‡ indicates a significant difference between MMW CS and MMW CS-Fe at the same ratio.
Processes 08 00707 g005
Figure 6. Particle size of chromium-entrapped WPI nanoparticles when using different MWs and concentrations of chitosan at various WPI:CS ratios. Results are shown as mean ± SD (n = 10). Data were considered statistically different when p < 0.05. * indicates a significant difference between LMW CS and LMW CS-Cr at the same ratio, † indicates a significant difference between LMW CS-Cr and MMW CS-Cr at the same ratio, ‡ indicates a significant difference between LMW CS-Cr and 0.2% LMW CS-Cr at the same ratio, § indicates a significant difference comparing 350:1 MMW CS to MMW CS at other ratios.
Processes 08 00707 g006
Figure 7. Zeta potential of chromium-entrapped WPI nanoparticles when using different MWs and concentrations of chitosan at various WPI:CS ratios. Results are shown as mean ± SD (n = 3). Data were considered statistically different when p < 0.05. * indicates a significant difference between 350:1 0.2% chromium-entrapped particles and 0.2% particles at other ratios, † indicates a significant difference between LMW CS-Cr and MMW CS-Cr at the same ratio, ‡ indicates a significant difference between LMW CS and LMW CS-Cr at the same ratio, § indicates a significant difference between LMW CS-Cr and 0.2% LMW CS-Cr at the same ratio.
Processes 08 00707 g007
Figure 8. Particle size of iron-entrapped WPI nanoparticles when using different MWs and concentrations of chitosan at various WPI:CS ratios. Results are shown as mean ± SD (n = 10). Data were considered statistically different when p < 0.05. * indicates a significant difference between LMW CS-Fe and 0.2% LMW CS-Fe at the same ratio, † indicates a significant difference LMW CS-Fe and MMW CS-Fe at the same ratio, ‡ indicates a significant difference between MMW CS and MMW CS-Fe at the same ratio.
Processes 08 00707 g008
Figure 9. Zeta potential of iron-entrapped WPI nanoparticles when using different MWs and concentrations of chitosan at various WPI:CS ratios. Results are shown as mean ± SD (n = 3). Data were considered statistically different when p < 0.05. * indicates a significant difference comparing 350:1 LMW CS to LMW CS at other ratios, † indicates a significant difference between LMW CS-Fe and MMW CS-Fe at the same ratio, ‡ indicates a significant difference between LMW CS-Fe and 0.2% LMW CS-Fe at the same ratio, § indicates a significant difference between LMW CS and LMW CS-Fe at the same ratio.
Processes 08 00707 g009
Figure 10. Iron absorption by Caco-2 cells incubated with WPI-CS-Fe nanoparticle preparations.
Processes 08 00707 g010
Figure 11. The effect of pH on the particle size of iron-entrapped WPI-CS nanoparticles produced using low MW chitosan.
Processes 08 00707 g011
Figure 12. Physical stability of iron-entrapped WPI-CS nanosuspensions (a) 10 min and (b) 10 days post-production. From left to right—50:1 LMW CS-Fe, 125:1 LMW CS-Fe, 350:1 LMW CS-Fe.
Processes 08 00707 g012
Figure 13. Transmission electron microscopy image of WPI-CS nanoparticles.
Processes 08 00707 g013
Table 1. Composition of chitosan–dextran sulfate (CS-DS) nanoparticle formulations (not determined (ND)).
Type of NanoparticleCS:DS RatioChitosan Volume (mL)Dextran Volume (mL)Chromium Hydrate (mg)Ferrous Sulfate (mg)Loading Efficiency (%)
empty4:1102.5---
empty4:2105.0---
empty4:3107.5---
Cr entrapped4:1102.512.5-ND
Cr entrapped4:2105.015.0-ND
Cr entrapped4:3107.517.5-ND
Fe entrapped4:1102.5-12.513 ± 2.3
Fe entrapped4:2105.0-15.021 ± 4.5
Fe entrapped4:3107.5-17.547 ± 5.2
Table 2. Composition of empty and chromium-loaded whey protein isolate (WPI)-CS nanoparticle formulations.
SampleWPI:CS Ratio Whey Protein (mL)Chitosan (mL)Chromium Hydrate (mg)
empty50:110.05.0-
empty125:112.52.5-
empty350:114.01.0-
Cr loaded50:110.05.05
Cr loaded125:112.52.55
Cr loaded350:114.01.05
Table 3. Composition of iron loaded WPI-CS nanoparticle formulations.
WPI:CS Ratio Whey Protein (mL)Chitosan (mL)Ferrous Sulfate (mg)Ascorbic Acid (mg)Loading Efficiency (%)
50:110.05.0101029 ± 4.3
125:112.52.5101038 ± 4.1
350:114.01.0101054 ± 3.5

