Statistical Optimization by the Response Surface Methodology of Direct Recycled Aluminum-Alumina Metal Matrix Composite (MMC-AlR) Employing the Metal Forming Process


Abstract
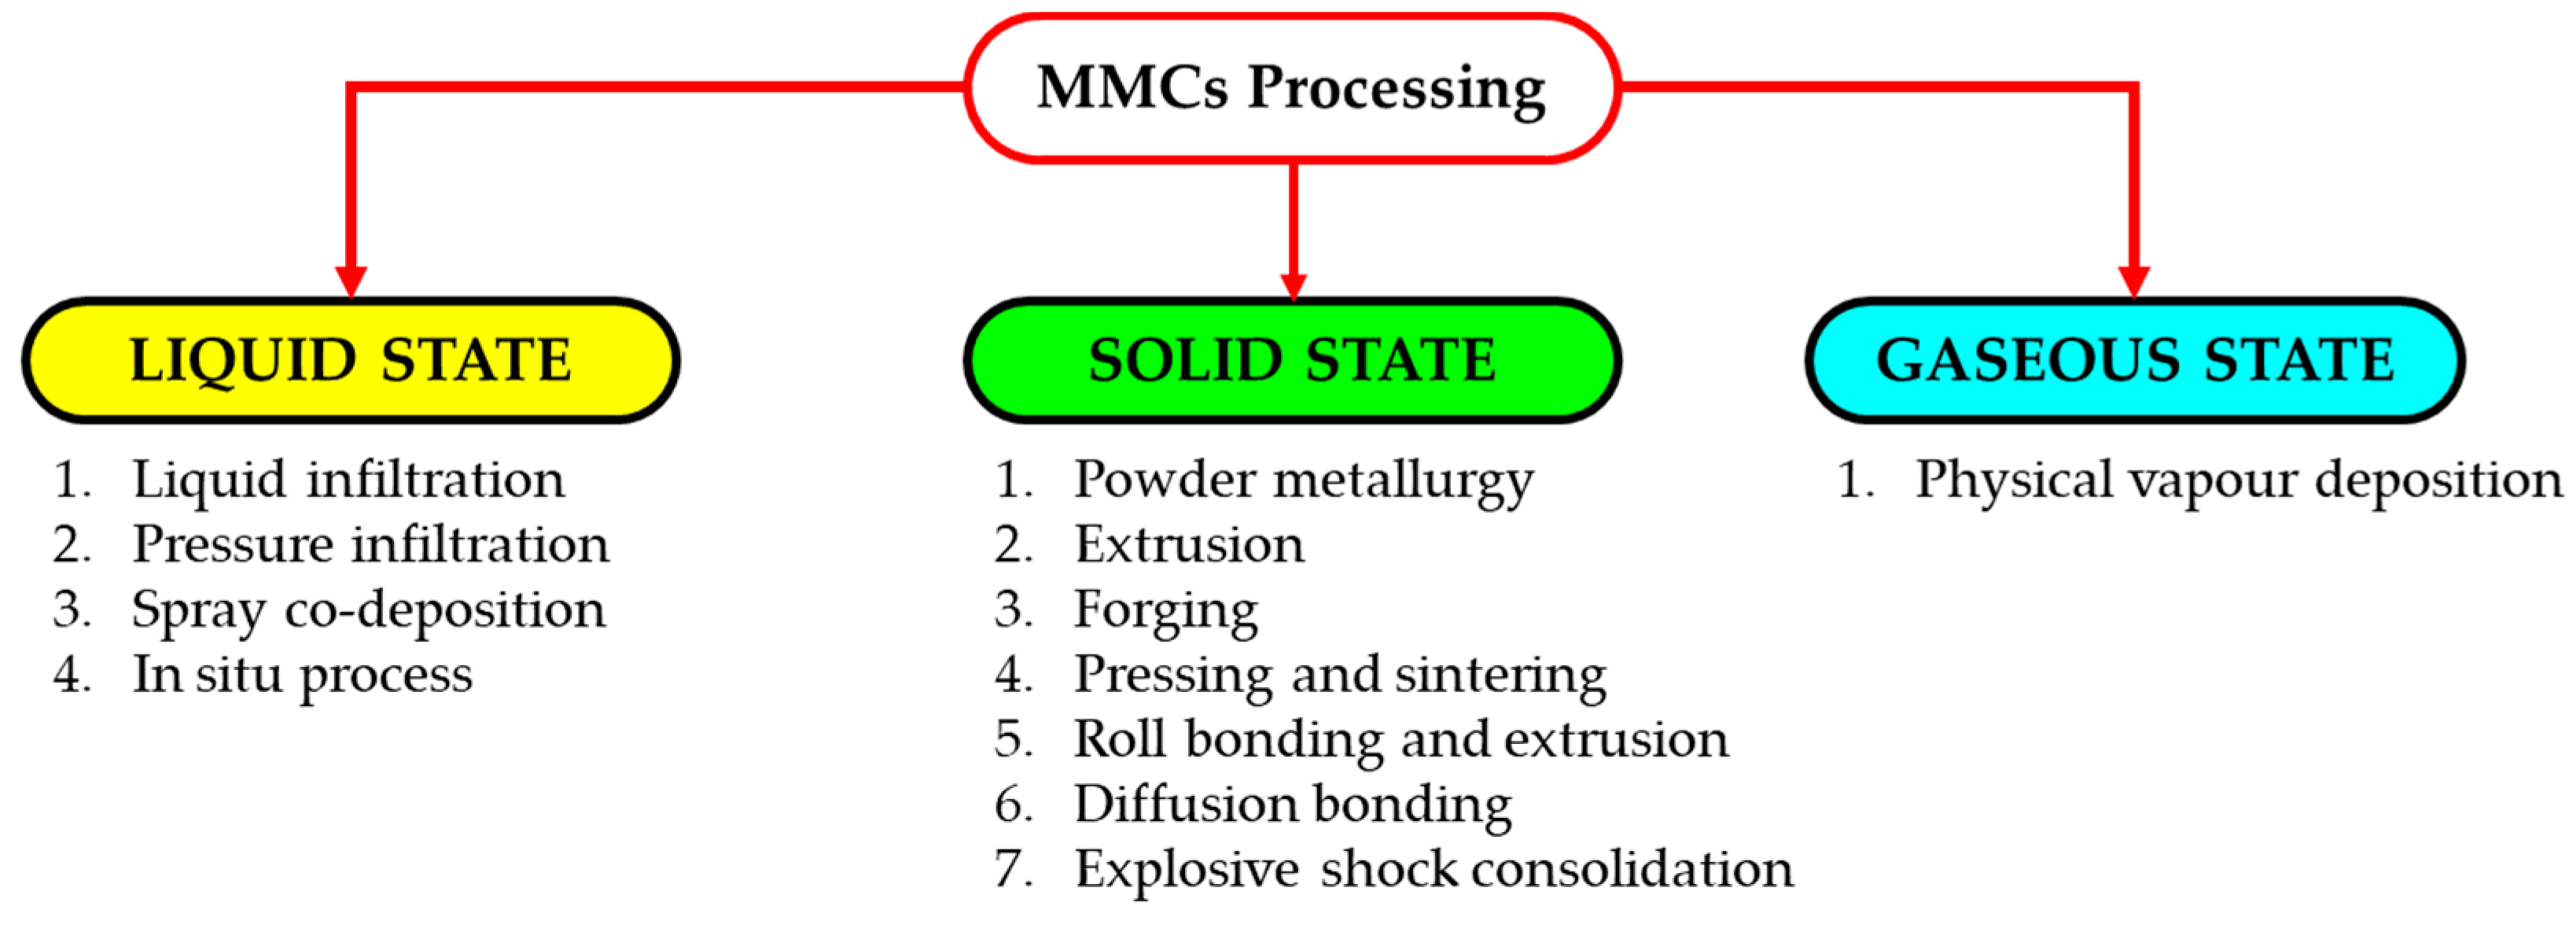
1. Introduction
2. Methodology
2.1. Material
2.2. Preparation
2.3. Experimental Procedure
2.4. Response Surface Methodology
2.5. Experimental Design
2.6. Experimental Techniques
3. Results and Analysis
3.1. Analysis of Variance of the Properties Affected by the Process Parameters
3.2. Empirical Relationship of the Independent Variables
3.3. Process Optimization and Confirmation Runs
3.4. Density Analysis
4. Conclusions
- The ANOVA results revealed that temperature was the most influential parameter on all responses, followed by holding time, which was found to affect the responses less significantly. The second-order effect of temperature provided a contribution to all responses, while synergistic effects occurred due to the factor AB (temperature and holding time interaction), implying that a particular combination of parameters produced higher responses, only for UTS and ETF.
- The combination of high temperature and high holding time yielded high UTS, ETF, and MH.
- The reduced empirical models developed were reasonably accurate since the difference between the actual residual value and the predicted residual value was small. The quadratic models could be used for prediction within the limits of the factors investigated.
- The pressing action assisted by high heat was responsible for the accumulation of Al2O3 in the gaps between the chips by promoting relaxation of the materials. These void-filling activities reduced the porosity and hence caused a high composite density.
- The gaps between aluminum chips decreased with the increase in temperature and holding time, due to the presence of Al2O3 particles.
Author Contributions
Funding
Acknowledgments
Conflicts of Interest
Nomenclature
| x1 | First studied factor, temperature (°C) |
| x2 | Second studied factor, holding time (min) |
| y1 | Ultimate tensile strength (MPa) |
| y2 | Elongation to failure (%) |
| y3 | Microhardness |
| HV | Vickers hardness |
| d.f. | Degrees of freedom |
| Prob. > F | Probability to get the stated F value |
| Cor. total | Total of all information corrected for the mean |
| Std. Dev. | Standard deviation |
| C.V. % | Percent coefficient of variation |
| PRESS | Predicted residual error sum of squares |
| R2 | Coefficient of determination |
| R2adj | Adjusted R2 |
| R2pred | Predicted R2 |
| Adeq. precision | Adequate precision |
References
- Rombach, G. Integrated Assessment of Primary and Secondary Aluminium Production; DMG Business Media, Ltd.: Surrey, UK, 1998. [Google Scholar]
- International Aluminium Institute. Global Aluminium Recycling: A Cornerstone of Sustainable Development; International Aluminium Institute: London, UK, 2009. [Google Scholar]
- Lajis, M.A.; Yusuf, N.K.; Ahmad, A. Life cycle assessment on the effects of parameter setting in direct recycling hot press forging of aluminum. Mater. Sci. Forum. 2018, 923, 143–148. [Google Scholar] [CrossRef]
- Chawla, K.K. Metal matrix composites. In Composite Materials; Springer: New York, NY, USA, 2012. [Google Scholar]
- Clyne, T.W.; Withers, P.J. An introduction to Metal Matrix Composites; Cambridge University Press: Cambridge, UK, 1995. [Google Scholar]
- Sajjadi, S.A.; Parizi, M.T.; Ezatpour, H.R.; Sedghi, A. Fabrication of A356 composite reinforced with micro and nano Al2O3 particles by a developed compocasting method and study of its properties. J. Alloys Compd. 2012, 511, 226–231. [Google Scholar] [CrossRef]
- Ibrahim, I.A.; Mohamed, F.A.; Lavernia, E.J. Particulate reinforced metal matrix composites—A review. J. Mater. Sci. 1991, 26, 1137–1156. [Google Scholar] [CrossRef]
- Corrochano, J.; Cerecedo, C.; Valcárcel, V.; Lieblich, M.; Guitián, F. Whiskers of Al2O3 as reinforcement of a powder metallurgical 6061 aluminium matrix composite. Mater. Lett. 2008, 62, 103–105. [Google Scholar] [CrossRef]
- Xia, Z.; Ellyin, F.; Meijer, G. Mechanical Behavior of Al2O3-Particle-Reinforced 6061 Aluminum Alloy Under Uniaxial And Multiaxial Cyclic Loading. Compos. Sci. Technol. 1997, 3538, 237–248. [Google Scholar] [CrossRef]
- Mazahery, A.; Abdizadeh, H.; Baharvandi, H.R. Development of high-performance A356/nano-Al2O3 composites. Mater. Sci. Eng. A 2009, 518, 61–64. [Google Scholar] [CrossRef]
- Akbulut, H.; Durman, M. Temperature dependent strength analysis of short fiber reinforced Al-Si metal matrix composites. Mater. Sci. Eng. A 1999, 262, 214–226. [Google Scholar] [CrossRef]
- Groover, M.P. Principles of Modern Manufacturing, 4th ed.; John Wiley & Sons: Hoboken, NJ, USA, 2011. [Google Scholar]
- Altan, T.; Ngaile, G.; Shen, G. Cold and Hot Forging; ASM international: Cleveland, OH, USA, 2005. [Google Scholar]
- Yusuf, N.K.; Lajis, M.A.; Ahmad, A. Hot Press as a Sustainable Direct Recycling Technique of Aluminium: Mechanical Properties and Surface Integrity. Materials 2017, 10, 902. [Google Scholar] [CrossRef]
- Yusuf, N.K. A New Approach of Direct Recycling Aluminium Alloy Chips (AA6061) In Hot Press Forging Process. Ph.D. Thesis, Universiti Tun Hussein Onn Malaysia, Parit Raja, Malaysia, 2013. [Google Scholar]
- Semiatin, S.L. ASM Handbook, Volume 14: Forming and Forging; Materials Park: Cleveland, OH, USA, 1996. [Google Scholar]
- Yusuf, N.K.; Lajis, M.A.; Daud, M.I.; Noh, M.Z. Effect of Operating Temperature on Direct Recycling Aluminium Chips (AA6061) in Hot Press Forging Process. Appl. Mech. Mater. 2013, 315, 728–732. [Google Scholar] [CrossRef]
- Lajis, M.A.; Khamis, S.S.; Yusuf, N.K. Optimization of Hot Press Forging Parameters in Direct Recycling of Aluminium Chip (AA 6061). Key Eng. Mater. 2014, 622–623, 223–230. [Google Scholar] [CrossRef]
- Ahmad, A.; Lajis, M.A.; Shamsudin, S.; Yusuf, N.K. Conjectured the behaviour of a recycled metal matrix composite (MMC-AlR) developed through hot press forging by means of 3D FEM simulation. Materials 2018, 11, 958. [Google Scholar] [CrossRef] [PubMed]
- Ahmad, A.; Lajis, M.A.; Yusuf, N.K.; Shamsudin, S.; Zhong, Z.W. Parametric optimisation of heat treated recycling aluminium (AA6061) by response surface methodology. AIP Conf. Proc. 2017, 1885. [Google Scholar] [CrossRef]
- Khamis, S.S.; Lajis, M.A.; Albert, R.A.O. A Sustainable Direct Recycling of Aluminum Chip (AA6061) in Hot Press Forging Employing Response Surface Methodology. Procedia CIRP 2014, 26, 477–481. [Google Scholar] [CrossRef]
- Durrant, G.; Scott, V.D. The effect of forging on the properties and microstructure of saffil fibre reinforced aluminum. Compos. Sci. Technol. 1993, 49, 153–164. [Google Scholar] [CrossRef]
- Ahmad, A.; Lajis, M.A.; Yusuf, N.K. On the role of processing parameters in Producing recycled aluminum AA6061 based metal matrix composite (MMC-AlR) prepared using hot press forging (HPF) process. Materials 2017, 10, 1098. [Google Scholar] [CrossRef]
- Prabhu, B.; Suryanarayana, C.; An, L.; Vaidyanathan, R. Synthesis and characterization of high volume fraction Al–Al2O3 nanocomposite powders by high-energy milling. Mater. Sci. Eng. A 2006, 425, 192–200. [Google Scholar] [CrossRef]
- Lajis, M.A.; Yusuf, N.K.; Noh, M.Z. Mechanical Properties and Surface Integrity of Direct Recycling Aluminium Chips (AA6061) by Hot Press Forging Process. In Proceedings of the 11th Global Conference on Sustainable Manufacturing, Berlin, Germany, 23–25 September 2013. [Google Scholar]
- Lajis, M.A.; Yusuf, N.K.; Noh, M.Z.; Ibrahim, M. Effect of Chip Size on Direct Recycling of Aluminium Chips (AA6061) in the Hot Press Forging Process. Int. Solid Waste Assoc. 2013, 120–125. [Google Scholar]
- Ahmad, A.; Lajis, M.A.; Yusuf, N.K.; Wagiman, A. Hot Press Forging as The Direct Recycling Technique of Aluminium—A Review. ARPN J. Eng. Appl. Sci. 2016, 11, 2258–2265. [Google Scholar]
- Lajis, M.A.; Ahmad, A.; Yusuf, N.K.; Azami, A.H.; Wagiman, A. Mechanical properties of recycled aluminium chip reinforced with alumina (Al2O3) particle: Mechanische Eigenschaften von mit Aluminiumoxid (Al2O3) verstärkten recycelten Aluminiumspänen. Mater. Werkst. 2017, 48, 306–310. [Google Scholar] [CrossRef]
- Yusuf, N.K. Effects of Hot Press Forging Parameter and Life Cycle Assessment In Direct Recycling of AA6061 Aluminium. Ph.D. Thesis, Universiti Tun Hussein Onn Malaysia, Parit Raja, Malaysia, 2017. [Google Scholar]
- Daneshpayeh, S.; Ghasemi, F.A.; Ghasemi, I.; Ayaz, M. Predicting of mechanical properties of PP/LLDPE/TiO2 nano-composites by response surface methodology. Compos. Part B Eng. 2016, 84, 109–120. [Google Scholar] [CrossRef]
- Myers, R.H.; Montgomery, D.C.; Anderson-Cook, C.M. Response Surface Methodology: Process and Product Optimization Using Designed Experiments; John Wiley & Sons: Hoboken, NJ, USA, 2009. [Google Scholar]
- Mothgomery, D.C. Design and Analysis of Experiment; John Wiley Sons: New York, NY, USA, 1997; p. 445. [Google Scholar]
- Han, Y.-L.; Gao, J.; Yin, Y.-Y.; Jin, Z.-Y.; Xu, X.-M.; Chen, H.-Q. Extraction optimization by response surface methodology of mucilage polysaccharide from the peel of Opuntia dillenii haw. fruits and their physicochemical properties. Carbohydr. Polym. 2016, 151, 381–391. [Google Scholar] [CrossRef] [PubMed]
- Montgomery, D.C. Design and Analysis of Experiments; John Wiley & Sons: Hoboken, NJ, USA, 2013. [Google Scholar]
- Muhamad, M.H.; Abdullah, S.R.S.; Mohamad, A.B.; Rahman, R.A.; Kadhum, A.A.H. Application of response surface methodology (RSM) for optimisation of COD, NH3-N and 2,4-DCP removal from recycled paper wastewater in a pilot-scale granular activated carbon sequencing batch biofilm reactor (GAC-SBBR). J. Environ. Manag. 2013, 121, 179–190. [Google Scholar] [CrossRef] [PubMed]
- Triveni, R.; Shamala, T.R.; Rastogi, N.K. Optimised production and utilisation of exopolysaccharide from Agrobacterium radiobacter. Process Biochem. 2001, 36, 787–795. [Google Scholar] [CrossRef]
- Salim, N.; Hashim, R.; Sulaiman, O.; Ibrahim, M.; Sato, M.; Hiziroglu, S. Optimum manufacturing parameters for compressed lumber from oil palm (Elaeis guineensis) trunks: Respond surface approach. Compos. Part B Eng. 2012, 43, 988–996. [Google Scholar] [CrossRef]
- Derringer, G.; Suich, R. Simultaneous optimization of several response variables. J. Qual. Technol. 1980, 12, 214–219. [Google Scholar] [CrossRef]
- Islam, M.A.; Alam, M.R.; Hannan, M.O. Multiresponse optimization based on statistical response surface methodology and desirability function for the production of particleboard. Compos. Part B Eng. 2012, 43, 861–868. [Google Scholar] [CrossRef]
- Lazo-Vélez, M.A.; Avilés-González, J.; Serna-Saldivar, S.O.; Temblador-Pérez, M.C. Optimization of wheat sprouting for production of selenium enriched kernels using response surface methodology and desirability function. LWT-Food Sci. Technol. 2016, 65, 1080–1086. [Google Scholar] [CrossRef]
- ASTM B328-96. Standard Test Method for Density, Oil Content, and Interconnected Porosity of Sintered Metal Structural Parts and Oil-Impregnated Bearings; ASTM International: West Conshohocken, PA, USA, 2003; Volume 96, pp. 1–4.
- Joglekar, A.M.; May, A.T.; Graf, E.; Saguy, I. Product excellence through experimental design. In Food Product and Development: From Concept to the Marketplace; Springer Science & Business Media: Berlin, Germany, 1987; pp. 211–230. [Google Scholar]
- Ahmad, A.L.; Wong, S.S.; Teng, T.T.; Zuhairi, A. Optimization of coagulation-flocculation process for pulp and paper mill effluent by response surface methodological analysis. J. Hazard. Mater. 2007, 145, 162–168. [Google Scholar] [CrossRef]
- Rahimian, M.; Ehsani, N.; Parvin, N.; Baharvandi, H.R. The effect of sintering temperature and the amount of reinforcement on the properties of Al-Al2O3 composite. Mater. Des. 2009, 30, 3333–3337. [Google Scholar] [CrossRef]
- Daoud, A. Wear performance of 2014 Al alloy reinforced with continuous carbon fibers manufactured by gas pressure infiltration. Mater. Lett. 2004, 58, 3206–3213. [Google Scholar] [CrossRef]


| Parameters | Cutting Speed, v | Feed, f | Depth of Cut (DOC) |
|---|---|---|---|
| (m/min) | (mm/tooth) | (mm) | |
| Value | 1100 | 0.05 | 1.0 |
| Factors | Unit | Notation | Levels | ||
|---|---|---|---|---|---|
| (−1) | (0) | (+1) | |||
| Temperature | °C | x1 | 430 | 480 | 530 |
| Holding time | min | x2 | 60 | 90 | 120 |
| Std. Run | Factors (Coded) | Factors (Actual) | Experiment | ||||
|---|---|---|---|---|---|---|---|
| C1 | C2 | x1 (°C) | x2 (min) | y1 (MPa) | y2 (%) | y3 (HV) | |
| 1 | −1 | −1 | 430 | 60 | 19.20 | 2.07 | 71.360 |
| 2 | +1 | −1 | 530 | 60 | 273.94 | 13.99 | 80.592 |
| 3 | −1 | +1 | 430 | 120 | 27.82 | 2.24 | 74.625 |
| 4 | +1 | +1 | 530 | 120 | 317.99 | 20.45 | 86.656 |
| 5 | −1 | 0 | 430 | 90 | 22.31 | 2.22 | 73.367 |
| 6 | +1 | 0 | 530 | 90 | 297.10 | 17.90 | 83.921 |
| 7 | 0 | −1 | 480 | 60 | 169.20 | 4.17 | 76.432 |
| 8 | 0 | +1 | 480 | 120 | 188.11 | 6.69 | 78.454 |
| 9 | 0 | 0 | 480 | 90 | 175.76 | 5.90 | 76.662 |
| 10 | 0 | 0 | 480 | 90 | 180.49 | 5.52 | 76.503 |
| 11 | 0 | 0 | 480 | 90 | 170.71 | 4.88 | 76.988 |
| Source | Sum of Squares | df | Mean Square | F-Value | Prob > F |
|---|---|---|---|---|---|
| UTS (MPa) | |||||
| Model | 113,957.73 | 5 | 22,791.55 | 1548.26 | <0.0001 s |
| x1 | 111,984.68 | 1 | 111,984.68 | 7607.29 | <0.0001 s |
| x2 | 853.95 | 1 | 853.95 | 58.01 | 0.0006 s |
| x1x2 | 313.82 | 1 | 313.82 | 21.32 | 0.0058 s |
| x12 | 776.81 | 1 | 776.81 | 52.77 | 0.0008 s |
| x22 | 5.25 | 1 | 5.25 | 0.36 | 0.5766 ns |
| Residual | 73.60 | 5 | 14.72 | ||
| Lack of Fit | 25.76 | 3 | 8.59 | 0.36 | 0.7929 ns |
| Pure Error | 47.84 | 2 | 23.92 | ||
| R2 = 0.9994, R2 adj = 0.9987, R2 pred = 0.9970, Adeq. precision = 104.845 | |||||
| ETF (%) | |||||
| Model | 426.02 | 5 | 85.20 | 446.42 | <0.0001 s |
| x1 | 349.76 | 1 | 349.76 | 1832.56 | <0.0001 s |
| x2 | 13.95 | 1 | 13.95 | 73.11 | 0.0004 s |
| x1x2 | 9.89 | 1 | 9.89 | 51.82 | 0.0008 s |
| x12 | 49.77 | 1 | 49.77 | 260.77 | <0.0001 s |
| x22 | 0.099 | 1 | 0.099 | 0.52 | 0.5038 ns |
| Residual | 0.95 | 5 | 0.19 | ||
| Lack of Fit | 0.42 | 3 | 0.14 | 0.53 | 0.7051 ns |
| Pure Error | 0.53 | 2 | 0.27 | ||
| R2 = 0.9978, R2adj = 0.9955, R2pred = 0.9880, Adeq. precision = 57.074 | |||||
| MH (HV) | |||||
| Model | 197.66 | 5 | 39.53 | 62.49 | 0.0002 s |
| x1 | 168.72 | 1 | 168.72 | 266.71 | <0.0001 s |
| x2 | 21.47 | 1 | 21.47 | 33.95 | 0.0021 s |
| x1x2 | 1.96 | 1 | 1.96 | 3.10 | 0.1388 ns |
| x12 | 4.74 | 1 | 4.74 | 7.49 | 0.0409 s |
| x22 | 0.071 | 1 | 0.071 | 0.11 | 0.7520 ns |
| Residual | 3.16 | 5 | 0.63 | ||
| Lack of Fit | 3.04 | 3 | 1.01 | 16.58 | 0.0574 ns |
| Pure Error | 0.12 | 2 | 0.061 | ||
| R2 = 0.9843, R2adj = 0.9685, R2pred = 0.8520, Adeq. precision = 24.496 | |||||
| Source | Sum of Squares | df | Mean Square | F-Value | Prob > F |
|---|---|---|---|---|---|
| UTS (MPa) | |||||
| Model | 113,952.49 | 4 | 28,488.12 | 2167.80 | <0.0001 s |
| x1 | 111,984.68 | 1 | 111,984.68 | 8521.46 | <0.0001 s |
| x2 | 853.95 | 1 | 853.95 | 64.98 | 0.0002 s |
| x1x2 | 313.82 | 1 | 313.82 | 23.88 | 0.0027 s |
| x12 | 800.03 | 1 | 800.03 | 60.88 | 0.0002 s |
| Residual | 78.85 | 6 | 13.14 | ||
| Lack of Fit | 31.01 | 4 | 7.75 | 0.32 | 0.8454 ns |
| Pure Error | 47.84 | 2 | 23.92 | ||
| R2 = 0.9993, R2adj = 0.9988, R2pred = 0.9979, Adeq. Precision = 121.558 | |||||
| ETF (%) | |||||
| Model | 425.92 | 4 | 106.48 | 606.58 | <0.0001 s |
| x1 | 349.76 | 1 | 349.76 | 1992.48 | <0.0001 s |
| x2 | 13.95 | 1 | 13.95 | 79.49 | 0.0001 s |
| x1 x2 | 9.89 | 1 | 9.89 | 56.35 | 0.0003 s |
| x12 | 52.31 | 1 | 52.31 | 298.01 | <0.0001 s |
| Residual | 1.05 | 6 | 0.18 | ||
| Lack of Fit | 0.52 | 4 | 0.13 | 0.49 | 0.7546 ns |
| Pure Error | 0.53 | 2 | 0.27 | ||
| R2 = 0.9975, R2adj = 0.9959, R2pred = 0.9896, Adeq. Precision = 65.192 | |||||
| MH (HV) | |||||
| Model | 195.63 | 3 | 65.21 | 87.92 | <0.0001 s |
| x1 | 168.72 | 1 | 168.72 | 227.47 | <0.0001 s |
| x2 | 21.47 | 1 | 21.47 | 28.95 | 0.0010 s |
| x12 | 5.44 | 1 | 5.44 | 7.33 | 0.0303 s |
| Residual | 5.19 | 7 | 0.74 | ||
| Lack of Fit | 5.07 | 5 | 1.01 | 16.59 | 0.0578 ns |
| Pure Error | 0.12 | 2 | 0.061 | ||
| R2 = 0.9741, R2adj = 0.9631, R2pred = 0.9165, Adeq. Precision = 27.707 | |||||
| Solutions | Temperature (°C) | Holding Time (min) | UTS (MPa) | ETF (%) | MH (HV) | Desirability |
|---|---|---|---|---|---|---|
| 1 | 530.00 | 120.00 | 317.61 | 20.54 | 85.615 | 0.976 * |
| 2 | 529.48 | 120.00 | 316.46 | 20.36 | 85.531 | 0.972 |
| 3 | 527.44 | 120.00 | 311.91 | 19.64 | 85.202 | 0.946 |
| 4 | 530.00 | 109.12 | 309.22 | 19.42 | 84.929 | 0.933 |
| 5 | 530.00 | 86.71 | 293.12 | 17.11 | 83.516 | 0.842 |
| Responses | Factors | Run | ||
|---|---|---|---|---|
| 1 | 2 | 3 | ||
| Temperature (°C) | 530 | 500 | 450 | |
| Holding Time (min) | 120 | 70 | 100 | |
| UTS | Actual | 330.69 | 218.82 | 108.76 |
| Predicted | 317.13 | 218.45 | 90.92 | |
| Error (%) | 4.10 | 0.17 | 16.40 | |
| ETF | Actual | 23.09 | 8.78 | 2.11 |
| Predicted | 20.55 | 7.75 | 2.62 | |
| Error (%) | 11.00 | 11.73 | 24.17 | |
| MH | Actual | 84.18 | 78.53 | 74.11 |
| Predicted | 85.62 | 78.09 | 74.97 | |
| Error (%) | 1.71 | 0.56 | 1.16 | |
© 2020 by the authors. Licensee MDPI, Basel, Switzerland. This article is an open access article distributed under the terms and conditions of the Creative Commons Attribution (CC BY) license (http://creativecommons.org/licenses/by/4.0/).
Share and Cite
Ahmad, A.; Lajis, M.A.; Yusuf, N.K.; Ab Rahim, S.N. Statistical Optimization by the Response Surface Methodology of Direct Recycled Aluminum-Alumina Metal Matrix Composite (MMC-AlR) Employing the Metal Forming Process. Processes 2020, 8, 805. https://doi.org/10.3390/pr8070805
Ahmad A, Lajis MA, Yusuf NK, Ab Rahim SN. Statistical Optimization by the Response Surface Methodology of Direct Recycled Aluminum-Alumina Metal Matrix Composite (MMC-AlR) Employing the Metal Forming Process. Processes. 2020; 8(7):805. https://doi.org/10.3390/pr8070805
Chicago/Turabian StyleAhmad, Azlan, Mohd Amri Lajis, Nur Kamilah Yusuf, and Syaiful Nizam Ab Rahim. 2020. "Statistical Optimization by the Response Surface Methodology of Direct Recycled Aluminum-Alumina Metal Matrix Composite (MMC-AlR) Employing the Metal Forming Process" Processes 8, no. 7: 805. https://doi.org/10.3390/pr8070805
APA StyleAhmad, A., Lajis, M. A., Yusuf, N. K., & Ab Rahim, S. N. (2020). Statistical Optimization by the Response Surface Methodology of Direct Recycled Aluminum-Alumina Metal Matrix Composite (MMC-AlR) Employing the Metal Forming Process. Processes, 8(7), 805. https://doi.org/10.3390/pr8070805