Article

Distributed Optimization for Active Distribution Network Considering the Balance of Multi-Stakeholder

College of Electrical Engineering, Shanghai Dianji University, Shanghai 201306, China
*
Author to whom correspondence should be addressed.
Processes 2020, 8(8), 987; https://doi.org/10.3390/pr8080987
Submission received: 20 July 2020 / Revised: 11 August 2020 / Accepted: 12 August 2020 / Published: 14 August 2020
(This article belongs to the Special Issue Power System Expansion Planning)

Abstract

:
Nowadays, distributed power generation is highly valued and fully developed since the energy crisis is worsening. At the same time, the distribution system operator is becoming a new stakeholder to take part in the dispatch of the active distribution network (ADN) with the power market being further reformed. Some new challenges to the dispatching of the ADN are brought by these distribution system operators (DSO), which break the traditional requirement of the lowest operating cost. In this paper, the relationship between the maximum revenue and the minimum operating cost of the ADN is fully considered, and the model of the bi-level distributed ADN considering the benefits and privacy protection of multi-stakeholder is established precisely. Further, the model is solved by using the alternating direction method of multipliers (ADMM) in which the safety and economy of the ADN are fully considered. Finally, the validity of the model and the feasibility of the algorithm are verified by using the adjusted IEEE 33 bus.

1. Introduction

The energy crisis and environmental pollution are factors that promote distributed power generation technology development. Since the gradual increase of distributed power supply penetration and distributed power sources are often placed near the load, the distribution network has the characteristics of dispersion, which brings new challenges to the safe and economic operation of the traditional distribution network. In order to solve the problem of safe operation and active management of high-permeability distributed power supply in distribution networks, active distribution network (ADN) technology has emerged as the time’s requirement. ADN is the power distribution system that actively manages the power supply to the distribution network by actively controlling and dispatching according to the operating state of the power system [1]. In fact, it is inevitable that new technologies link different parts of the power system, such as the ubiquitous power internet of things (UPIOT) and artificial intelligence [2,3]. After the sale of the electricity market is liberalized, the electricity sales company with the right to operate the distribution network not only provides distribution services to collect distribution fees, but also participates in transactions as an independent market entity [4]. In other words, it has both distribution network operation attributes and transaction attributes. As a result, we call it a distribution system operator (DSO). As an independent benefit participant participates in the dispatching of the active distribution network, the distribution operator has independent power generation units and is no longer subject to the unified dispatching of the power grid, which makes the traditional centralized operation economic dispatch no longer suitable for the power grid dispatching [5]. Consequently, a method suitable for handling the dispatching of multi-stakeholders with high degrees of freedom needs to be found [6].
At present, research on active distribution network dispatching has been carried out to a certain extent around the globe. The transactive energy concept proposes seven functional layers of architecture that have been developed to reduce transmission losses and to minimize customers’ electricity bills [7]. A bi-level framework has been developed with the analytical target cascading method to ensure stakeholder’s optimal economy [8], but this paper failed to comprehensively consider environmental factors and the role of electric vehicle charging stations on the optimal scheduling results. A linearized stochastic programming framework has been proposed to model the uncertainties of renewable energy sources, energy prices, load demands, and the integrated renewable energy sources and battery systems that are of higher importance to enhance management efficiency [9]. A study focuses on the spirit open, equal, cooperate, and share’ the initiative distribution network establishes the optimal dispatch model of the multi-stakeholder game has been developed to promote the consumption of renewable power [10]. An online energy management based on the ADMM algorithm has been developed to address the high uncertainty issue in the networked microgrids dispatching, and the algorithm provides a less conservative schedule than the robust optimization-based approach [11]. At a deeper level, a distributed optimization method for reactive power optimization control is proposed, which shows the good information privacy of its distributed method [12]. A decomposition method based on the ADMM has been proposed to guarantee the gas system’s data privacy while achieving the benefits of the co-planning work, ADMM algorithm has a significant role in ensuring data privacy [13]. Therefore, considering the protection of data privacy under the fair competition of various stakeholders has also become a factor that cannot be ignored in the dispatching process [14].
However, the above research considers ADN’s objective of the lowest overall operating cost, but it fails to comprehensively consider the requirements of multi-stakeholders for maximum benefits and data privacy protection. As a consequence, it is difficult to mobilize the initiative of DSO in the dispatching process. For the new situation that the various stakeholders of the DSO participate in the economic dispatching of the ADN, this paper proposes a distributed coordination optimization dispatching model for ADN in order to coordinate the benefits of the DSO and the ADN and ensure the power quality. In detail, the model considers the benefits of various stakeholders, and the objective is to optimize the economics of each stakeholder and ADN to achieve a win-win situation between ADN and DSO, and each part is solved independently to meet the privacy protection requirements of each stakeholder. Coordinating the power exchange between the independent entities and the active distribution network by ensuring the quality of the power. Finally, the model is solved by using the alternating direction multiplier method to verify the validity of the model and the feasibility of the algorithm.
The remainder of the paper is organized as follows, Section 2 models the considering the benefits of multi-stakeholder dispatching strategy of ADN not only by considering the optimization for ADN, but also by coordinating the benefits of multi-stakeholder. Section 3 discusses the bi-level distributed optimization model for ADN. Section 4 provides the strategy of the ADN bi-level dispatching model by using ADMM. Section 5 provides the detailed results of the simulation for the validity of the model, and the feasibility of the algorithm is verified by using the adjusted IEEE 33 bus. Section 6 concludes the paper.

2. Considering the Benefits of Multi-Stakeholder Dispatching Strategy of ADN

2.1. Electric System and Virtual Micro-Grid

In this paper, the source-load resources of the active distribution network are integrated into two categories: distribution system operator (DSO) and virtual micro-grid (VMG). Among them, the DSO is defined as an independent power distribution area operated by the distributed power source owner, and is an independent benefit group with distributed power generation units and regional load components. Its main role is to coordinate the distributed power supply and the purchase and sale of electricity with the upper power grid to maximize the benefits of electricity sales. The VMG is defined as an area operated by a non-distribution operator and is divided into specific VMG according to the radiation distance of the power supply. Its main package includes some distributed power supplies, flexible loads, energy storage power stations, electric vehicle charging and discharging stations, etc. The division of VMG breaks the geographical restrictions of distributed power. Its essence is the reorganization of the remaining distributed power that does not belong to DSO scheduling. The VMG also pursues the largest benefit from the power supply area it contains.

2.2. Dispatching Overall Framework of Active Distribution Networks

Considering the game relationship of multi-stakeholders, the lower-level DSO and the VMG pursue their own benefits, and the upper-level ADN dispatching center pursues network loss and power quality. After the DSO and VMG independently optimize their own revenues, the ADN dispatch center coordinates the power exchange between the various stakeholders and the active distribution network to ensure the power quality and the economics of the overall operation of the ADN. The ADN dispatching system framework that considers the benefits of multi-stakeholders is illustrated in Figure 1.

3. Active Dispatching Distribution Network Bi-Level Optimization Dispatching Model

In the ADN bi-level distributed optimization model, the upper-level takes the ADN as the processing object in order to reduce the network loss and ensure the power quality. The lower-level is targeted at DSO and VMG, with the goal of maximizing the benefits of all stakeholders.

3.1. The Upper-Level Model

3.1.1. The Objective Function of Upper-Level Model

The objective function of the upper-level model includes the lowest overall operating cost of the ADN and the minimum network power loss [15]. The objective function is described as follows.
min F = f ( P l o s s ) + g ( P w a n t )
f ( P l o s s ) = α t = 0 T l = 0 L [ P l o s s , l ( t ) Δ t ]
g ( P w a n t ) = β t = 0 T i = 0 n ( P w a n t , i * ( t ) P w a n t , i ( t ) ) 2
where the F is the upper optimization overall goal, f ( P l o s s ) is total network loss function of ADN, g ( P w a n t ) is expected difference between exchange power and actual power, T is dispatch period, L is the total number of ADN lines, l is the number of lines, t is the number of dispatching period, P l o s s , l is power loss of line l , n is the total amount of all ADN and VMG, i is the number of ADN and VMG, P w a n t is the lower-level power actually obtained from the upper level, P w a n t * is expected exchange power uploaded by the lower-level, α is the weight in the objective function f 1 , β is the weight in the objective function f 2 and the specific values of α and β are shown in reference [16].

3.1.2. The Constraints of Upper-Level Model

For the upper-level, the constraint equations are as follows.
{ P D S O , k ( t ) + P V M G , k ( t ) P L , i ( t ) P d ( t ) = 0 Q D S O , k ( t ) + Q V M G , k ( t ) Q L , i ( t ) Q d ( t ) = 0
where P d ( t ) = U i ( t ) j = 1 N U j ( t ) ( G i j cos θ i j ( t ) + B i j sin θ i j ( t ) ) Q d ( t ) = U i ( t ) j = 1 N U j ( t ) ( G i j sin θ i j ( t ) + B i j cos θ i j ( t ) ) . Where the D S O is distribution system operator (DSO) power, V M G is virtual microgrid (VMG) power, L is load power, P is the active power, Q is the reactive power, U i ( t ) is bus voltage of bus i , G i j is conductance between bus i and j , B i j is senator between bus i and j , i , j is the bus number in the AND, θ is phase angle difference between bus i and j , N is the total amount of bus.
S i j ( t ) S i j , max , i [ 1 , N ] , j [ 1 , N ]
U i , min U i ( t ) U i , max , i [ 1 , N ] , i [ 1 , N ]
P p c c , min P p c c ( t ) P p c c , max
where the S i j is transmission power between i and j bus, S i j , max is the maximum of transmission power between bus i and j , U i ( t ) is bus voltage of bus i , U i , min , U i , max is the lower and upper limit of U i ( t ) , P p c c is real-time transmission power between upper-level and lower level, P p c c , min , P p c c , max is the lower and upper limit of P p c c .
The above constraints ensure the safe and reliable operation of the ADN, and the voltage offset is within a reasonable range. As a result, the power system operates within the static stability requirements.

3.2. The Lower-Level Model

3.2.1. The Objective Function of Upper-Level Model

The optimization dispatching model of the DSO considers the purchase and sale of electricity revenue. For instance, E 1 represents the upper grid power price of each part. E 2 represents the sales revenue of the user, C 1 represents the operation, maintenance of the controllable power generation and the start-up and depreciation costs, C 2 represents the operation and degradation cost of the energy storage system [17,18], C 3 represents the operation and maintenance cost, C 4 represents the environmental cost of the controllable power supply [19]. C 5 represents the optimization of the VMG also considers the cost of the electric vehicle charging and discharging station, C 6 represents the flexible load dispatching cost.
The objective function considering the above factors is as follows.
max M = E 1 + E 2 C 1 C 2 C 3 C 4 C 5 C 6
In (8), the specific formulas are as shown in (9)–(17):
E 1 = t = 0 H C G S ( t ) P G S ( t ) Δ t
where the H is the number of time slots in a dispatching period, C G S is the buy and sell electricity prices to the main grid, P G S is the power to buy and sell electricity from the upper grid.
E 2 = t = 1 H C S ( t ) P S ( t ) Δ t
where the C S is the electricity prices sold to users, P S is the power sold to users.
C 1 = t = 0 H i = 0 n ( C f u e l , i + K o , i P D G , i ( t ) + C 11
where C 11 = S i U s t a r t , i ( t ) + C a , i 8760 k i n i P D G , i ( t ) ) Δ t .
Where the n is the total amount of controllable power supply, i is the number of controllable power supply, C f u e l is fuel cost coefficient of controllable power supply, K o is unit power operation and maintenance cost coefficient of controllable power supply, P D G is controllable unit output, S i is starting cost coefficient of the controllable unit, U s t a r t is start-up decision variable of the controllable unit (0–1), C a is the present value of controllable unit installation costs, k i is the capacity factor of controllable power supply, n i is the age of the controllable power supply.
C 2 = t = 0 H ( C i n v C s e l f ) L b ( t , d ) ) Δ t
where the L b = i N c , i η 100 d i k p , i = 1 , 2 , 3 .
Where the C i n s is energy storage equipment unit installation and maintenance cost of the battery, L b ( t , d ) is the life loss of the battery over the time period, N c , i is the number of cycles with depth d i , d i is the i th depth of a cycle’s amplitude, k p is the slop value of the battery degradation curve taken from the battery sheets, and η 100 is the total number of given cycles for the battery.
C 3 = t = 0 H i = 0 G n C U D G , i P U D G , i ( t ) Δ t
where the G is the total amount of distributed power supplies, n is the number of controllable distributed power supplies, i is the number of uncontrollable power supply, C U D G is operation and maintenance cost coefficient of uncontrollable power unit power, P U D G is the power output of uncontrollable power supply.
C 4 = t = 0 H i = 0 n r = 0 L A r R i , r P D G , i ( t ) Δ t
where the n is the total amount of distributed power supplies, i is the number of controllable power supply, A r is pollution gas emission penalty coefficient, R i , r is the amount of exhaust gas generated when a distributed power source emits unit power, P D G is controllable unit output.
C 5 = t = 0 H w = 0 W C w ( t ) P w , s ( t ) Δ t
where the W total amount of centralized controllers for electric vehicles, w is the number of centralized controllers for electric vehicles, C w is the electric vehicle charging and discharging cost coefficient, P w , s is the electric vehicle charging and discharging power.
C 6 = C r [ d = 0 D x d ( t ) P d 2 ( t ) + v = 0 V P v 2 ( t ) ] Δ t
Φ S O = [ P D G , i ( t ) , P G S ( t ) , x c , s c h ( t ) , x c , s d c h ( t ) , p c , s c h ( t ) , p c , s d c h ( t ) , E c , s ( t ) ]
where the C r is flexible load dispatching cost coefficient, D is the total amount intermittent loads in the flexible load, V is the total amount of non-intermittent loads in the flexible load, d is the number of intermittent loads in the flexible load, v is the number of non-intermittent loads in the flexible load, x d is intermittent load switch variable (0–1), P d 2 is continuous load power, P v 2 is power consumption of intermittent load, Φ S O is a vector consisting of electric vehicle decision variable (0–1), x c , s c h is the electric vehicle charging decision variable, x c , s d c h is electric vehicle discharging decision variable (0–1), p c , s c h is electric vehicle battery charging power, p c , s d c h is electric vehicle battery discharging power, E c , s is remaining power in electric car battery.

3.2.2. The Constraints of Lower-Level Model

In order to ensure a safe and stable operation, the lower layer optimization should also meet power balance constraints, purchase and sale power constraint constraints, controllable power supply constraints, uncontrollable power supply constraints, energy storage system constraints, electric vehicle constraints, flexible load constraints, and tie-line constraints. The specific constraints are shown in (18)–(42).
The safe and stable operation of the whole system first of all needs to generate the active power is equal to the active power consumption, the constraint is shown in (18).
i = 0 G P D G , i ( t ) + j = 0 m P s t , j ( t ) + P P ( t ) + P W ( t ) P G S ( t ) P S ( t ) = 0
where the P P is photovoltaics power, P W is wind power.
The lower layer purchase and sale electric power should be lower than the upper and lower limits of the purchase and sale of electric power, the specific formulas are given as (19).
P G S , m i n ( t ) P G S ( t ) P G S , m a x ( t )
To ensure the safe and stable operation of the controllable power supply, controllable power constraints include output power upper and lower limits, minimum start and stop time constraints, and climbing constraints, the specific formulas are illustrated in (20)–(22):
{ P i , min U i ( t ) P i ( t ) P i , max U i ( t ) Q i , min U i ( t ) Q i ( t ) Q i , max U i ( t )
where the U i is 0–1 state of controllable unit operation, P i , min , P i , max is lower and upper limits of the active power of controllable units, Q i , min , Q i , max is lower and upper limits of reactive power of controllable units,
{ U s t a r t , i ( t ) + t + 1 min ( T , t 1 + M O T i ) U s h u t , i 1 U s t u t , i ( t ) + t + 1 min ( T , t 1 + M O T i ) U s h a r t , i 1
where the M O T is the minimum opening time of the controllable unit, M D T is the minimum closing time of the controllable unit.
Δ d o w n P i ( t ) P i ( t 1 ) Δ u p , i
where the Δ d o w n , Δ u p , i is lower and upper limits of climbing power.
The output of wind power and photovoltaics should not exceed the predicted output, the specific formulas are given as (23):
{ 0 p w ( t ) p w , f ( t ) 0 p p ( t ) p p , f ( t )
where the p w , f ( t ) is predicted value of wind power, p p , f ( t ) is predicted value of photovoltaic power.
The energy storage system (ESS) should satisfy the charging power and discharge power limit of the battery during the dispatching period, and also satisfy the limitation of the energy and power of the energy storage system, and balance the charge and discharge, the specific formulas are described as (24)–(26):
{ P s t , min c h ( t ) U s t c h ( t ) P s t c h ( t ) P s t , max c h U s t c h ( t ) P s t , min d c h ( t ) U s t d c h ( t ) P s t d c h ( t ) Q s t , max d c h U s t d c h ( t )
where the U s t c h is battery charge status, U s t d c h is battery discharge status, P s t , min c h , P s t , max c h is lower and upper limits of charging the ESS, P s t , min d c h ( t ) , Q s t , max d c h is lower and upper limits of discharging the ESS.
S s t , min S s t S s t , max
where the S s t , min , S s t , max is lower and upper limits of the charging state of the ESS.
S T = S 0
where the S 0 is the beginning of the dispatching period cycle of the ESS, S T is the ending of the dispatching period of the ESS.
Since the battery’s charge and discharge status is mutually exclusive, the U s t c h ( t ) + U s t d c h 1 .
In this paper, the charging and discharging constraints of electric vehicles are considered through the charging and discharging station mode of electric vehicles, and the equivalent electric vehicles of electric vehicle centralized controllers are used as well [20]. The specific formulas are as shown in (27)–(34):
x c , s c h ( t ) + x c , s d c h ( t ) 1
p c , s c h ( t ) p c , s c h , max ( t ) x c , s c h ( t )
p c , s c h ( t ) p c , s d c h ( t ) x c , s d c h ( t )
P c , s ( t ) = p c , s c h ( t ) x c , s c h ( t ) + p c , s d c h ( t ) x c , s d c h ( t )
S O C c , s ( t ) = S O C c , s ( t 1 ) + S O C C , G ( t )
where S O C C , G ( t ) = η c h p c , s c h ( t ) x c , s c h ( t ) p c , s d c h ( t ) x c , s d c h ( t ) η d c h E c max
S O C c min S O C c , s ( t ) S O C c max
p c , s c h ( t ) η c h E c max E c , s ( t )
1 η d c h p c , s d c h ( t ) E c , s ( t )
where the x c , s c h is whether the electric vehicle is charged (0–1), x c , s d c h is whether the electric vehicle is discharged (0–1), p c , s c h is electric vehicle battery charging power, p c , s d c h is electric vehicle battery discharging power, p c , s t is electric vehicle battery power at time t , S O C c is the electric vehicle battery state of charge, S O C c min , S O C c max is the lower and upper limits of electric vehicle battery state of charge, η c h is electric vehicle battery charging efficiency, η d c h is electric vehicle battery discharging efficiency, E c max is electric vehicle battery capacity, E c , s is remaining power of electric vehicle battery.
Flexible load constraints include flexible load balancing constraints and flexible load upper and lower limits [21]. The specific formulas are as shown in (35)–(37):
t = 0 24 P α ( t ) = P α , s u m
P α , min ( t ) P α ( t ) P α , max ( t )
Δ P α , max ( t ) Δ P α ( t ) Δ P α , m a x
where the α is flexible load type and α = n , m , Δ P α , sum is the total amount of flexible load in one cycle, Δ P α , m a x is flexible load maximum variation limit, Δ P α , m i n is flexible load minimum variation limit.
The lower-level and upper-level power are transmitted through a power common connection line (PCC), and the transmitted power should satisfy the upper and lower limits of the PCC transmission power [22]. Consequently, the specific formulas are described as (38).
P G S , max P G S ( t ) P G S , max

4. Distributed Solution Strategy of ADN Bi-Level Dispatching Model

For the established bi-level model, the ADMM algorithm with a simple form, good convergence and robustness is applied to solve the upper-level model [23]. The lower-level is linearized and solved by YALMIP. The upper and lower levels exchange power through PPC. After the optimization of the lower-level is completed, the expected exchange power is uploaded to the upper-level. The upper-level optimizes the global optimization and transmits the reference exchange power according to the minimum ADN overall operating cost and guaranteed power quality. The lower-level chooses to receive the reference power when the revenue result after re-solving according to the reference switching power transmitted from the upper-level falls within the acceptable interval.

4.1. Method Based on ADMM

Make the decision variable be P = [ P D v P n e t ] T , then the standard objective function based on ADMM can be expressed as follows.
min F ( x ) = f ( P D v ) + g ( P n e t )
where the P D v is the absolute value of the expected exchange power and reference exchange power difference and the P n e t is network loss power.
The augmented Lagrange function constructed for this problem is as follows [24]:
L ρ ( P D v , P n e t , λ ) = f ( P D v ) + g ( P n e t ) + λ T ( A P D v + B P n e t c ) + ρ 2 | | A P D v + B P n e t c | | 2 2
where ρ represents penalty parameter and ρ > 0 .
The basic iterative process of ADMM is as follows [25]:
{ P D v k + 1 = arg min p D v L ρ ( P D v , P n e t k , λ k ) P n e t k + 1 = arg min p n e t L ρ ( P D v k , P n e t , λ k ) λ k + 1 = λ k + ρ ( A P D v k + 1 + B P n e t k + 1 c )
where the λ is dual variable and k is iteration step, when the original problems f and g are respectively real-valued intrinsic closed convex functions, ADMM can effectively converge to the optimal solution [26], iterating through equation (41) to approximating the optimal solution gradually.
According to the ADMM convergence principle, the iterative process terminates the iteration until the original residual, and the dual residual satisfy the convergence precision. The specific formula is as follows:
{ | | A P D v k + 1 + B P n e t k + 1 c | | 2 ε p r i m a l | | ρ A T B ( P n e t k + 1 P n e t k ) | | 2 ε d u a l
where the ε p r i m a l is raw residual convergence accuracy, and the ε d u a l is dual residual convergence accuracy.

4.2. The Distributed Solution Process for Active Distribution Network Bi-Level Dispatching Model

The solution flow for the active distribution network using ADMM for the upper level and linear programming for the lower level is as follows, the flow chart of model solving is shown in Figure 2.
Step 1: Start, load data, initialize ρ , ε p r i m a l , ε p r i m a l , the maximum number of iterations K 1 , K 2 and other algorithm parameters.
Step 2: Set k 1 = 1 , k 2 = 1 .
Step 3: Calculate the expected exchange power, and upload.
Step 4: Start the upper layer optimization dispatching, and solve the problem P D v k + 1 , P n e t k + 1 by the formula (41).
Step 5: The upper-level judges whether to converge according to the equation (46), and if it converges, it transmits the upper layer reference switching power; if it does not converge, it returns k 1 = k 1 + 1 , and returns to step 2.
Step 6: The lower-level optimization dispatching recalculates the revenue according to the upper layer reference switching power, and determines whether the calculation result satisfies the confidence interval requirement. If the requirements are met, the exchange power request is accepted. If the requirement is not met, let k 2 = k 2 + 1 the process returns to step 2.
Step 7: Substituting the power transmitted from the upper-level into the lower-level to solve the problem of optimizing the operation of the lower microgrid, and obtaining the distributed power output of each of the various stakeholders.
Step 8: Bi-level optimization termination judgment: If k 1 = K 1 or k 2 = K 2 , stop iteration, otherwise, let k 1 = k 1 + 1 and k 1 = k 1 + 1 , and return to step 2.
The upper-level optimization dispatching and the lower-level optimization dispatching are only connected through the PCC. The upper-level control center only needs to collect the expected exchange power of each stakeholder, and each stakeholder independently solves the optimal distribution according to the received transmission power. Finally, the distributed economic dispatching of ADN is realized.

5. Discussion

5.1. Introduction to the System

The adjusted IEEE 33 bus ADN is taken as an example for analysis. All resources are reintegrated according to different ownership, and the adjusted active distribution network structure is shown in Figure 3. The details date statistics of the ADN structure framework is illustrated in Appendix A.
The time-of-use electricity prices for the active distribution network to purchase and sell electricity to virtual microgrids and distribution operators are shown in Table 1.
The pollutant discharge standards are shown in Table 2, and the detailed reference parameters of environmental costs are mentioned in reference [27], and will not be repeated here. The sources integration of VMG and DSO are shown in Table 3.

5.2. Dispatching Results and Analysis

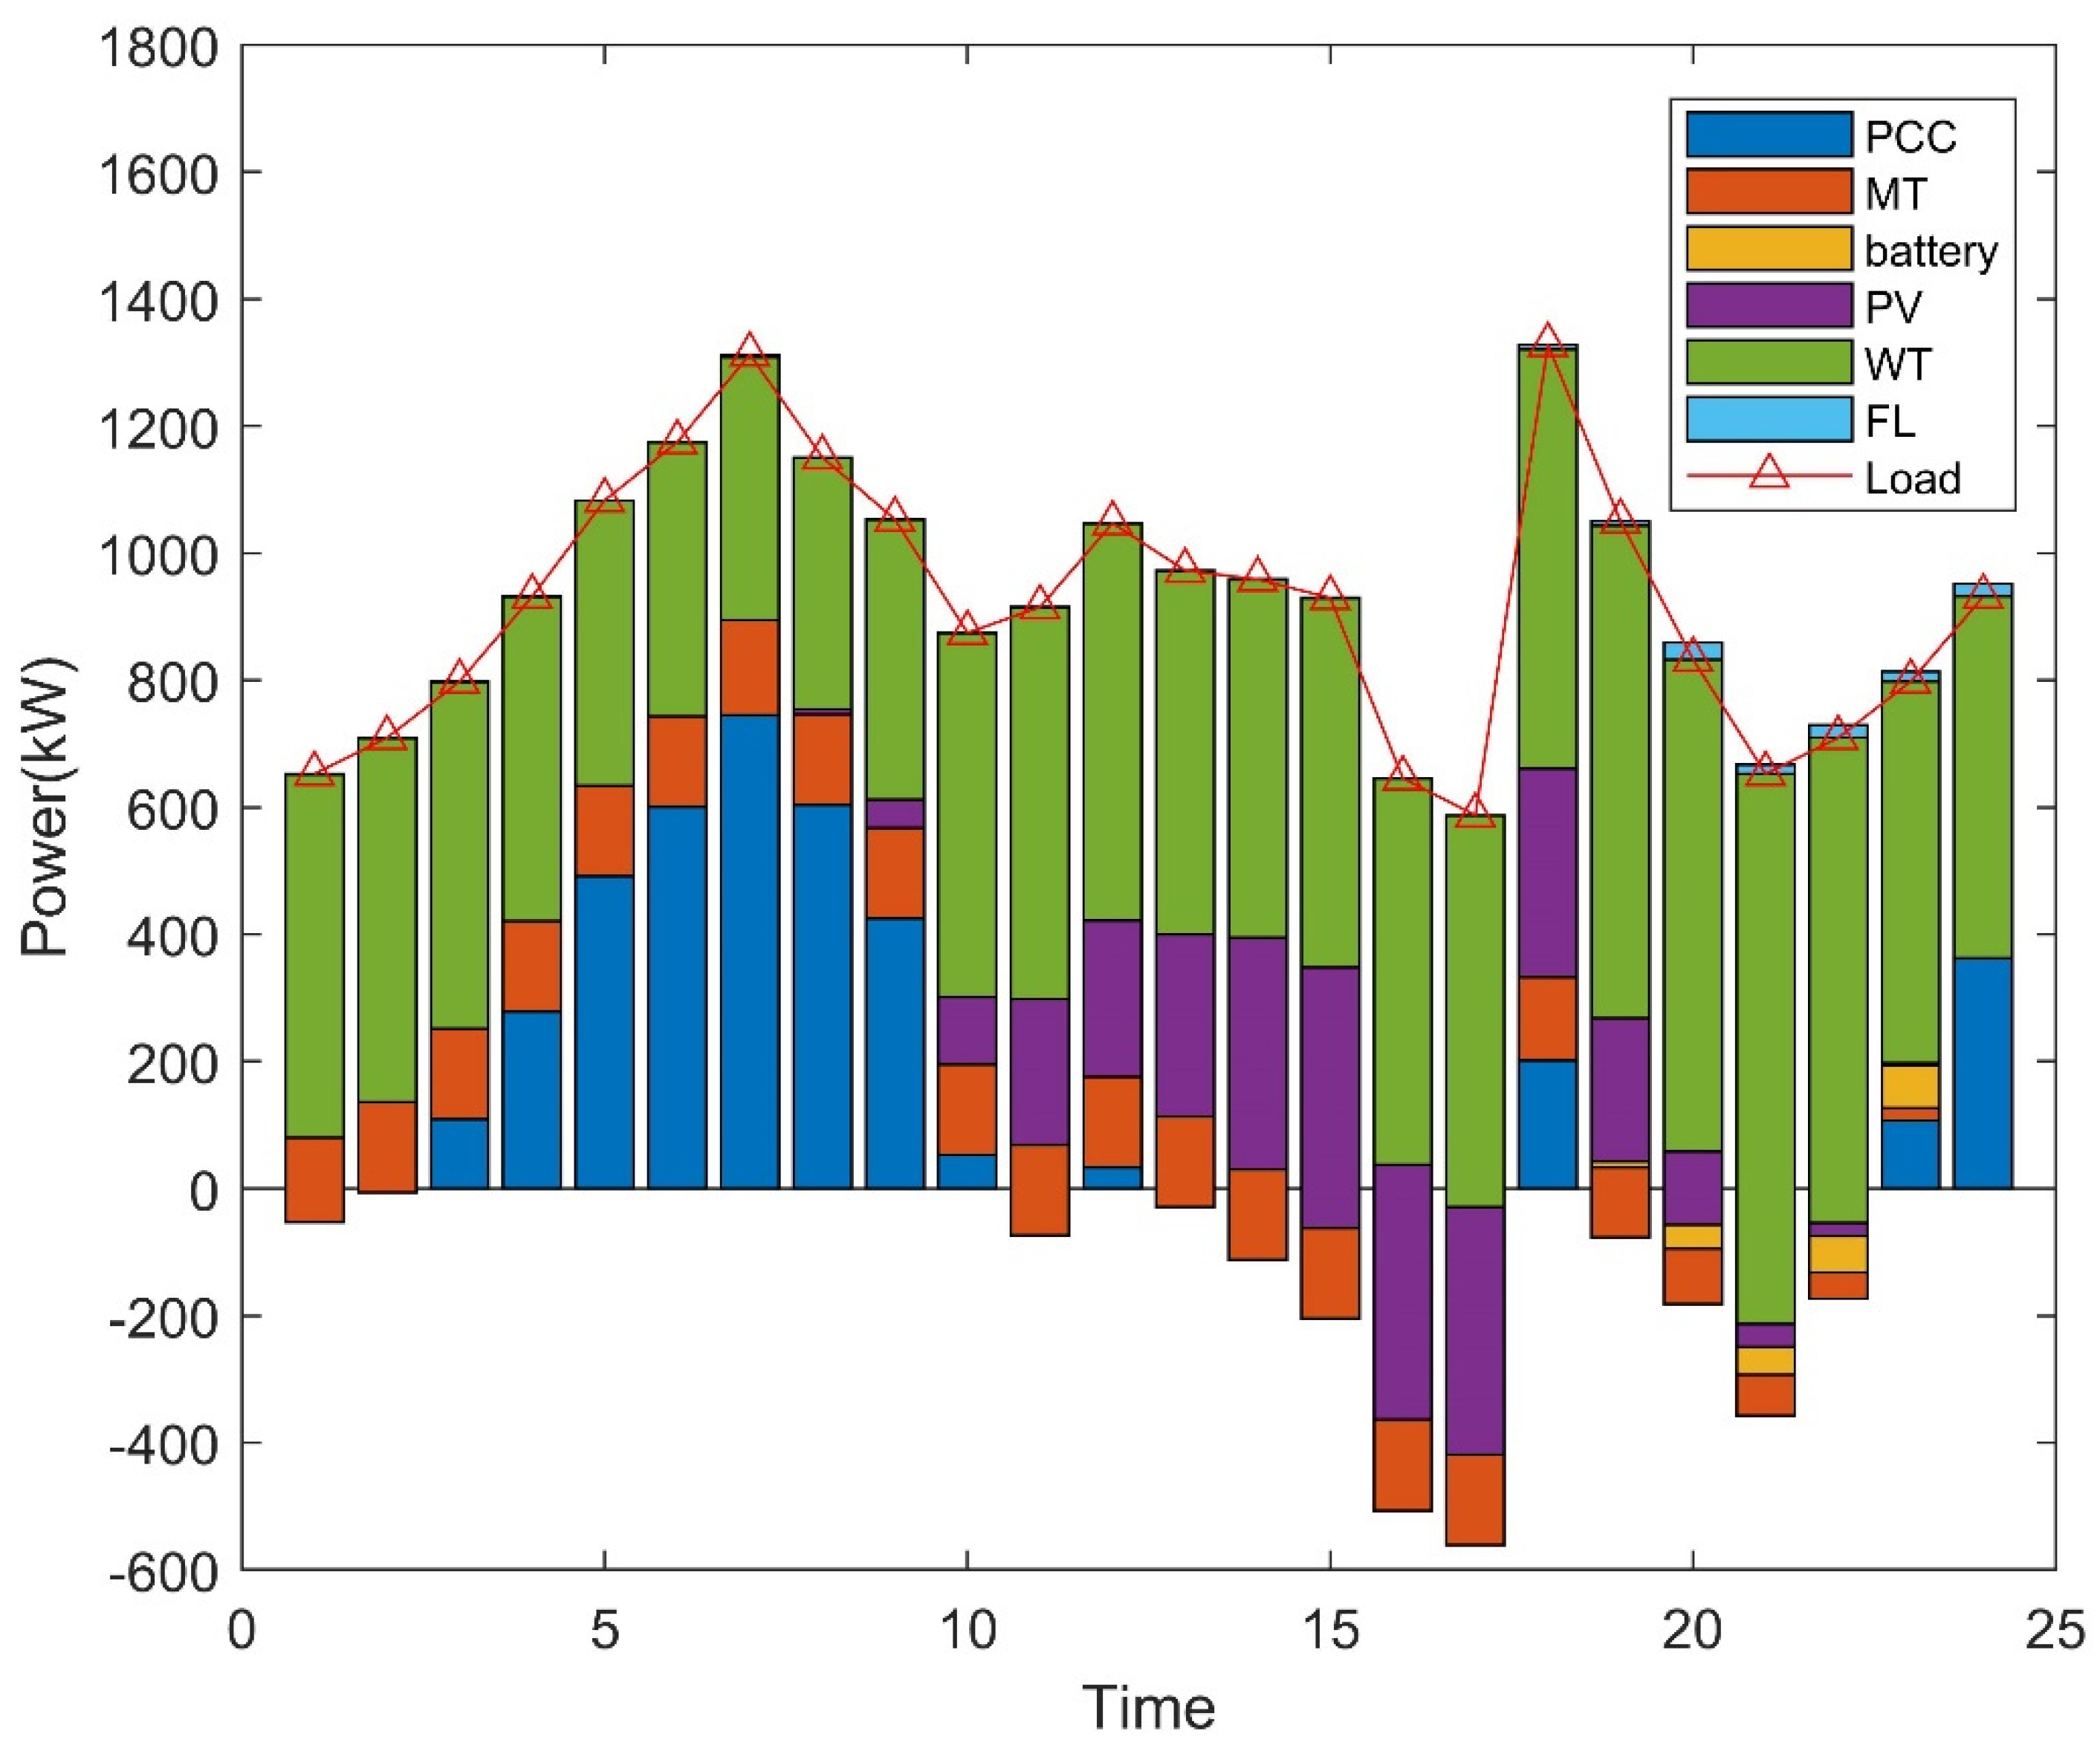
The maximum benefits obtained by VMG and DSO independent optimization based on the MATLAB/YALMIP solution tool are shown in Table 4. The load and the power distribution contribution of each of the lower-level entities are shown in Figure 4, Figure 5, Figure 6 and Figure 7.
It can be seen from the simulation results that the load among the various stakeholders is mainly satisfied by the controllable unit, wind power and photovoltaic, At the same time, the power balance is maintained by charging and discharging of the upper-level purchase and sale of electricity and storage batteries, flexible loads, and electric vehicle charging and discharging stations. Under the optimal dispatching method, wind and photovoltaic power utilization have been improved. The optimal dispatching method has played an important role in promoting the consumption of renewable energy and has played a positive role in solving environmental problems.

5.3. Analysis of Bi-Level Distributed Dispatching Optimization Results

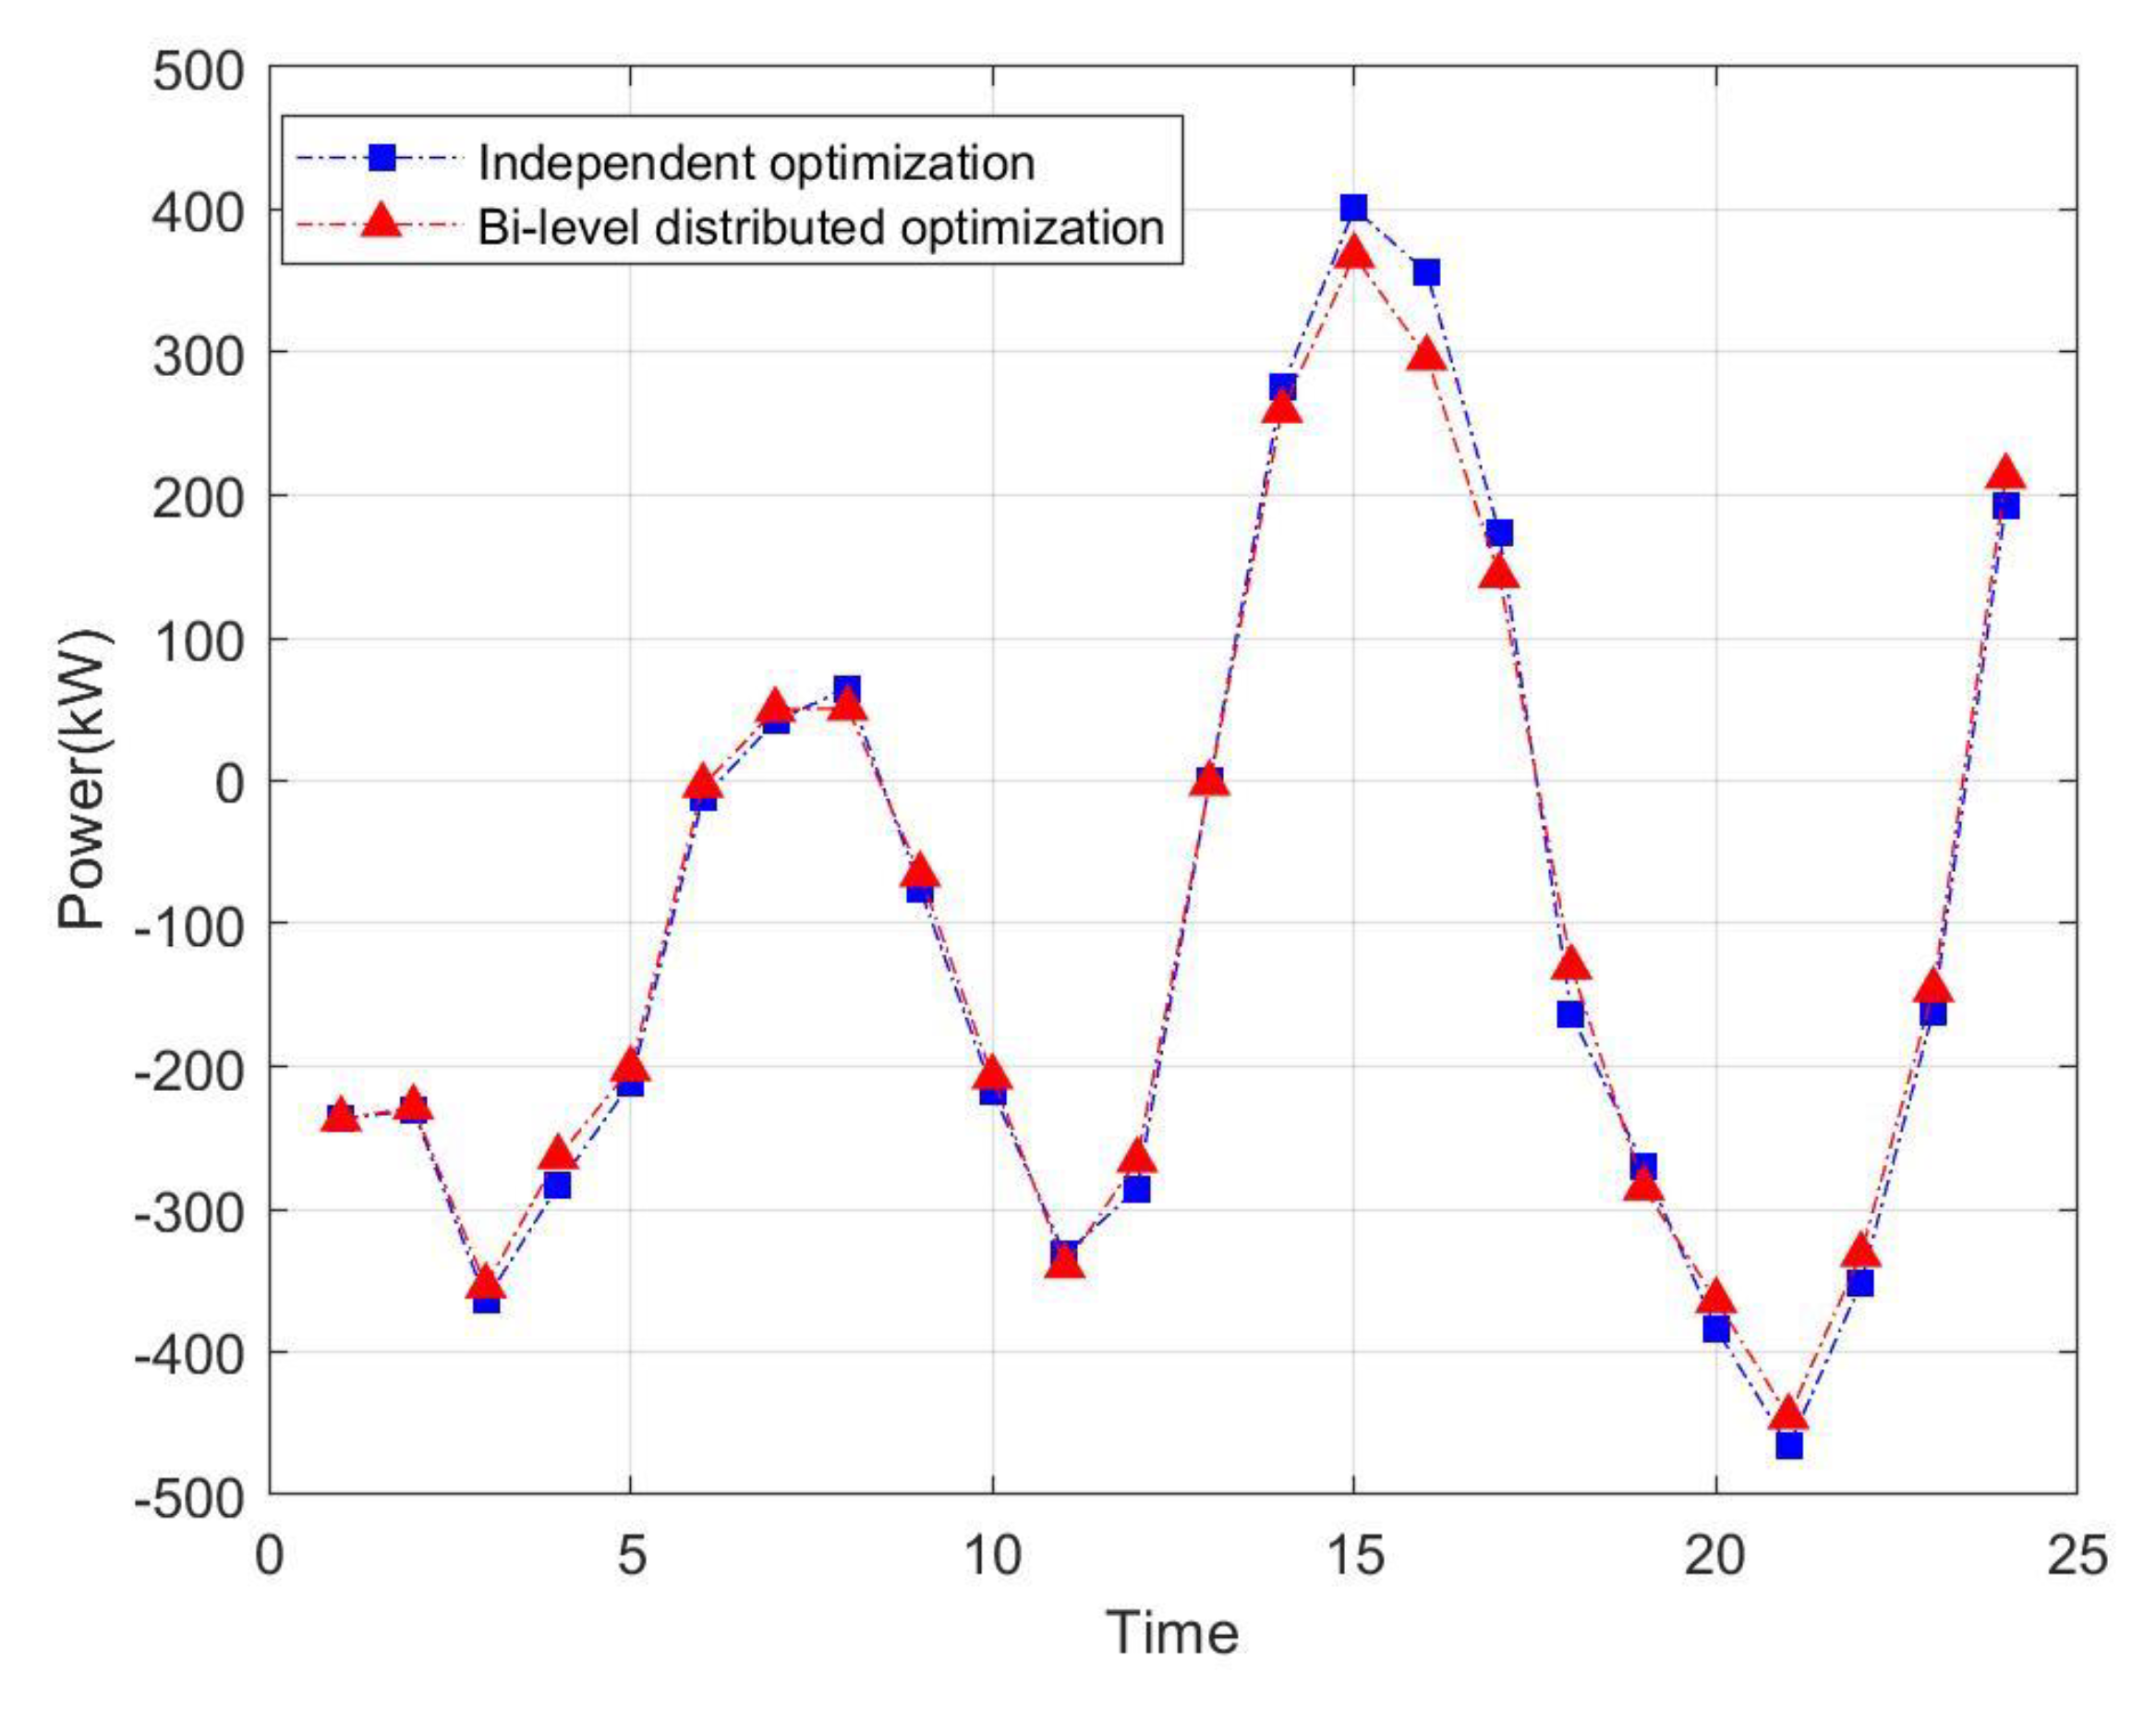
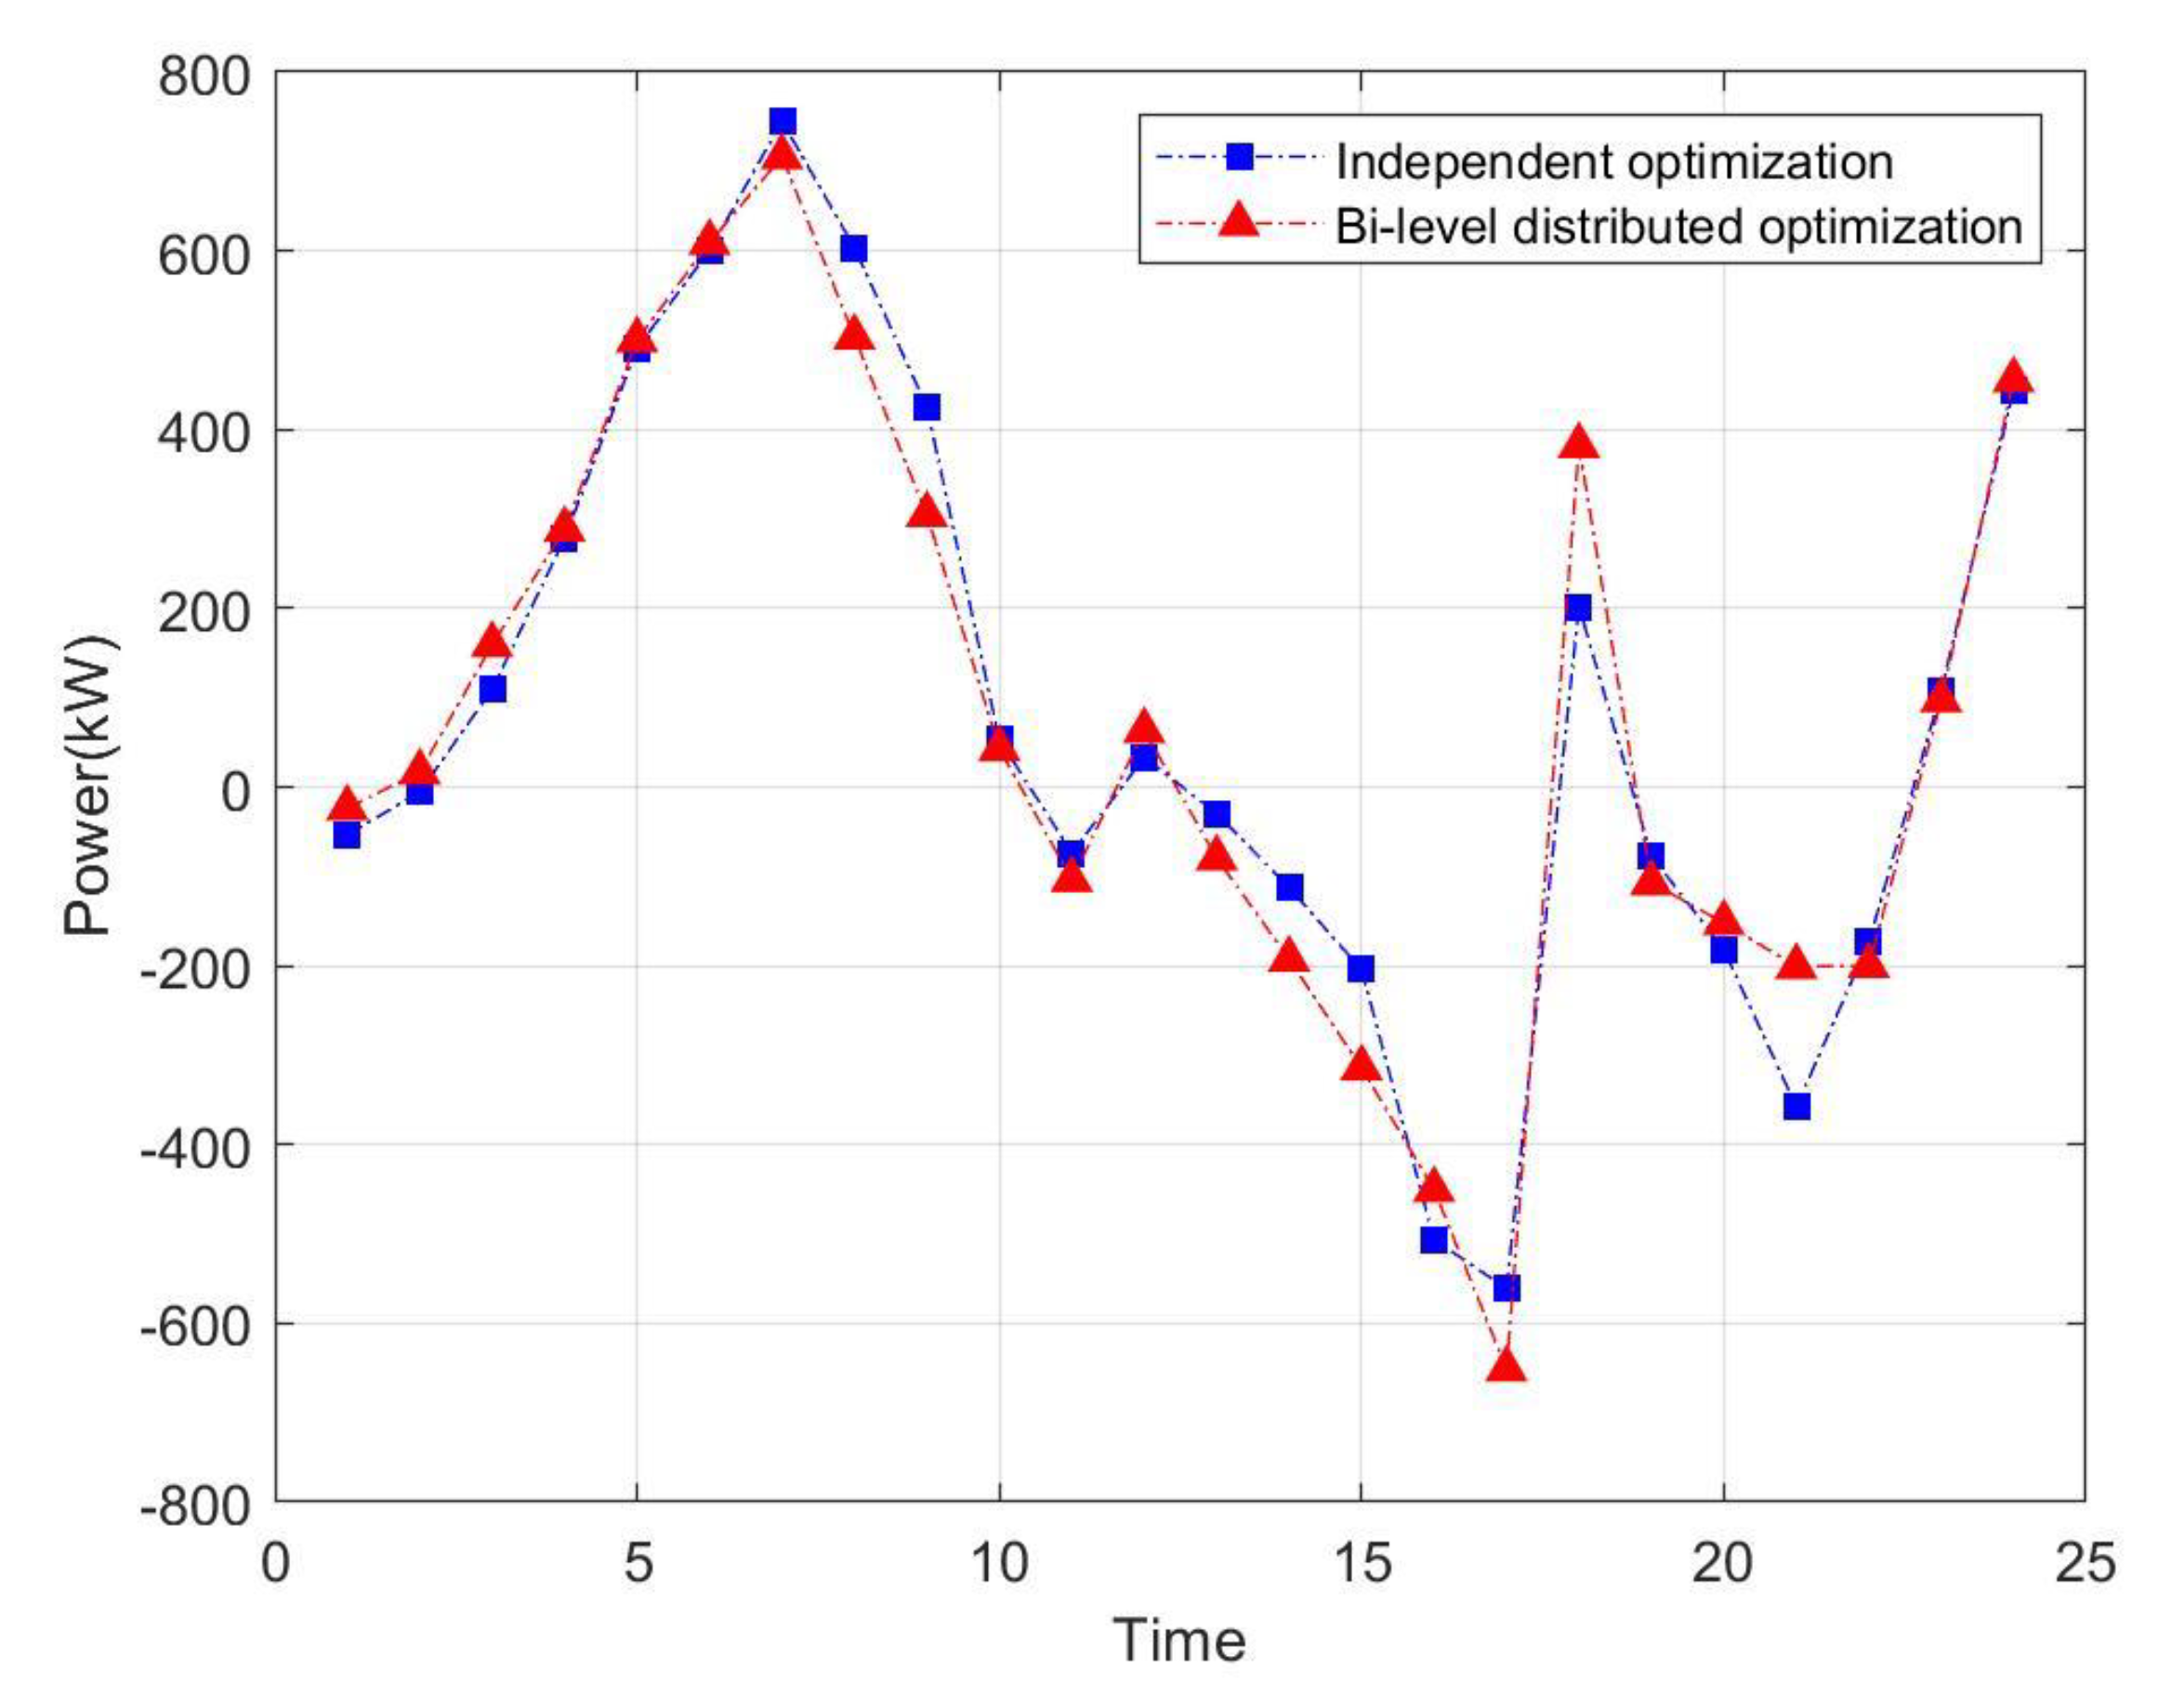
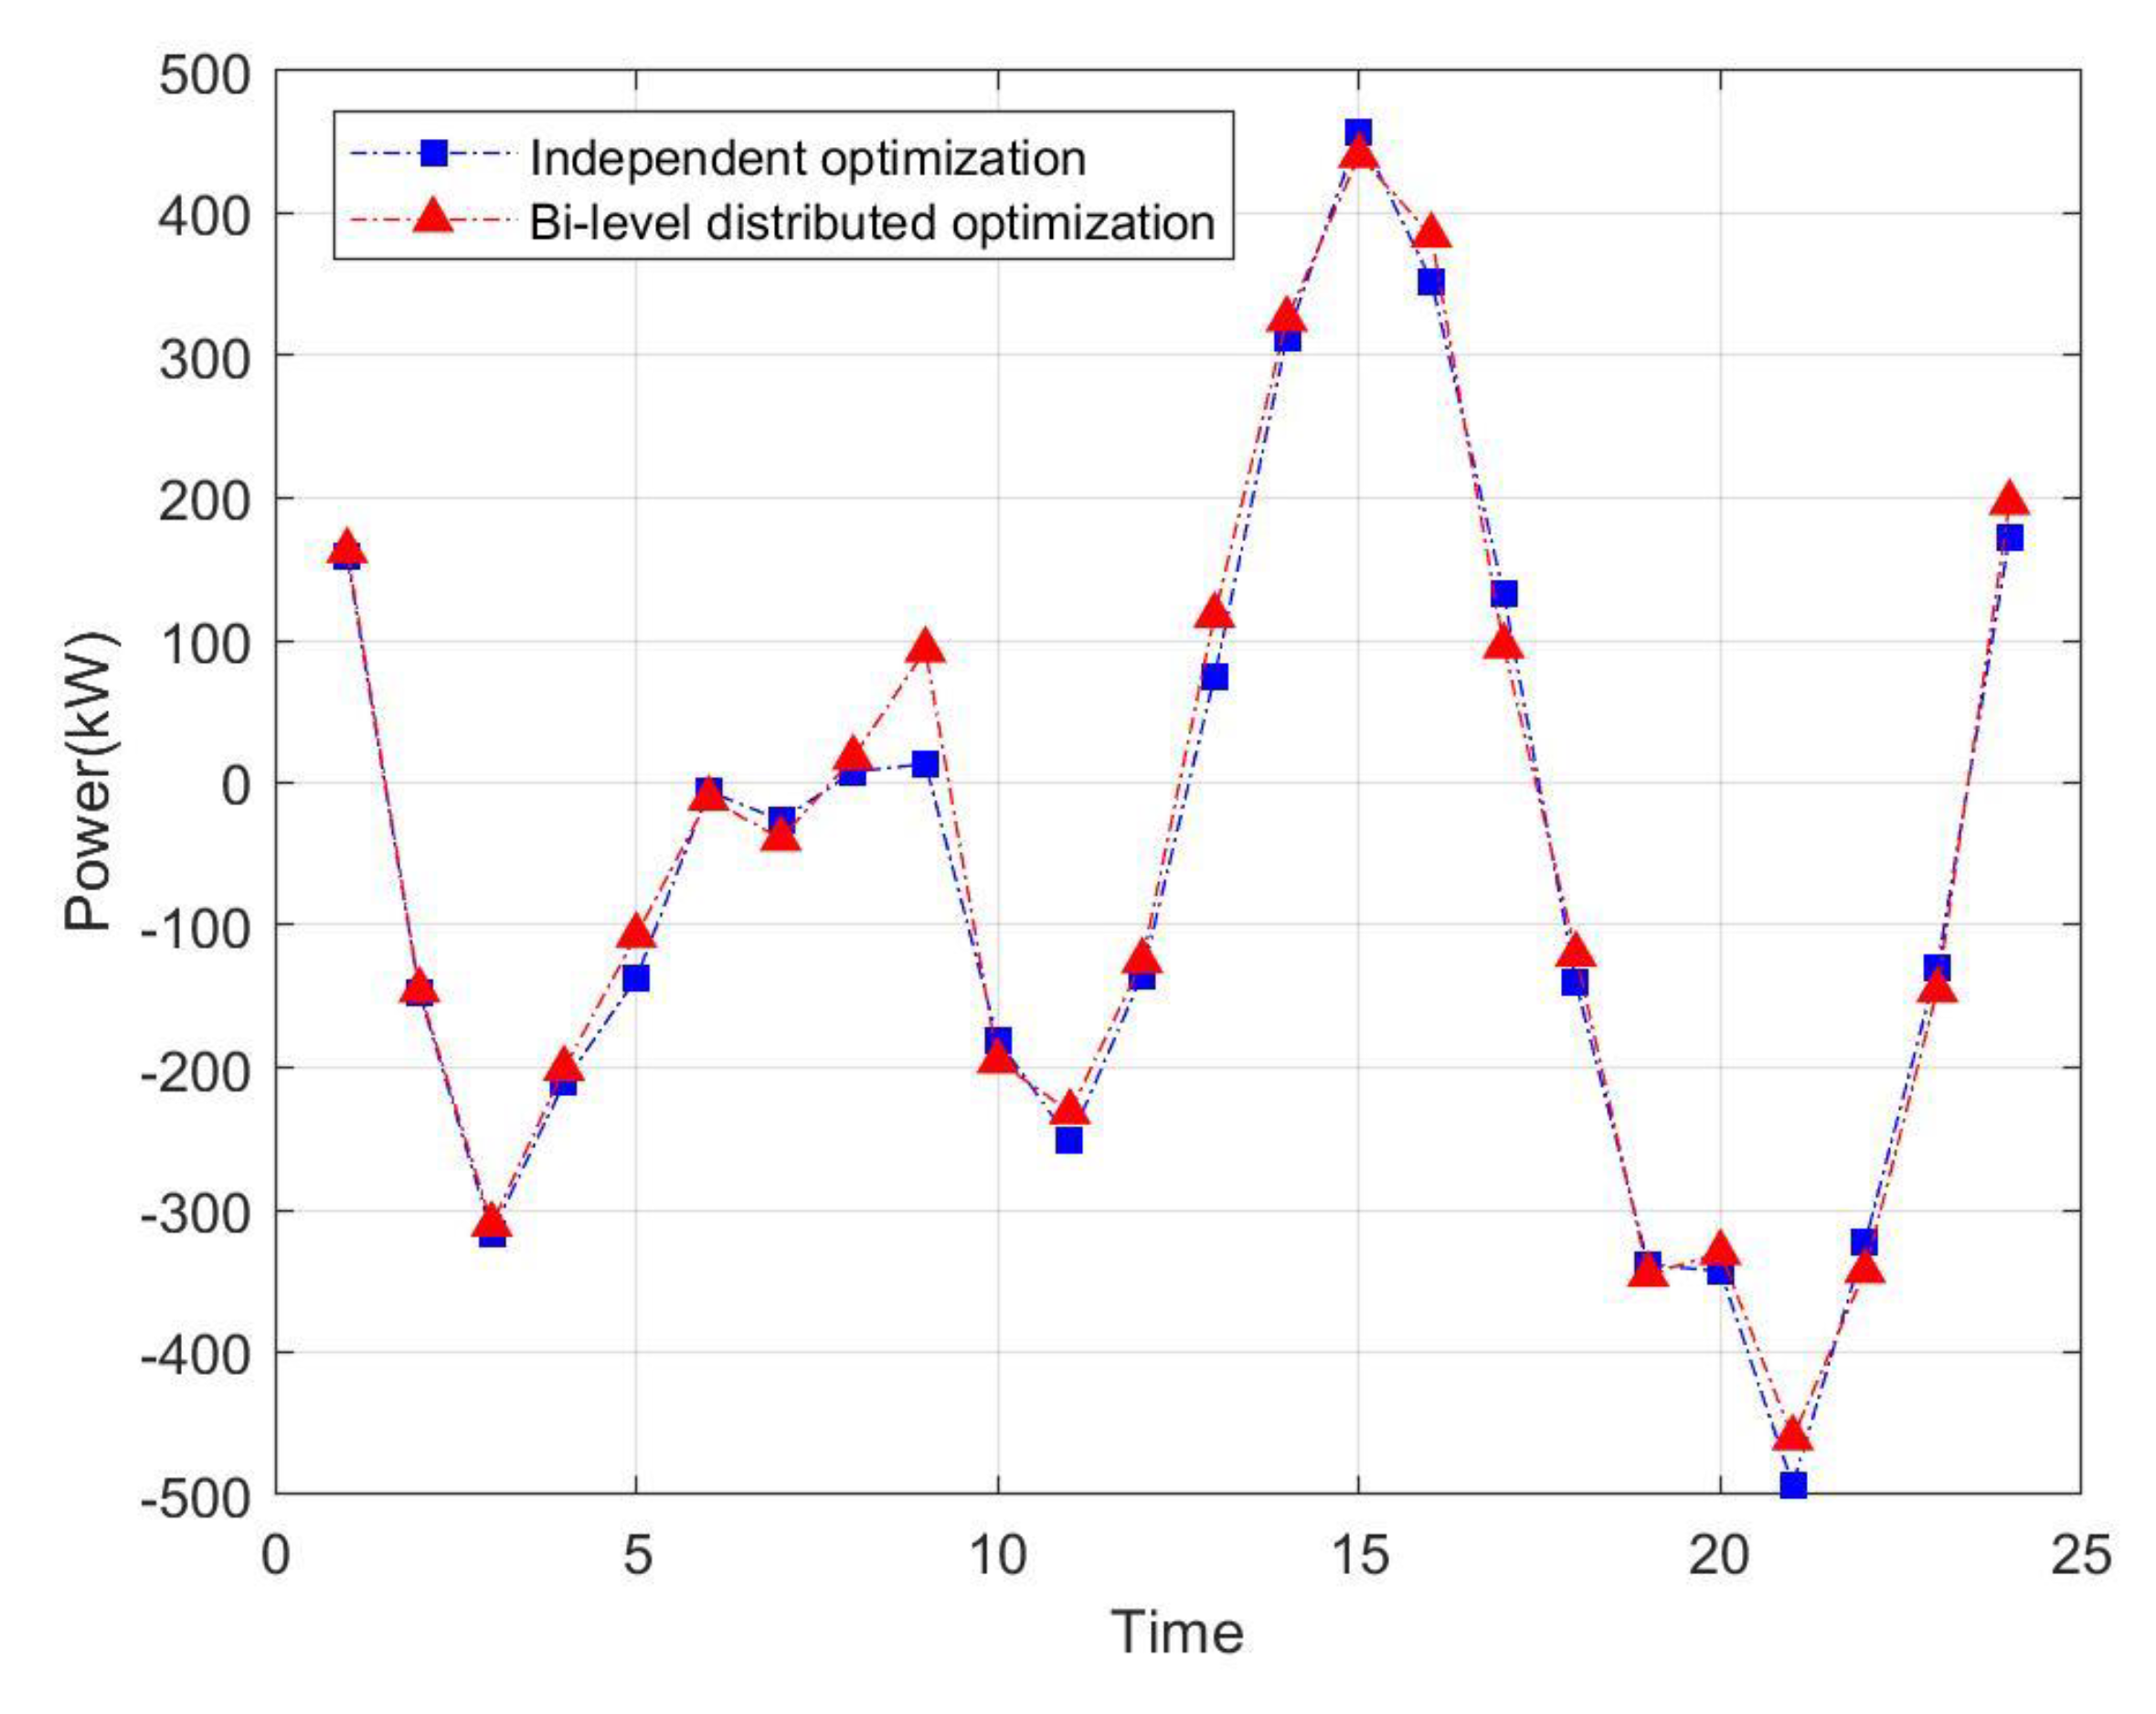
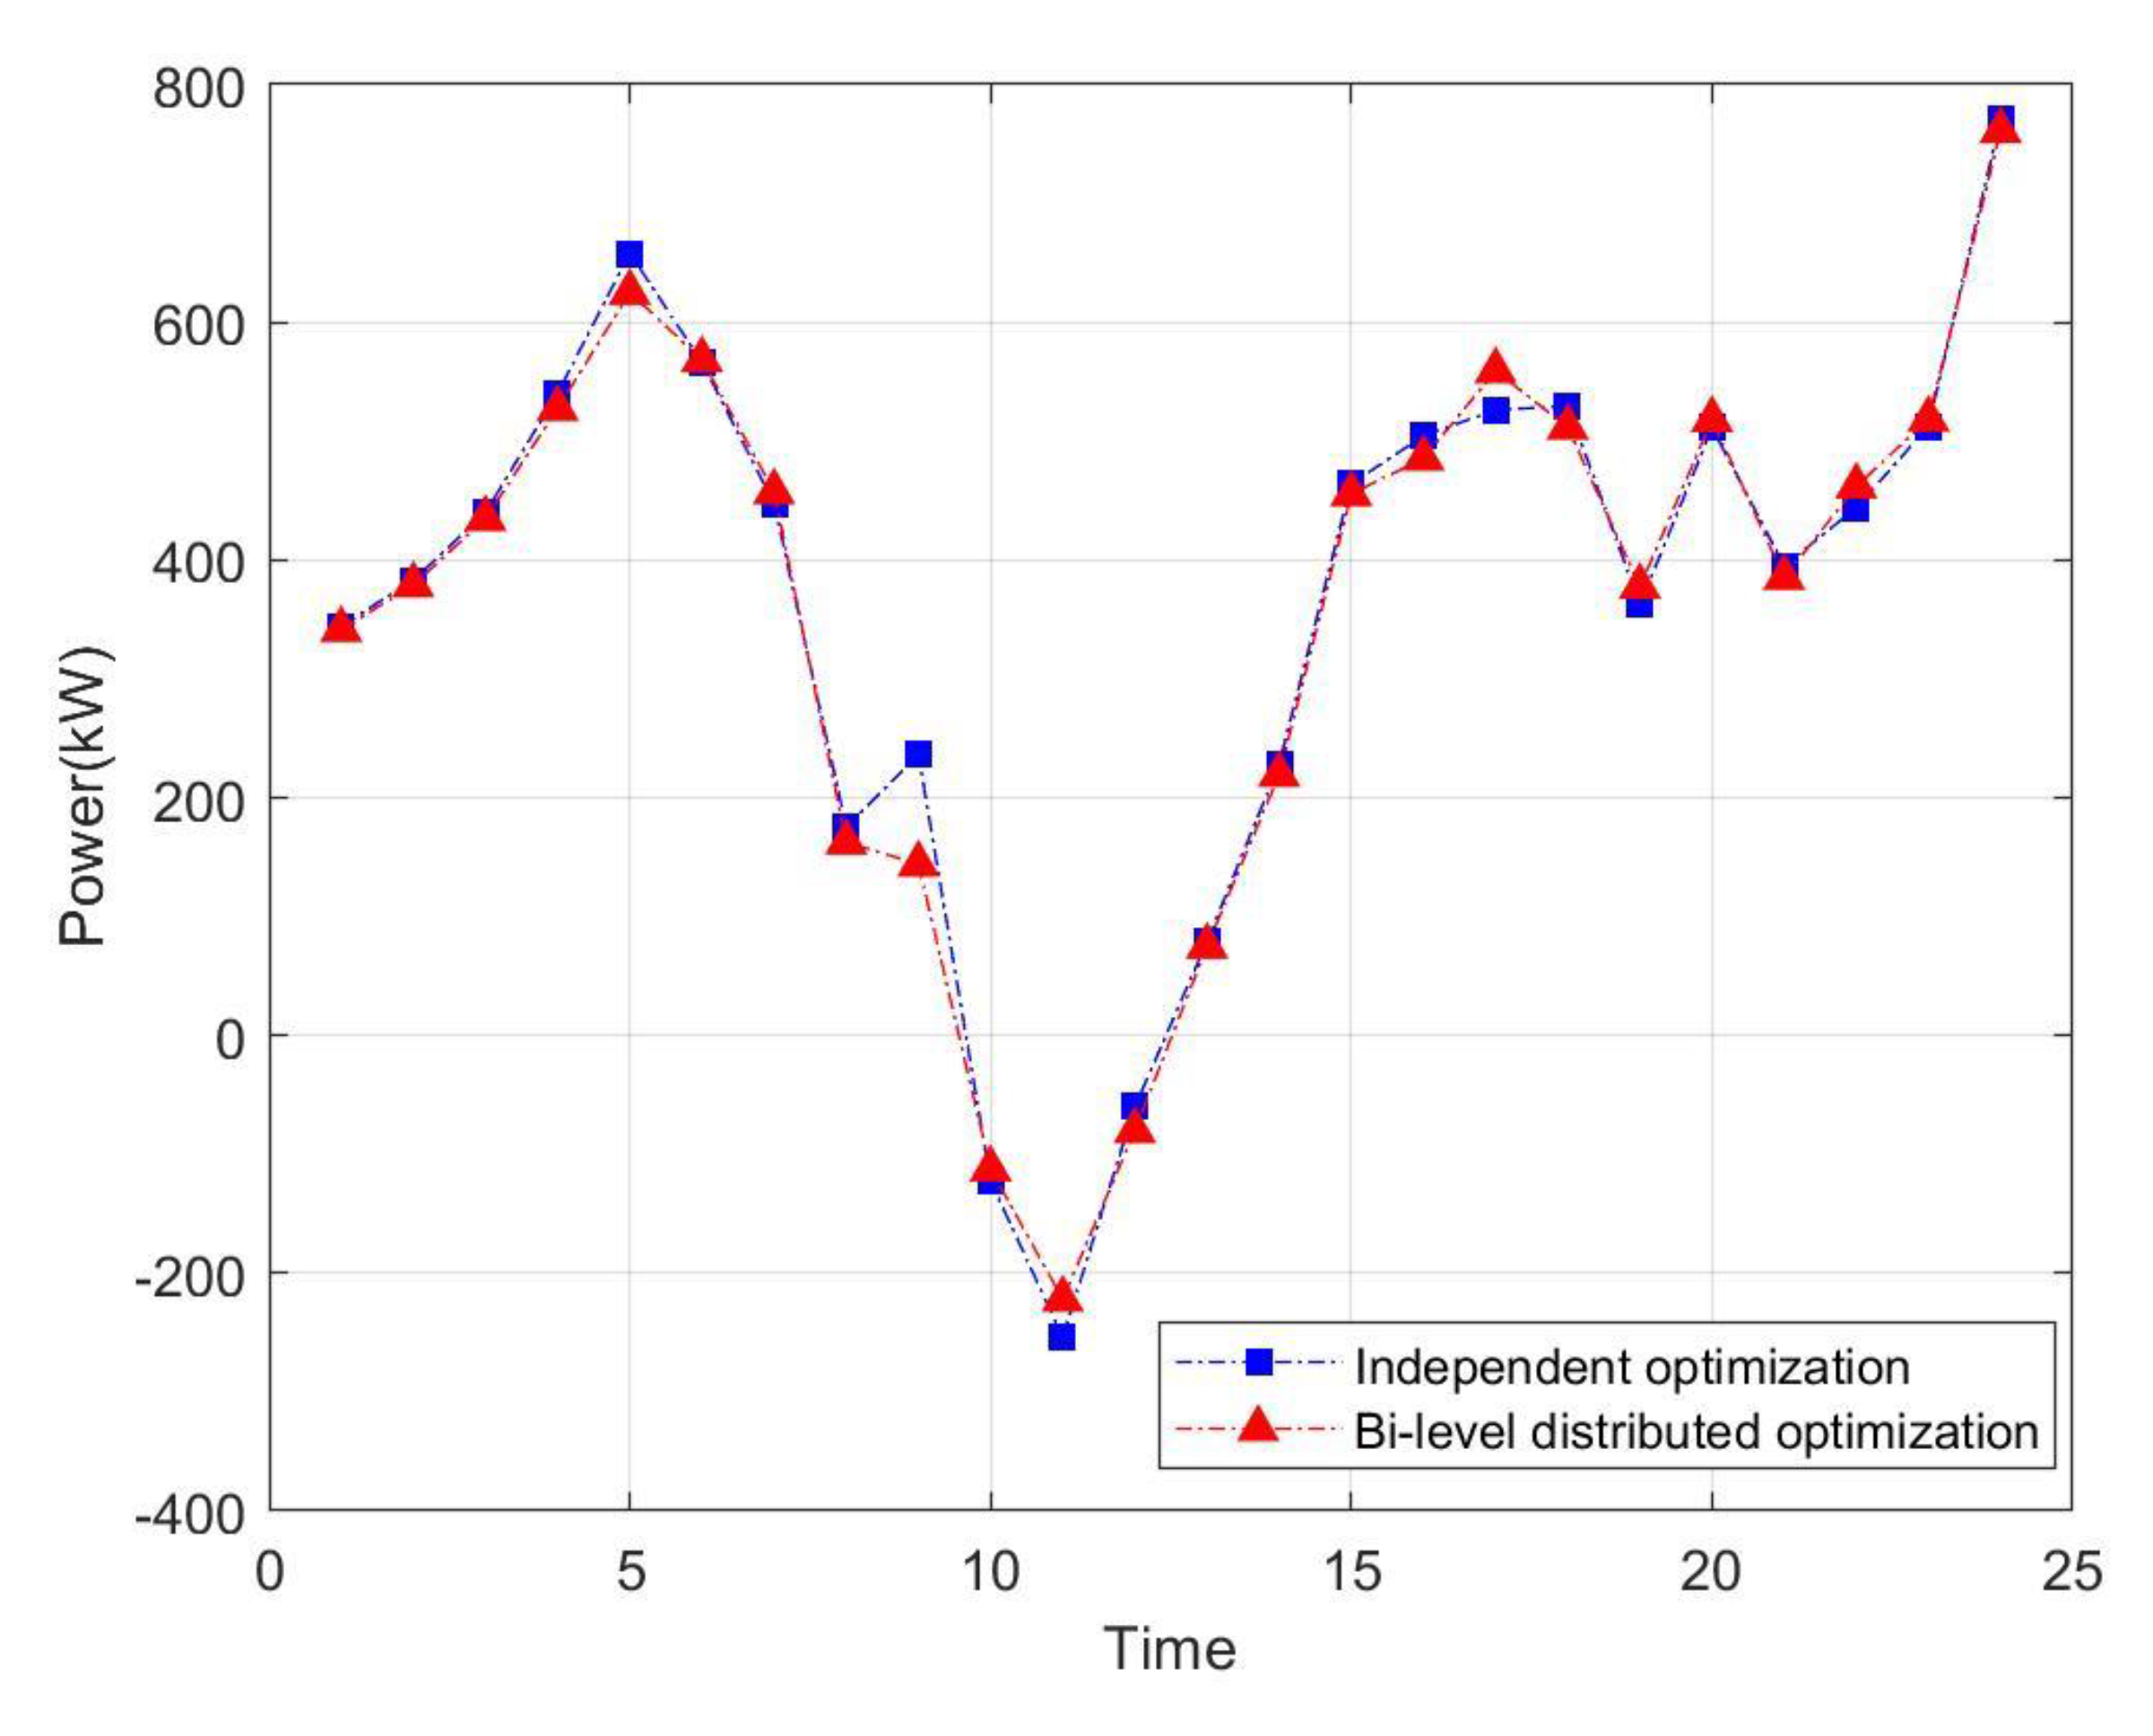
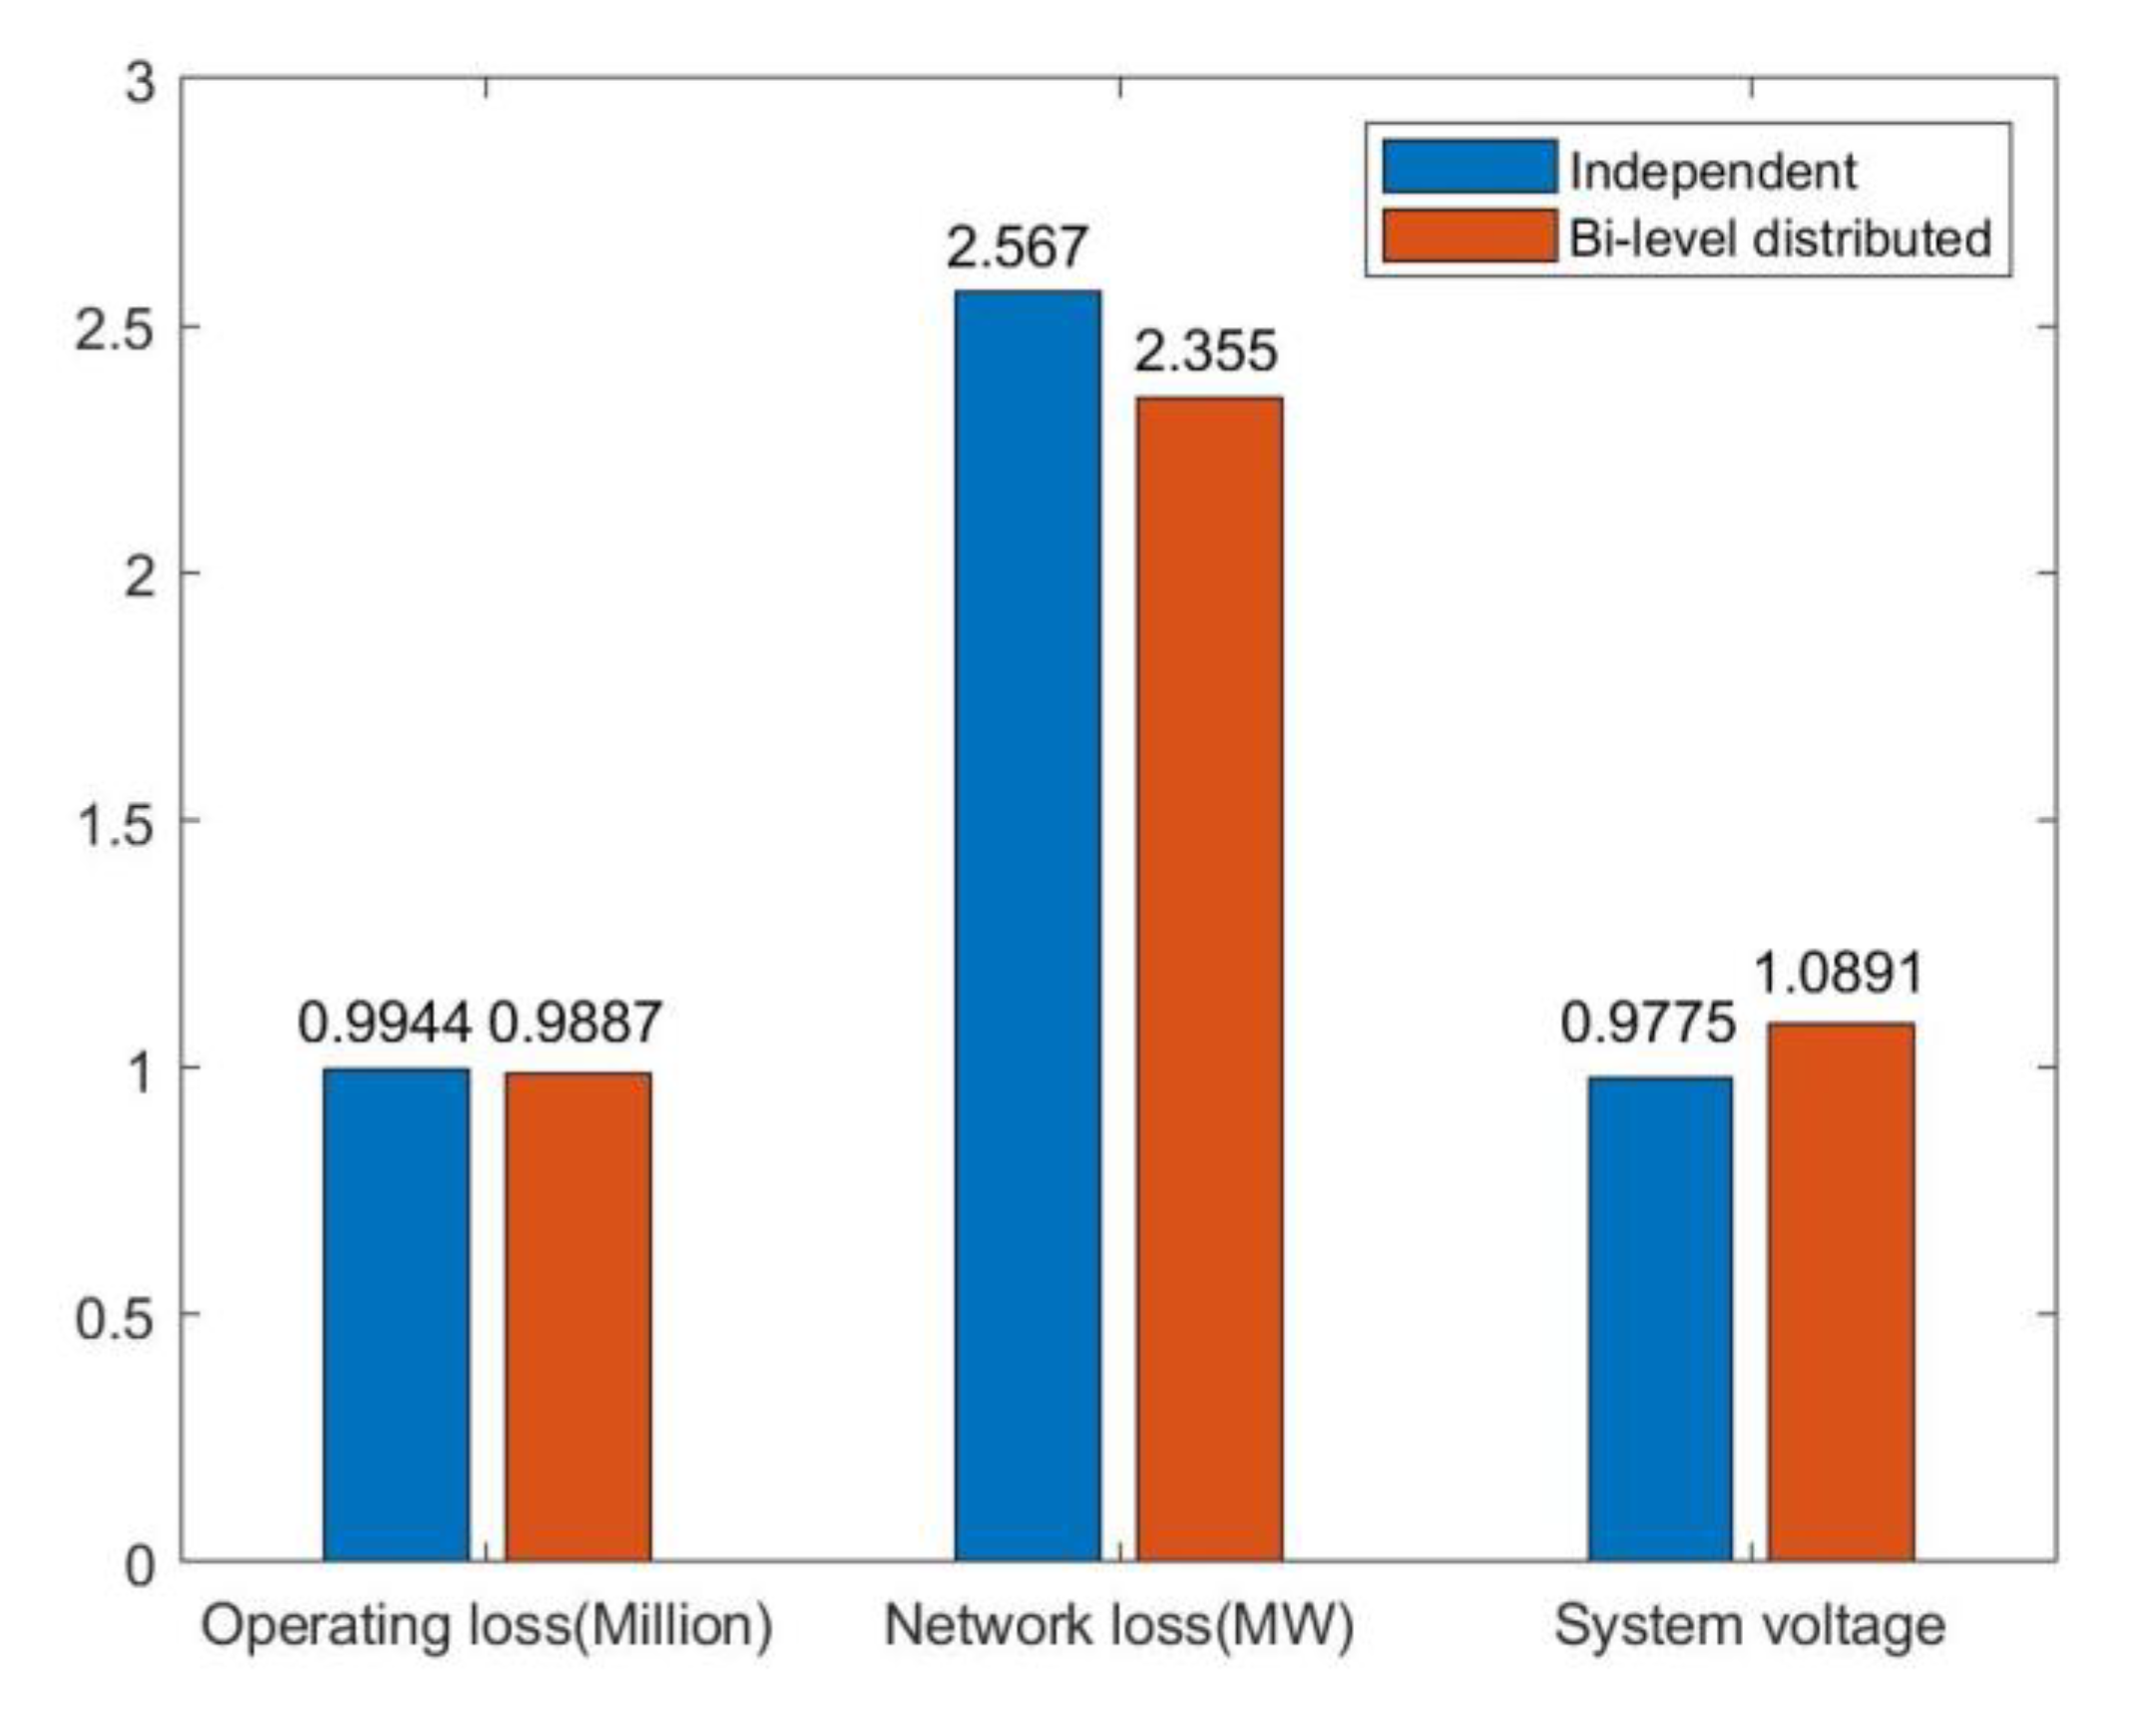
The maximum benefit of each entity of the bi-level distributed dispatching solved by the ADMM and the acceptance of the calculation results of each subject are shown in Table 5. Among them, it is assumed that the power when VMG and DSO purchase power to the grid is positive, and the power when selling power to the grid is negative, and the exchange power in two different optimization modes are shown in Figure 8, Figure 9, Figure 10 and Figure 11. At the same time, the comparison of the total operating cost, network loss and information transmission cost of the entire ADN under two optimization modes are shown in Figure 12.
It can be concluded from the simulation results that the bi-level distributed optimization dispatching results can reach more than 90% acceptance. Under bi-level distributed optimal dispatching mode, the VMG and DSO purchase power from the grid as a load to relieve the power supply pressure of AND, when the load is higher, and sell electricity to the grid to increase VMG and DSO revenue, when the load is lower. It can effectively balance the power conflict between ADN and multi-stakeholder. In addition, the ADN network loss is large, and the average system voltage is lower when ADN operates in an independently optimized dispatching mode. The overall power supply pressure and the network losses of the ADN can be effectively reduced when operating in the bi-level distributed optimal dispatching mode. This makes the voltage quality of ADN performs better. At the same time, the difference between the power generation cost of distributed dispatching and the centralized optimization data transmission cost is about 0.1%, which is basically negligible, but only the need to upload the expected switching power due to distributed dispatching, when the various stakeholders have the maximum benefit. Further, When the information security and privacy requirements are higher, the bi-level distributed dispatching reduces the amount of information in the uploading and dispatching center, and can better satisfy the requirements of security and privacy protection of each subject.
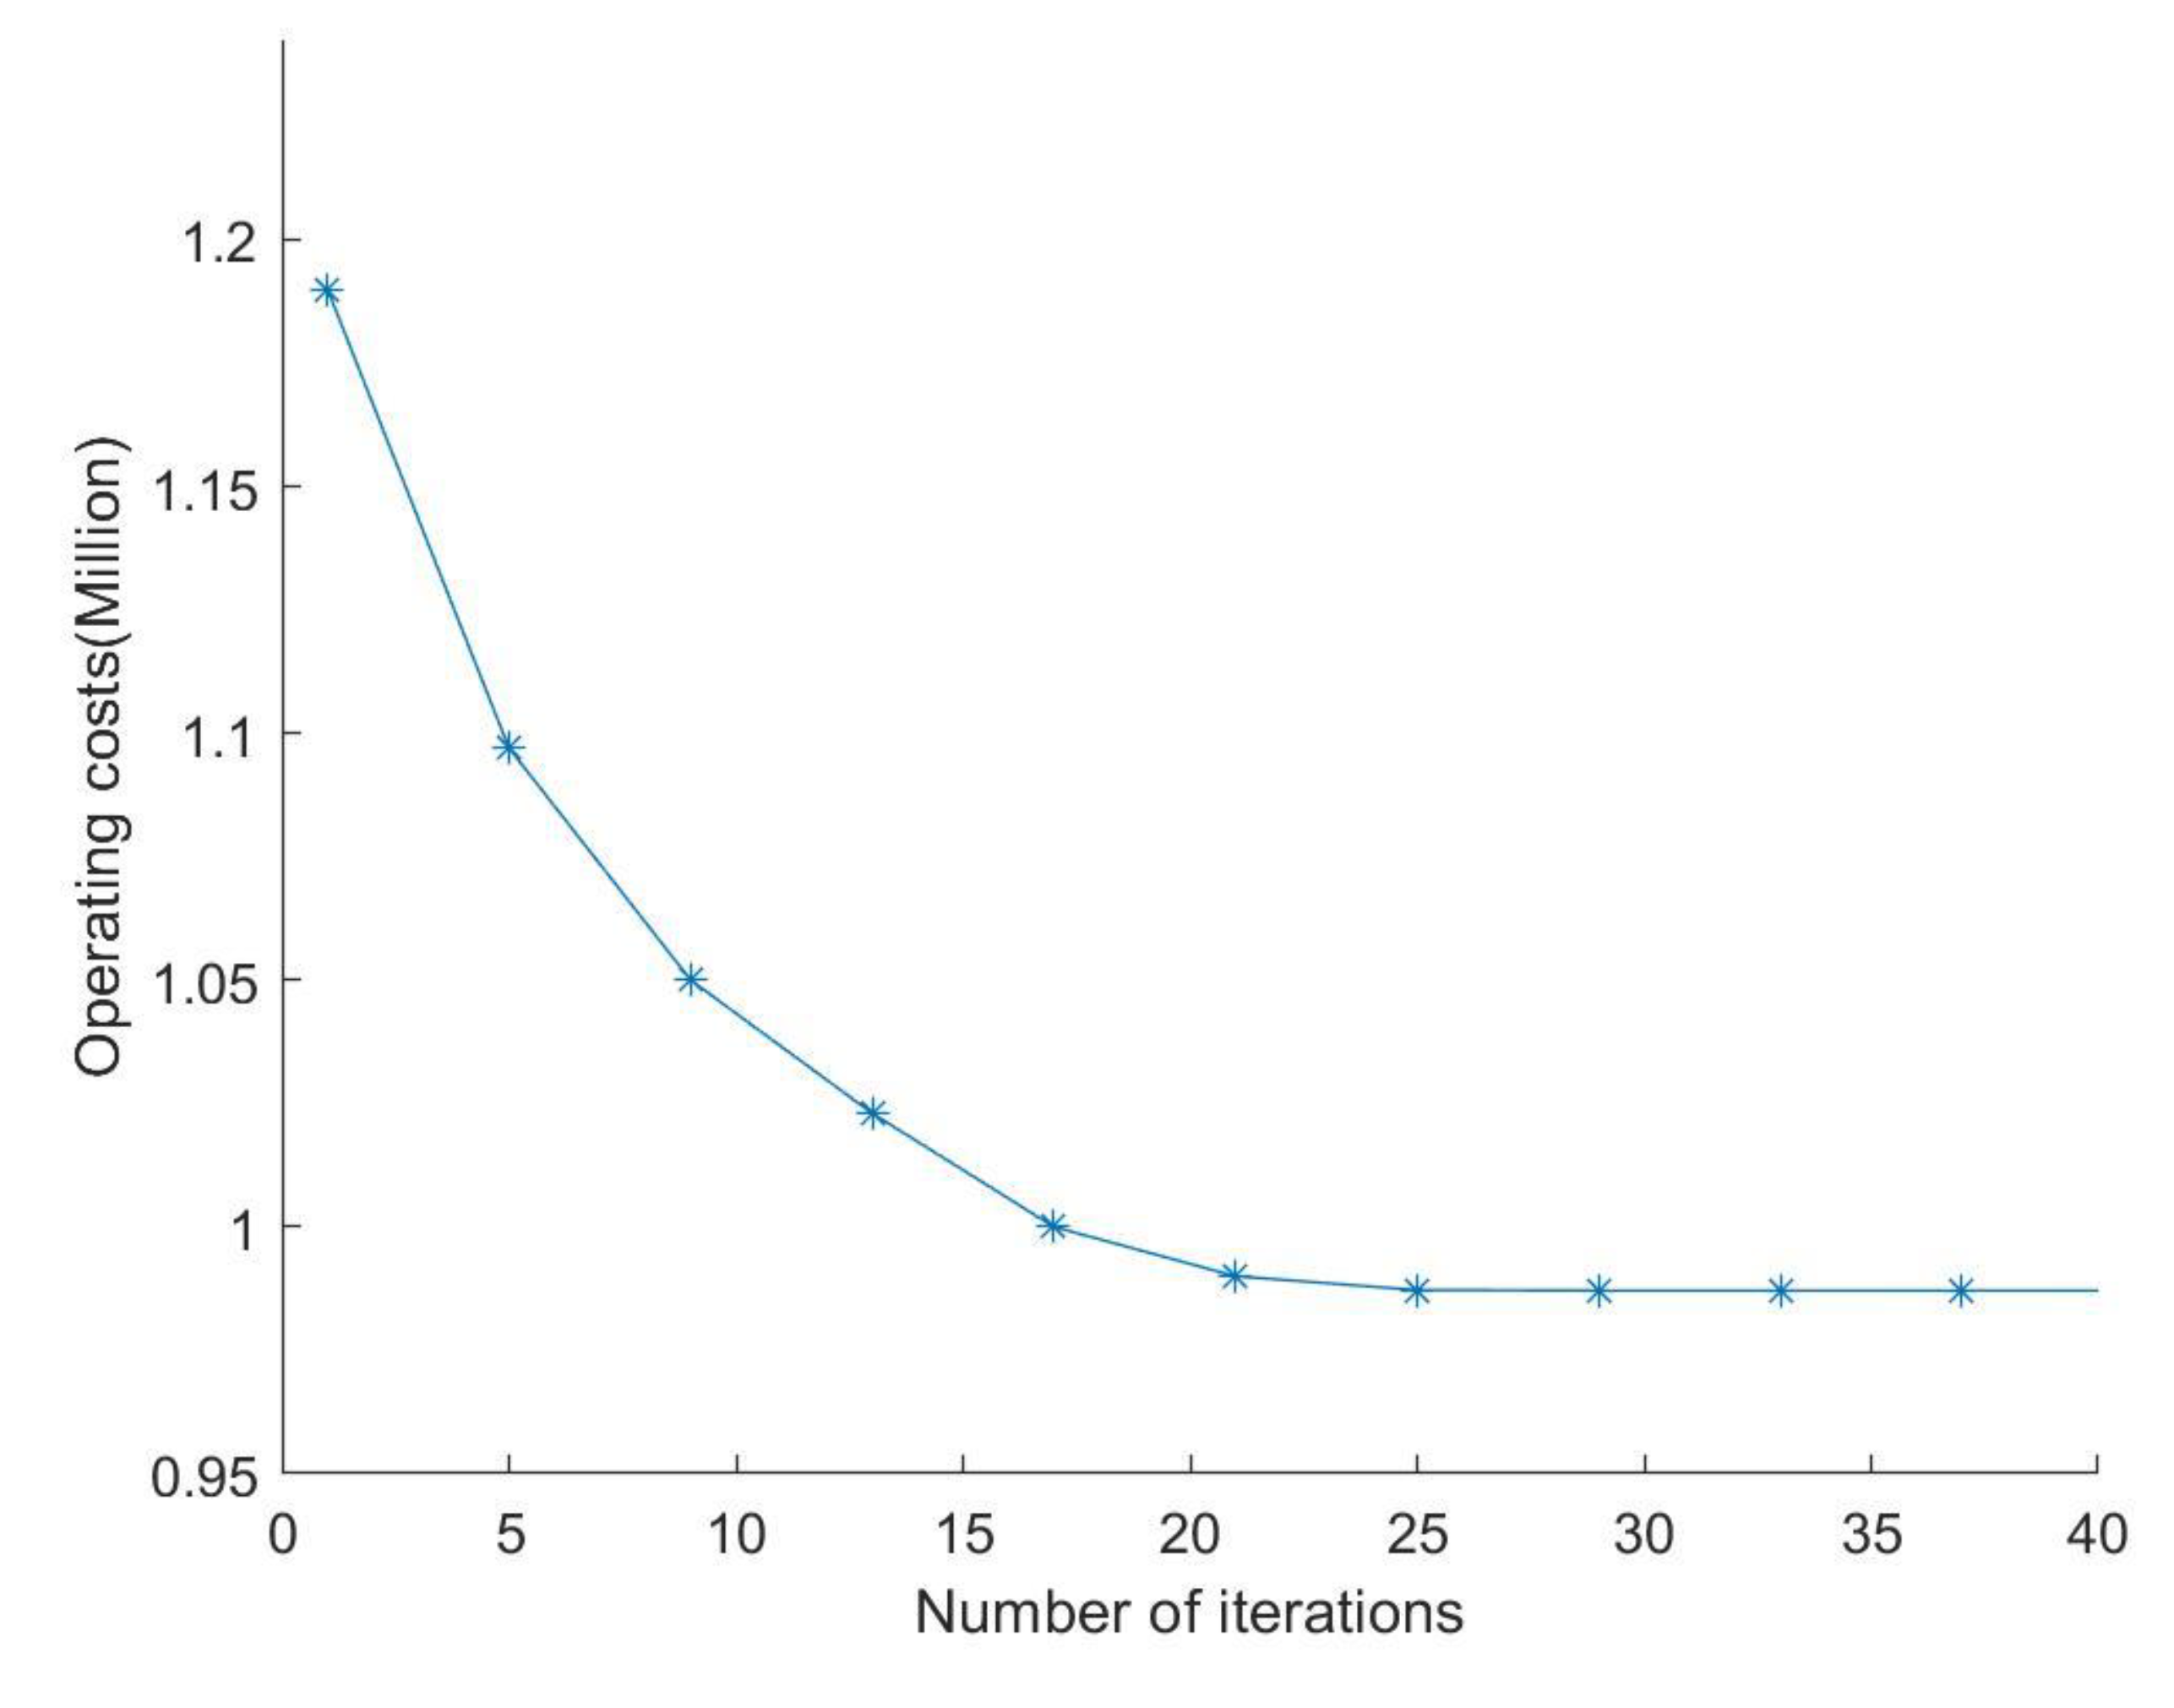
In Figure 13, it can be concluded from the simulation results that the VMG and DSO gradually met the desired acceptability of each region with iterations progressed. Finally, the ADMM algorithm achieves convergence at the 27th iteration, which indicates that the ADMM algorithm is feasible in solving the distributed problem and can find a better global optimal solution.

6. Conclusions

In this paper, the ADN is rationally partitioned, and a bi-level distributed optimization model of ADN including wind power, photovoltaic, gas turbine, energy storage system, flexible load, electric vehicle charging and discharging station is established to solve the new problem that the DSO and VMG participate in the grid economic dispatching as a new stakeholder. Further, the ADMM is applied to solve the distributed model. In the distributed dispatching process, only the expected power needs to be exchanged, which makes the communication burden be greatly reduced, and each multi-stakeholder’s privacy security increased. Finally, the adjusted IEEE 33 bus is taken as an example, and the advantages of the proposed bi-level distributed optimization model are verified by comparing the bi-level distributed optimization dispatching with independent optimization dispatching. The simulation results show the effectiveness and stability of the model in dealing with multi-stakeholder participation in grid dispatching, it can effectively balance the power conflict between ADN and multi-stakeholder.

Author Contributions

All authors contributed to the research in the paper, S.L., Z.N., and Y.L. conceived and designed the model. S.L. provided the data. Z.N. analyzed the data. Y.L. wrote the paper. All authors have read and agreed to the published version of the manuscript.

Funding

This work was supported in part by the National Natural Science Foundation of China under Grant 51477099, the National Natural Science Foundation of China under Grant 11201267, and by the Innovation Program of Shanghai Municipal Education Commission under Grant 15ZZ106.

Conflicts of Interest

The authors declare no conflict of interest.

Appendix A

Table A1. The resistance parameters of the IEEE33 network.
Branch NumberStarting BusArrival BusR/puX/puBranch BumberStarting BusArrival BusR/puX/pu
1010.09220.0471723240.7860.564
21130.4930.251118561.5090.9337
313140.1640.156519671.030.74
414150.45210.308320780.80420.7006
515160.3660.186421891.0440.74
616171.5041.3554229100.50750.2585
717180.38110.19412310110.19660.065
818190.40950.47842411120.97440.963
9120.8960.7011255250.37440.1238
10230.8190.7072625260.31050.3619
11340.70890.93732726271.4681.115
12450.2030.10342825280.3410.5320
132200.18720.61882928290.54120.7129
1420210.28420.14773028300.5910.526
1521220.71440.23513130310.74630.545
1622230.7320.5743231321.2891.721

References

  1. Ochoa, L.F.; Dent, C.J.; Harrison, G.P. Distribution network capacity assessment: Variable DG and active networks. IEEE Trans. Power Syst. 2010, 25, 87–95. [Google Scholar] [CrossRef] [Green Version]
  2. Yang, T.; Zhai, F.; Zhao, Y.; Pen, H. Explanation and Prospect of Ubiquitous Electric Power Internet of Things. Autom. Electr. Power Syst. 2019, 43, 9–20, In Chinese. [Google Scholar]
  3. Venkatesh, B.; Chandramohan, S.; Kayalvizhi, N.; Kumudini-Devi, R.P. Optimal reconfiguration of radial distribution systems using artificial intelligence methods. In Proceedings of the 2009 IEEE Toronto International Conference Science and Technology for Humanity (TIC-STH), Toronto, ON, Canada, 26–27 September 2009; pp. 660–665. [Google Scholar]
  4. Juang, C.; Hsiao, C.; Hsu, C. Hierarchical cluster based multispecies particle swarm optimization for fuzzy system optimization. IEEE Trans. Fuzzy Syst. 2010, 18, 14–26. [Google Scholar] [CrossRef]
  5. Shaaban, M.F.; Atwa, Y.M.; El-Saadany, E.F. DG allocation for benefit maximization in distribution networks. IEEE Trans. Power Syst. 2013, 28, 639–649. [Google Scholar] [CrossRef]
  6. El-Khattam, W.; Bhattacharya, K.; Hegazy, Y.; Salama, M.M.A. Optimal investment planning for distributed generation in a competitive electricity market. IEEE Trans. Power Syst. 2004, 19, 1674–1684. [Google Scholar] [CrossRef]
  7. Zia, M.F.; Benbouzid, M.; Elbouchikhi, E.; Muyeen, S.M.; Techato, K.; Guerrero, J.M. Microgrid Transactive Energy: Review, Architectures, Distributed Ledger Technologies, and Market Analysis. IEEE Access 2020, 8, 19410–19432. [Google Scholar] [CrossRef]
  8. Du, P.; Chen, Z.; Chen, Y.; Ma, Z.; Ding, H. Bi-level linearized dispatching model of active distribution network with multi-stakeholder participation based on analytical target cascading. IEEE Access 2019, 7, 154844–154858. [Google Scholar] [CrossRef]
  9. Farrokhifar, M.; Aghdam, F.H.; Alahyari, A.; Monavari, A.; Safari, A. Optimal energy management and sizing of renewable energy and battery systems in residential sectors via a stochastic MILP model. Electr. Power Syst. Res. 2020, 187, 106483. [Google Scholar] [CrossRef]
  10. Lu, J.; Chu, W.; Ren, H.; He, T.; Wang, F. Coordinated optimal dispatch of multi-stakeholder game based on demand response for active distribution network. IET Renew. Power Gener. 2019, 13, 898–904. [Google Scholar] [CrossRef]
  11. Ma, W.-J.; Wang, J.; Gupta, V.; Chen, C. Distributed energy management for networked microgrids using online ADMM with regret. IEEE Trans. Smart Grid 2018, 9, 847–856. [Google Scholar] [CrossRef]
  12. Zheng, W.; Wu, W.; Zhang, B.; Sun, H.; Liu, Y. A fully distributed reactive power optimization and control method for active distribution net-works. IEEE Trans. Smart Grid 2016, 7, 1021–1033. [Google Scholar]
  13. Nie, Y.; Farrokhifar, M.; Pozo, D. Electricity and Gas Network Expansion Planning: An ADMM-based Decomposition Approach. In Proceedings of the 2019 IEEE Milan PowerTech, Milan, Italy, 23–27 June 2019; pp. 1–6. [Google Scholar] [CrossRef]
  14. Zhao, Y.; Yu, J.; Ban, M. Privacy-Preserving Economic Dispatch for An Active Distribution Network with Multiple Networked Microgrids. IEEE Access 2018, 6, 38802–38819. [Google Scholar] [CrossRef]
  15. Yang, X.; Chen, W.; Wu, L. Voltage Quality Control Method for Microgrid. Proc. CSU-EPSA 2018, 30, 63–69. [Google Scholar]
  16. Farag, H.E.Z.; El-Saadany, E.F. A novel cooperative protocol for distributed voltage control in active distribution systems. IEEE Trans. Power Syst. 2013, 28, 1645–1656. [Google Scholar] [CrossRef]
  17. Hossain, M.A.; Pota, H.R.; Squartini, S.; Zaman, F.; Guerrero, J.M. Energy scheduling of community microgrid with battery cost using particle swarm optimization. Appl. Energy 2019, 254, 113723. [Google Scholar] [CrossRef]
  18. Hossain, M.A.; Pota, H.R.; Squartini, S.; Zaman, F.; Muttaqi, K.M. Energy management of community microgrids considering degradation cost of battery. J. Energy Storage 2019, 22, 257–269. [Google Scholar] [CrossRef]
  19. Khodabakhsh, R.; Sirouspour, S. Optimal control of energy storage in a microgrid by minimizing conditional value-at-risk. IEEE Trans. Sustain. Energy 2016, 7, 1264–1273. [Google Scholar] [CrossRef]
  20. Dallinger, D.; Krampe, D.; Wietschel, D. Vehicle-to-grid regulation reserves based on a dynamic simulation of mobility behavior. IEEE Trans. Smart Grid 2011, 2, 302–303. [Google Scholar] [CrossRef]
  21. Vidoni, R.; Gasparetto, A.; Giovagnoni, M. A method for modeling three-dimensional flexible mechanisms based on an equivalent rigid-link system. J. Vib. Control 2014, 20, 483–500. [Google Scholar] [CrossRef]
  22. Shi, L.; Luo, Y.; Tu, G.Y. Bidding strategy of microgrid with consideration of uncertainty for participating in power market. Elect. Power Energy Syst. 2014, 59, 1–13. [Google Scholar] [CrossRef]
  23. Molzahn, D.K.; Dörfler, F.; Sandberg, H. A survey of distributed optimization and control algorithms for electric power systems. IEEE Trans. Smart Grid 2017, 8, 2941–2962. [Google Scholar] [CrossRef]
  24. Chang, T.H.; Liao, W.C.; Hong, M.; Wang, X. Asynchronous distributed admm for large-scale optimizationLinear convergence analysis and numerical performance. IEEE Trans. Signal Process. 2016, 64, 3131–3144. [Google Scholar] [CrossRef]
  25. Mota, J.; Xavier, J.; Aguiar, P.; Pschel, M. A proof of convergence for the alternating direction method of multipliers applied to polyhedral constrained functions. Mathematics 2011. [Google Scholar]
  26. Boyd, S.; Parikh, N.; Chu, E. Distributed optimization and statistical learning via the alternating direction method of multipliers. Found. Trends Mach. Learn. 2011, 3, 1–122. [Google Scholar] [CrossRef]
  27. Real, A.J.D.; Arce, A.; Bordons, C. Combined environmental and economic dispatch of smart grids using distributed model predictive control. Int. J. Electr. Power Energy Syst. 2014, 54, 65–76. [Google Scholar] [CrossRef]
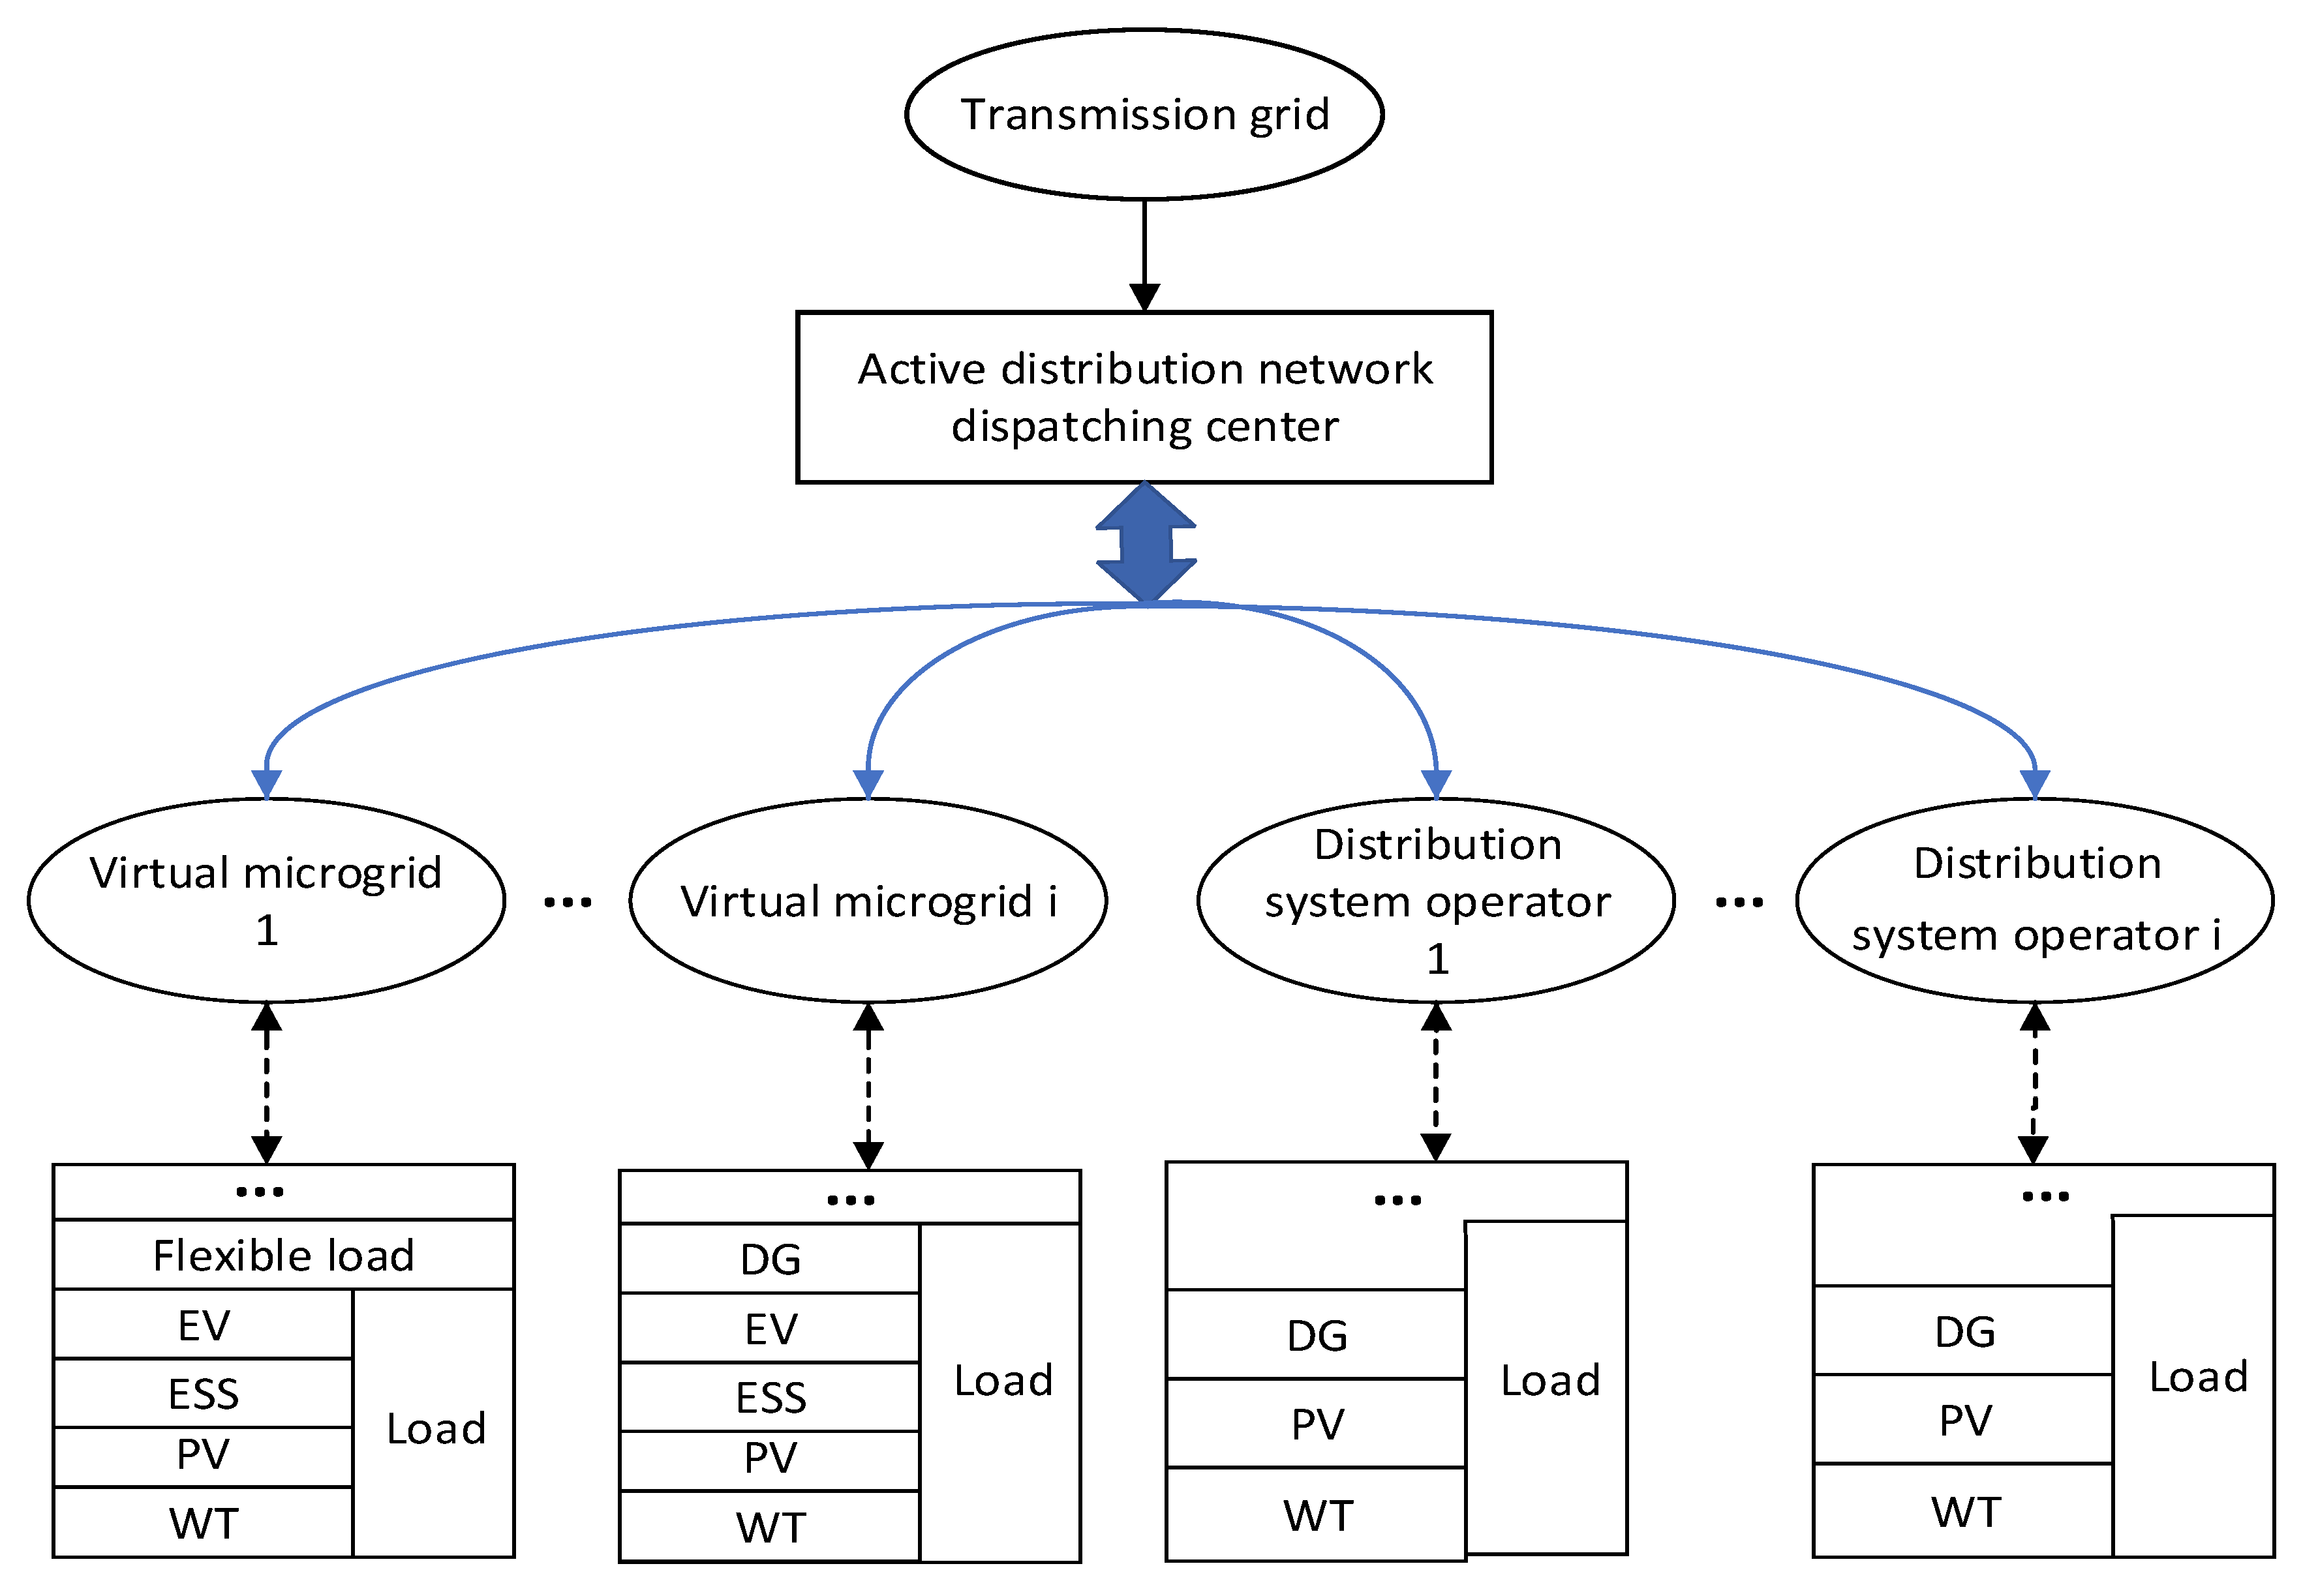
Figure 1. Schematic diagram of active distribution system framework considering the benefits of multi-stakeholder.
Processes 08 00987 g001
Figure 2. Flow chart of model solving.
Processes 08 00987 g002
Figure 3. Adjusted active distribution network structure.
Processes 08 00987 g003
Figure 4. Optimal dispatch of VMG1.
Processes 08 00987 g004
Figure 5. Optimal dispatch of VMG2.
Processes 08 00987 g005
Figure 6. Optimal dispatch of DSO1.
Processes 08 00987 g006
Figure 7. Optimal dispatch of DSO2.
Processes 08 00987 g007
Figure 8. Result of two optimization methods of VMG1.
Processes 08 00987 g008
Figure 9. Result of two optimization methods of VMG2.
Processes 08 00987 g009
Figure 10. Result of two optimization methods of DSO1.
Processes 08 00987 g010
Figure 11. Result of two optimization methods of DSO2.
Processes 08 00987 g011
Figure 12. Results of optimal target and operation index of VMG, DSO in two optimal methods.
Processes 08 00987 g012
Figure 13. Convergence of ADMM.
Processes 08 00987 g013
Table 1. Time-sharing electrovalence.
PeriodPrice/(kW·h)
Purchase ElectricitySale of Electricity
Peak time18:00–21:000.830.65
Usual time7:00–18:00
22:00–0:00
0.490.38
Valley time0:00–7:000.170.13
Table 2. Penalty for pollutant emission.
Type of Pollutant S O 2 N O x C O 2 C O Dust
Levy fee/USD· K g 1 11.950.009750.160.125
Table 3. Sources integration of VMG and DSO.
StakeholderMTWTPVESSEVSFD
VMG1
VMG2×
DSO1××
DSO2×××
Table 4. Maximum benefits when each stakeholder is independently optimized.
StakeholderProfit(Ten Thousand USD)
VMG10.9830
VMG21.2211
DSO11.1054
DSO21.0494
Table 5. Maximum benefit of different stakeholders in different dispatching models.
RegionProfit (Ten Thousand USD)Acceptance
VMG10.93540.952
VMG21.12700.931
DSO10.99740.903
DSO20.94520.901