Article

The Liquid–Liquid Dispersion Homogeneity in a Vessel Agitated by a High-Shear Sawtooth Impeller

Department of Process Engineering, Faculty of Mechanical Engineering, Czech Technical University in Prague, Technická 4, 16000 Prague, Czech Republic
*
Author to whom correspondence should be addressed.
Processes 2020, 8(9), 1012; https://doi.org/10.3390/pr8091012
Submission received: 10 July 2020 / Revised: 10 August 2020 / Accepted: 17 August 2020 / Published: 19 August 2020
(This article belongs to the Special Issue Advances in the Chemical Mixing Process)

Abstract

:
The agitation of immiscible liquids or solid suspensions is a frequent operation in chemical and metallurgical industries. The product quality yield and economy of the processes are significantly affected by mixing conditions. Prediction of mean drop size distribution (DSD) during agitation is fundamental for processes in many branches of industry where the mass transfer is crucial. This contribution aims to analyze the homogeneity of a dispersed system in a vessel agitated by a high-shear sawtooth impeller. The homogeneity of liquid–liquid dispersion is determined by comparison of Sauter mean diameters and drop size distribution (DSD) from different measured regions and for various dispersion times. The experiments were carried out in a baffled vessel for various impeller speeds. The sizes of droplets were obtained by the in-situ measurement technique and by the image analysis (IA) method.

1. Introduction

The dispersion of immiscible liquid–liquid systems is one of the complex processes in the mixing field which is widely used in many branches of industry (e.g., chemical, food, metallurgical). This process aims to reach the dispersion and equal distribution of small droplets of a dispersed phase in the continuous phase for an increase of interfacial surface which leads to mass transfer intensification. The review on correlations evaluating mass transfer coefficients in liquid–liquid was presented by Ghotli et al. [1].
A wide variety of experimental techniques have been utilized to monitor evolving drop size distribution (DSD) in agitated vessels. Techniques may be classified into two main classes [2]. The first group is based on sampling procedure and ex-situ measurement is performed on the emulsion before it coalesces or when the emulsion is stabilized. The second group comprises a line optical observation (invasive or non-invasive) which avoids sampling and dilution and allows direct measurement at the operating conditions. The high-speed imaging was used for the determination of breakage rates using single drop experiments in a single drop breakage cell [3] or a vessel agitated by a Rushton turbine [4]. Ghotli et al. [5] used the microscopic method combined with image analysis for the drop size determination for radial disc impellers with variously curved blades and axial impellers. Tang et al. [6] adopted the method of a built-in endoscopic probe combined with a pulsed laser to measure the droplet size in liquid–liquid dispersions in a mixer–settler apparatus. More than 1000 droplets were counted in each experiment run to obtain DSD distribution. They found that the DSD exhibits log-normal distribution approximately. The determination of drop sizes in mixtures with high dispersed phase fractions requires an endoscope measurement technique [7]. The radial and axial profiles of the light immiscible liquid volumetric fraction can be obtained by the Electrical Resistance Tomography technique [8] or by the Electrical Impedance Tomography technique [9].
The size of drops generally depends on the mixing equipment and mixing conditions used. The dispersed systems are usually characterized by Sauter mean diameter and drop size distribution. Based on Hinze–Kolmogorov theory [10,11], the equilibrium Sauter mean diameter, d32, is correlated with Weber number with the exponent of –0.6. Rodgers and Cooke [12] proposed the shear tip speed as a correlating parameter for d32 diameter dependence on mixing intensity.
The dispersion of the immiscible liquid–liquid (l–l) system in a mechanically agitated vessel has been investigated by many authors for various non-coalescing [13,14,15,16,17,18,19] and coalescing [7,20] systems, impeller types, and vessel configurations. However, the parameters characterizing DSD are usually determined in equilibrium state only and the effect of the position of droplets’ measurement is not taken into account. Sprow [21] investigated the DSD of strongly coalescing agitated l–l systems and reported that the point of sample removal affected evaluated drop sizes. The emulsification has been affected by the point of oil injection to the vessel [22].
We tested the liquid–liquid dispersion homogeneity in a vessel agitated by a high-shear sawtooth impeller at 600 rpm impeller speed in our previous work [23]. Three regions of interest placed in the different off-bottom distance were chosen, where the droplet sizes were measured. The Sauter mean diameter kinetics and DSD evolution were evaluated for homogeneity analysis. We found that the results varied considerably in investigated regions. We similarly tested the homogeneity in a dispersion agitated by a Rushton turbine at 200 rpm impeller [24]. Unlike the sawtooth impeller, the evaluated drop sizes characterized by Sauter mean diameter and DSD were practically the same in regions placed below and above the impeller with similar distance from the impeller. However, the droplets observed in the third region placed at the top of the vessel were different from the comparison of regions located near the turbine.
We, therefore, analyzed dispersion homogeneity formed by a high-shear sawtooth impeller in more detail. The results for two impeller speeds, 700 and 800 rpm, are presented here. The time evolution of Sauter mean diameter, d32, and DSD was investigated in three different regions. The Sauter mean kinetics was modeled using the model proposed by Hong and Lee [16]. Using this model, the equilibrium Sauter mean diameter, d32eq, was estimated. Finally, the dependence of the evaluated equilibrium Sauter mean diameter on the impeller Weber number was compared with the correlation proposed by El-Hamouz et al. [22], based on Hinze–Kolmogorov theory.

2. Materials and Methods

Details about the experimental apparatus are given in our previous papers [23,24,25]. In brief, the experiments were carried out in a cylindrical baffled vessel with a flat bottom. The immiscible liquid–liquid system (distilled water—WACKER AP200 silicone oil) was agitated by a high-shear sawtooth impeller (CVS 69 1038.1 type) with diameter of 100 mm and 18 blades. The blade height was 10 mm. The impeller clearance distance from the bottom of the vessel was 75 mm. The liquid level is equal to inner vessel diameter T = H = 300 mm. The scheme of the experimental apparatus is shown in Figure 1.
The drop sizes were measured using the non-intrusive in-situ optical method. The method is based on an analysis of images obtained by a digital camera in a plane illuminated by a light. The sizes were evaluated from captured images via image analysis (IA) by the modified procedure described in previous work [23,24]. The experimental procedure was carried out in the following steps: (i) calibration and experimental apparatus setting, (ii) image recording during emulsification, and (iii) image analysis. The image resolution was determined using a calibration grid with a 1 × 1 mm grid (Figure 2a). Using multiple readings, the resolution deviation was less than 0.01%. For the calibration of the IA procedure, the calibration spheres Nylon 6/6 balls with precise diameter, ds, of 1.19 mm were used (Figure 2b).
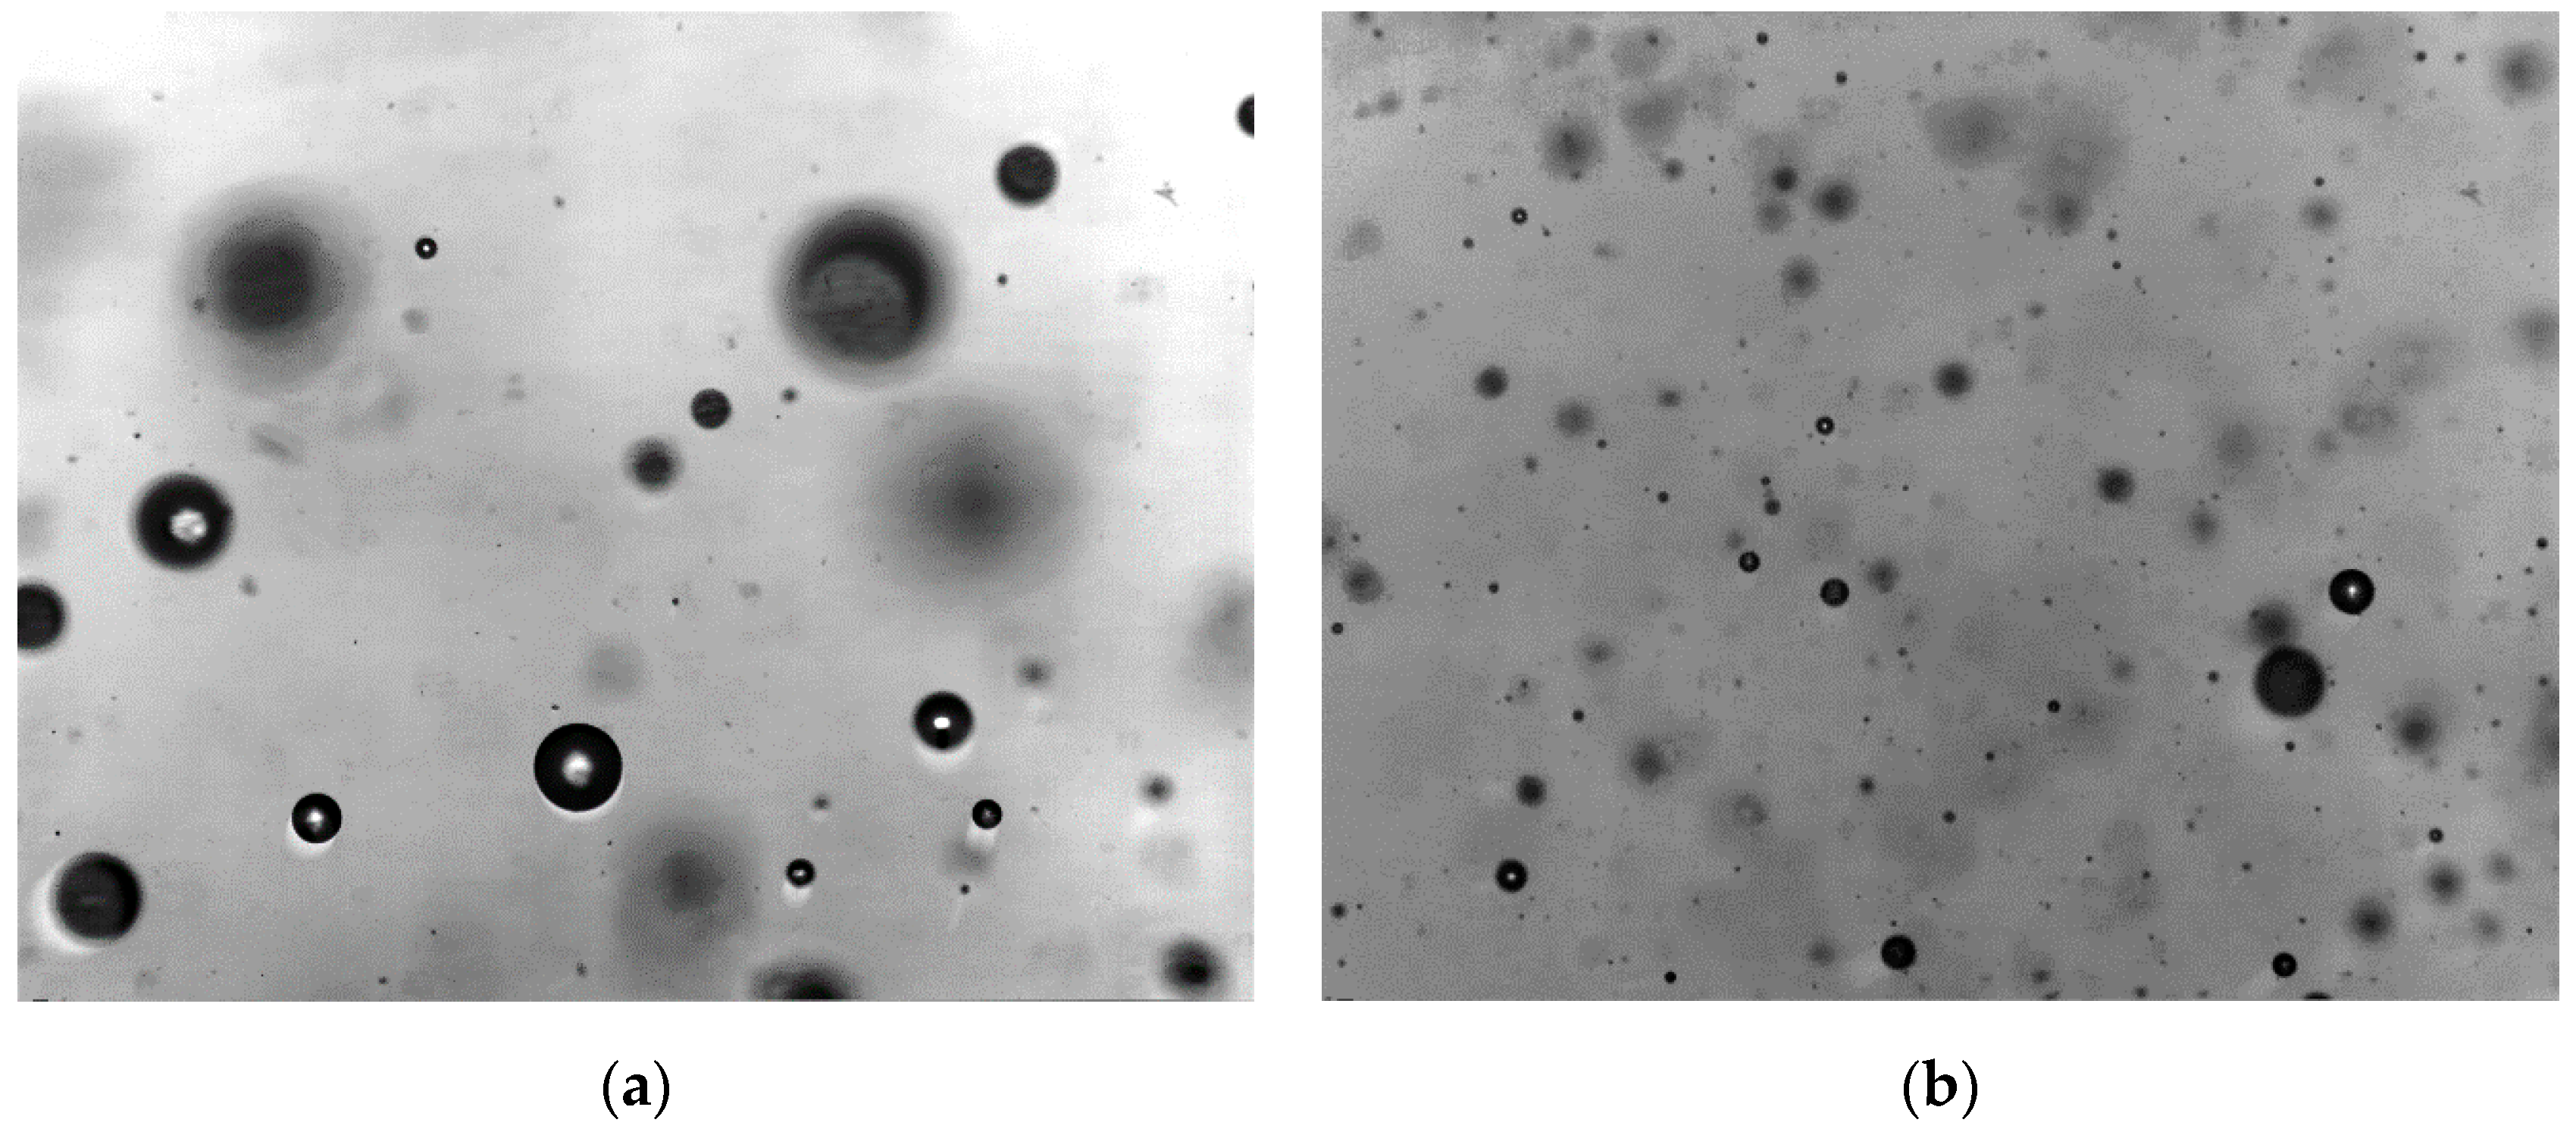
For illustration, the raw images captured at recording time of 5 min at the impeller speeds of 700 and 800 rpm in Region A are shown in Figure 3a,b, respectively. The drop size was evaluated using a pixel shade gradient method based on the determination of the shade gradient between the edge of drops and the background. This approach guarantees the evaluation of drops passing through the plane corresponding to the focus depth used only. The droplets captured outside the focal depth can be responsible for incorrect DSD determination. Using this method, the droplets outside the focus depth used are eliminated. Two parameters are set: (i) threshold value between edge and background, and (ii) the circularity. The changing translucence between the light source and the camera affects background pixel shade during the dispersion process (see Figure 3a,b). Therefore, the threshold was changed during analysis to respect this effect. The second parameter, circularity, enables to identify circular drops only. The captured objects with a value of circularity less than 0.95 were excluded. In this way, the defocused drops can also be eliminated. Finally, the area of an identified drop is evaluated.
The high-speed camera SpeedSence MK III (Dantec Dynamics, Denmark) with Laowa 60 mm f 28-objective Ultra-Macro 2:1, was used for capturing of images. The frame rate of the camera was 30 frames per second (fps) and camera-resolution was 1280 × 1024 pixels. The combination of this camera and the objective do not influence image distortion. The distortion caused by the cylindrical vessel wall was eliminated by the optical box filled by distilled water. The focus depth, δ, of this camera-objective configuration was 1.238 mm. It enables to measure most of the formed drops. The effect of focus depth on evaluated size was empirically tested measuring the size of the spherical particle of 1 mm in diameter in the nearest and the farthest distance, given by focus depth used. The difference between sizes of particles placed in the nearest and the farthest distance was found to be less than 0.03%, so it was neglected during the IA procedure.
The average temperature of the immiscible liquid–liquid system was 23.5 °C during the experiment. Using a Light-emitting diode (LED) light source, the temperature increased by 2 °C only. The effect of temperature on the physical properties was negligible. The physical properties of both phases are given in Table 1. The opaqueness of the immiscible liquid–liquid system limits a maximum dispersed-phase fraction when the non-intrusive in-situ optical method is applied for process monitoring.
The degree of parity between evaluated Sauter mean diameters and size distributions in different areas was used as a criterion of homogeneity. The regions were placed eccentrically from the vessel axis (e = 55 mm) at different distances (a = 50 mm, c = 70 mm) from the bottom of the vessel. The distance from the vessel wall was p = 25 mm. The locations of the investigated areas are shown in Figure 1. The sizes of the investigated areas are presented in Table 2.
The time needed to obtain equilibrium state was estimated using the empirical relationship proposed by Hong and Lee [16,26] for volume fraction 0.05 < φd < 0.2 in the following form:
N t e q = 1995.3   ( D T ) 2.37 ( W e R e ) 0.97 ( µ d µ c ) F r 0.66 ,
where We is impeller Weber number (We = ρcN2D3/σ), Re is impeller Reynolds number (Re = ρcND2c), and Fr is Froude number for a drop of diameter, d (Fr = N2d/g). We found that this correlation can also be applied for lower volume fractions. Based on our previous knowledge, the equilibrium time, teq, of 48 min was calculated for the 600 rpm impeller speed and estimated drop diameter of 100 µm. Thus, the total measuring time was set to 50 min for each investigated area and impeller speed.
The first image set (1 set contains 1000 images) was taken 5 min after the oil was added. Then, the sets were repeatedly captured after 5 min with a shutter speed of 3 μs. When the time of 50 min was reached, the impeller speed was increased and the next image sets were captured with the same intervals. Finally, the capturing sequence of sets in each region was the following: 1 to 10 sets for 600 rpm impeller speed (Re = 106,134), 11 to 20 sets for 700 rpm impeller speed (Re = 123,823), and 21 to 30 sets for 800 rpm impeller speed (Re = 141,512). For comparison, the results for 600 rpm impeller speed are also presented. The image resolution for each investigated area and the total number of drops evaluated in all captured sets are presented in Table 2. The applied range of the impeller speed was limited by the oil sedimentation and by the mixture aeration and mechanical stiffness of the experimental apparatus.

3. Results and Discussion

3.1. Number of Evaluated Drops, NoED

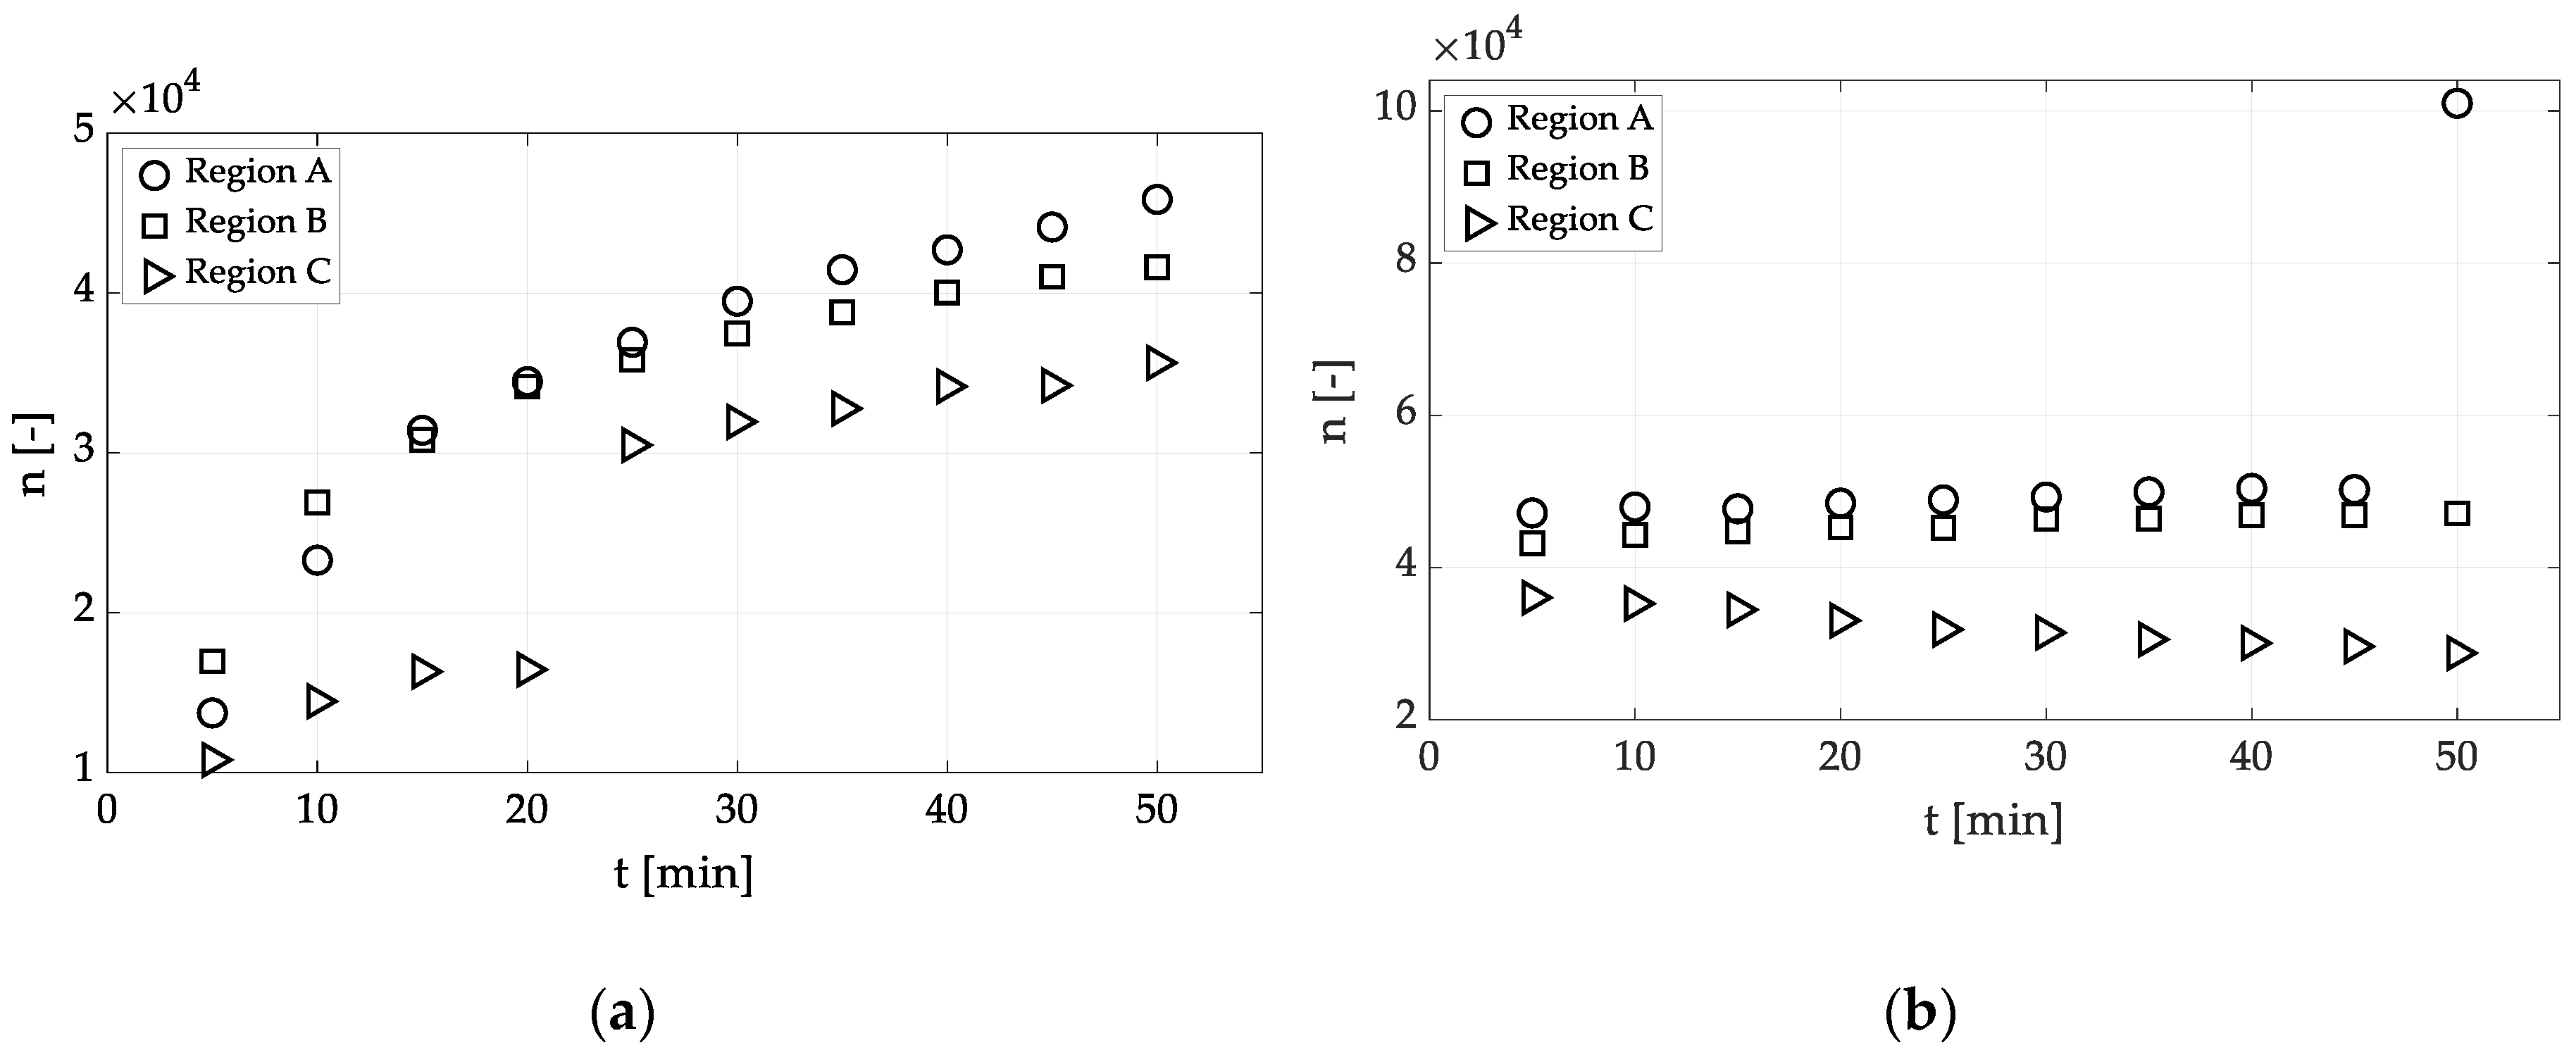
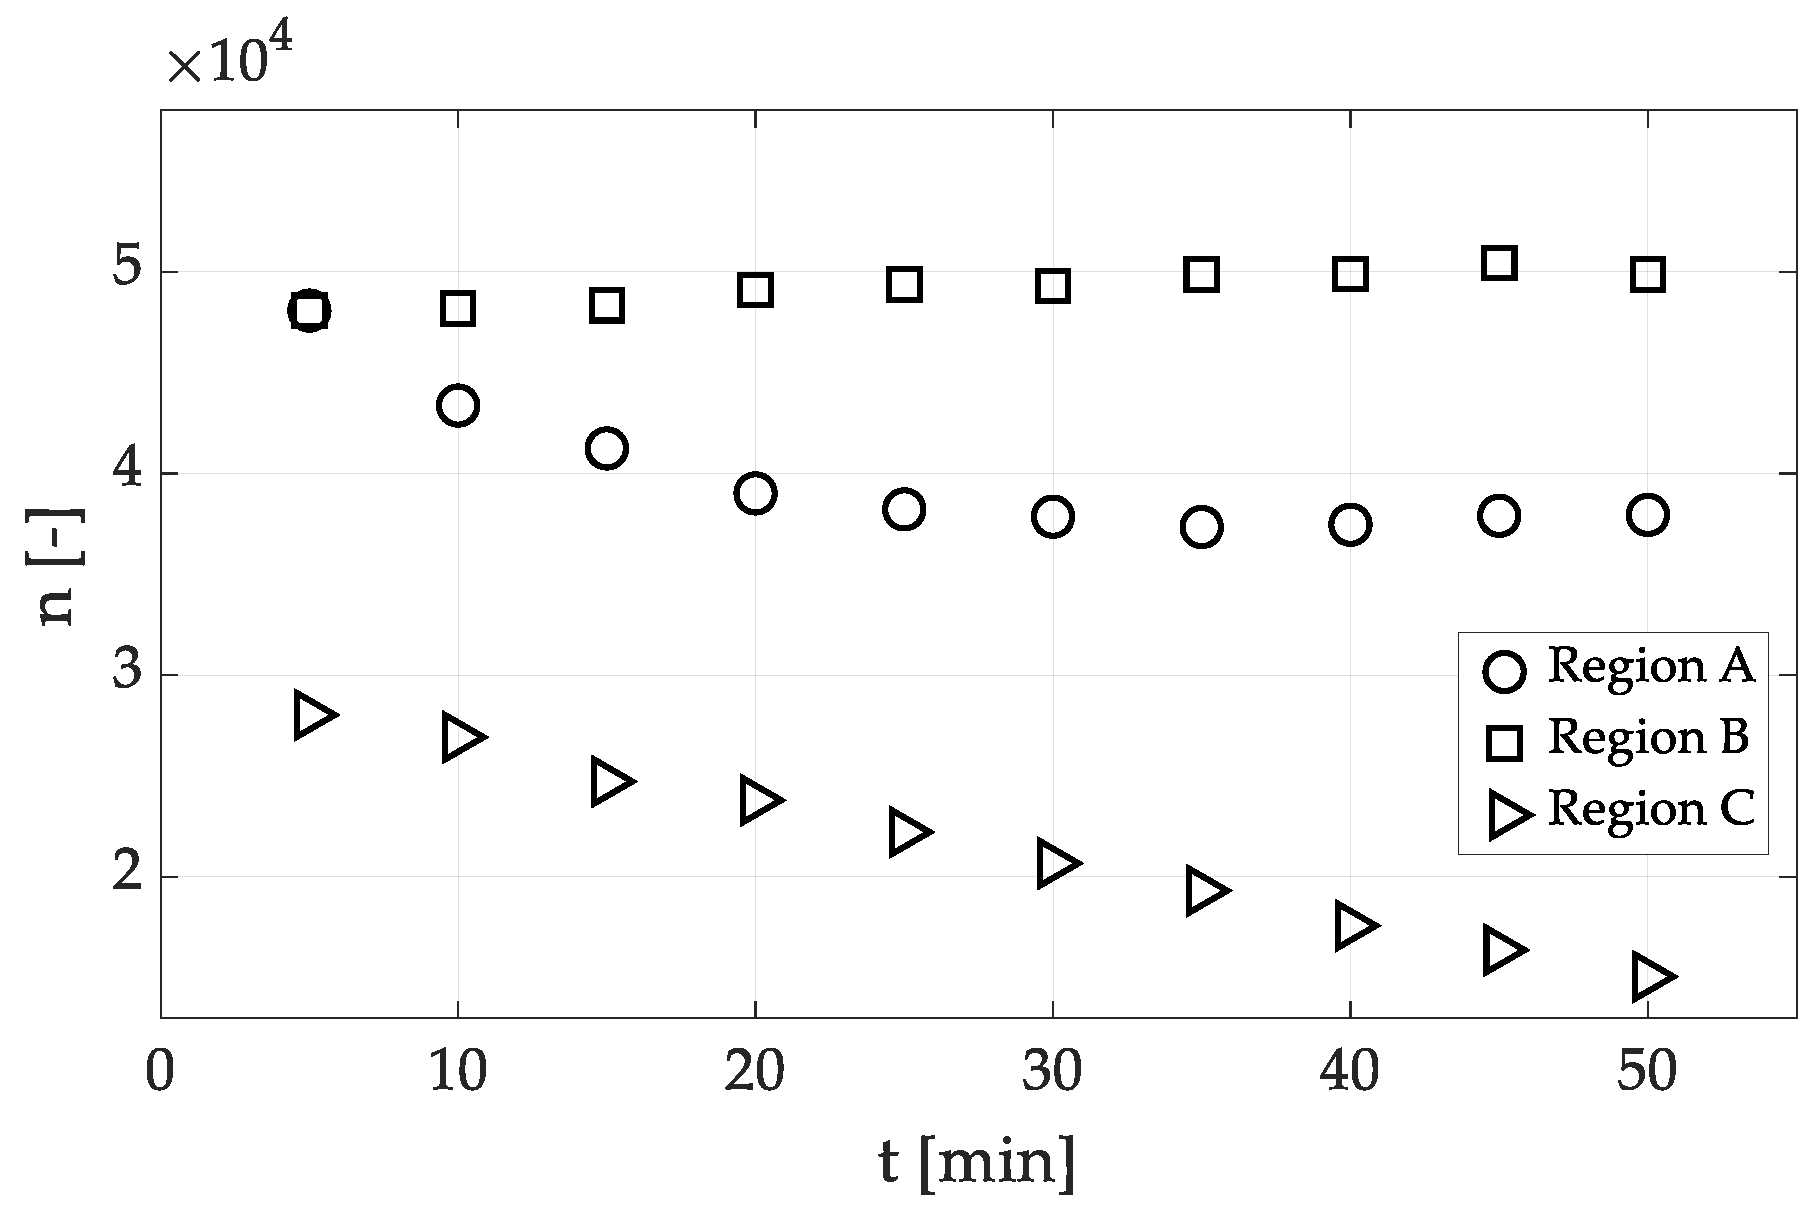
The minimum number of drops that are necessary to evaluate to obtain relevant results must be reached [27]. The total number of evaluated drops (Table 2) represents the sum of evaluated drops in each region for three impeller speeds and all time-steps, i.e., it represents the sum of evaluated drops from 30,000 captured images. As was expected, the total number of evaluated drops was reached practically the same in regions A and B, which were placed at the same distance below and above the impeller. The number of captured drops was practically stable and greater than 35,000 for each image set, which is more than the minimum number of drops needed to obtain relevant results [27]. Unlike this, the total number of evaluated drops in the region C was significantly lower, approximately 61% of the number reached in both regions A and B, and decreased with increasing dispersion time, probably due to different hydrodynamic conditions. The time evolution of the number of captured drops is shown in Figure 4 for 600 and 700 rpm impeller speeds respectively, and in Figure 5 for 800 rpm impeller speed. For 700 rpm impeller speed and recording time of 50 min, the drop identification was found to be approximately twice more successful compared with other sets, probably randomly. All factors responsible for this jump were identified.

3.2. Sauter Mean Diameter, d32

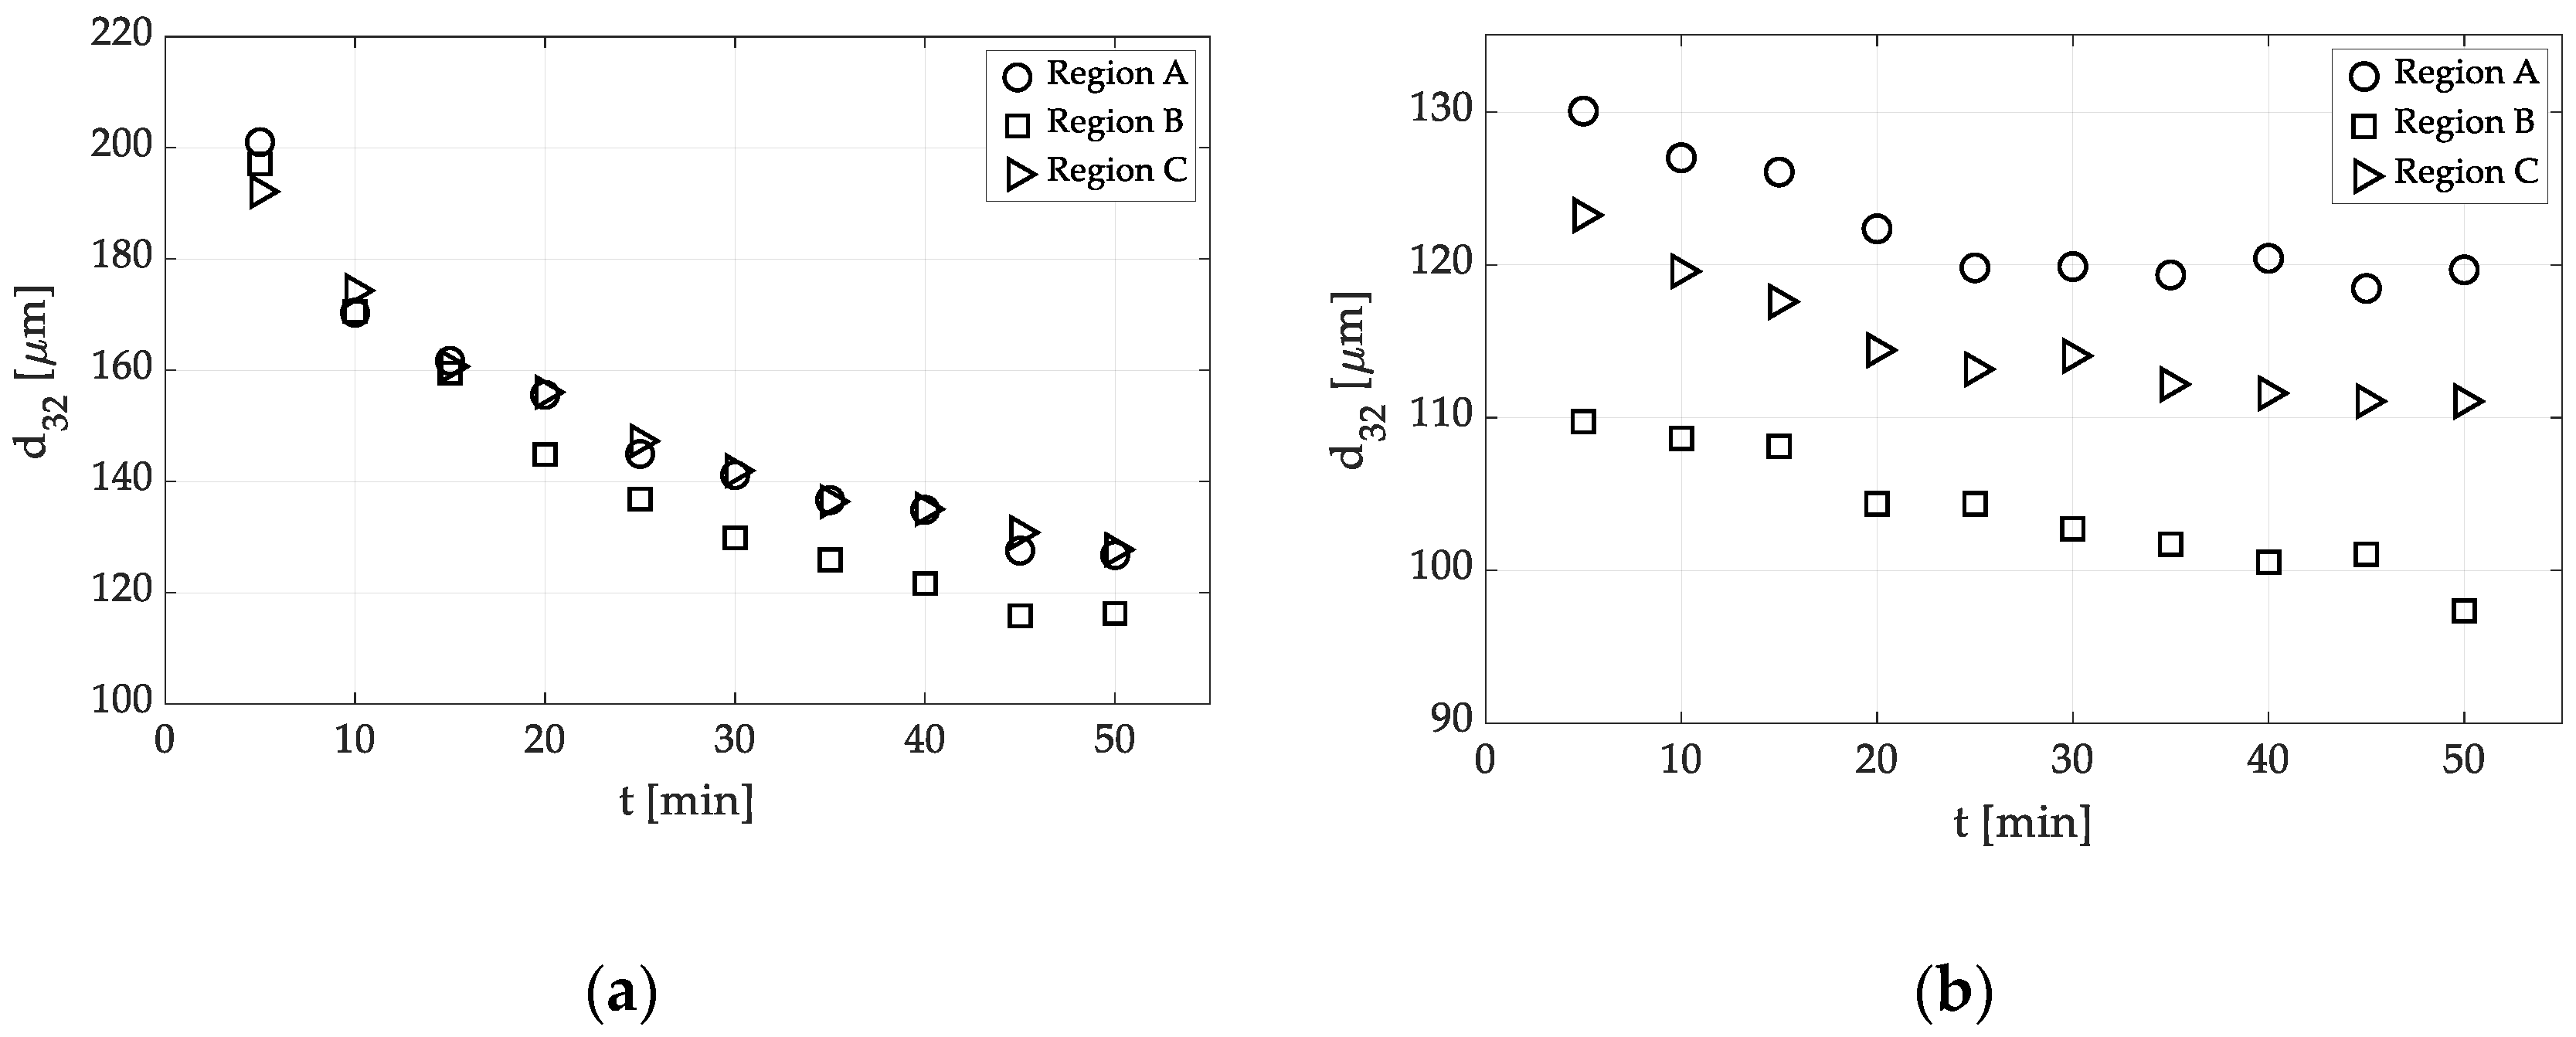
The time evolution of Sauter mean diameter, d32, evaluated from measured drop sizes is shown in Figure 6 for 600 and 700 rpm impeller speeds respectively, and in Figure 7 for 800 rpm impeller speed. The differences between the time courses of d32 in each region of interest are significant. The highest values of d32 were observed in the region A for each impeller speed and the smallest values of d32 were observed in the region B. It was surprising since both regions A and B are placed at the same distance below and above the impeller. Moreover, the differences between values of d32 in both regions increased over time. The differences of approximately 10 µm and more than 20 µm were observed at the time of 50 min for 600 rpm and 800 rpm impeller speeds, respectively. Unlike this, the d32 values obtained in region C were found to be comparable with d32 values obtained in region A. These discrepancies were probably caused due to different hydrodynamic conditions in the investigated areas. The equilibrium Sauter mean diameters, d32eq, were determined using Hong and Lee’s [16] kinetics model:
d 32 d 32 e q = 1 + α e β t * ,
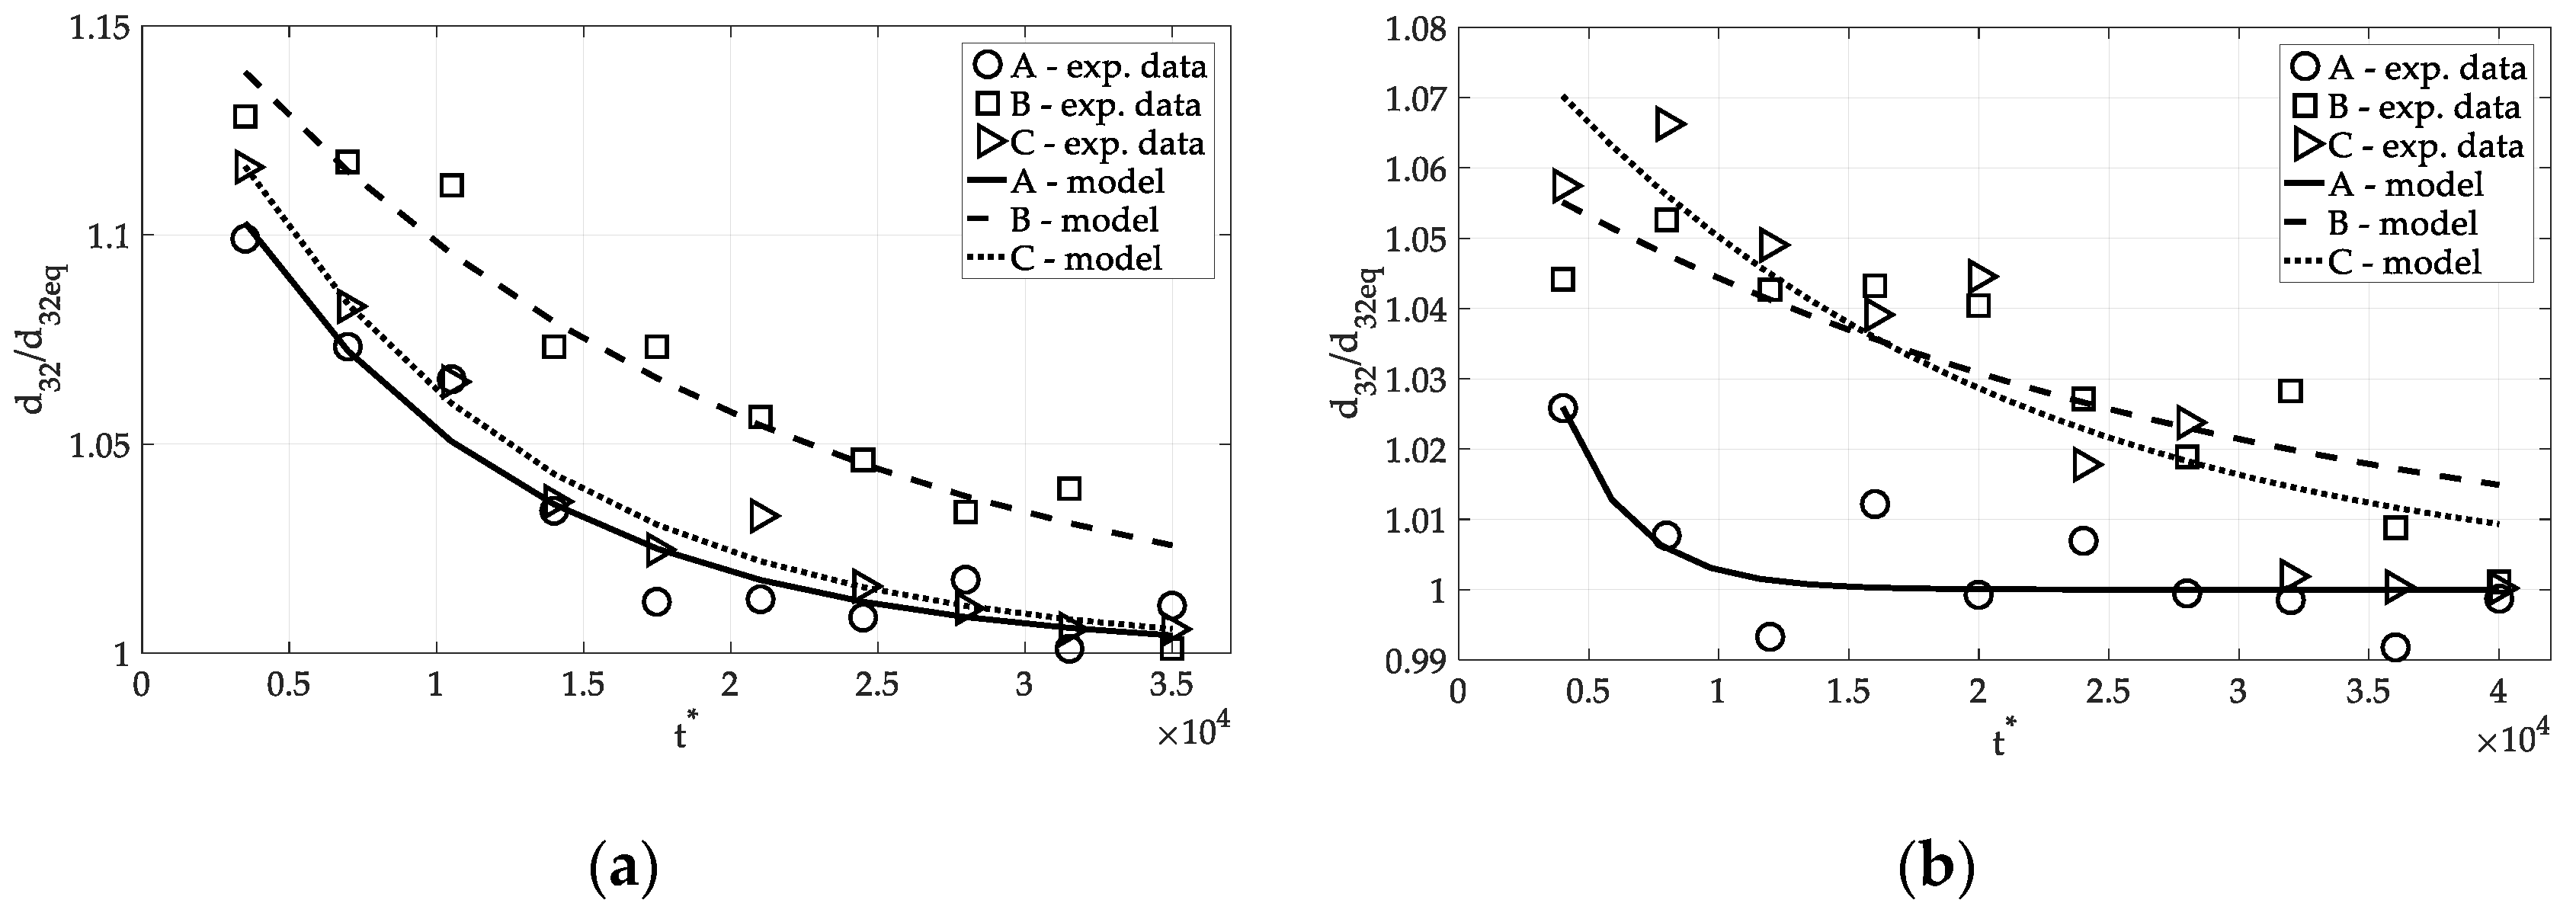
where d32 is Sauter mean diameter at dispersion time t for given impeller speed, d32eq is equilibrium Sauter mean diameter, t* = n.t is the dimensionless dispersion time, and α and β are model parameters. The evaluated model parameters are listed in Table 3 for each region and impeller speed. The comparison of experimental data and kinetics model in each investigated region is shown in Figure 8 for 700 and 800 rpm impeller speeds, respectively.
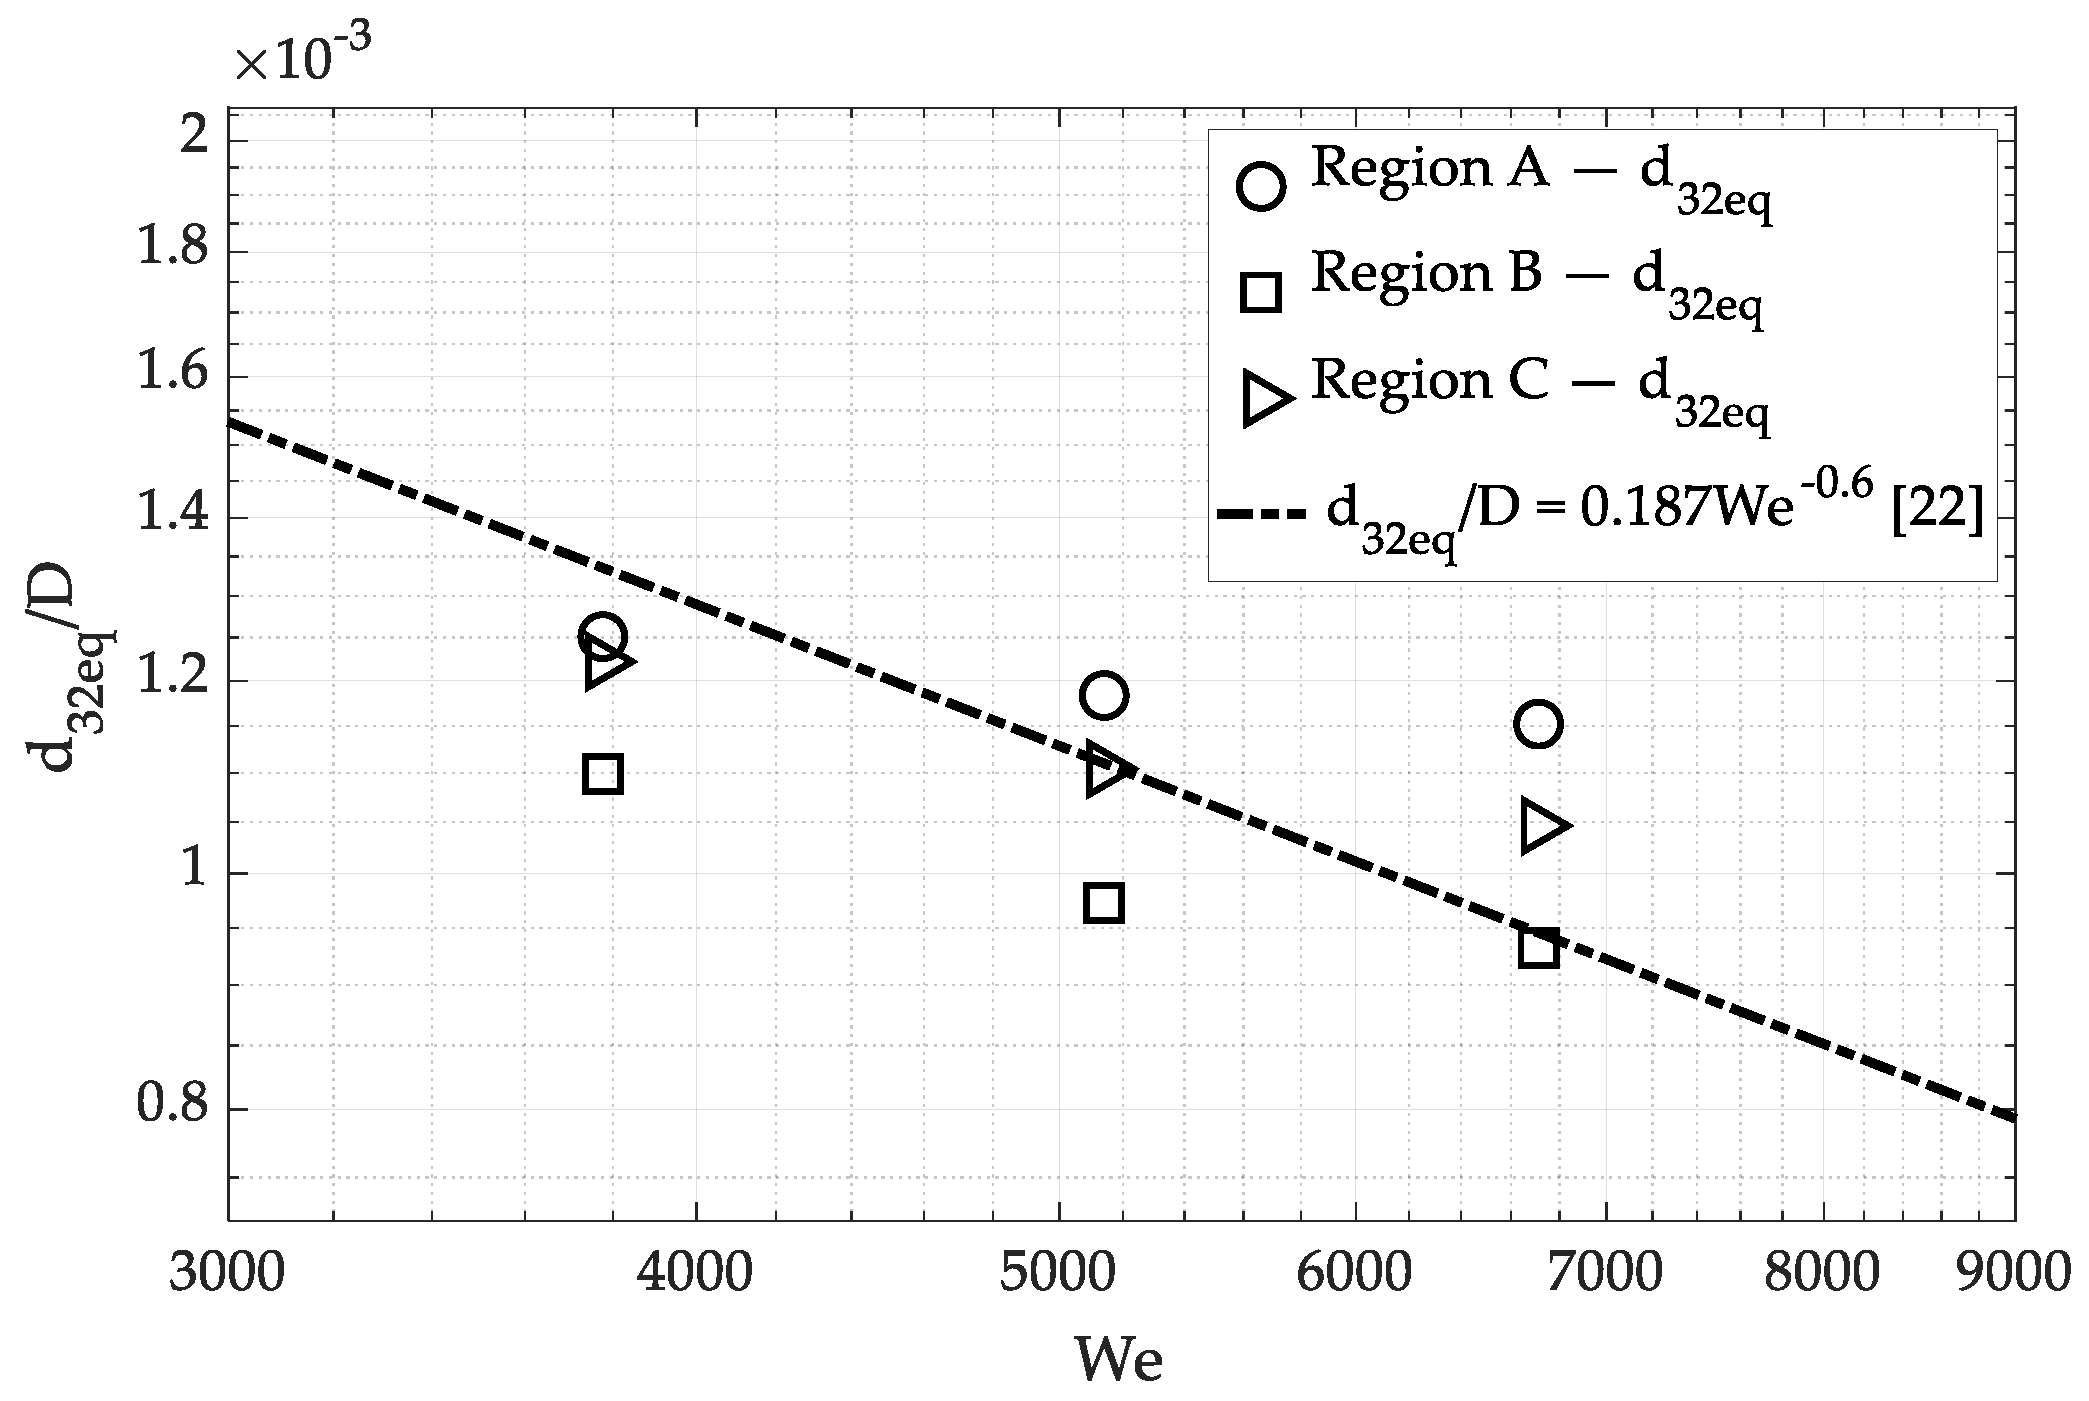
For equilibrium Sauter mean diameters, d32eq, similar trends were found as in the previous case. The smallest d32eq values were determined in region B for all impeller speeds. Compared with this region, the d32eq values in regions A and C were found to be approximately 1.23 and 1.14 times higher, respectively. Based on the Hinze–Kolmogorov theory, the following relation between the ratio of equilibrium Sauter mean diameter, d32eq, the impeller diameter, D, and impeller Weber number, We, can be derived for drop-breaking occurring in the inertial subrange:
d 32 e q D = C 1 W e 0.6 ,
where We is impeller Weber number (We = ρcN2D3/σ) and C1 is the proportionality constant.
El-Hamouz et al. [22] investigated the emulsification of silicone oil (1% silicone oil in water) in batch ESCO EL6 mixer of the working volume of 6 L. The vessel wall was scraped by an anchor blade, and two impellers, down-pumping pitched blade turbine, and high-shear sawtooth impeller were tested. The sampling point was located near the impeller. They reported the value of constant proportionality C1 = 0.187 for the sawtooth impeller. Although the vessel geometries used by El-Hamouz et al. [22] and in this work are different, we compared determined d32eq values with this correlation. The comparison of determined d32eq values and the correlation reported by El-Hamouz et al. [22] is shown in Figure 9. Surprisingly, despite the different vessel geometry, the results are comparable.
The effect of the position of an investigated area can also be demonstrated by calculating the constant of proportionality, C1, in Equation (3) for each region separately. The following values of C1 were obtained: 0.195, 0.164, and 0.184, for regions A, B, and C, respectively.

3.3. DSD Time Evolution

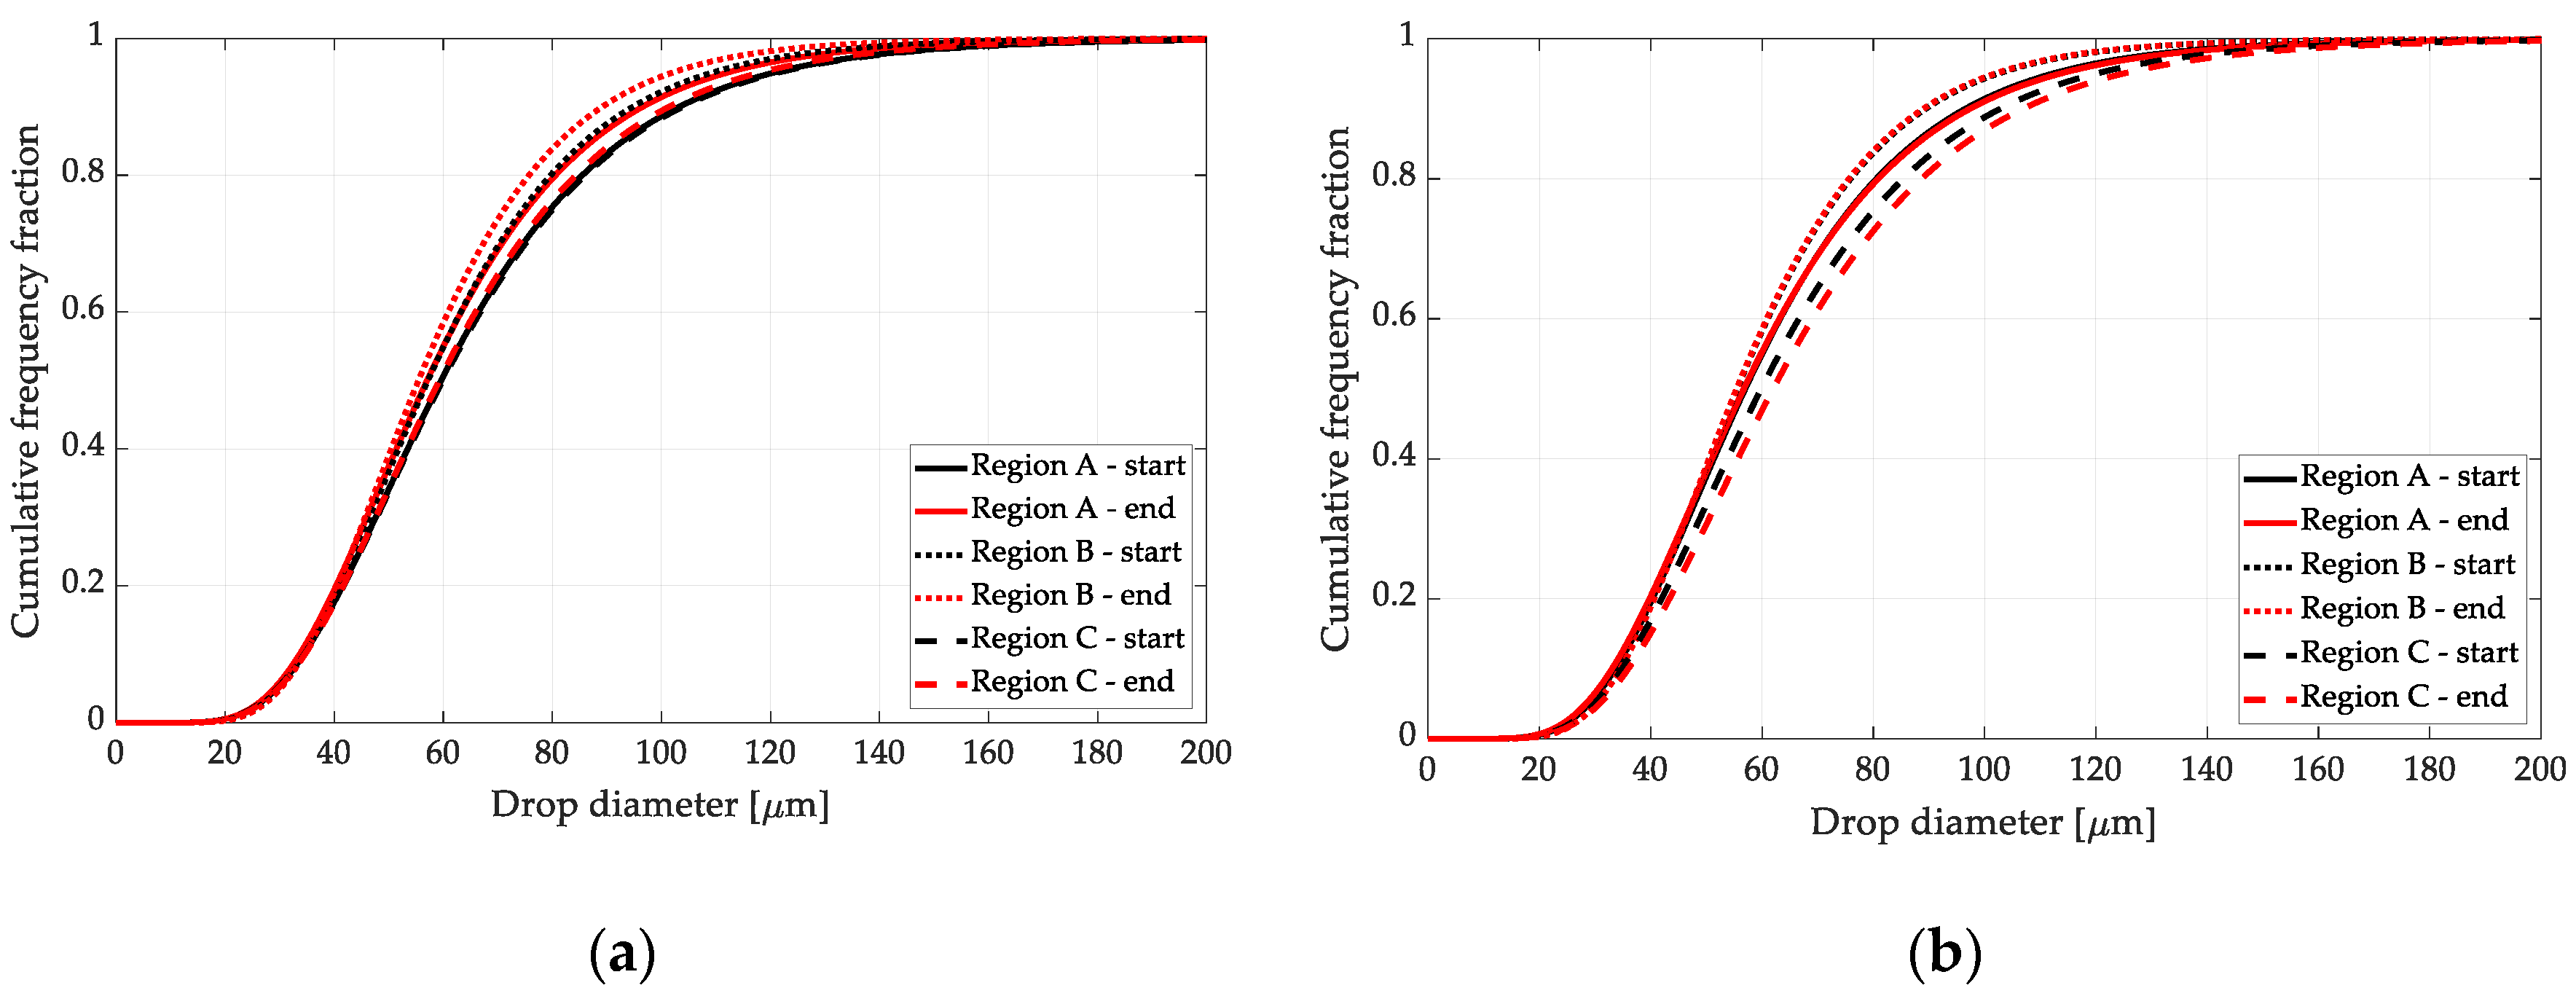
As the second criterion for dispersion homogeneity assessment, the time evolution of DSD described by Log-normal cumulative distribution function was used. The cumulative DSDs were rendered as a function of the logarithm of the drop diameter. The DSD curves are shown in Figure 10 for 700 and 800 rpm impeller speeds, respectively. For better visualization, the distribution curves are presented only at the beginning (t = 5 min) and end measuring periods (t = 50 min) for given impeller speed.
For the impeller speed of 700 rpm, the DSD curves are practically the same in the regions A and C. Unlike this, the observed initial DSD in region C is shifted towards smaller drops. The progress in DSD evolution in region C is considerably lower compared with region A. The biggest number of small drops was evaluated at the end of the measuring period in region B.
For the impeller speed of 800 rpm, the progress in DSD evolution in region A is practically negligible. The shift towards smaller drops is noticeable only in region B. On the contrary, the DSD evaluated in region C at the end of the measuring period predicted higher drops compared with the initial state. These ambiguous results are probably due to different hydrodynamic conditions in investigated areas.

3.4. Flow Field

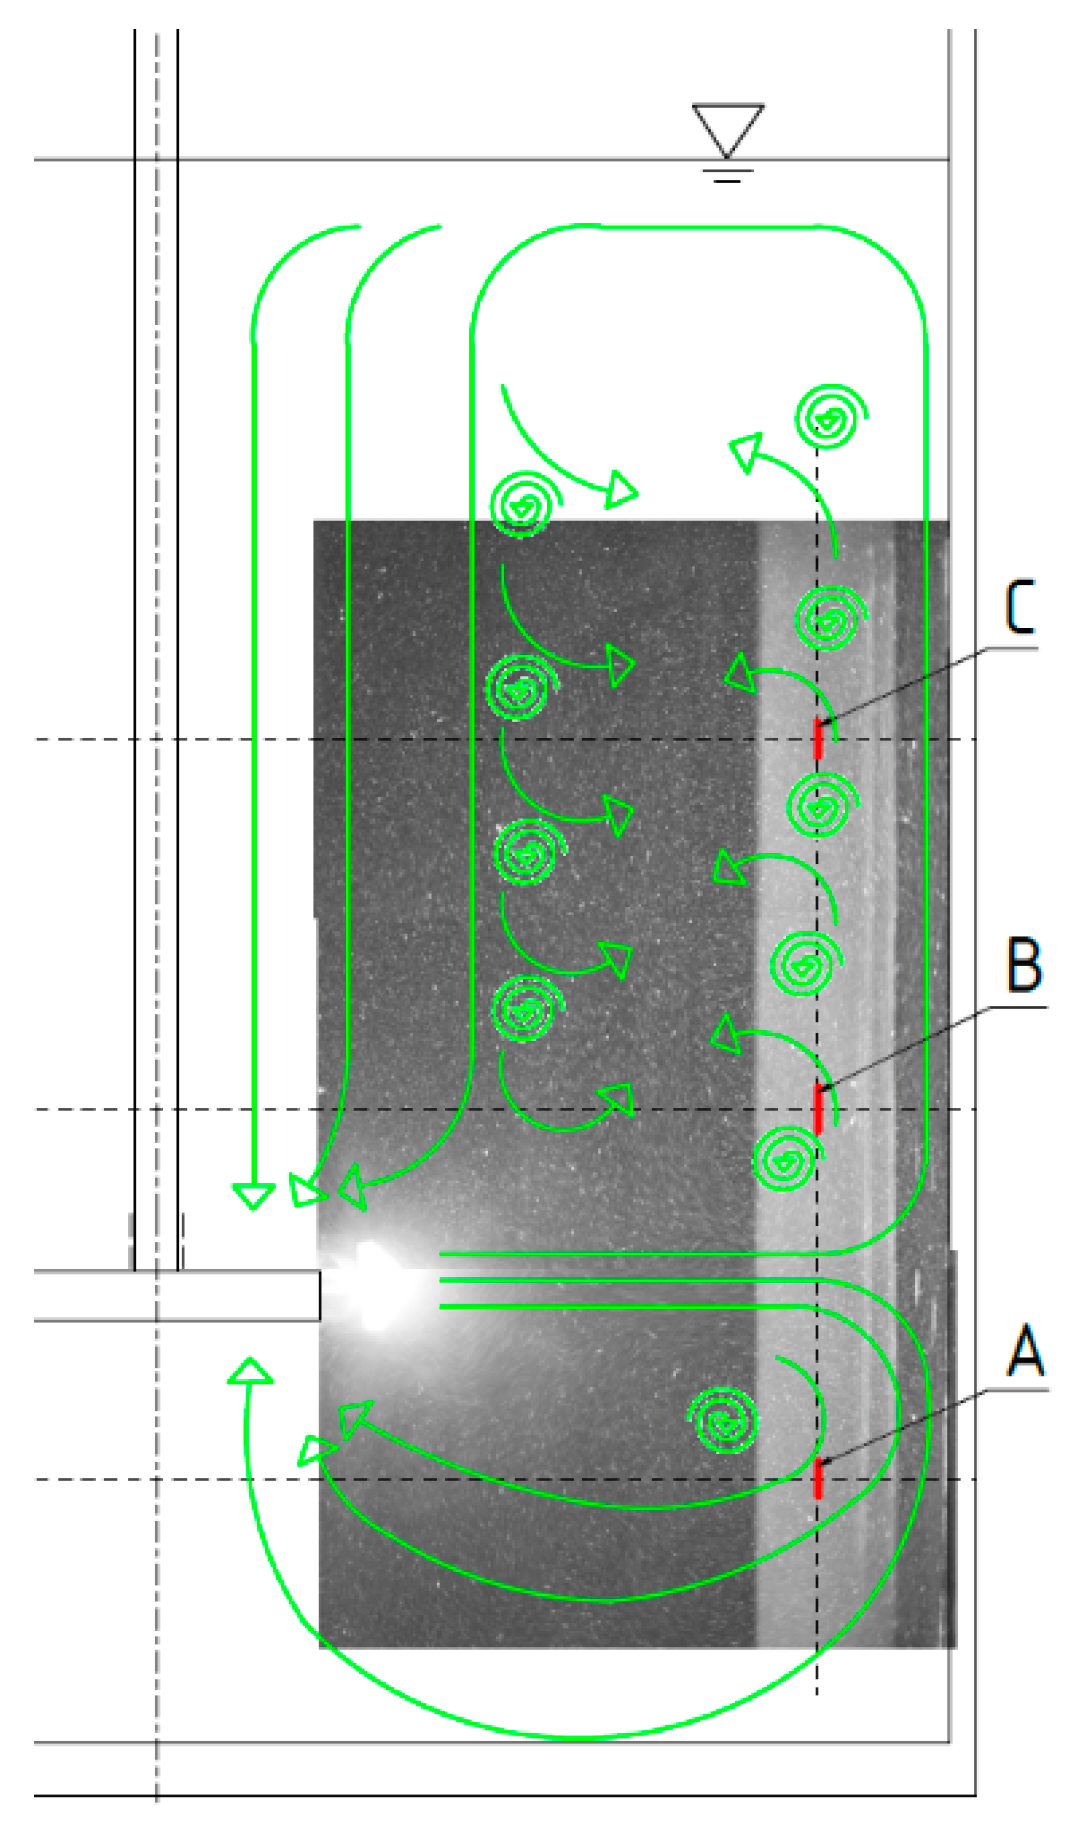
Based on the different results obtained, the flow through the investigated areas was also investigated. The flow field was visualized using FPP-RHB-10 phosphorescent particles (Dantec Dynamics, Denmark) and a lightknife. The light knife was composed using the following components: (i) SCHOTT KL 1500 LCD fiber optic illuminator as a light source, (ii) SCHOTT optic cable, and (iii) SCHOTT AG 12” Lightline-forming light line. Then, sequences of images with a frame rate of 100 fps were recorded by the Phantom VEO-E 310L camera (Dantec Dynamics, Denmark) equipped with a SIGMA 18–35 mm 1.8F DC HSM objective. Flow field measurement was performed for an impeller speed of 700 rpm. Using the captured images, the 4× slow-motion video was created, enabling to visualize flow in the vessel. The significant upper and lower stream loops were identified. The upper stream loop is about twice as long as the lower one. The longer upper current accompanied by forming macro-eddies passing through region C could explain the difference between the number of captured and evaluated drops in this region. The eddies detached from the upper stream loop leaving the impeller discharge zone passed through region B. In this way, the DSD can be affected. The schema of streamlines and investigated areas is shown in Figure 11. The differences in drop size diameters between investigated areas may be further affected by the low pumping of the high-shear sawtooth impeller. The flow visualization was found to be a useful tool for the identification of an eligible location of the investigated area. The investigated area or a sampling point should be placed out of the center of the circulation loops.

4. Conclusions

The liquid–liquid dispersion homogeneity was investigated in a baffled vessel agitated by a high-shear sawtooth impeller. The dilute immiscible mixture of distilled water and silicone oil was used as a model system.
The degree of parity between evaluated Sauter mean diameters and size distributions in different areas was used as a criterion of homogeneity. The in-situ measurement method performed by the high-speed camera accompanied by the image analysis procedure was used for the determination of droplet diameters. The dispersion homogeneity was investigated in the three regions with different off-bottom distances. The two regions were located below and above the impeller with the same distance. The experiments were carried out for two impeller speeds, 700 and 800 rpm.
The differences in Sauter mean diameter from 10 µm to more than 20 µm, approximately, were observed among investigated areas. Similar trends were found for equilibrium Sauter mean diameters, d32eq, that were estimated using the kinetics model proposed by Hong and Lee [16]. The smallest d32eq values were determined in region B for all impeller speeds. Compared with this region, the d32eq values in regions A and C were found to be approximately 1.23 and 1.14 times higher, respectively. Despite the different vessel geometry, the results plotted as a dependence of d32eq/D on the impeller Weber number are comparable with the correlation reported by El-Hamouz et al. [22].
As the second criterion for dispersion homogeneity assessment, the time evolution of DSD described by Log-normal cumulative distribution function was used. The cumulative DSD curves were found to be different in the investigated regions. These ambiguous results obtained for 800 rpm impeller speed are probably due to different hydrodynamic conditions in the investigated areas. Therefore, the total number of evaluated drops in region C was significantly lower, approximately 61% of the number reached in both regions A and B.
Consequently, the flow field was visualized using phosphorescent particles and a light knife. The various flow behavior was observed through investigated regions.
The results obtained confirm our previous finding that measured droplet sizes depend on the location of the investigated area. The investigated area or sampling point should be located concerning the flow in the agitated vessel. The flow visualization was found to be a useful tool for the identification of an eligible location of the investigated area.

Author Contributions

Conceptualization, R.F. and R.Š.; methodology, R.Š.; software, R.F.; validation, R.F.; investigation, R.F.; resources, R.F. and R.Š.; writing—original draft preparation, R.F. and R.Š.; writing—review and editing, R.F. and R.Š.; visualization, R.F.; supervision, R.Š. All authors have read and agreed to the published version of the manuscript.

Funding

This work was supported by GA CTU SGS project number SGS18/129/OHK2/2T/12 and by the Ministry of Education, Youth and Sports of the Czech Republic under OP RDE grant number CZ.02.1.01/0.0/0.0/16_019/0000753 “Research center for low-carbon energy technologies”.

Conflicts of Interest

The authors declare no conflict of interest.

Nomenclature

aThe distance of the region A from the vessel bottom (m)
bBaffle width (m)
cDistance between regions (m)
C1Constant of proportionality (-)
DImpeller diameter (m)
dDrop diameter (m)
d32Sauter mean diameter (m)
d32eqEquilibrium Sauter mean diameter (m)
dsCalibration sphere diameter (m)
eRegion distance from the vessel axis (m)
HLiquid level (m)
KImpeller clearance (m)
NImpeller speed (s-1)
nNumber of evaluated drops (-)
pRegion distance from the vessel wall (m)
tTime of measurement (s)
TVessel diameter (m)
teqThe time necessary to reach equilibrium state (s)
Greek letters
αModel parameter (-)
βModel parameter (-)
δFocus depth (m)
μcDynamic viscosity of continuous phase (Pa s)
μdDynamic viscosity of dispersed phase (Pa s)
ρcDensity of continuous phase (kg m−3)
ρdDensity of dispersed phase (kg m−3)
σInterfacial tension (N m−1)
σcSurface tension of continuous phase (N m−1)
σdSurface tension of dispersed phase (N m−1)
φcVolume fraction of continuous phase (-)
φdVolume fraction of dispersed phase (-)

References

  1. Ghotli, R.A.; Aziz, A.R.A.; Ibrahim, S. Liquid-liquid mass transfer studies in various stirred vessel designs. Rev. Chem. Eng. 2014, 31, 329–343. [Google Scholar] [CrossRef]
  2. Khalil, A.; Puel, F.; Chevalier, Y.; Galvan, J.-M.; Rivoire, A.; Klein, J.-P. Study of droplet size distribution during an emulsification process using in situ video probe coupled with an automatic image analysis. Chem. Eng. J. 2010, 165, 946–957. [Google Scholar] [CrossRef]
  3. Maaß, S.; Kraume, M. Determination of breakage rates using single drop experiments. Chem. Eng. Sci. 2012, 70, 146–164. [Google Scholar] [CrossRef]
  4. Hasan, B.O. Experimental study on the bubble breakage in a stirred tank. Part 1. Mechanism and effect of operating parameters. Int. J. Multiph. Flow 2017, 97, 94–108. [Google Scholar] [CrossRef]
  5. Ghotli, R.A.; Abbasi, M.R.; Bagheri, A.; Raman, A.A.A.; Ibrahim, S.; Bostanci, H. Experimental and modeling evaluation of droplet size in immiscible liquid-liquid stirred vessel using various impeller designs. J. Taiwan Inst. Chem. Eng. 2019, 100, 26–36. [Google Scholar] [CrossRef]
  6. Tang, Q.; Zhang, J.; Wu, Y.; Wang, Y.-D.; Liu, Z. An experimental study of immiscible liquid–liquid dispersions in a pump-mixer of mixer-settler. Chin. J. Chem. Eng. 2020, 28, 33–45. [Google Scholar] [CrossRef]
  7. Kraume, M.; Gabler, A.; Schulze, K. Influence of Physical Properties on Drop Size Distribution of Stirred Liquid-Liquid Dispersions. Chem. Eng. Technol. 2004, 27, 330–334. [Google Scholar] [CrossRef]
  8. Maluta, F.; Montante, G.; Paglianti, A. Analysis of immiscible liquid-liquid mixing in stirred tanks by Electrical Resistance Tomography. Chem. Eng. Sci. 2020, 227, 115898. [Google Scholar] [CrossRef]
  9. Malík, M.; Primas, J.; Kotek, M.; Jašíková, D.; Kopecký, V. Mixing of two immiscible phases measured by industrial electrical impedance tomography system. Mech. Ind. 2019, 20, 707. [Google Scholar] [CrossRef] [Green Version]
  10. Hinze, J.O. Fundamentals of the hydrodynamic mechanism of splitting in dispersion processes. AIChE J. 1955, 1, 289–295. [Google Scholar] [CrossRef]
  11. Kolmogorov, A.N. The breakage of drops in a turbulent current. Dokl. Akad. Nauk SSSR 1949, 66, 825–828. [Google Scholar]
  12. Rodgers, T.L.; Cooke, M. Correlation of drop size with sheat tip speed. In Proceedings of the 14th European Conference on Mixing, Warszawa, Poland, 10–13 September 2012; p. B17. [Google Scholar]
  13. Chen, H.T.; Middleman, S. Drop size distribution in agitated liquid-liquid systems. AIChE J. 1967, 13, 989–995. [Google Scholar] [CrossRef]
  14. Zhou, G.; Kresta, S.M. Evolution of drop size distribution in liquid-liquid dispersions for various impellers. Chem. Eng. Sci. 1998, 53, 2099–2113. [Google Scholar] [CrossRef]
  15. Bałdyga, J.; Bourne, J.; Pacek, A.; Amanullah, A.; Nienow, A. Effects of agitation and scale-up on drop size in turbulent dispersions: Allowance for intermittency. Chem. Eng. Sci. 2001, 56, 3377–3385. [Google Scholar] [CrossRef]
  16. Hong, P.O.; Lee, J.M. Unsteady-state liquid-liquid dispersions in agitated vessels. Ind. Eng. Chem. Process. Des. Dev. 1983, 22, 130–135. [Google Scholar] [CrossRef]
  17. Tang, H.; Wrobel, L.C. Modelling the interfacial flow of two immiscible liquids in mixing processes. Int. J. Eng. Sci. 2005, 43, 1234–1256. [Google Scholar] [CrossRef]
  18. Šulc, R.; Kysela, B.; Ditl, P. Time evolution of the drop size distribution for liquid–liquid dispersion in an agitated tank. Chem. Pap. 2018, 72, 543–553. [Google Scholar] [CrossRef]
  19. Kysela, B.; Konfršt, J.; Chára, Z.; Šulc, R.; Ditl, P. In-situ measurement of particle size distribution in an agitated vessel. In Proceedings of the 18th International Conference Transport & Sedimentation of solid particles, Prague, Czech Republic, 11–15 September 2017; pp. 177–183. [Google Scholar]
  20. Podgórska, W. The Influence of Internal Intermittency, Large Scale Inhomogeneity, and Impeller Type on Drop Size Distribution in Turbulent Liquid-Liquid Dispersions. Entropy 2019, 21, 340. [Google Scholar] [CrossRef] [Green Version]
  21. Sprow, F.B. Drop size distributions in strongly coalescing agitated liquid-liquid systems. AIChE J. 1967, 13, 995–998. [Google Scholar] [CrossRef]
  22. El-Hamouz, A.; Cooke, M.; Kowalski, A.; Sharratt, P. Dispersion of silicone oil in water surfactant solution: Effect of impeller speed, oil viscosity and addition point on drop size distribution. Chem. Eng. Process. Process Intensif. 2009, 48, 633–642. [Google Scholar] [CrossRef]
  23. Formánek, R.; Šulc, R. Dispersion of immiscible liquid-liquid system in a vessel agitated by a Sawtooth impeller: Drop size time evolution. In Proceedings of the International Conference Experimental Fluid Mechanics 2019, Franzensbad, Czech Republic, 19–22 November 2019; pp. 136–139. [Google Scholar]
  24. Formánek, R.; Kysela, B.; Šulc, R. Drop Size Evolution Kinetics in a Liquid-Liquid Dispersions System in a Vessel Agitated by a Rushton Turbine. Chem. Eng. Trans. 2019, 74, 1039–1044. [Google Scholar]
  25. Formánek, R.; Kysela, B.; Šulc, R. Image analysis of particle size: Effect of light source type. EPJ Web Conf. 2019, 213, 02021. [Google Scholar] [CrossRef]
  26. Hong, P.O.; Lee, J.M. Changes of the average drop sizes during the initial period of liquid-liquid dispersions in agitated vessels. Ind. Eng. Chem. Process. Des. Dev. 1985, 24, 868–872. [Google Scholar] [CrossRef]
  27. Bucciarelli, E.; Formánek, R.; Kysela, B.; Fořt, I.; Šulc, R. Dispersion kinetics in mechanically agitated vessel. EPJ Web Conf. 2019, 213, 02008. [Google Scholar] [CrossRef]
Figure 1. Scheme of the experimental device: 1, High-speed camera; 2, Macro objective; 3, Sawtooth impeller; 4, Single-point light source; 5, Cylindrical vessel wall; 6, Baffles; 7, Optical box (a—the distance of the region A from the vessel bottom; b—baffle width; c—distance between regions; D—impeller diameter; e—region distance from the vessel axis; H—liquid level; p—region distance from the vessel wall; T—vessel diameter).
Processes 08 01012 g001
Figure 2. Calibration procedure: (a) Image of 1 × 1 mm grid for evaluation of image resolution captured in Region A. (b) Image with captured calibration Nylon spheres for image analysis (IA) procedure calibration.
Processes 08 01012 g002
Figure 3. Image analysis: (a) Raw image captured at 5 min of recording at the impeller speed 600 rpm (Region A). (b) Raw image captured at 5 min of recording at the impeller speed 800 rpm (Region A).
Processes 08 01012 g003
Figure 4. Time evolution of the number of evaluated drops—Effect of the investigated region: (a) 600 rpm impeller speed (b) 700 rpm impeller speed.
Processes 08 01012 g004
Figure 5. Time evolution of the number of evaluated drops—Effect of the investigated region, 800 rpm impeller speed.
Processes 08 01012 g005
Figure 6. Time evolution of Sauter mean diameter—Effect of the investigated region: (a) 600 rpm impeller speed and (b) 700 rpm impeller speed.
Processes 08 01012 g006
Figure 7. Time evolution of Sauter mean diameter—Effect of the investigated region, 800 rpm impeller speed.
Processes 08 01012 g007
Figure 8. Experimental data vs. Hong and Lee’s [16] kinetics model—Effect of the investigated region: (a) 700 rpm impeller speed and (b) 800 rpm impeller speed.
Processes 08 01012 g008
Figure 9. Dependence of d32eq on impeller Weber number (We): Experimental data vs. El-Hamouz et al. [22].
Processes 08 01012 g009
Figure 10. Drop size distribution (DSD) evolution at the start and the end of measurement in each region: (a) 700 rpm impeller speed and (b) 800 rpm impeller speed.
Processes 08 01012 g010
Figure 11. Visualized flow field—Comparison with the investigated areas A, B, and C (red lines).
Processes 08 01012 g011
Table 1. Physical properties of the immiscible liquid–liquid system.
PhaseDensity
ρ (kg m−3)
Viscosity
μ (mPa s)
Surface Tension
σ (mN m−1)
Volume Fraction
φ (-)
Continuous997.660.9471.970.99953
Dispersed1075.5822326.420.00047
Table 2. Parameters of regions.
RegionArea
(mm × mm)
Image Resolution
(mm Pixel−1)
NoED 1
(-)
A7.827 × 6.2620.0061151,292,901
B7.834 × 6.2670.006121,292,279
C7.823 × 6.2590.006112793,029
1 Total number of evaluated drops in all sets in each region.
Table 3. Evaluated parameters of Hong and Lee’s kinetics model [16]—Effect of impeller speed and investigated area.
Impeller Speed (rpm)Regiond32eq1 (μm)αβ × 10−5
600A125.130.79910.881
B109.851.0489.777
C122.190.7278.555
700A118.350.14710.114
B97.240.1685.346
C110.420.1629.517
800A115.190.11637.410
B93.170.0643.633
C104.620.0885.606
1 Equilibrium Sauter mean diameter.