Article

CO2 Utilization via Integration of an Industrial Post-Combustion Capture Process with a Urea Plant: Process Modelling and Sensitivity Analysis

by
Reza Shirmohammadi
1,
Alireza Aslani
1,*,
Roghayeh Ghasempour
1,* and
Luis M. Romeo
2,*
1
Department of Renewable Energy and Environment, Faculty of New Sciences & Technologies, University of Tehran, Tehran 1417466191, Iran
2
Departamento de Ingeniería Mecánica, Escuela de Ingeniería y Arquitectura, Universidad de Zaragoza, María de Luna 3, 50018 Zaragoza, Spain
*
Authors to whom correspondence should be addressed.
Processes 2020, 8(9), 1144; https://doi.org/10.3390/pr8091144
Submission received: 6 August 2020 / Revised: 4 September 2020 / Accepted: 10 September 2020 / Published: 13 September 2020
(This article belongs to the Special Issue Fluid Dynamics, Multi Phase Flow, and Thermal Recovery Methods)

Abstract

:
Carbon capture and utilization (CCU) may offer a response to climate change mitigation from major industrial emitters. CCU can turn waste CO2 emissions into valuable products such as chemicals and fuels. Consequently, attention has been paid to petrochemical industries as one of the best options for CCU. The largest industrial CO2 removal monoethanol amine-based plant in Iran has been simulated with the aid of a chemical process simulator, i.e., Aspen HYSYS® v.10. The thermodynamic properties are calculated with the acid gas property package models, which are available in Aspen HYSYS®. The results of simulation are validated by the actual data provided by Kermanshah Petrochemical Industries Co. Results show that there is a good agreement between simulated results and real performance of the plant under different operational conditions. The main parameters such as capture efficiency in percent, the heat consumption in MJ/kg CO2 removed, and the working capacity of the plant are calculated as a function of inlet pressure and temperature of absorber column. The best case occurred at the approximate temperature of 40 to 42 °C and atmospheric pressure with CO2 removal of 80.8 to 81.2%; working capacity of 0.232 to 0.233; and heat consumption of 4.78 MJ/kg CO2.

1. Introduction

Inasmuch as the effects of global warming have become more evident, efforts are being executed to mitigate greenhouse gases emissions, mainly CO2 [1]. The concept of capturing carbon dioxide from power station, refinery, and factory exhaust has long been hailed as crucial in mitigating the climate disaster [2]. Carbon capture and storage (CCS) is a set of technologies which can meaningfully contribute to the reduction in CO2 emissions; and post-combustion CO2 capture (PCC) is the more developed technology to be integrated with thermal power plants and the other energy-intensive industries [3]. The technology has some drawbacks such as huge regeneration energy consumption, amine solvent degradation, and equipment corrosion [4]. However, regeneration energy consumption is considered as the main challenge, as it requires more than 70% of the total operating costs of a CO2 capture plant. Therefore, the reduction in heat duty of regeneration has to be the main priority for more progress in amine-based CO2 capture technology [5]. There are two commercial-scale power plants in which amine-based PCC using amines are being operated today, namely at Boundary Dam in Canada [6] and at the Petra Nova project at the Parish Power Station in the US [7]. Such plants demonstrate the technical viability of CCS technology at the commercial scale.
The possibility of eliminating CO2 from industrial and power generation plants has increased because of environmental issues [8]. However, the former concept of CCS is no longer satisfactory, and it has already been modified to carbon capture and utilization (CCU), including utilization of carbon dioxide [9]. Utilization of carbon dioxide can be divided into two main categories. In the former part, CO2 has confident utilization with no conversion, particularly in the supercritical state such as enhanced oil recovery with CO2 flooding or physical solvent applications [10]. Indeed, injection of CO2 into an oil reservoir increases the production because of high mutual dissolving capability of supercritical CO2 and hydrophobicity of oil [11]. In the latter part, the CO2 moiety is rehabilitated via carboxylation or reduction avenues to chemicals and fuels. In fact, utilizing CO2 as a feasible feedstock for the chemical industry has been the forethought of visionary researchers, and pioneering studies have already made significant achievements towards converting CO2 to C1 building block chemicals [12]. Annually, about 130 Mt of CO2 are used to manufacture urea, salicylic acid, cyclic carbonates, and polycarbonates, among which the urea process consumes most of the CO2 industrially [13]. Universally, great amounts of ammonia are altered to urea, which is in turn mostly utilized as a fertilizer used to increase crop yields and food production. A number of CCU plants employed for urea production are presented in Table 1. Except in the case of Iran, all of the plants were constructed by Mitsubishi Heavy Industries Engineering.
Aspen HYSYS® and Aspen Plus® have been employed for simulating a variety of PCC plants. Pouladi et al. [14] used Aspen HYSYS® software to simulate a commercial-scale CO2 capture plant. They employed the amine package equation out of the fluid property packages to calculate the thermodynamic properties of the process. Husebye et al. [15] simulated a capture process by Aspen Plus® software using the amines property package in order to obtain better understanding of varying CO2 concentrations existing in flue gas. Moioli and Pellergrini [16] simulated a capture plant with Aspen Plus® and validated the results of simulation by comparing them with experimental data of a pilot plant for the purification of flue gas from a power plant with the aid of monoethanolamine (MEA) washing. Dubois et al. [17] simulated various configuration of PCC, i.e., solvent split flow, rich solvent recycle, and lean/rich vapor compression applied to the exhaust gas coming from the Norcem Brevik cement plant.
Gervasi et al. [18] simulated a PCC plant by Aspen HYSYS® using the amine package and Kent–Eisenberg model. The simulated model by MEA 30% obtained a heat consumption of 3.71 GJ/tCO2 with a capture rate of 85% and was validated with the available literature results considering the St. Marys cement plant in Canada as a case study.
Xue et al. [19] developed a steady-state process model of MEA 30% PCC in Pro/II software and validated the obtained results with the experimental data. They evaluated the system using a variety of data for different days. In the best case, they obtained heat consumption of 3.71 GJ/tCO2 with a capture rate of 79.9%.
Øi [20] simulated a natural gas fired power plant integrated with an MEA-based PCC by Aspen HYSYS® with the aid of the Peng–Robinson and amines property package models. The required energy for the regeneration of solvent was obtained at 3.7 MJ/kg CO2 with respect to CO2 removal of 85%.
Adeosun et al. [21] simulated a PCC unit for a 600 MWe conventional coal-fired power plant using the equilibrium-based Aspen Plus® for evaluation of amine-blend solvent. They evaluated 30 wt% total mixtures of 2-amino-2-methyl-1-propanol (AMP) and methyl diethanolamine (MDEA) using diethanolamine (DEA) and MEA as activating agents. The mixture of 5 wt% DEA and 25 wt% AMP performed better than the other mixtures by obtaining heat consumption of 3.03 GJ/tCO2.
Li et al. [22] simulated a CO2 recovery process using a rate-based model available in Aspen Plus® and validated with the results from the PCC pilot plant trials located at the Tarong power station in Queensland, Australia. After process enhancements, the optimal operating conditions were selected, and heat consumption of 3.6 MJ/kg CO2 was obtained using 35% MEA.
Morales-Mora et al. [23] simulated a PCC plant with the capacity of 1075 t/day using Aspen HYSYS® version 9. The energy that was required for CO2 separation from the exhaust gas and compression was 4.360 MJ/kg CO2, consisting of 0.0024 kg MEA/t CO2 with a capture efficiency of 95.4% and CO2 stream purity of 95%.
The majority of CO2 recovery plants integrated to the urea plants have been established by Mitsubishi Heavy Industries Engineering. However, the case study was constructed by a domestic company, and simulation and performance validation are considered as novelties on the knowledge. As the number of CO2 capture plants has increased in recent years in Iran, the accurate design of such plants is an important issue. This research aimed to simulate the industrial CCU plant of Kermanshah Petrochemical Industries Co. using Aspen HYSYS®, based on real data, and validate the results by comparing them with the output of the model. The simulation results presented the balance of mass and energy for the whole process, detailed information of units and streams, and energy consumption, as well as the equipment size of main units. A sensitivity analysis of main parameters such as heat consumption, capture efficiency, and working capacity was then employed to evaluate the simulated plant.

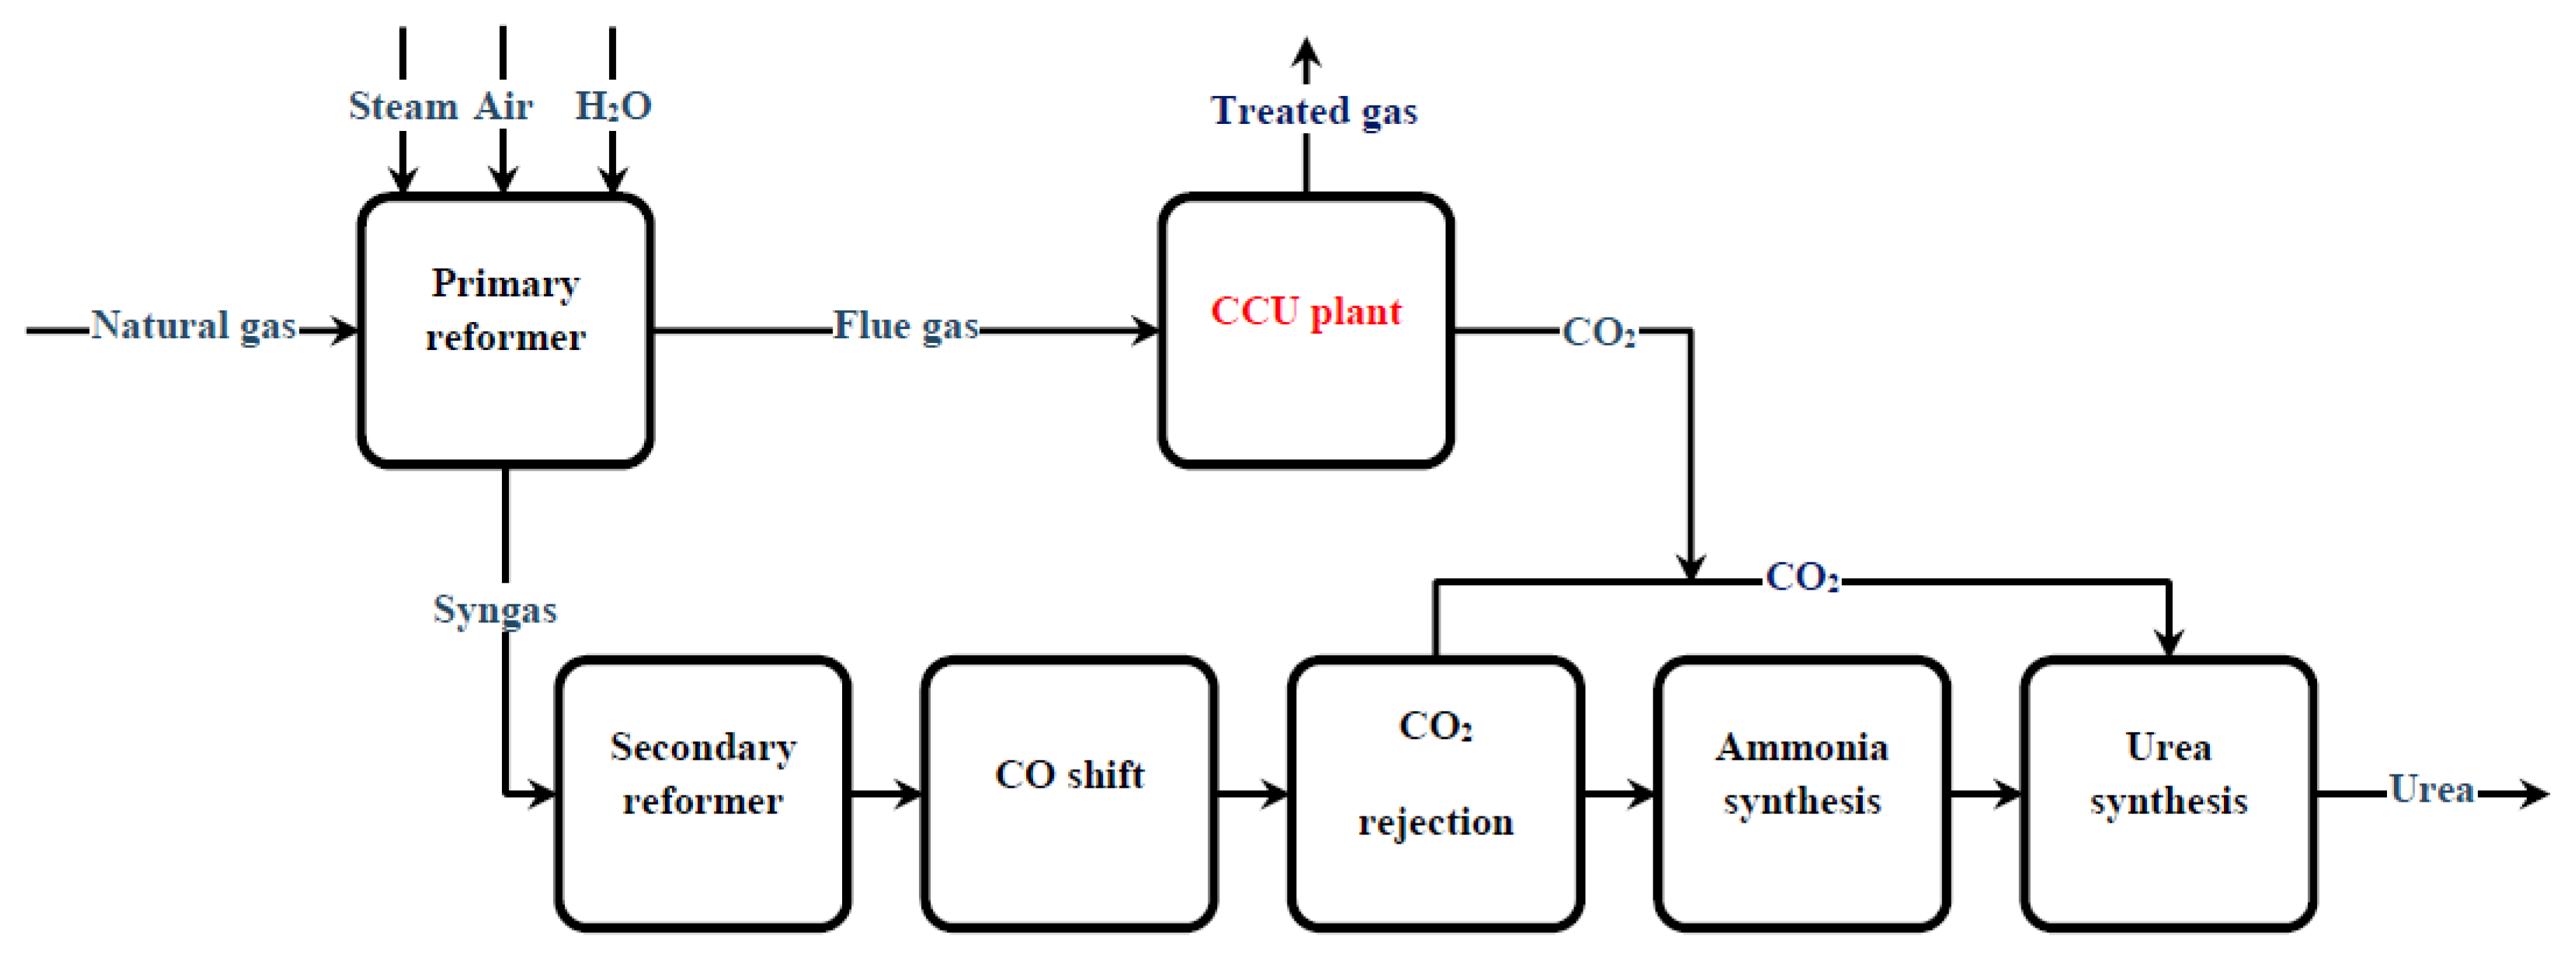
2. Case Study and Process Description

Iran is considered among the most CO2 emitting countries over the past decades. The large amount of fossil resources, and deficiency in planning of integrated energy policies in conjunction with neglect of performance enhancement in energy intensive plants have vastly worsened the climate state. Power plants, refineries, and petrochemicals are the main sources of the emissions. Petrochemicals can be the first priority for implementing and integrating of CCU plants because of the possibility of increasing their product capacity and producing new products. Kermanshah Petrochemical Industries Co., located in the western part of the country, is engaged in manufacturing and selling agricultural fertilizers and chemicals. Its product offerings include urea fertilizer, liquid ammonia, and liquid nitrogen. At the urea production facilities, ammonia is always in excess. This means that by recovering CO2 from the stack of the ammonia reformer, the stored ammonia can be converted to urea, thus boosting production capacity without the need to invest extensively in major equipment such as reformers and reactors. In this complex, a CO2 recovery unit for the capture of carbon dioxide from the stack of the primary reformer of the ammonia plant was established. The project at Kermanshah Petrochemical Industries Co. (KPIC) was licensed, designed, and built by Shahrekord Carbon Dioxide (SCD) to recover 132 metric tons per day (MTPD) of CO2 from the stack of the ammonia reformer. The project was initiated in early 2013, and within 20 months the plant was operating. Utilization of this technology has enabled KPIC to lower its natural gas consumption by 21.1 million normal cubic meters (M Nm3) of natural gas per year, and more than 40,000 tons of CO2 emissions per annum have been avoided. As a result of this project, the production capacity has been boosted by 5%, without any further investment beyond the execution of the plant.
Industrially, urea is primary produced by the hydration of calcium cyanamide; nonetheless, ammonia accessibility has resulted in the expansion of ammonia/carbon dioxide technology. There are two steps in which ammonia and CO2 react to form ammonium carbamate, which is then dehydrated to urea. In natural gas-based ammonia and urea plants, CO2 is recovered from the reformer burner flue gas and used for urea synthesis. Figure 1 shows block flow diagram for the existing plants in Kermanshah Petrochemical Industries Co. The operational data used for simulation of the plant was gained from the CO2 recovery plant of KPIC. The plant is located in Bisotun and is shown in Figure 2a.
The flue gas stream at 178 °C is delivered to the bottom of soda ash wash and direct contact tower; and its temperature declines up to 42 °C, while the water in the flue gas is drained. The flue gas is next connected to the blower, by which the required pressure to pass through absorber tower is provided. The flue gas at the temperature of 47 °C enters into the absorber tower. The absorber is made up of five segments, filled with the random packing. The top sections of the column are the cooling and washing sections with a height of 2 m for each segment, and the rest are absorber packed sections with a height of 3 m for each segment. The overall height of the packed column is equal to 13 m. The contact-cooler in the washing section is mainly to prevent water equilibrium in conjunction with amine loss in the process. There are two intercoolers between the first and second sections as well as second and third sections of the absorption column used for surging in the absorption rate of CO2. Going up the column, the exhaust gas contacts the 30% MEA solution, and its CO2 is absorbed by the solution. Rich MEA solution departures from the bottom of the absorber column and enters into the pump. The rest of the exhaust gas, which mainly comprises nitrogen, steam, and probably some unabsorbed CO2, is purged to the atmosphere. Rich MEA pumps into the first stage of the main heat exchanger. Exchanging heat with the other side of the heat exchanger, containing the lean MEA solution from the reboiler, its temperature increases from 52 °C to 87 °C. Rich MEA is then sent to the top of the stripper tower and contacts the steam provided in the reboiler. The required energy for regeneration of the solvent is supplied by steam of the reformer in the ammonia plant. The steam latent heat acquires the required energy for CO2 separation from the rich solution. The CO2 gas, released from the top of the stripper, contains steam, and a little MEA enters into the condenser. The steam is condensed and the water is recycled to the stripper tower, and CO2 enters the compressor of the urea plant.
The composition of flue gas extracted from the stack of the ammonia plant is presented in Table 2, and the actual operation conditions of the plant are also presented in Table 3. Figure 2b shows the schematic of the actual plant, which is drawn based on the process flow diagram.

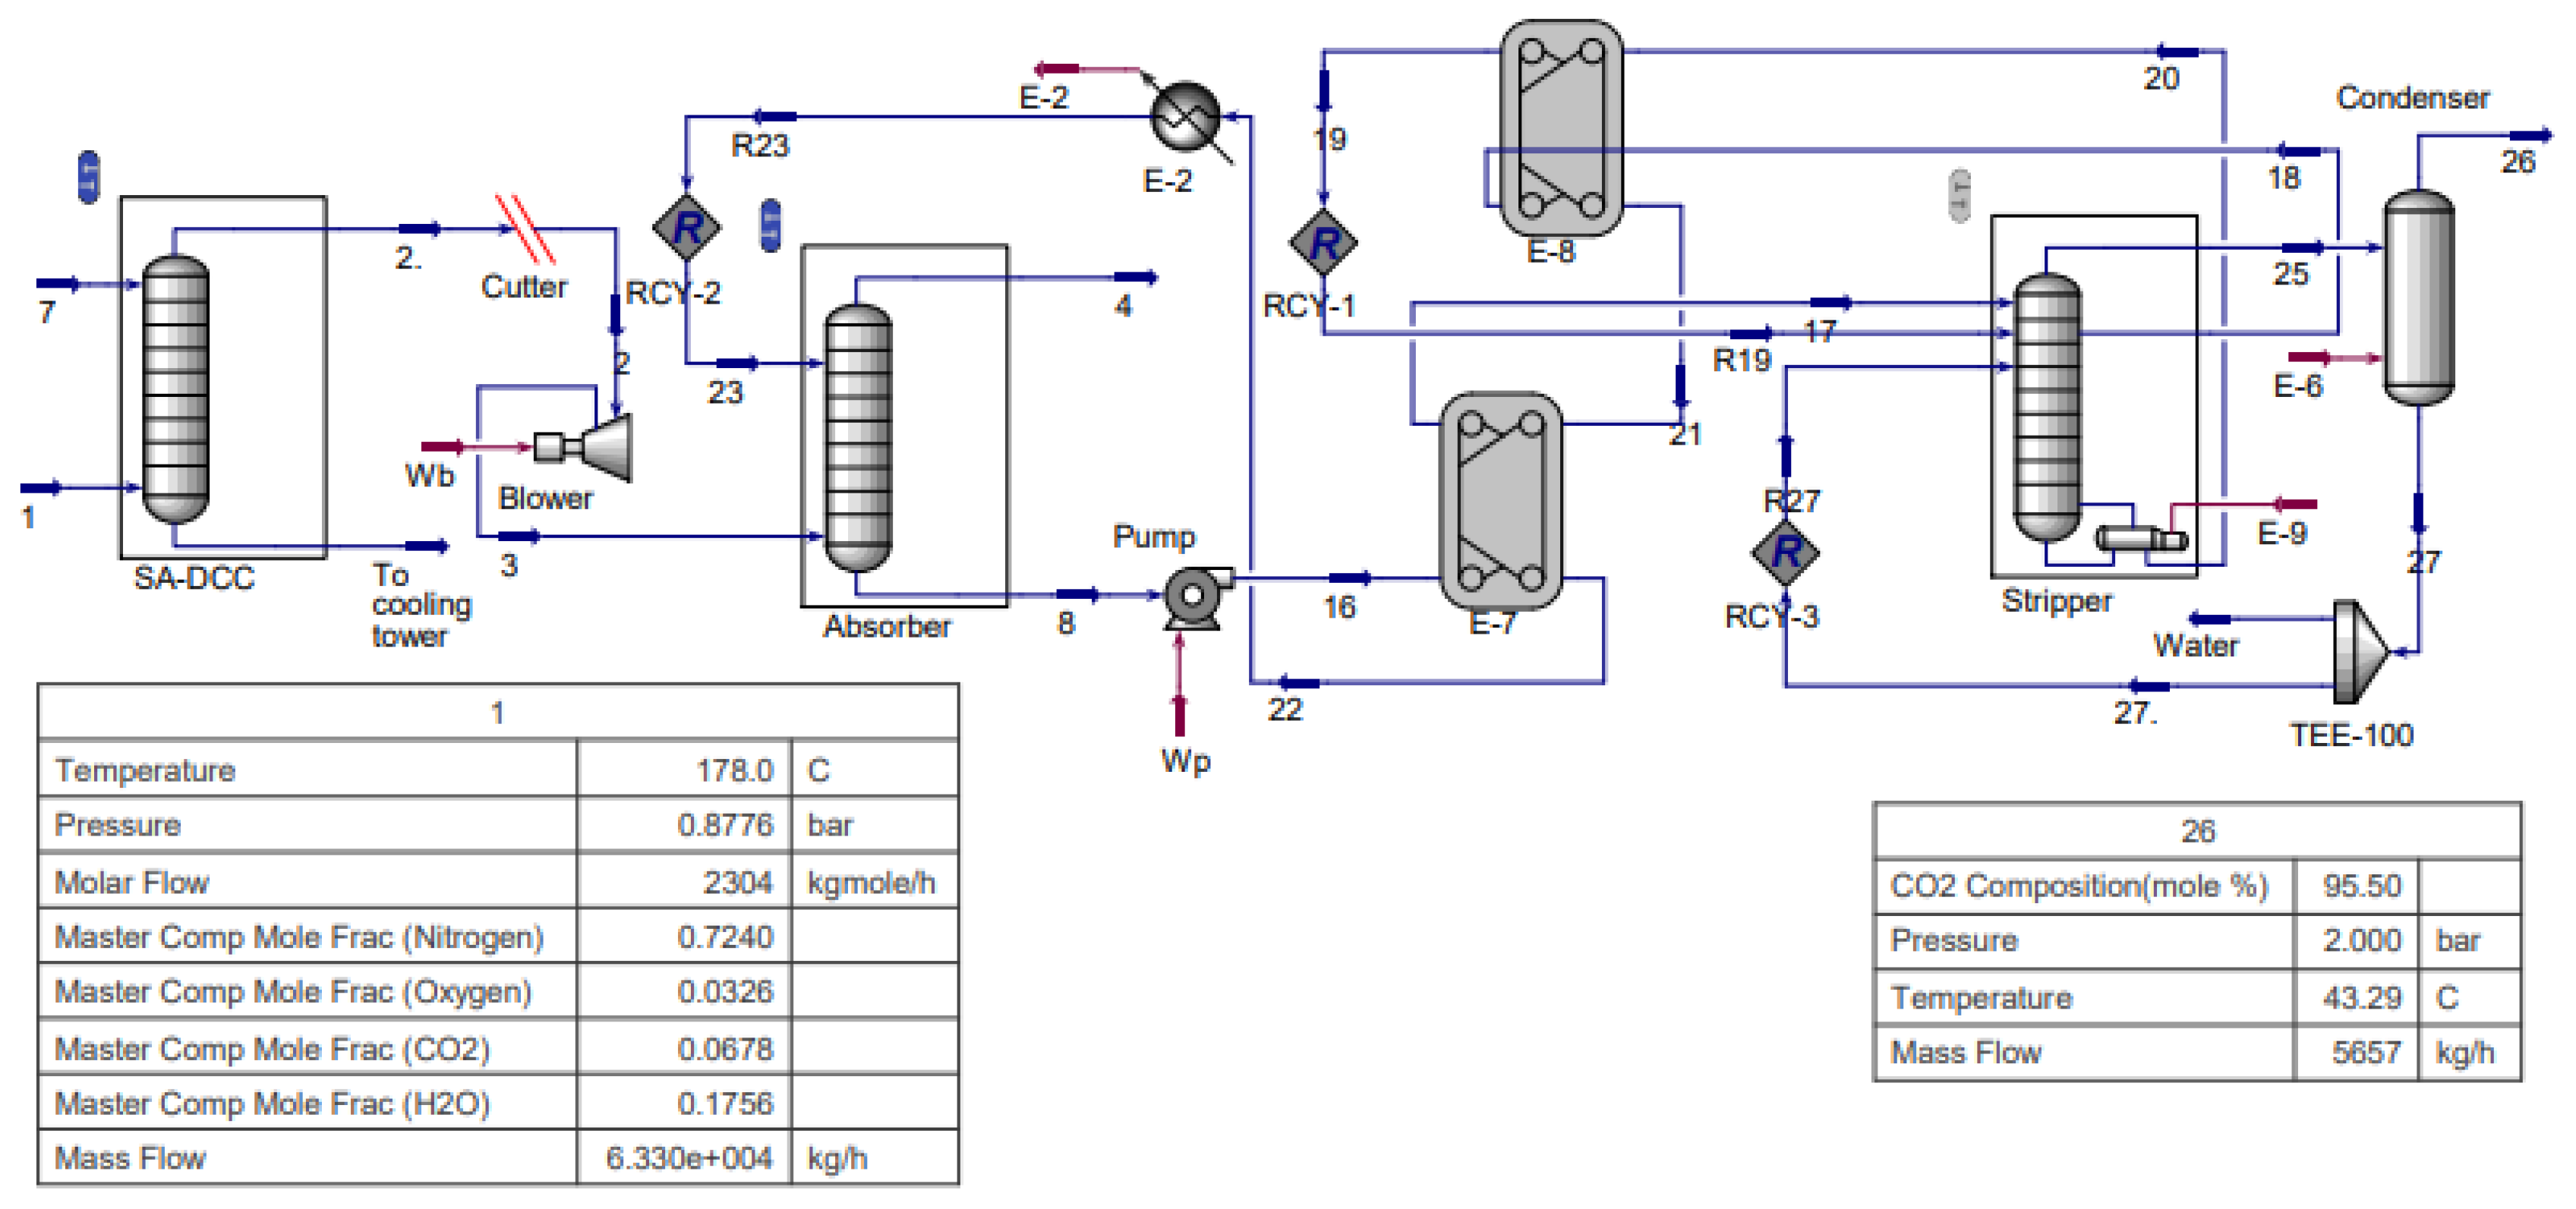
3. Simulation and Thermodynamic Framework

The process model developed by Aspen HYSYS® v.10 software using the acid gas package was used. An important advantage with using a process simulation program is the available models employed for thermodynamic properties. Aspen HYSYS® has an acid gas package in which the Peng–Robinson equation of state for the vapor phase and the electrolyte non-random two-liquid (eNRTL) activity coefficient model for electrolyte thermodynamics in the liquid phase are used [17].
The acid gas package advanced by Aspen allows one to simulate the acid gas removal of CO2 and H2S. It comprises the physicochemical specifications of the acid gases, water, amines alone, e.g., MEA and PZ, along with several mixtures, e.g., MDEA + PZ. Additionally, it provides a rate-based calculation model as well as a makeup unit operation to make up losses in water and amine in the system. The package was developed on the basis of extensive investigation in the chemical absorption process, simulation of the rate-based process, and models of molecular thermodynamic for amine solutions. It comprises the eNRTL model parameters and other transport property model parameters recognized from regression of wide thermodynamic and physical property data for amine solutions [24,25,26].
CO2–amine interactions are part of solvent chemistry. After the amine–CO2–H2O systems reach chemical and vapor–liquid equilibrium, the amine solutions contain multiple cations (AmH+), free molecules (Am), and anions (carbamate, HCO3, CO32−), instantaneously. These “ternary” systems contain 8–9 ionic or neutral species. Their concentrations are limited by mass balance and reaction equilibrium [4].
MEA overall reaction:
2 M E A + C O 2     M E A C O O   +   M E A H +
C O 2 ( g ) + H 2 O ( l )     H 2 C O 3 ( l )
M E A + C O 2 +   H 2 O     M E A H + C O O ( z w i t t e r i o n )   +   H 2 O
M E A H + C O O ( z w i t t e r i o n )   +   H 2 O M E A C O O ( c a r b a m a t e )   +   H 3 O +
H 3 O + +   M E A     M E A H + +   H 2 O
H 2 C O 3 + H 2 O     H C O 3   +   H 3 O +
H C O 3 + H 2 O     C O 3 2   +   H 3 O +
M E A C O O + H 2 O     H C O 3   +   M E A
All of the equipment is herein simulated using the acid gas package except the soda ash wash-direct contact tower, which is simulated by eNRTL.
Table 4 shows the specification of the all equipment employed in the simulation for the industrial PCC plant. In the first section, the specification of the three columns’ internal dimensions, including height, diameter, type, material, and dimension of each packed sections, are presented. In the second part, the specification of the compression equipment, including differential pressure, pressure ratio, adiabatic efficiency, and consumed power, are provided. In the last section, the specifications of the heat exchangers, i.e., intercoolers of absorber, MEA rich-lean heat exchangers (stage 1 and stage 2), reboiler, condenser, and the reset of heat exchangers, are provided.

4. Results and Discussion

4.1. Model Validation

In order to validate the simulation results with the actual data, important parameters of the CCU plant were compared and are provided within Table 5. The simulation relative error was achieved using the following relationship:
R e l a t i v e   e r r o r = | i a c t u a l   i s i m u l a t i o n   i a c t u a l   |
It is necessary to say that there was no way to measure some parameters such as compositions and flow rates of elements in some streams. Consequently, the results of simulation for some parameters were validated with the design parameters provided in data sheet of components and the process flow diagram. Figure 3 shows a schematic of the simulated plant by Aspen HYSYS®. The number of errors shows that there was good agreement between simulated results and real performance of the plant under different operational conditions. The amount of heat consumption in MJ/kg CO2 removed in the simulated case was 380 kW less than in the actual one with a percent error of 4.8%. Additionally, the amounts of required power for the blower and pump in the simulated case were 4.6 kW and 0.67 kW less, respectively, than the actual data with percent error of 4.8% and 4.6%, respectively. These three parameters had the highest percent errors; however, the magnitude of errors was less than 5% between actual and simulated data, through which the accuracy of the simulation was proven. The rich stream temperature in the outlet of absorber column in the simulated case was 1.5 more than the actual data with percent error of 2.86%. The amount of CO2 mass flow rate in the simulated case was equal to 5657 (kg/h), while the actual data was equal to 5604 (kg/h). The amount of the percent error for CO2 mass flow rate was equal to 0.94%, which is a rational value for this important parameter. The percent errors for the other parameters provided within the Table 5 were less than one percent. For clarification, the specification of inlet and outlet streams are provided within the flowsheet of simulation in Figure 3.

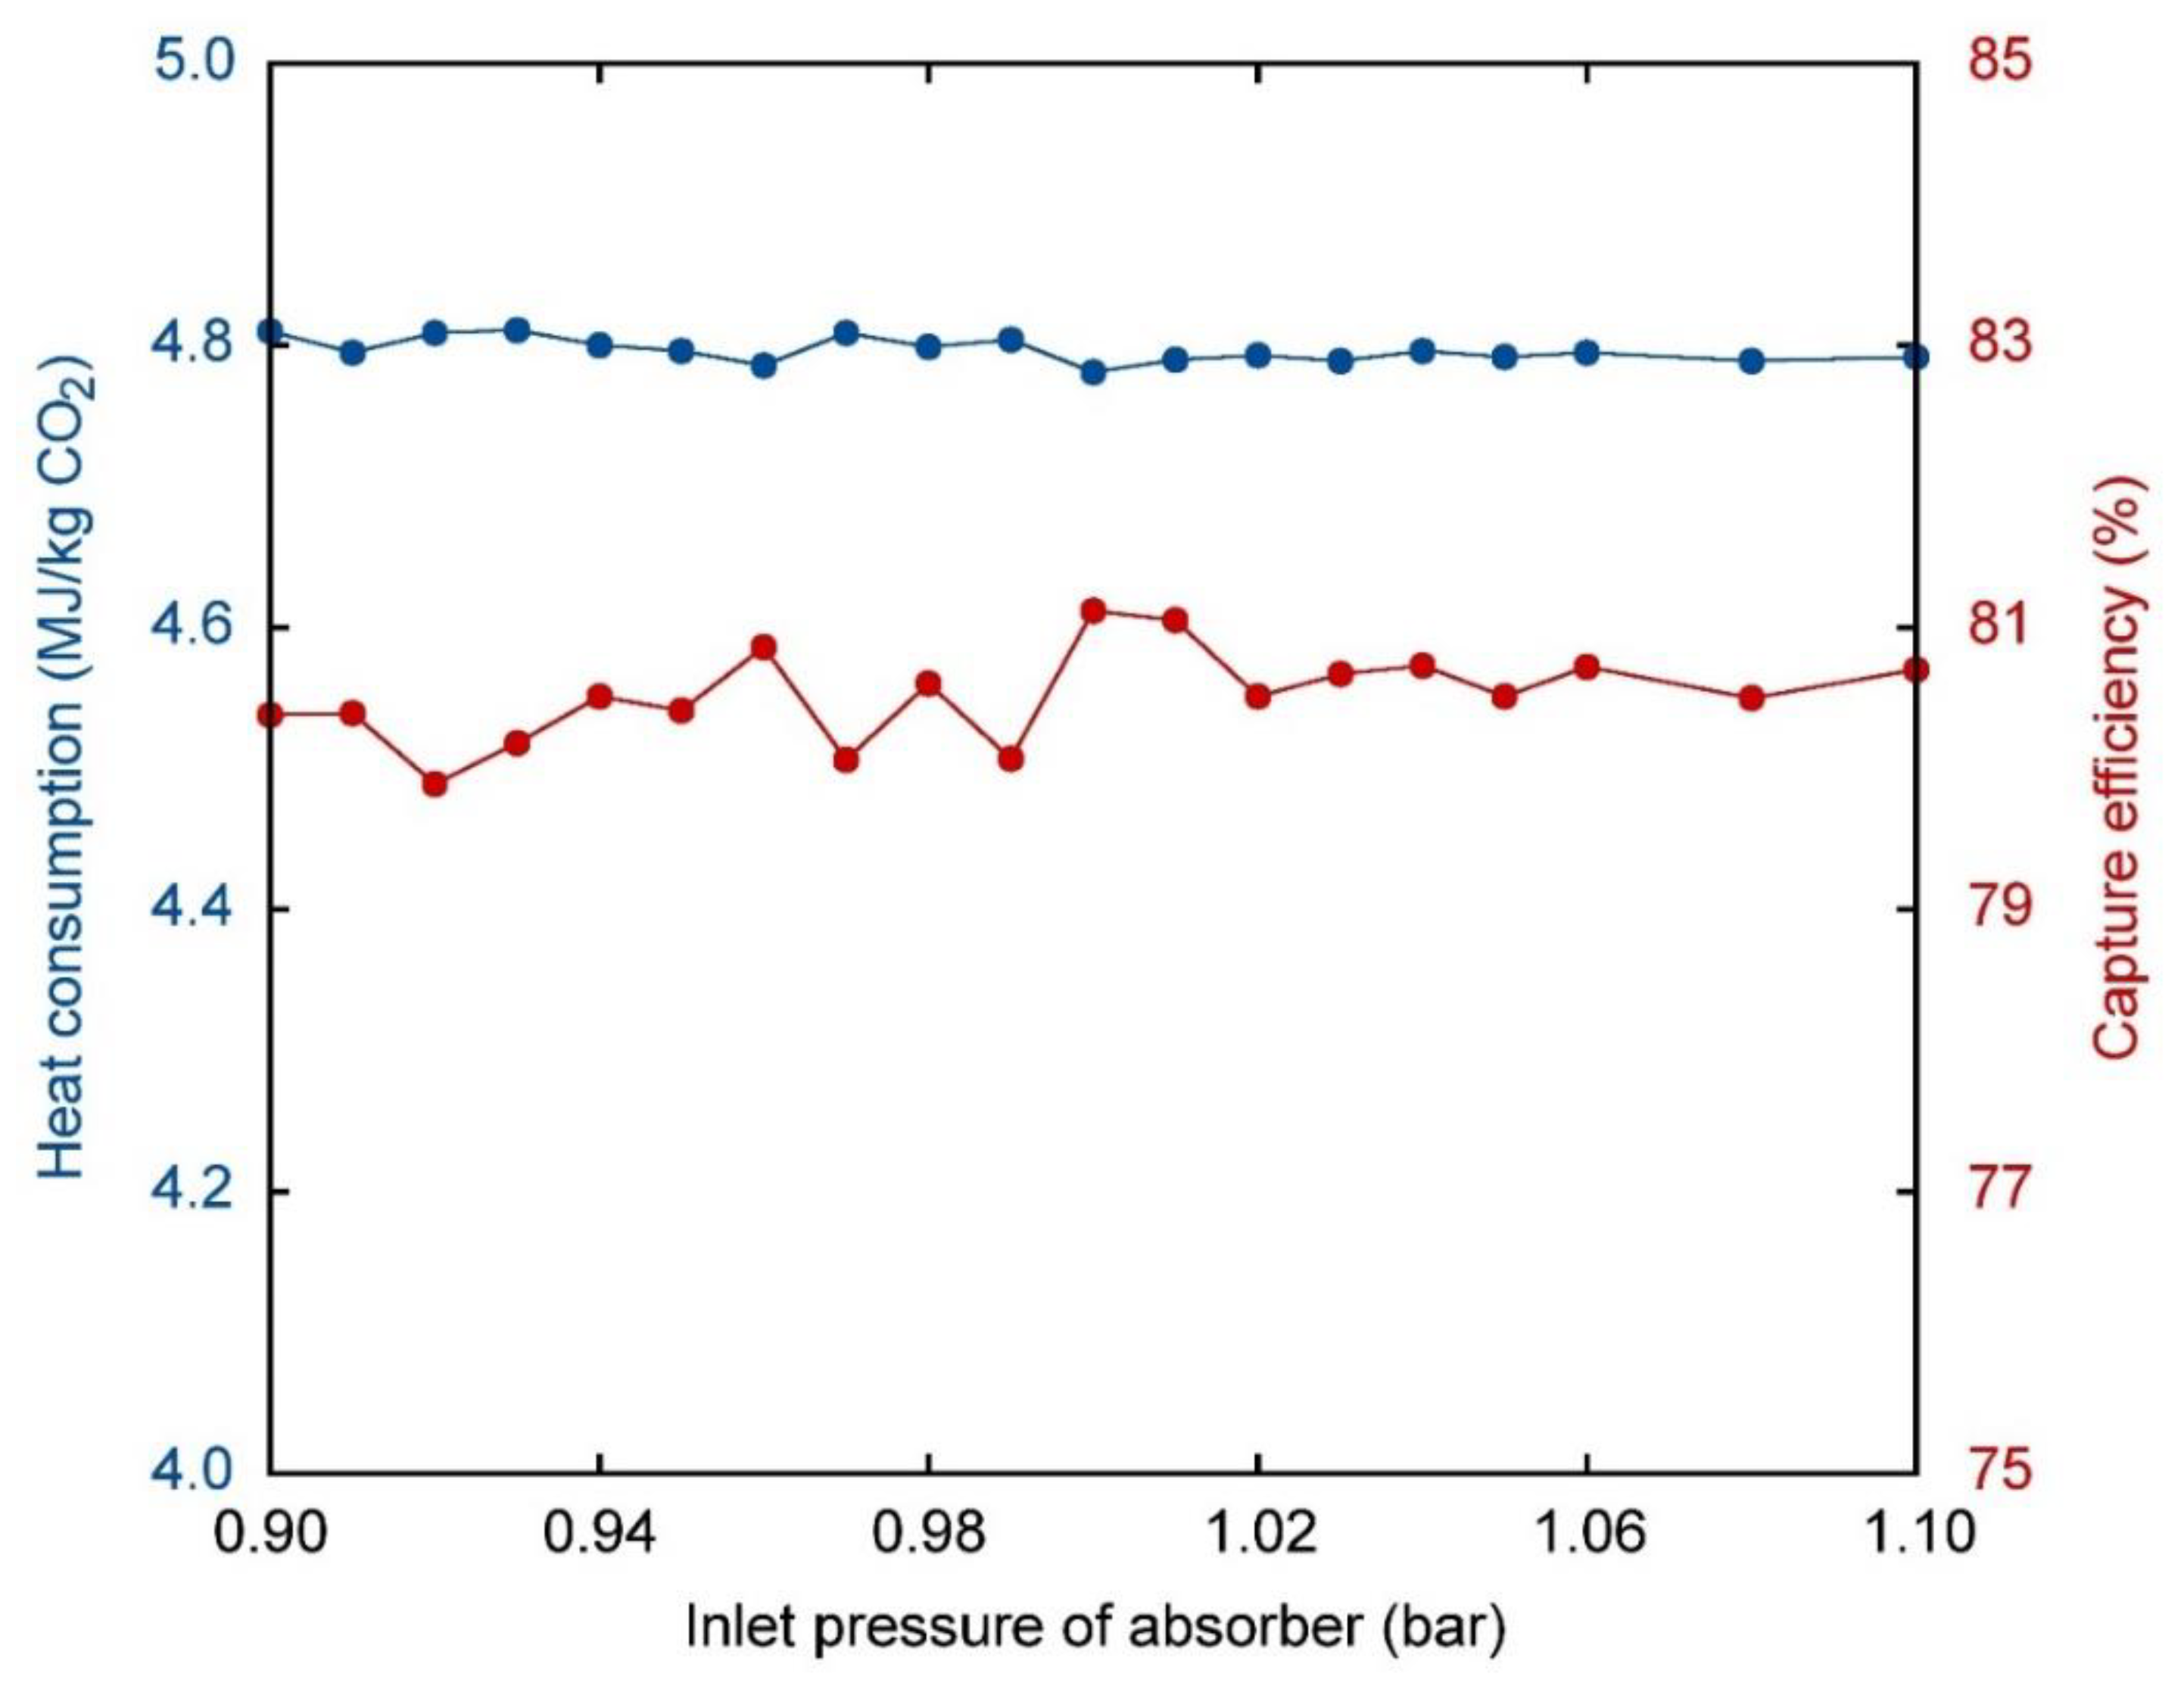
4.2. Sensitivity Analysis

Sensitivity calculations were employed using variation in the main operational parameters, i.e., inlet pressure and temperature of absorber column, to evaluate the main parameters such as capture efficiency in percent, the heat consumption in MJ/kg CO2 removed, and the working capacity of the plant.
Simulation results, shown in Figure 4, were employed to depict the effect of inlet temperature of flue gas entered to the absorber versus capture efficiency and heat consumption. Capture efficiency increased with temperature from 36 to 42 °C; it then had a constant trend. The best condition occurred at approximately 42 °C for both heat consumption at 4.78 MJ/kg CO2 and capture efficiency at 80.8%.
Figure 5 shows the variation of the inlet pressure of absorber column versus the heat consumption and the capture efficiency. The best condition approximately occurred at atmospheric pressure, i.e., 1 bar, for both the heat consumption and the capture efficiency. The trend of heat consumption was constant, and there were smooth fluctuations in the capture efficiency after the pressure of 1.02 bar. The highest amount of capture efficiency was equal to 81.2%, and the lowest amount of heat consumption was equal to 4.78 MJ/kg CO2, which both occurred at atmospheric pressure.
Figure 6 show variation of working capacity versus inlet pressure and temperature of the absorber. The best condition for the working capacity approximately occurred at atmospheric pressure and a temperature between 40 and 42 °C. The highest amount of working capacity with respect to inlet pressure of absorber occurred at atmospheric pressure with the amount of 0.233, while the value with respect to the inlet temperature of absorber occurred at 40 °C with the amount of 0.232, although this value was approximately the same at 41 and 42 °C. The working capacity decreased after these pressures and temperatures and had a constant trend with smooth fluctuations.

5. Conclusions

A chemical process flowsheet simulator, i.e., Aspen HYSYS® v.10, was herein employed to simulate the largest industrial CCU plant in Iran. Acid gas property package models, which are available in Aspen HYSYS®, were employed to calculate the thermodynamic properties. The simulation results were validated by the actual data provided by Kermanshah Petrochemical Industries Co. Good agreement was obtained between simulated results and real performance of the plant under diverse operational conditions. Sensitivity analysis of the main parameters, i.e., heat consumption, capture efficiency, and working capacity, was then conducted using various operational conditions to evaluate the simulated plant. Considering various temperatures in the inlet of the absorber column, the best condition occurred at approximately 42 °C, in which heat consumption and capture efficiency were equal to 4.78 MJ/kg CO2 and 80.8%, respectively. Considering various pressures in the inlet of the absorber column, the best condition approximately occurred at atmospheric pressure in which heat consumption and capture efficiency were equal to 4.78 MJ/kg CO2 and 81.2%, respectively. The highest amount of working capacity with respect to the aforementioned operational parameters was equal to 0.233. The high amount of heat consumption compared to the reported value in the literature is due to the oversized design of each pack of the column, the column diameter, and the heat transfer areas, as well as low-energy price of fossil fuel in Iran. This issue can also be justified when the plant increases its capacity to capture larger amounts of CO2 for feeding the urea plant.

Author Contributions

R.S.: Conceptualization, Methodology, Software, Formal analysis, Validation, Visualization, Resources, Writing—Original Draft, Review & Editing. A.A.: Project administration, Funding acquisition, Supervision, Resources, Writing—review & Editing. R.G.: Project administration, Funding acquisition, Supervision, Resources, Writing—review & Editing. L.M.R.: Supervision, Conceptualization, Writing—review & Editing. All authors have read and agreed to the published version of the manuscript.

Funding

This research received no external funding.

Acknowledgments

The authors would like to thank the Kermanshah Petrochemical Industries Co. for providing the data and technical support.

Conflicts of Interest

The authors declare no conflict of interest.

References

  1. Yap, J.Y.; Tan, J.; Foo, D.C.Y.; Tan, R.R.; Papadokonstantakis, S.; Badr, S. A graphical method for carbon dioxide emissions reduction in multi–product plants. Process Saf. Environ. Prot. 2020, 133, 51–63. [Google Scholar] [CrossRef]
  2. Griffin, P.W.; Hammond, G.P.; Norman, J.B. Industrial energy use and carbon emissions reduction in the chemicals sector: A UK perspective. Appl. Energy 2018, 227, 587–602. [Google Scholar] [CrossRef]
  3. Romeo, L.M.; Minguell, D.; Shirmohammadi, R.; Andrés, J.M. Comparative Analysis of the Efficiency Penalty in Power Plants of Different Amine-Based Solvents for CO2 Capture. Ind. Eng. Chem. Res. 2020, 59, 10082–10092. [Google Scholar] [CrossRef]
  4. Liang, Z.; Rongwong, W.; Liu, H.; Fu, K.; Gao, H.; Cao, F.; Zhang, R.; Sema, T.; Henni, A.; Sumon, K.; et al. Recent progress and new developments in post-combustion carbon-capture technology with amine based solvents. Int. J. Greenh. Gas Control 2015, 40, 26–54. [Google Scholar] [CrossRef] [Green Version]
  5. Barzagli, F.; Giorgi, C.; Mani, F.; Peruzzini, M. Reversible carbon dioxide capture by aqueous and non-aqueous amine-based absorbents: A comparative analysis carried out by 13C NMR spectroscopy. Appl. Energy 2018, 220, 208–219. [Google Scholar] [CrossRef]
  6. Singh, A.; Stéphenne, K. Shell Cansolv CO2 capture technology: Achievement from first commercial plant. Energy Procedia 2014, 63, 1678–1685. [Google Scholar] [CrossRef]
  7. Armpriester, A. WA Parish Post Combustion CO2 Capture and Sequestration Project Final Public Design Report; Petra Nova Parish Holdings: Washington, DC, USA, 2017.
  8. Petrakopoulou, F.; Tsatsaronis, G.; Morosuk, T. CO2 capture in a chemical looping combustion power plant evaluated with an advanced exergetic analysis. Environ. Prog. Sustain. Energy 2014, 33, 1017–1025. [Google Scholar] [CrossRef]
  9. Ravanchi, M.T.; Sahebdelfar, S. Carbon dioxide capture and utilization in petrochemical industry: Potentials and challenges. Appl. Petrochem. Res. 2014, 4, 63–77. [Google Scholar] [CrossRef] [Green Version]
  10. Hu, X.; Xie, J.; Cai, W.; Davarpanah, A. Thermodynamic effects of cycling carbon dioxide injectivity in shale reservoirs. J. Pet. Sci. Eng. 2020, 195, 107717. Available online: https://doi.org/10.1016/j.petrol.2020.107717 (accessed on 13 August 2020).
  11. Middleton, R.S. A new optimization approach to energy network modeling: Anthropogenic CO2 capture coupled with enhanced oil recovery. Int. J. Energy Res. 2013, 37, 1794–1810. [Google Scholar] [CrossRef]
  12. Cuéllar-Franca, R.M.; Azapagic, A. Carbon capture, storage and utilisation technologies: A critical analysis and comparison of their life cycle environmental impacts. J. CO2 Utilization 2015, 9, 82–102. [Google Scholar] [CrossRef]
  13. Alper, E.; Yuksel Orhan, O. CO2 utilization: Developments in conversion processes. Petroleum 2017, 3, 109–126. [Google Scholar] [CrossRef]
  14. Pouladi, B.; Nabipoor Hassankiadeh, M.; Behroozshad, F. Dynamic simulation and optimization of an industrial-scale absorption tower for CO2 capturing from ethane gas. Energy Rep. 2016, 2, 54–61. [Google Scholar] [CrossRef] [Green Version]
  15. Husebye, J.; Brunsvold, A.L.; Roussanaly, S.; Zhang, X. Techno Economic Evaluation of Amine based CO2 Capture: Impact of CO2 Concentration and Steam Supply. Energy Procedia 2012, 23, 381–390. [Google Scholar] [CrossRef] [Green Version]
  16. Moioli, S.; Pellegrini, L.A. Regeneration section of CO2 capture plant by MEA scrubbing with a rate-based model. Chem. Eng. Trans. 2013, 32, 1849–1854. [Google Scholar]
  17. Dubois, L.; Thomas, D. Comparison of various configurations of the absorption-regeneration process using different solvents for the post-combustion CO2 capture applied to cement plant flue gases. Int. J. Greenh. Gas Control 2018, 69, 20–35. [Google Scholar] [CrossRef]
  18. Gervasi, J.; Dubois, L.; Thomas, D. Simulation of the post-combustion CO2 capture with Aspen HysysTM software: Study of different configurations of an absorption-regeneration process for the application to cement flue gases. Energy Procedia 2014, 63, 1018–1028. [Google Scholar] [CrossRef] [Green Version]
  19. Xue, B.; Yu, Y.; Chen, J.; Luo, X.; Wang, M. A comparative study of MEA and DEA for post-combustion CO2 capture with different process configurations. Int. J. Coal Sci. Technol. 2017, 4, 15–24. [Google Scholar] [CrossRef] [Green Version]
  20. Øi, L.E. Aspen HYSYS simulation of CO2 removal by amine absorption from a gas based power plant. In Proceedings of the 48th Scandinavian Conference on Simulation and Modeling (SIMS 2007), Göteborg, Sweden, 30–31 October 2007; pp. 73–81. [Google Scholar]
  21. Adeosun, A.; Abu-Zahra, M.R. Evaluation of amine-blend solvent systems for CO2 post-combustion capture applications. Energy Procedia 2013, 37, 211–218. [Google Scholar] [CrossRef] [Green Version]
  22. Li, K.; Cousins, A.; Yu, H.; Feron, P.; Tade, M.; Luo, W.; Chen, J. Systematic study of aqueous monoethanolamine-based CO2 capture process: Model development and process improvement. Energy Sci. Eng. 2016, 4, 23–39. [Google Scholar] [CrossRef] [Green Version]
  23. Morales-Mora, M.; Pretelìn-Vergara, C.; Martínez-Delgadillo, S.; Iuga, C.; Nolasco-Hipolito, C. Environmental assessment of a combined heat and power plant configuration proposal with post-combustion CO2 capture for the Mexican oil and gas industry. Clean Technol. Environ. Policy 2019, 21, 213–226. [Google Scholar] [CrossRef]
  24. Zhao, X.; Smith, K.H.; Simioni, M.A.; Tao, W.; Kentish, S.E.; Fei, W.; Stevens, G.W. Comparison of several packings for CO2 chemical absorption in a packed column. Int. J. Greenh. Gas Control 2011, 5, 1163–1169. [Google Scholar] [CrossRef]
  25. Zhang, Y.; Chen, C.-C. Thermodynamic modeling for CO2 absorption in aqueous MDEA solution with electrolyte NRTL model. Ind. Eng. Chem. Res. 2011, 50, 163–175. [Google Scholar] [CrossRef]
  26. Zhang, Y.; Chen, H.; Chen, C.-C.; Plaza, J.M.; Dugas, R.; Rochelle, G.T. Rate-Based Process Modeling Study of CO2 Capture with Aqueous Monoethanolamine Solution. Ind. Eng. Chem. Res. 2009, 48, 9233–9246. [Google Scholar] [CrossRef]
Figure 1. Block flow diagram of the case study.
Processes 08 01144 g001
Figure 2. (a) The industrial CCU plant. (b) Schematic of the plant based on the process flow diagram.
Processes 08 01144 g002
Figure 3. Schematic of the simulated plant by Aspen HYSYS®.
Processes 08 01144 g003
Figure 4. Variation of inlet temperature versus heat consumption and capture efficiency.
Processes 08 01144 g004
Figure 5. Variation of inlet pressure versus heat consumption and capture efficiency.
Processes 08 01144 g005
Figure 6. (a) Variation of working capacity versus inlet pressure of absorber. (b) Variation of working capacity versus inlet temperature of absorber.
Processes 08 01144 g006
Table 1. Commercialized carbon capture and utilization (CCU) plant for urea production.
Operation YearCountrySource of Flue GasCapacity (TCO2/D)
1999MalaysiaNatural gas210
2006IndiaNatural gas450
2009IndiaNatural gas450
2009BahrainNatural gas450
2010UAENatural gas400
2010VietnamNatural gas240
2011PakistanNatural gas340
2012IndiaNatural gas450
2013IranNatural gas132
Table 2. Composition of the flue gas stream.
SubstanceMole Fraction
N20.724
CO20.0678
O20.0326
H2O0.1756
Table 3. Operation conditions of the plant.
Stream No.Mass Flow Rate (kg/h)TemperaturePressure
(°C)(bar)
163,2971780.8776
259,571420.8621
359,629470.9007
453,968430.8776
5272,256562.5
6272,256402
7115,500422.5
8121,27551.71.4
9119,05351.72.4
10119,053422.2
17122,483874.4
18121,372903.8
19121,3721163.6
20115,6121262.35
21115,6121002.15
22115,612701.95
23115,612481.75
2457.47602.2
256366862.2
265604432
27762432
Table 4. Specification of columns’ internal, compression equipment and heat exchangers for the industrial post-combustion CO2 capture (PCC) plant.
ColumnPacked SectionsPacked Diameter (m)Packed Height (m)Packing Type, Material, and Dimension
DCC & Soda AshSoda Ash3.83Saddle, Ceramic, 3″
DCC3.83Saddle, Ceramic, 3″
AbsorberCooling3.52Pall, Plastic, 2″
Washing3.52Pall, Plastic, 2″
Absorber 3rd3.53Pall, Plastic, 2″
Absorber 2nd3.53Pall, Plastic, 2″
Absorber 1st3.53Saddle, Ceramic, 3″
StripperStripper 2nd2.43Pall, Ceramic, 2″
Stripper 1st2.47Pall, Ceramic, 2″
Compression equipmentPressure ratioAdiabatic Efficiencyconsumed power (kW)ΔP (kPa)
Blower1.0457589.63.86
Pump3.367513.76330
Heat exchangersTypeHot inlet-outlet temperature (°C)Cold inlet-outlet temperature (°C)Base duty (kW)
E-1Intercooler52.6–4020–254020
E-2Cooler92.8–4820–254279
E-3Intercooler50.3–3920–251100
E-4Intercooler52–41.120–251200
E-5Intercooler60.3–51.320–251000
E-6Condenser94.1–43.320–25780
E-7Process Exchanger123.5–92.855–873680
E-8Process Exchanger127.2–123.5114.2–115.5440
E-9Heater (reboiler)153–13345–1277420
Table 5. Validation of simulated results with important parameters of the CCU plants.
ParameterActual ValueValues of Simulated ResultsError (%)
Heat consumption (kW)780074204.80
Blower power (kW)94.289.64.80
Pump (kW)14.4313.764.60
CO2 mass flow rate (kg/h)560456570.90
CO2 composition (mol %)95.595.50
Temperature of lean stream 20126127.20.95
Pressure of lean stream 202.352.350
MEA rate in lean amine (kmole/h)547.9549.10.22
CO2 rate in lean amine (kmole/h)93.593.70.21
MEA content in lean amine (% mass)28.95290.17
CO2 content in lean amine (% mass)3.563.570.28
Temperature of rich stream 8 52.5542.86
Temperature of rich stream 1787870
Temperature of semi lean stream 191161150.86
MEA content in Rich amine (% mass)27.611527.60.04
CO2 content in Rich amine (% mass)7.96547.960.06
MEA rate in rich amine (kmole/h)548.234547.860.06
CO2 rate in rich amine (kmole/h)219.5219.270.10

