Abstract
Respimat®Soft MistTM is a newly developed spray inhaler. Different from traditional nebulizers, metered-dose inhalers, and dry powder inhalers, this new type of inhaler can produce aerosols with long duration, relatively slow speed, and a high content of fine particles. Investigating the effect of the key geometric parameters of the device on the atomization is of great significance for generic product development and inhaler optimization. In this paper, a laser high-speed camera experimental platform is built, and important parameters such as the geometric pattern and particle size distribution of the Respimat®Soft MistTM are measured. Computational fluid dynamics (CFD) and the volume of fluid method coupled with the Shear Stress Transport (SST) k-ω turbulence model are applied to simulate the key geometric parameters of the device. The effects of geometric parameters on the spray velocity distribution and geometric pattern are obtained. The angle of flow collision, the sphere size of the central divider and the length and width of the flow channel show significant impacts on the spray atomization.
1. Introduction
The efficacy of inhaled drugs largely depends on the amount and location distribution of the drug deposited in the lungs. It is also affected by various interaction factors, including the nature of the aerosol, types of the delivery equipment, modes of inhalation and the airway structure [1]. The characteristics of the aerosol affect the amount of drug inhaled into the lungs. The method of producing fine particles for pulmonary delivery and the particle size distribution significantly affects drug deposition in the airway [2,3].
The Respimat®Soft MistTM Inhaler is a new generation, multi-dosed inhalers [4] for respiratory medicine delivery developed by Boehringer Ingelheim, as shown in Figure 1a. The function of the device is to force a metered dose of drug solution through a unique and precise engineering nozzle, creating two extremely fine colliding liquid jets [5,6] that act to form a slow-moving and inhalable soft mist cloud [7]. The release rate of aerosol from the nozzle can reach one tenth of the pressurized metered dose inhaler (pMDI) [8]. The amount of fine particles in the aerosol cloud produced by Respimat®Soft MistTM is higher than that of the conventional portable inhaler devices. The high fraction of the fine particles produced, relatively longer generation time of aerosol cloud, together with the slow velocity of the soft mist, makes the drug easier to reach the lungs rather than being deposited in the oropharynx [4].
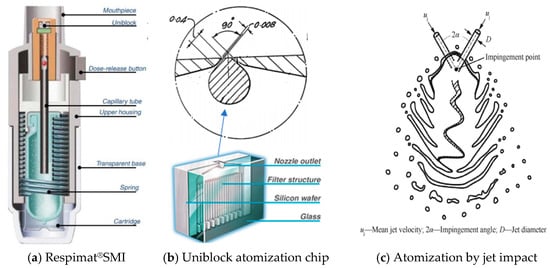
Figure 1.
Components of Respimat®SMI Inhaler and mechanism of atomization [11].
The drug supplied by Respimat® Soft MistTM is stored as solution in the cartridge. The cartridge consists of an aluminum cylinder with a double-walled plastic collapsible bag which will shrink as the medicine solution is pulled out. The spring is compressed by twisting the device base for 180°, which transfers the pre-set metered volume of solution from the cartridge through a capillary check valve to the pump cylinder.
Uniblock atomization chip is the key component of the Respimat®Soft MistTM, as shown in Figure 1b. It consists of several extremely fine filter channels. Utilizing the technology derived from microchip production [5,6,9], the inlet, outlet, and filter channels that prevent nozzle clogging are etched into the silicon wafer, enabling the component to be largely and precisely produced [10].
Inlet and outlet channels of the Uniblock are designed to produce high amounts of fine particles (droplet diameters <5.8 μm) that rely on the physical principles of impinging jet dynamics and atomization. Xiaodong Chen et al. [11] have verified the action mode of the double impinging jet by high-fidelity simulation combined with experiments. The impinging jets will initially form a liquid sheet. Under the effect of large-scale waves, the sheet breaks into a series of liquid belts and droplets due to instability, as shown in Figure 1c. These waves have two kinds of sources, namely aerodynamics and hydrodynamics. The aerodynamic waves cause relatively flat liquid sheet to break in the downstream region, and the hydrodynamic waves generate impact at the convergence point [12]. In short, the sources of fragmentation and atomization are from aerodynamic waves and hydrodynamic waves, and the factors that affect the occurrence and intensity of the waves and the flow characteristics of the impinging jet are the collision angle, the length of the pre-jet flow, the diameter of the jet, jet velocity distribution, Weber number, and Reynolds number of the jet.
There are great differences between the working conditions set in the above research and in the Uniblock. The velocity and pressure of the liquid in Uniblock are much larger. The nozzle is in microscale and much tinier than the existing research scale. The jet characteristics of the physical summaries of the device from existing studies requires further investigation and verification. First of all, it is necessary to design appropriate experimental methods and devices that meet the requirements to achieve the measurement on key parameters of the Respimat®Soft MistTM. In addition, direct molding for new structures nozzles will cost much manpower and material resources. Thus, simulation can be carried out to obtain some results, which can provide important guidance for future atomization chip development.
The volume of fluid (VOF) method [13] is a well-established Euler numerical method for free surface tracking, which describes the variation of free surface by tracking the volume fraction of the target fluid in grid unit. Based on the VOF method, this paper numerically simulated the jet flow and atomization of the Uniblock atomization chip (a core component of the Respimat®Soft MistTM). Several cases were designed for simulation in which some key geometric sizes were adjusted. Some effective predictions were obtained and the feasibility of VOF method in the development of atomization chips was verified.
2. Experimental Measurements of Respimat®Soft MistTM
In the experimental study, the device was used to measure the physical parameters described below. Since the original parameters of the device need to be measured, the liquid inside the device is the original drug, which is the tiotropium bromide solution.
2.1. Principles and Experimental Methods of Measuring Spray Pattern
When the light passes through the colloid, the path of the appearing light in the colloid can be observed from the direction perpendicular to the incident direction of the light, i.e., the Tyndall effect. Therefore, it is feasible to capture the soft mist cloud generated by the Respimat®Soft MistTM (Boehringer Ingelheim Pharma GmbH, Binger Straβe 173, Germany), which is also a kind of aerosol, by laser irradiation. In this paper, the EoSens3CL (MC3010) high-speed camera produced by Mikrotron GmbH (Landshuter str. 20-22, 85716 unterschleissheim, upper bavaria, Germany) was set up to shoot through a complete spray process at the speed of 2000 frames per second aiming at capturing a series of cross-sectional images of the soft mist cloud. The version 1.1 image capture card produced by Teledyne DALSA (Room G, 20th Floor, No. 18, North Caoxi Road, Xuhui District, Shanghai) was used to receive the photos on a computer. The positions of the devices are shown in Figure 2.
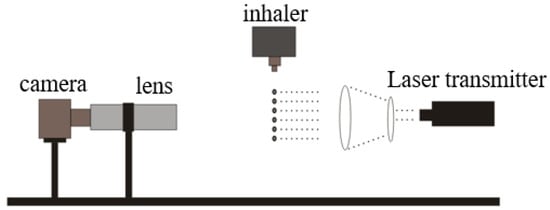
Figure 2.
High-speed laser camera experimental platform.
The platform for fixing the Respimat®Soft MistTM was adjusted until the center of the nozzle was placed within the light thickness range of the laser light source. Then the flow field protection cover made of high-transmission acrylic plate which was located above the platform would be closed. The shooting operations were conducted by the computer after the position and focus of the camera were adjusted.
Matlab was used to process the obtained photos. Firstly, the average grayscale of photos in each trigger spray series was calculated, and the photo with the largest value was picked out as the measurement object of this series. For example, Figure 3 shows one series of average grayscale values after photos processing. The photo taken at 690 ms after triggering the inhaler has the largest grayscale value, thus it will be selected as the measurement object.
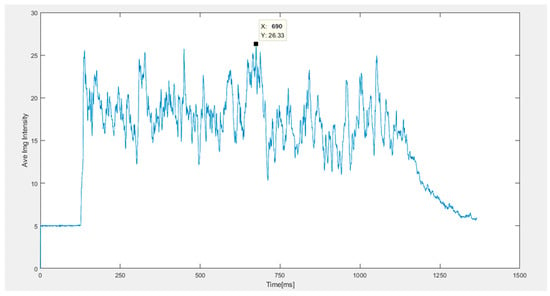
Figure 3.
Average grayscale distribution of photos taken by high-speed camera.
The selected photos need further post-processing. The photo displayed in grayscale was converted into a heatmap photo after color processing. The nozzle center was a reference point, and the maximum distance of the upper and lower soft mist diffusion at 60 mm from the reference point was measured. Then two angles could be calculated by the arctangent function. The spray angle was the sum of the upper and lower angles and the width was the sum of two distances, as shown in Figure 4.
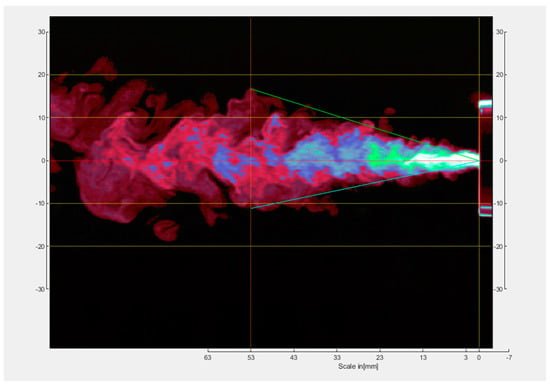
Figure 4.
Measurement of geometric pattern.
2.2. Results of Spray Pattern Measurement
Measurement was conducted for 5 times at the beginning, middle and end of the life cycle of the Respimat® Soft MistTM product. Results of the experiments are shown in Table 1.

Table 1.
Experimental results of spray angle and width.
2.3. Principles and Experimental Methods of Measuring Particle Size Distribution
When the beam encounters particle blocking, part of the light will scatter, and an angle will form between the scattered light and the main beam. The dimension of the scattering angle is related to the size of the particles. The larger the particles, the smaller the scattering angle will be. By measuring the intensity of the scattered light at different angles, the particle size distribution of the sample can be obtained.
It should be noted that the particles produced by Respimat®Soft MistTM are liquid particles, thus, it is necessary to ensure that the particles will not shrink by evaporation which will cause measurement inaccuracy. A humidity control box was built outside the laser particle size analyzer to maintain the required measurement environment. The particle size distribution under different humidity conditions can also be measured with the box.
2.4. Results of Particle Size Distribution Measurement
Results of particle size distribution of Respimat®Soft MistTM measurements are shown in Figure 5a, where D50 represents the particle size for which 50% of the measured particles are less than or equal to this size. For example, if D50 is 4.78 μm in one test, it means that 50% of the particles are less than or equal to 4.78 μm. The same applies to D90. Both D50 and D90 are used to represent particle size distribution, while the volume means diameter (VMD) is the volume average to express the overall particle size level. Figure 5b shows the pattern of particle size distribution under different flow velocity. The number of repeat tests for each variable was 3.
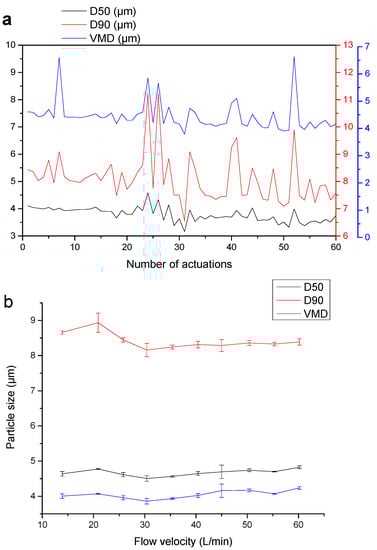
Figure 5.
(a) Pattern of particle size distribution vs. the number of actuations; and (b) pattern of particle size distribution under different flow velocity.
3. Model Settings of Numerical Simulation
3.1. VOF Method
VOF method was adopted to simulate the process of liquid injection and atomization from a nozzle on a two-dimensional level in ANSYS Fluent® 19.0 (Room 1351-52, Building 3, Kerry Plaza, No. 1, Zhongxin 4th Road, Futian District, Shenzhen). The SST k-ω model combines the advantages of the k-ω model in the near-wall region calculation and the advantages of the k-epsilon model in the far-field calculation. A lateral dissipation derivative term is also incorporated in the equation and the definition of the turbulent viscosity is modified by taking the turbulent shear stress into account, which makes the transport process more widely applicable, so this turbulence model was selected in this paper. The total volume of water and air remains unchanged during the spraying process, the density is almost constant, and the compressibility of the fluids has negligible effect on the spray atomization, so the incompressible model was adopted. It is considered that the atomization process is an isothermal process and does not involve the calculation of the energy transport equation. The medium in the two-phase flow of the simulation are air and liquid, and there is no reaction between the medium, so there is no mass source phase or phase exchange term. Based on the above simplified model, the main control equations were established as follows:
Volume fraction transport equation:
Sum of the volume fractions is 1:
In the formula:
f—volume fraction;
—density, kg/m3;
v—velocity, m/s;
q—the q phase.
In the solution process, only the transport equation of the n − 1 phase was solved, and the volume fraction of the main phase was determined by the limitation of the volume fraction, i.e., the sum of the volume fractions is 1.
3.2. Geometric Model and Meshing
The measurement of spray angle was conducted by the high-speed camera on the horizontal section of the soft mist cloud which passed through the center of the Respimat®Soft MistTM nozzle. The two-dimensional plane at the same position was selected for simulation, and Figure 6 shows the geometric model and its mesh. The part between nozzle inlet and outlet was selected as the geometric model. The size of the liquid phase inlet and the nozzle outlet were 2 mm and 10 μm, respectively. The model adopted a triangular unstructured grid, with a total of 331,513 grid cells. The smallest cell area was 2.45 × 10⁻⁶ m2, while the largest cell area was 3.08 × 10⁻⁴ m2.
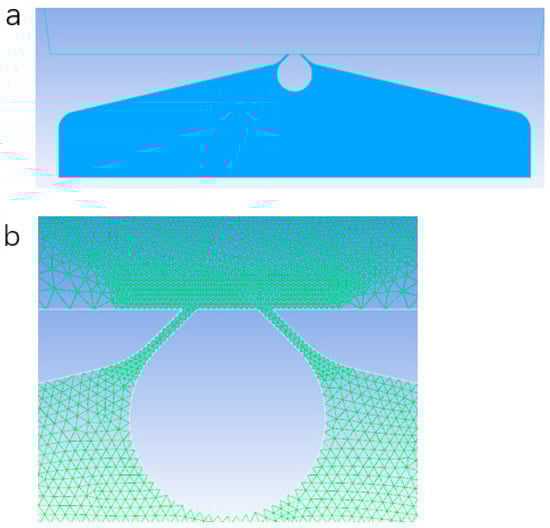
Figure 6.
(a) Geometric model; and (b) mesh.
In order to make smoother connection between the nozzle outlet and the outer space and to increase the accuracy of simulation, the grid of nozzle outlet and the area where was likely to be filled with soft mist was refined, while grid size of other areas were enlarged to increase the computational speed. The number of grids and its distribution kept consistent in the meshing settings after changing the geometric parameters to avoid the effect of grid differences on the simulation results.
3.3. Boundary Conditions and Model Settings
The inlet velocity was set to the velocity at the same position in the Respimat®Soft MistTM, which was 1 m/s. The multiphase flow was set to have a liquid volume fraction of 1, a turbulent intensity of 5%, and a hydraulic diameter of 2 mm. The outlet was a pressure outlet with a gauge pressure of zero.
Table 2 shows the detailed physical properties and model settings in ANSYS Fluent. Only water can be used as the filling substance in the new-structure atomization chip used to verify the numerical model. The substance in the numerical model and follow-up actual measurements must be consistent, so pure water is adopted as the liquid phase.
Table 2.
Summary of physical parameters and model settings for numerical simulation on nozzle of Respimat®SMI.
4. Results and Analysis of the Numerical Simulation
In the numerical simulation study, the spray angle, velocity and particle size distribution are used as parameters for comparison and evaluation. The velocity at nozzle exit refers to the maximum velocity that the liquid phase can reach in the center of the two flow channels of Uniblock chip. The velocity when the drops reach a stable state refers to the steady velocity at which the droplet no longer splits after the multi-stage splitting and the velocity no longer changes significantly. These two velocities are used to compare the velocity changes after adjusting the size of the chip structure.
4.1. Collision Angle
The collision angle was the variable in this set of simulation models while the angle of the liquid flow in Respimat®Soft MistTM inhaler was 90°. In the two comparison cases, the angle was either increased or decreased by 10%, as shown in Figure 7a.
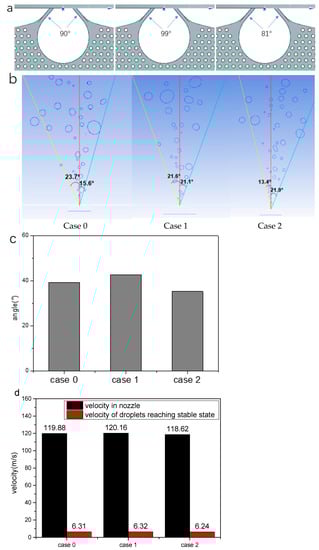
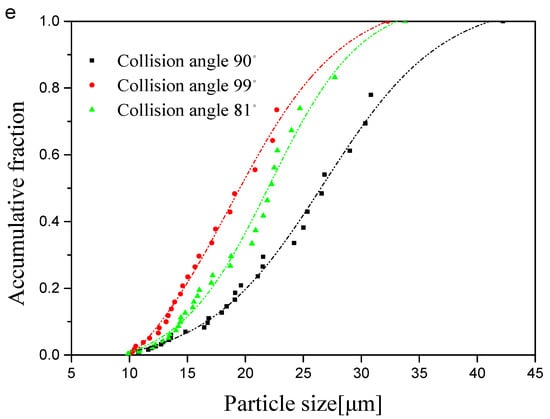
Figure 7.
Comparison of (a) collision angle of liquid flow; (b) atomization of the liquid phase; (c) spray angle; (d) velocity; and (e) particle size distribution between cases 0, 1, and 2.
In the comparison group, after the collision angle of the liquid flow was increased or decreased, the spray angle increased or decreased accordingly, as shown in Figure 7b,c. However, Figure 7d suggests that the variation of the collision angles did not impose further impact on the droplet velocity, neither the high velocity at the nozzle nor the low velocity after the deceleration was changed significantly. It could also be noted in Figure 7e that the particle size was decreased after the collision angle was either increased or decreased. Particles produced with a 90° collision angle may drop in the specific range of the size distribution, which is extremely suitable for inhalation.
4.2. The Size of the Central Sphere Used for Separation
In this set of comparisons, the size of the central sphere used for separation was decreased or increased by 4% compared to the Respimat®Soft MistTM, which thereby relatively changed the converge distance from the nozzle to the atmosphere, as shown in Figure 8a.
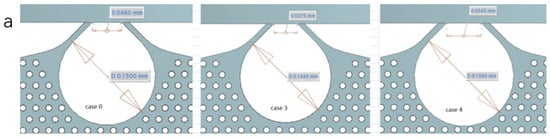
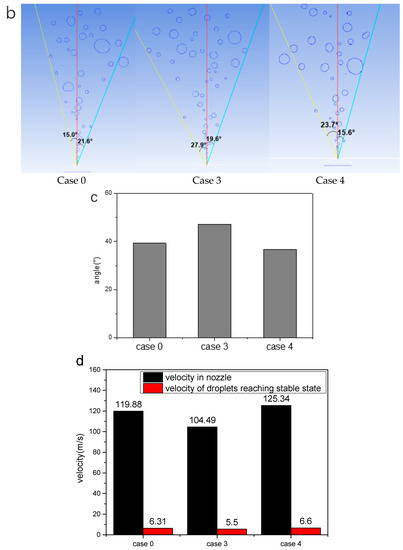
Figure 8.
Comparison of (a) size of central sphere; (b) atomization of the liquid phase; (c) spray angle; (d) velocity; and (e) particle size distribution between cases 0, 3, and 4.
Based on the comparison results shown in Figure 8b–d, it could be seen that the spray angle would increase and the liquid phase velocity would decrease when the size of the central sphere decreased and vice versa. The size variation of the central sphere correspondingly changed the flow area, which then directly affected the flow velocity, and the change conformed the relationship between the flow velocity and the flow area. For a single jet, the fluctuations and turbulence in the flow tended to be greater at a longer distance. For a double collision jet, the aerodynamic wave was caused by the interaction on the gas-liquid interface to cause the relatively flat liquid film to be interrupted in the downstream area, and the hydrodynamic wave was generated at the point of jet impact to affect the liquid sheet. Combining the flow field of the liquid sheet and its vicinity, it was still consistent with the phenomenon at the microscopic scale. After increasing the size of the central sphere, the stroke of the two single jets before convergence increased. The interaction between the gas and the liquid increased the disturbance of the jet, leading to a more violent fluctuation in the liquid sheet and an earlier break down.
Moreover, decreasing the size of the central sphere did not cause a significant change in particle size. As shown in Figure 8e, after the sphere size was increased, the particle size decreased significantly. It could be explained that by increasing the size of the sphere, the stroke of the two jets in the atmosphere before converging would also increase. Thus, the gas-liquid interaction would be more sufficient and the jet disturbance would be more intense to produce finer particles.
4.3. The Depth of the Fluid Channel
The depth of the fluid channel was adjusted in this group of simulation model for parameter comparisons, as shown in Figure 9a.
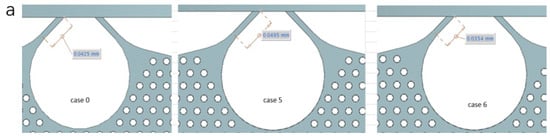
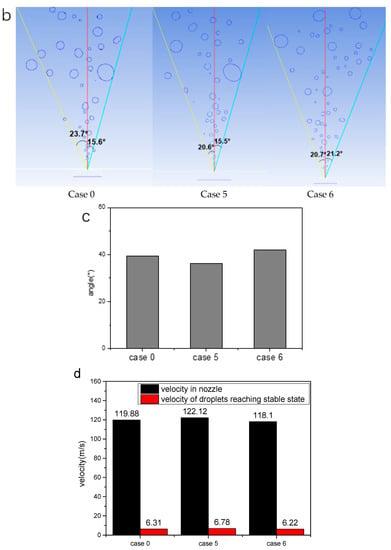
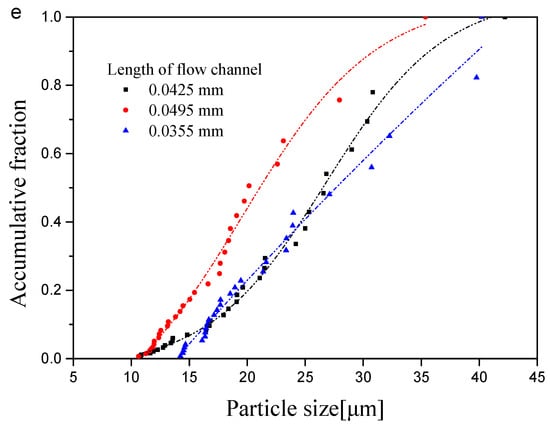
Figure 9.
Comparison of (a) depth of the fluid channel; (b) atomization of the liquid phase; (c) spray angle; (d) velocity and (e) particle size distribution between cases 0, 5, and 6.
In this comparison group, after the nozzle length was increased, the spray angle decreased, and the liquid flow velocity increased, and vice versa, as shown in Figure 9b–d. At the macro scale, the flow disturbance generated by the nozzle tends to grow faster when the Reynolds number is larger and the nozzle is longer. At the micro scale, which the current research applied, the longer nozzle did not add disturbance to the jet, but the short nozzles brought better separation and fragmentation to the liquid flow.
Figure 9e indicates that after the length of the flow channel was increased, the particle size decreased significantly. Decreasing the flow channel length led to an opposite result (i.e., the particle size increased), but the variation was relatively small. After the nozzle was lengthened, the stroke of the liquid flow in the tube was increased and more disturbances were applied to the flow, which made the liquid sheet fluctuate more violently, so that the droplets with smaller particle size were produced.
4.4. The Width of the Fluid Channel
The width of the fluid channel was adjusted in this group of simulation for parameter comparison, as shown in Figure 10a. The comparison group was increased or decreased by 0.0010 mm based on the width of the Respimat®Soft MistTM, which was 0.0080 mm.
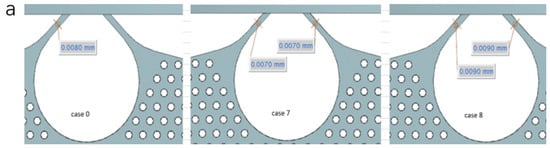
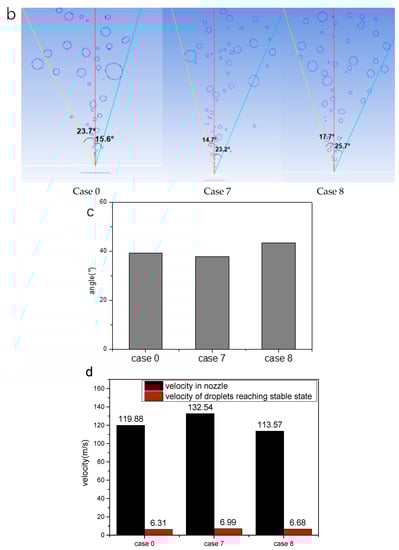
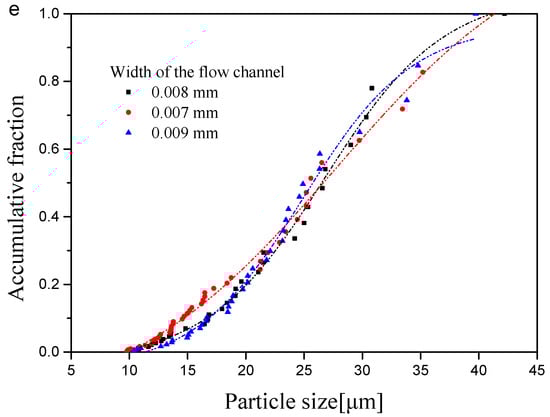
Figure 10.
Comparison of (a) width of the fluid channel; (b) atomization of the liquid phase; (c) spray angle; (d) velocity and (e) particle size distribution between cases 0, 7, and 8.
From the simulation results shown in Figure 10b–d, it could be seen that after changing the width of the fluid channel, the flow cross-sectional area was changed, so the liquid phase velocity changed accordingly. The same as the previous two comparison groups, the trend of changes in angle and velocity were opposite.
Figure 10e indicates that after the flow area of the flow channel increased and decreased, the overall particle size did not change significantly. It seems that changing the flow area only affected the flow velocity in the nozzle and thus had an impact on the spray angle, but it did not have any effect on disturbance. As a result, the particle size did not change significantly.
5. Discussion
The experimental data reveals that the geometric pattern of the Respimat®Soft MistTM is not affected by the number of sprays. The measured angle and width of the triggered spray fluctuate randomly around the average value, meanwhile it is not much different from the average value, which indicates the stable performance of the product in usage. The spring pressure and pump dosage are balanced and stable during the life cycle of the product. For each spray, the small difference in the geometric pattern from the inhaler ensures small variation of the amount of medicine delivered to patients during usage.
The soft mist produced by Respimat®Soft MistTM does not have much variance in particle size. The fine particles of the product are very stable, which also ensures the consistency of the drug intake during use. The percentage of fine particles is extremely high. The particle size does not change with different flow rate, which ensures a consistent lung deposition for different patients with different inhalation strength.
The liquid phase velocity and the spray angle are negatively correlated after geometric design parameters are adjusted. While the angle is increased, the flow velocity decreases accordingly. The spray angle is mainly affected by the velocity and has no direct relationship with the fluctuation of the liquid sheet. On the scale studied in this paper, the above-mentioned velocity changes are not strong enough to affect the Reynolds number of the jet. The velocity does not directly affect the liquid sheet disturbance, which is also reflected in the simulation results.
By comparing the simulation results of the three groups of key parameters, slight adjustment of the collision angle can directly affect the spray angle without significant impact on the velocity. The size of the central sphere can directly affect the spray angle and velocity. Decreasing the size of the sphere will increase the spray angle and decrease the liquid phase velocity. Increasing the fluid channel length will decrease the spray angle and increase the flow velocity. During the study and development of the device, the effect of different parameters on the atomization can be combined to control the geometric pattern and spray velocity.
Regrettably, due to the conflicts between the number of grids and the calculation accuracy, a two-dimensional model was chosen and the number of grids was largely controlled. The numerical model is not a high-fidelity model. The degradation in dimensionality and the reduction in the grid would make the results obtained in the numerical simulation inconsistent with the actual measurement. The results from simulation were mainly used for lateral comparison to observe the change of particle size after adjusting a certain structure size. In future study, with the experimental verification and correction of the new-structure atomization chips, and the improvement of computing resources and grid technology, the experimental data and numerical data will be able to be docked and compared. In addition, due to the lack of a proper script which can accurately distinguish and depict the outline of the mist in the sliced photo and calculate the maximum diameter and minimum diameter to obtain the ellipticity, the spray pattern cannot be measured temporarily.
Respimat®Soft MistTM products have very broad prospects in future drug delivery and smoking cessation treatments. More parameters such as the impaction force, distribution kind, and the atomization process occurring while using the inhaler device still need to be explored. In follow-up studies, more numerical and experimental data need to be added to clarify the mechanism of the atomization chip, for further optimization of its performance.
Author Contributions
Data curation: Y.G. and F.H.; funding acquisition: Z.T.; investigation: Y.G.; methodology: Y.G.; software: Y.G.; supervision: Z.T.; writing—original draft: Y.G.; writing—review and editing: Y.G., Z.T., R.L., F.H. and J.Y. All authors have read and agreed to the published version of the manuscript.
Funding
Jiangsu Province for Distinguished Professorship Program and National (Zhenbo Tong); Natural Science Foundation of China (no. 51676043).
Institutional Review Board Statement
Not applicable.
Informed Consent Statement
Not applicable.
Data Availability Statement
Data is contained within the article. The data presented in this study are available in Numerical and Experimental Investigation on Key Parameters of the Respimat® Spray Inhaler.
Acknowledgments
I would like to express my gratitude to all those who helped me during the writing of this thesis. I gratefully acknowledge the help of my professor, Zhenbo Tong, who has offered me valuable suggestions in the academic studies. In the preparation of the thesis, he has spent much time reading through each draft and provided me with inspiring advice. Without his patient instruction, insightful criticism and expert guidance, the completion of this thesis would not have been possible. I also owe a special debt of gratitude to Project supported by the National Natural Science Foundation of China (51676043) and the Project supported by Distinguished Professor of Jiangsu (TONG Zhen-bo), which provided funds for experimental equipment and materials. I would finally like to express my gratitude to my beloved parents who have always helped me out with difficulties and supported me without a word of complaint.
Conflicts of Interest
All authors declare that there is no conflict of interest involved in this paper.
References
- Ganderton, D. General factors influencing drug delivery to the lung. Respir. Med. 1997, 91, 13–16. [Google Scholar] [CrossRef]
- Newman, S.P. Use of gamma scintigraphy to evaluate the performance of new inhalers. J. Aerosol Med. 1999, 12 (Suppl. 1), S25. [Google Scholar] [CrossRef] [PubMed]
- Pavia, D. Efficacy and safety of inhalation therapy in chronic obstructive pulmonary disease and asthma. Respirology 1997, 2 (Suppl. 1), S5. [Google Scholar]
- Dalby, R.; Spallek, M.; Voshaar, T. A review of the development of Respimat Soft Mist Inhaler. Int. J. Pharm. 2004, 283, 1–9. [Google Scholar] [CrossRef] [PubMed]
- Zierenberg, B. Optimizing the in vitro performance of Respimat. J. Aerosol Med. 1999, 12 (Suppl. 1), S19–S24. [Google Scholar] [CrossRef] [PubMed]
- Voshaar, T.; Hausen, T.; Kardos, P.; Köhler, D.; Schultzewerninghaus, G.; Schürmann, W.; Vogelmeier, C. Inhalation therapy with Respimat soft inhaler in patients with COPD and asthma. Pneumologie 2005, 59, 25–32. [Google Scholar] [CrossRef] [PubMed]
- Vincken, W.; Bantje, T.; Middle, M.V.; Gerken, F.; Moonen, D. Long-Term Efficacy and Safety of Ipratropium Bromide plus Fenoterol via Respimat((R)) Soft Misttrade mark Inhaler (SMI) versus a Pressurised Metered-Dose Inhaler in Asthma. Clin. Drug Investig. 2004, 24, 17–28. [Google Scholar] [CrossRef] [PubMed]
- Newman, S.P.; Steed, K.P.; Reader, S.J.; Hooper, G.; Zierenberg, B. Efficient Delivery to the Lungs of Flunisolide Aerosol from a New Portable Hand-Held Multidose Nebulizer. J. Pharm. Sci. 1996, 85, 960–964. [Google Scholar] [CrossRef] [PubMed]
- Dalby, R.N.; Eicher, J.; Zierenberg, B. Development of Respimat® Soft Mist™ Inhaler and its clinical utility in respiratory disorders. Med. Devices 2011, 4, 145–155. [Google Scholar]
- Hochrainer, D.; Hölz, H.; Kreher, C.; Scaffidi, L.; Spallek, M.; Wachtel, H. Comparison of the aerosol velocity and spray duration of Respimat Soft Mist inhaler and pressurized metered dose inhalers. J. Aerosol Med. 2005, 18, 273–282. [Google Scholar] [CrossRef] [PubMed]
- Chen, X.; Yang, V. Recent advances in physical understanding and quantitative prediction of impinging-jet dynamics and atomization. Chin. J. Aeronaut. 2019, 32, 45–57. [Google Scholar] [CrossRef]
- Chen, X.; Ma, D.; Yang, V. High-Fidelity Simulations of Impinging Jet Atomization. At. Sprays 2013, 23, 1079–1101. [Google Scholar] [CrossRef]
- Yin, X.; Zarikos, I.; Karadimitriou, N.K.; Raoof, A.; Hassanizadeh, S.M. Direct simulations of two-phase flow experiments of different geometry complexities using Volume-of-Fluid (VOF) method. Chem. Eng. Sci. 2019, 195, 820–827. [Google Scholar] [CrossRef]


Publisher’s Note: MDPI stays neutral with regard to jurisdictional claims in published maps and institutional affiliations. |
© 2020 by the authors. Licensee MDPI, Basel, Switzerland. This article is an open access article distributed under the terms and conditions of the Creative Commons Attribution (CC BY) license (http://creativecommons.org/licenses/by/4.0/).