Experimental and Numerical Analysis of the Mechanical Properties of a Pretreated Shape Memory Alloy Wire in a Self-Centering Steel Brace


Abstract
:1. Introduction
2. SMA Wire Tests
2.1. Test Materials
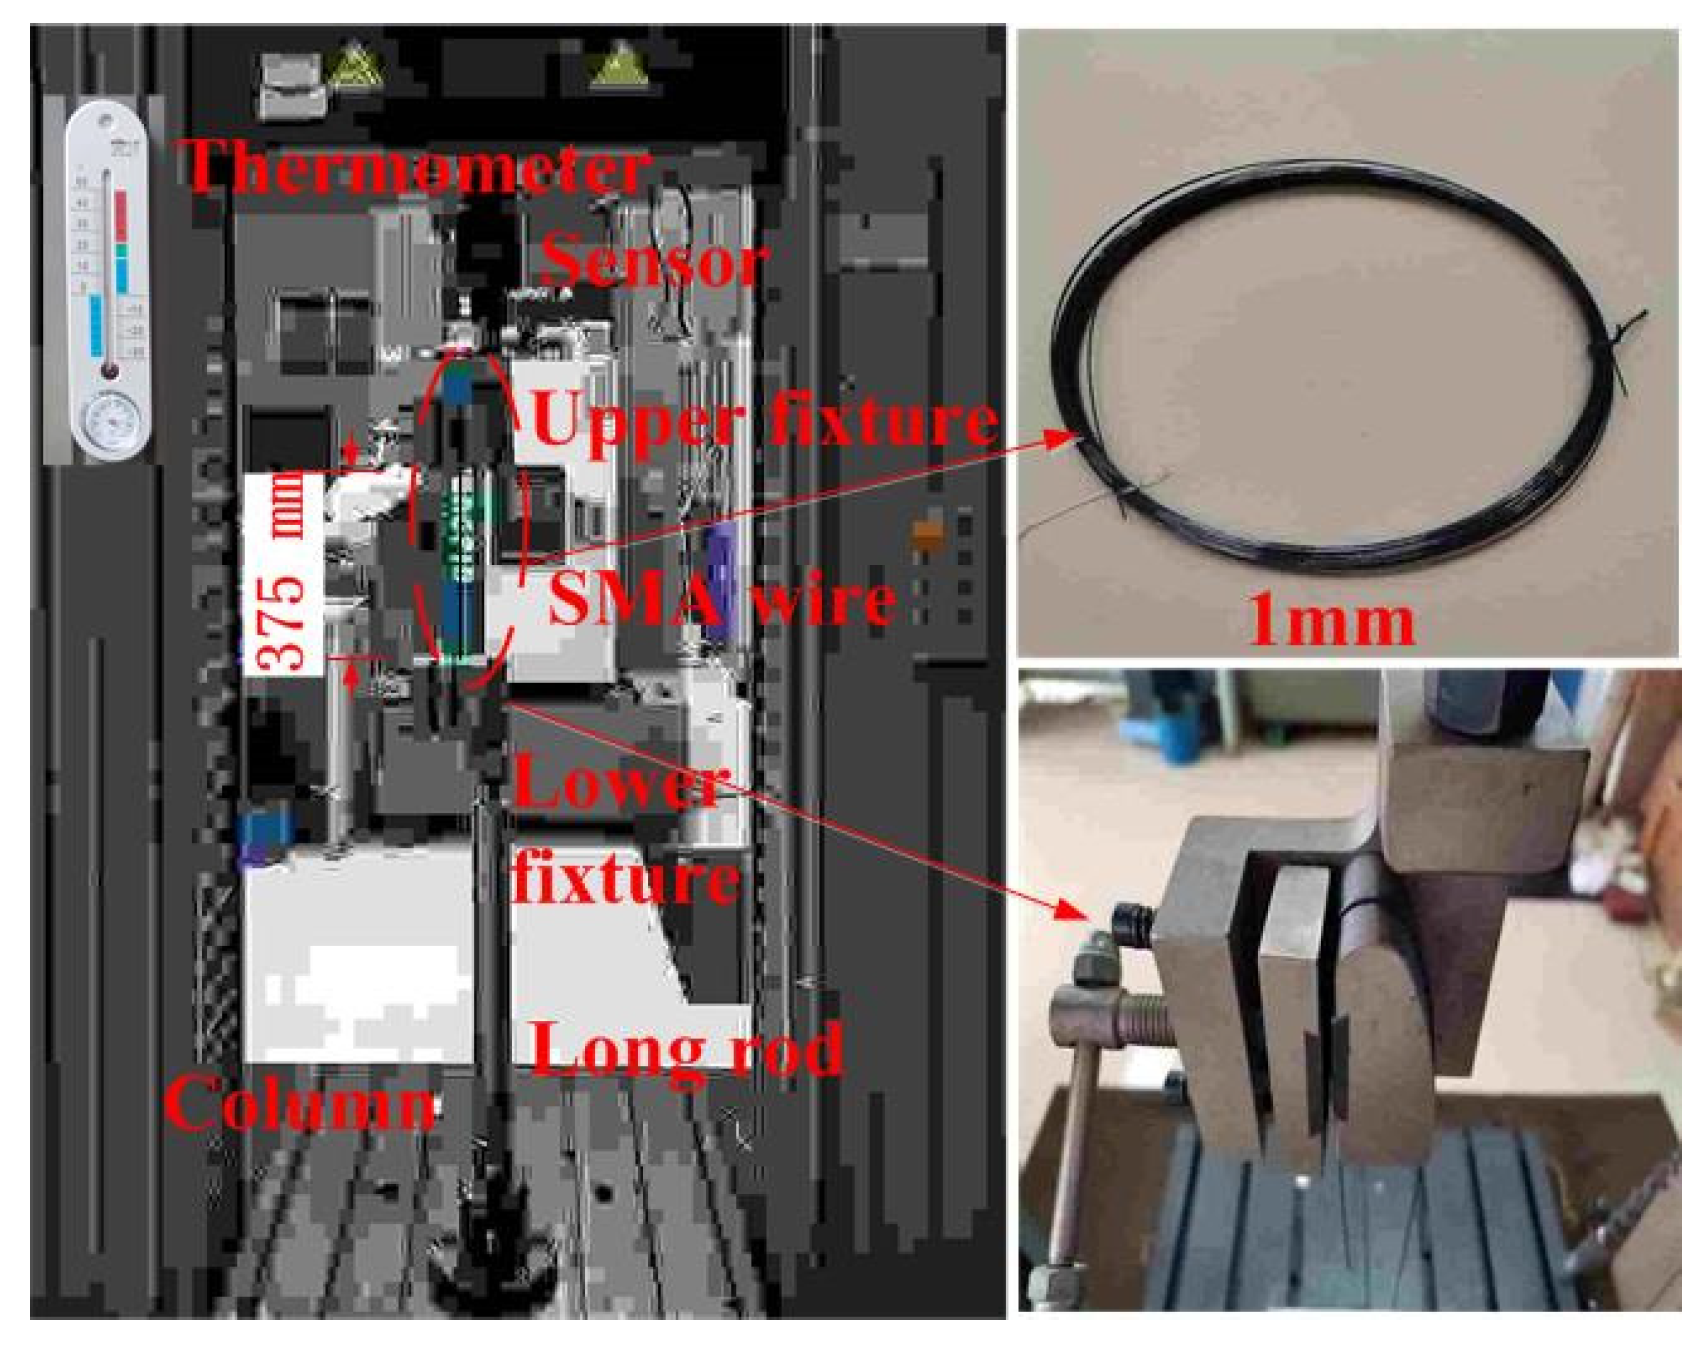
2.2. Test Setup
2.3. Test Cases
- Number of cycles. Only one test case studied the effect of number of cycles, and the strain amplitude was 0.06 for 30 cycles, whereas the initial strain was zero at a 0.45 mm/s loading rate and 0.0012/s strain rate, as in Qian [24].
- Strain amplitude. One test case studied the effect of strain amplitude, and the strain amplitudes were 0.005, 0.01, 0.02, 0.03, 0.04, 0.05, and 0.06, successively, whereas the loading rate was 0.45 mm/s, and the test was loaded for one cycle at a zero initial strain.
- Loading rate. Five test cases studied the effect of loading rate; a total of five SMA wire specimens were set, which were 0.225 mm/s, 0.450 mm/s, 0.675 mm/s, 0.900 mm/s, and 1.350 mm/s, respectively, whereas the strain amplitudes for each test case were 0.005, 0.01, 0.02, 0.03, 0.04, 0.05, and 0.06, successively, and all the tests were loaded for one cycle at a zero initial strain.
- Initial strain. Four test cases with four different initial strains studied the effect of the pre-tensioning, and the initial strains were set as 0.0025, 0.0050, 0.0075, and 0.0100, by applying a specified load, respectively, where the strain amplitudes for each test case were 0.005, 0.01, 0.02, 0.03, 0.04, 0.05, and 0.06, successively, and all the tests were loaded for one cycle at a 0.45 mm/s loading rate.
3. Test Results
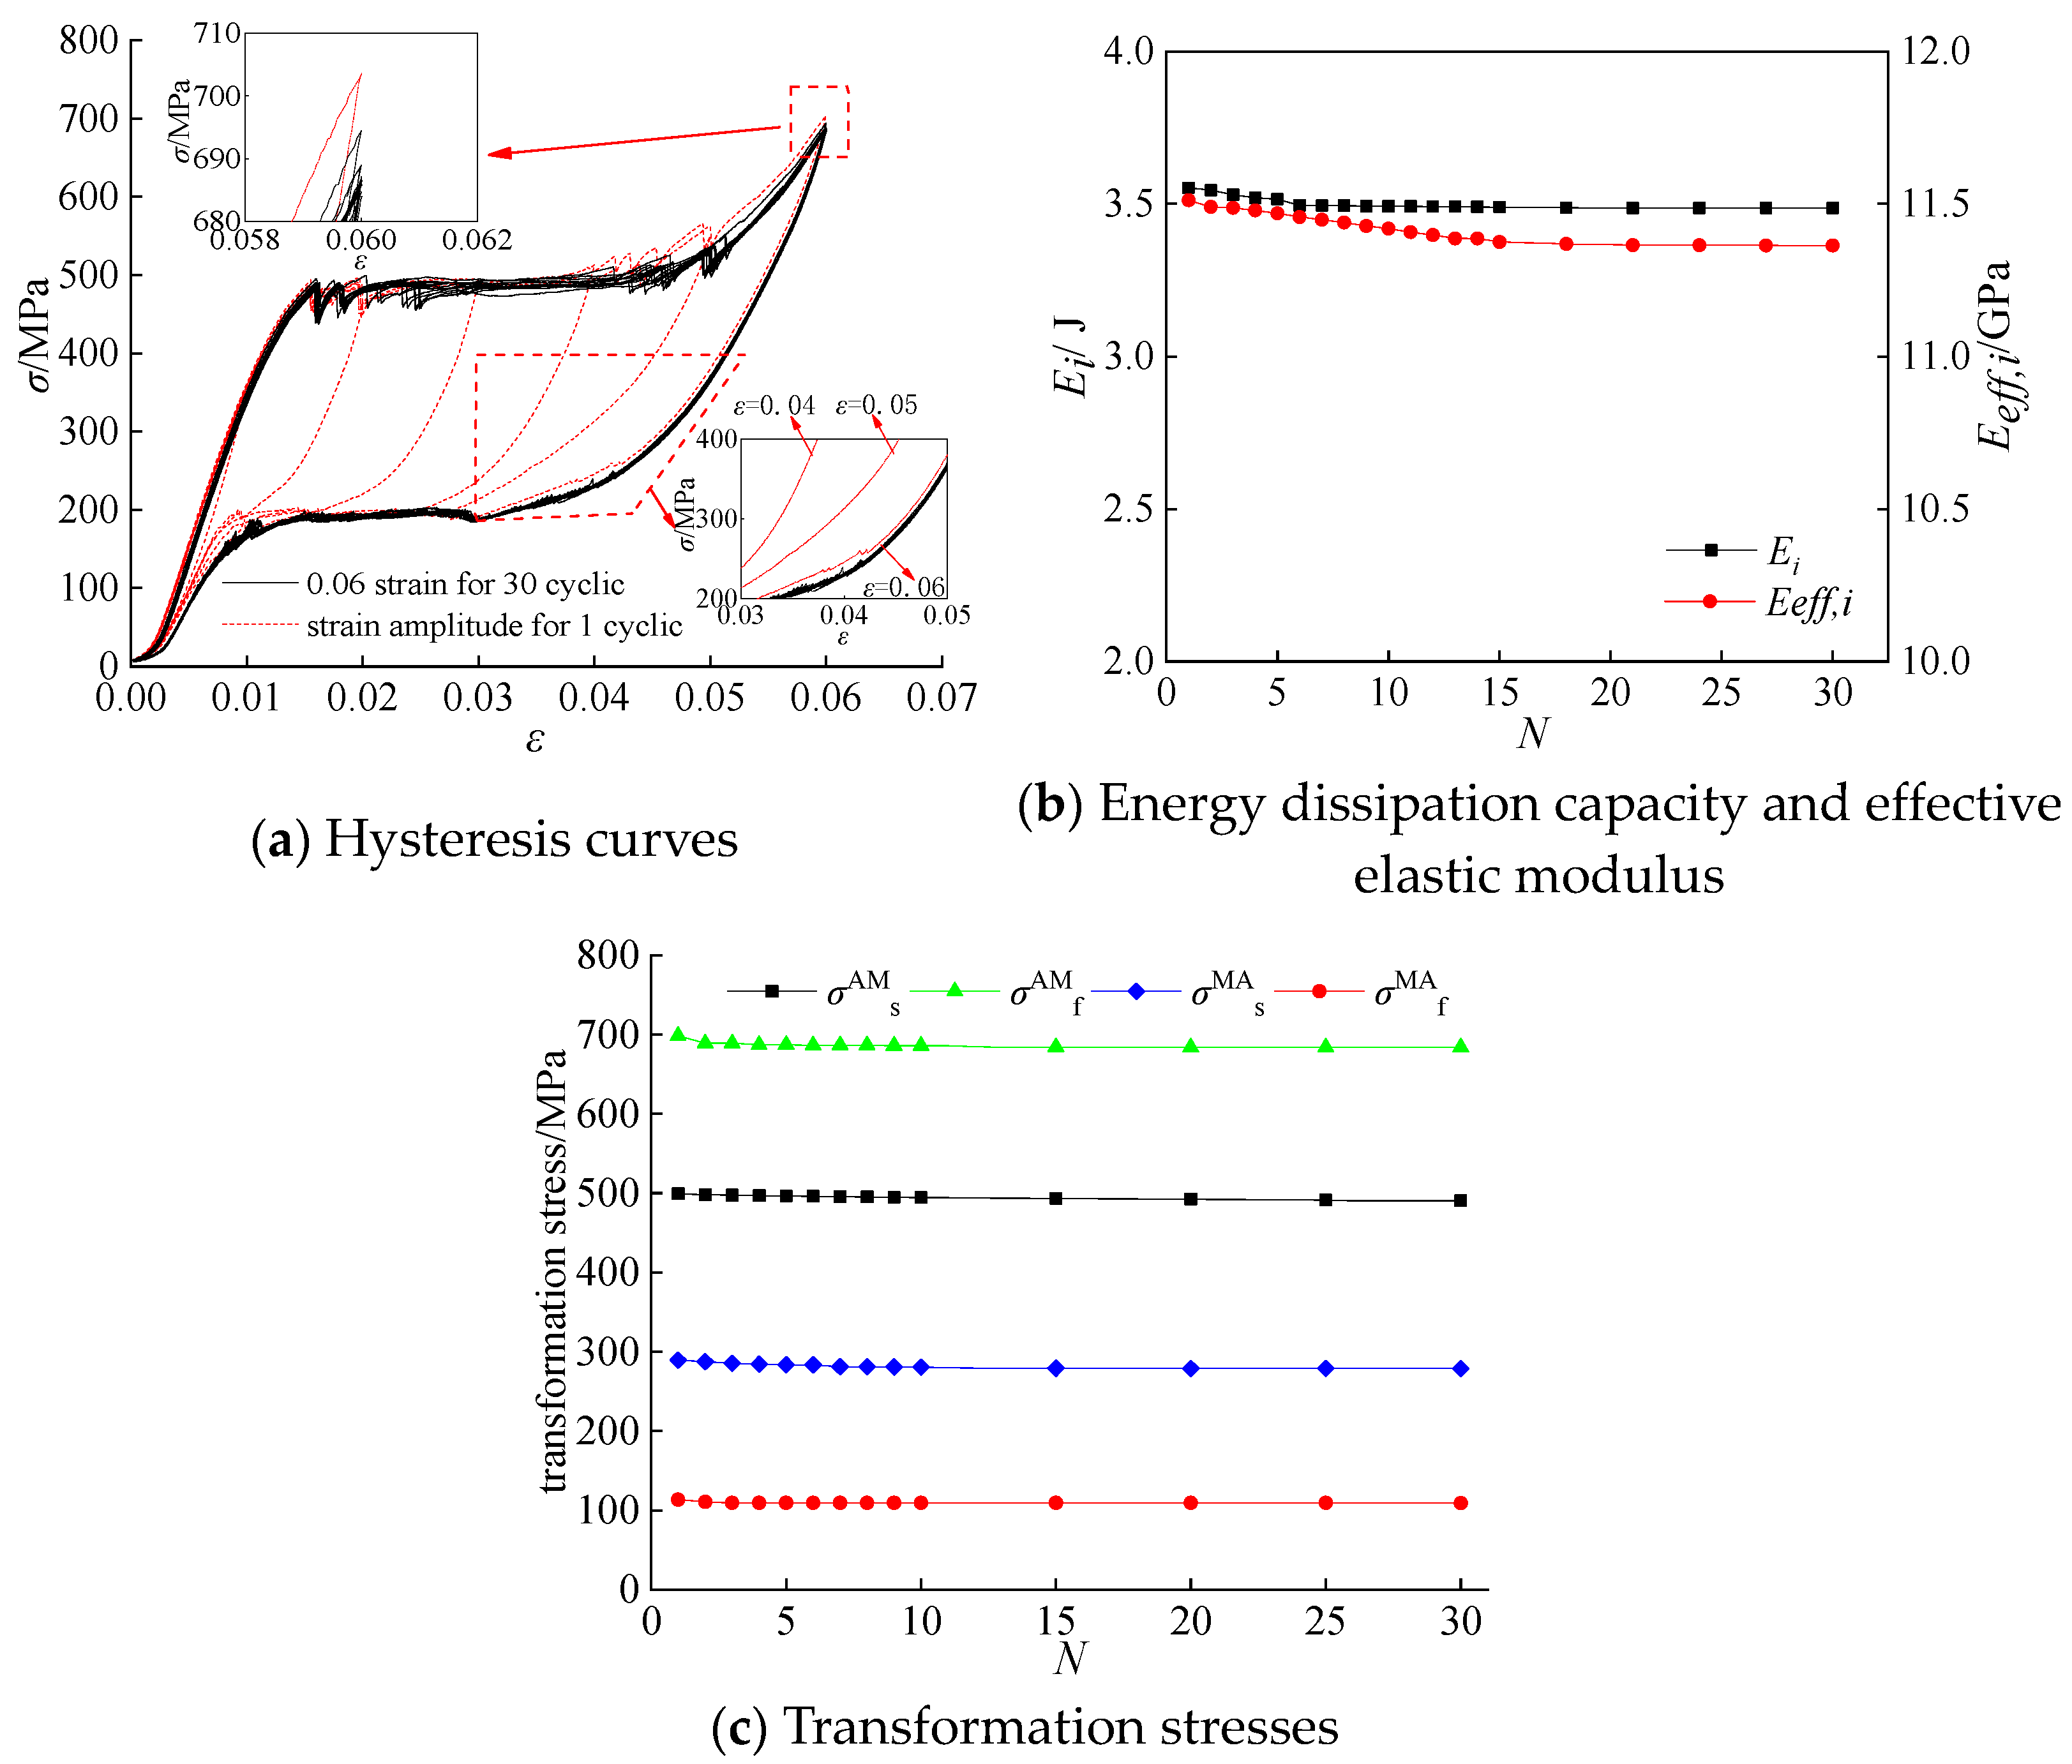
3.1. Effect of the Number of Cycles and Strain Amplitude
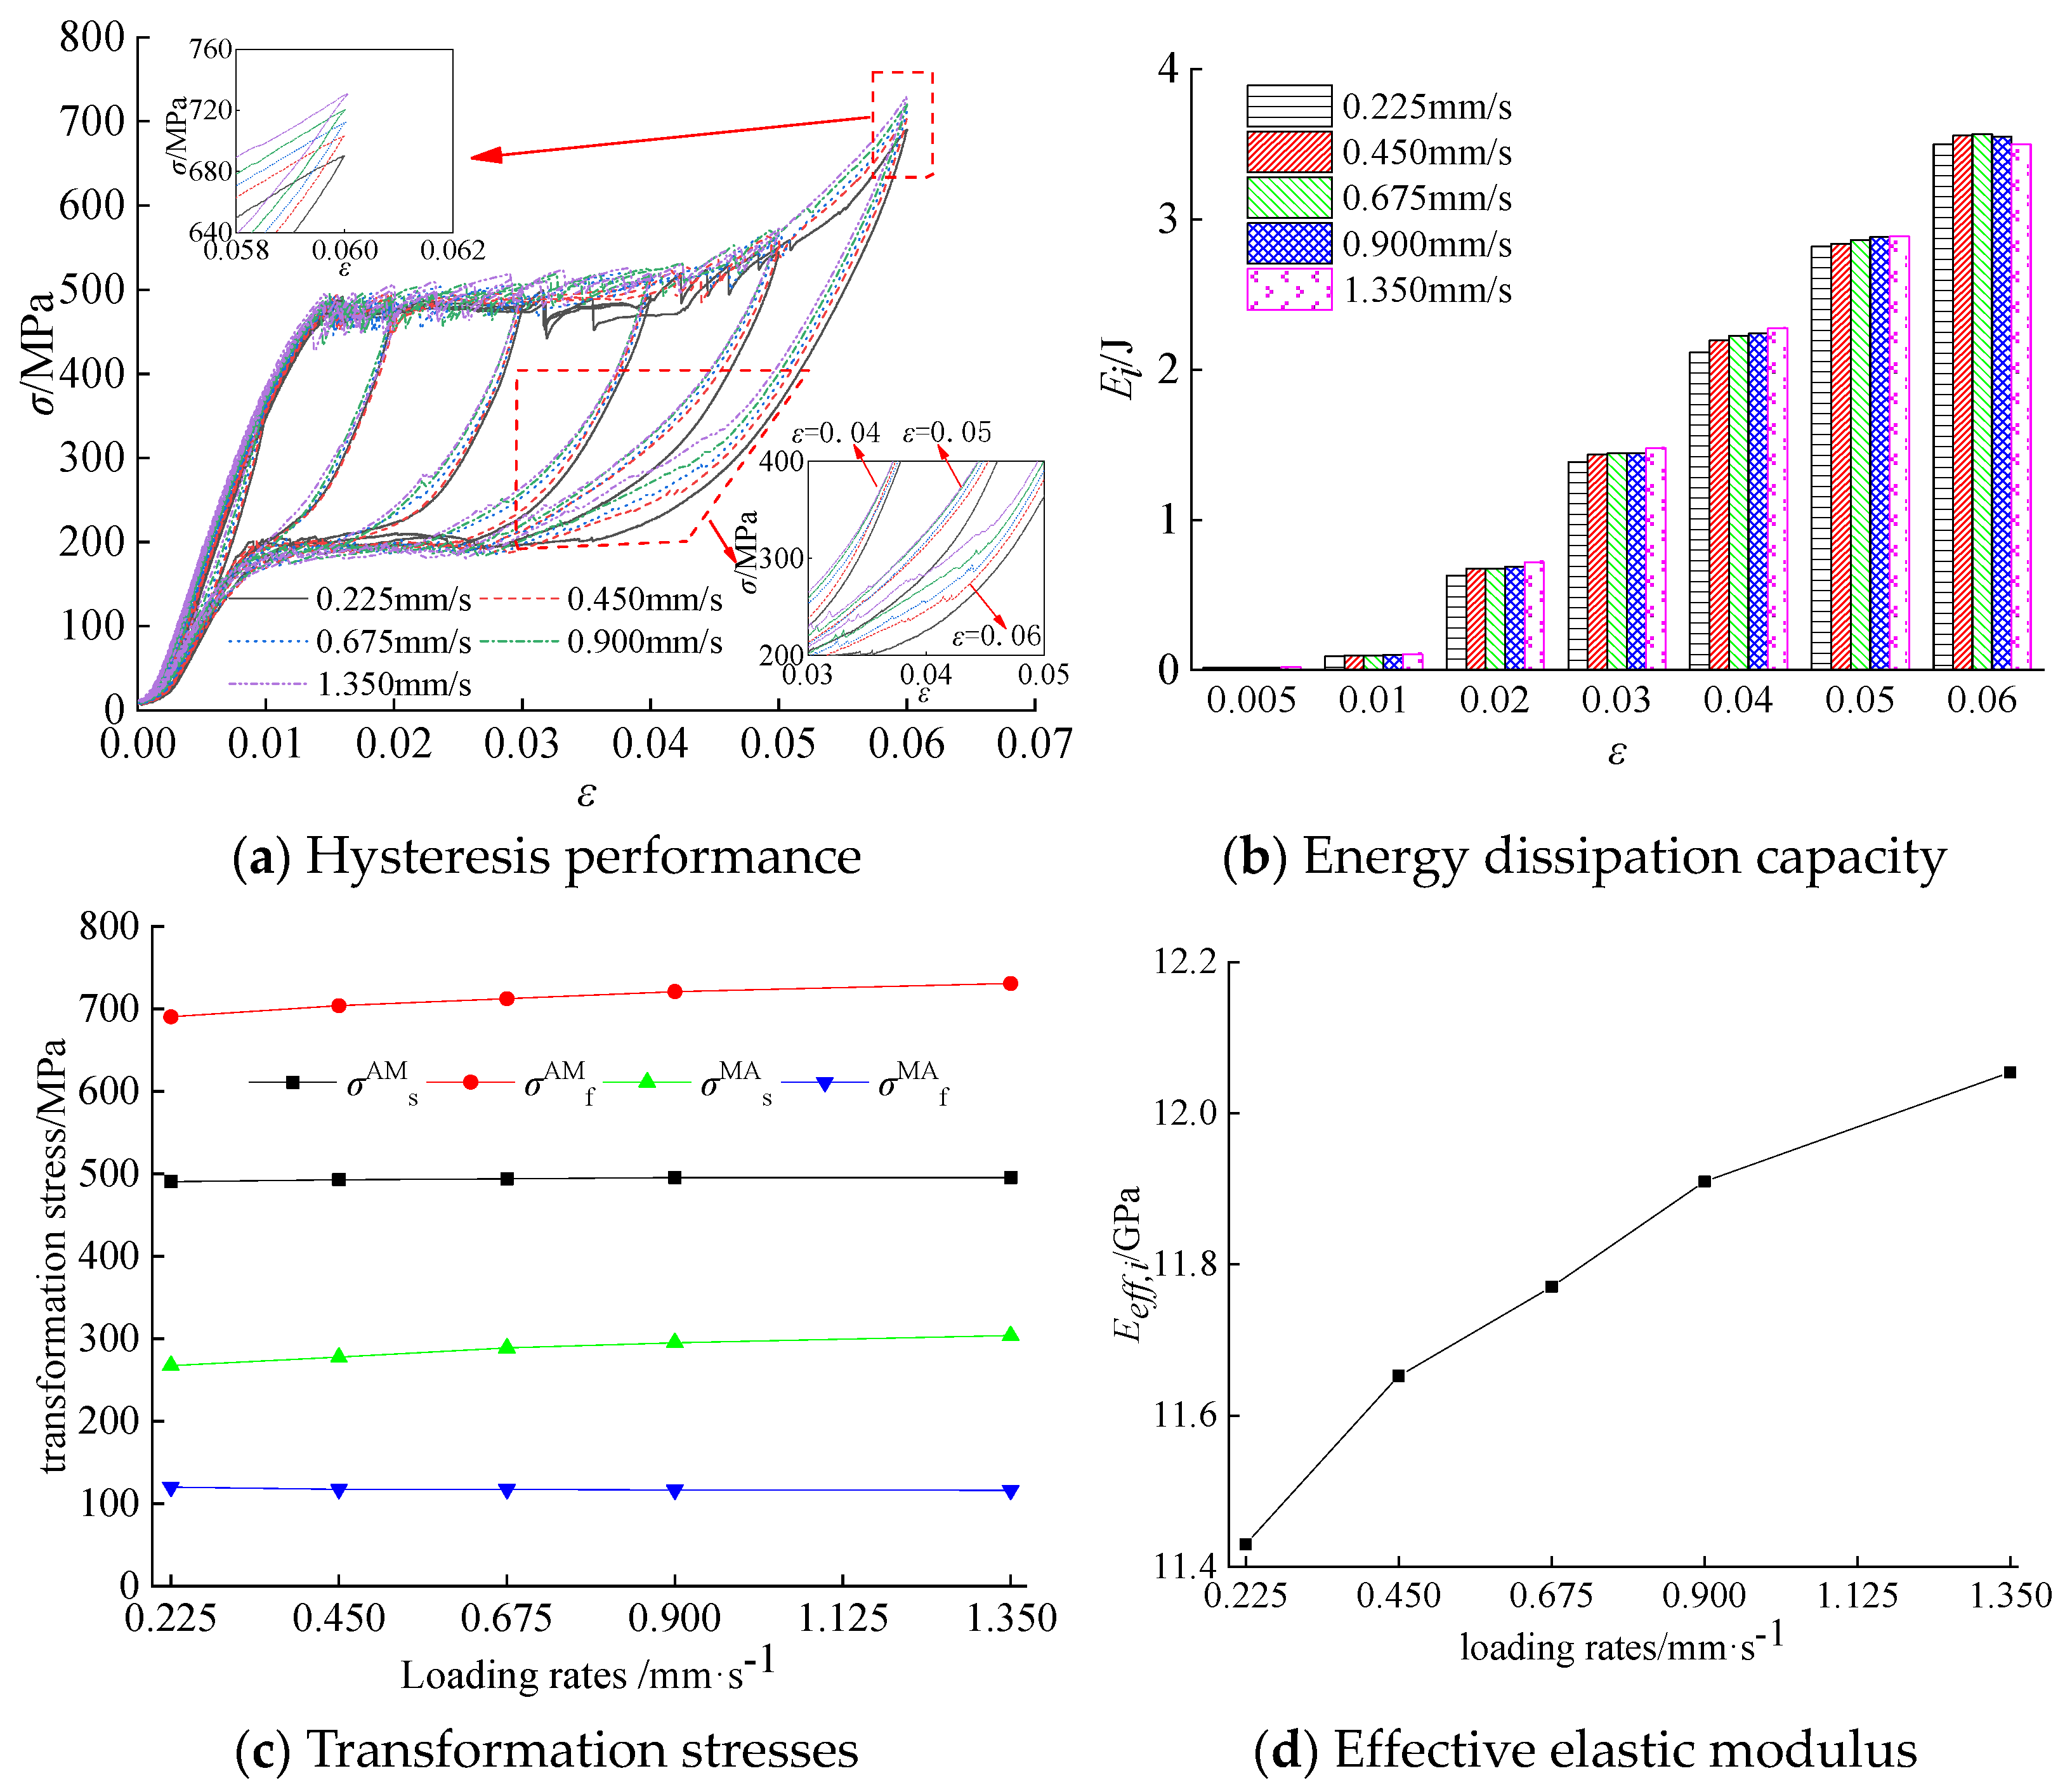
3.2. Effect of Loading Rates
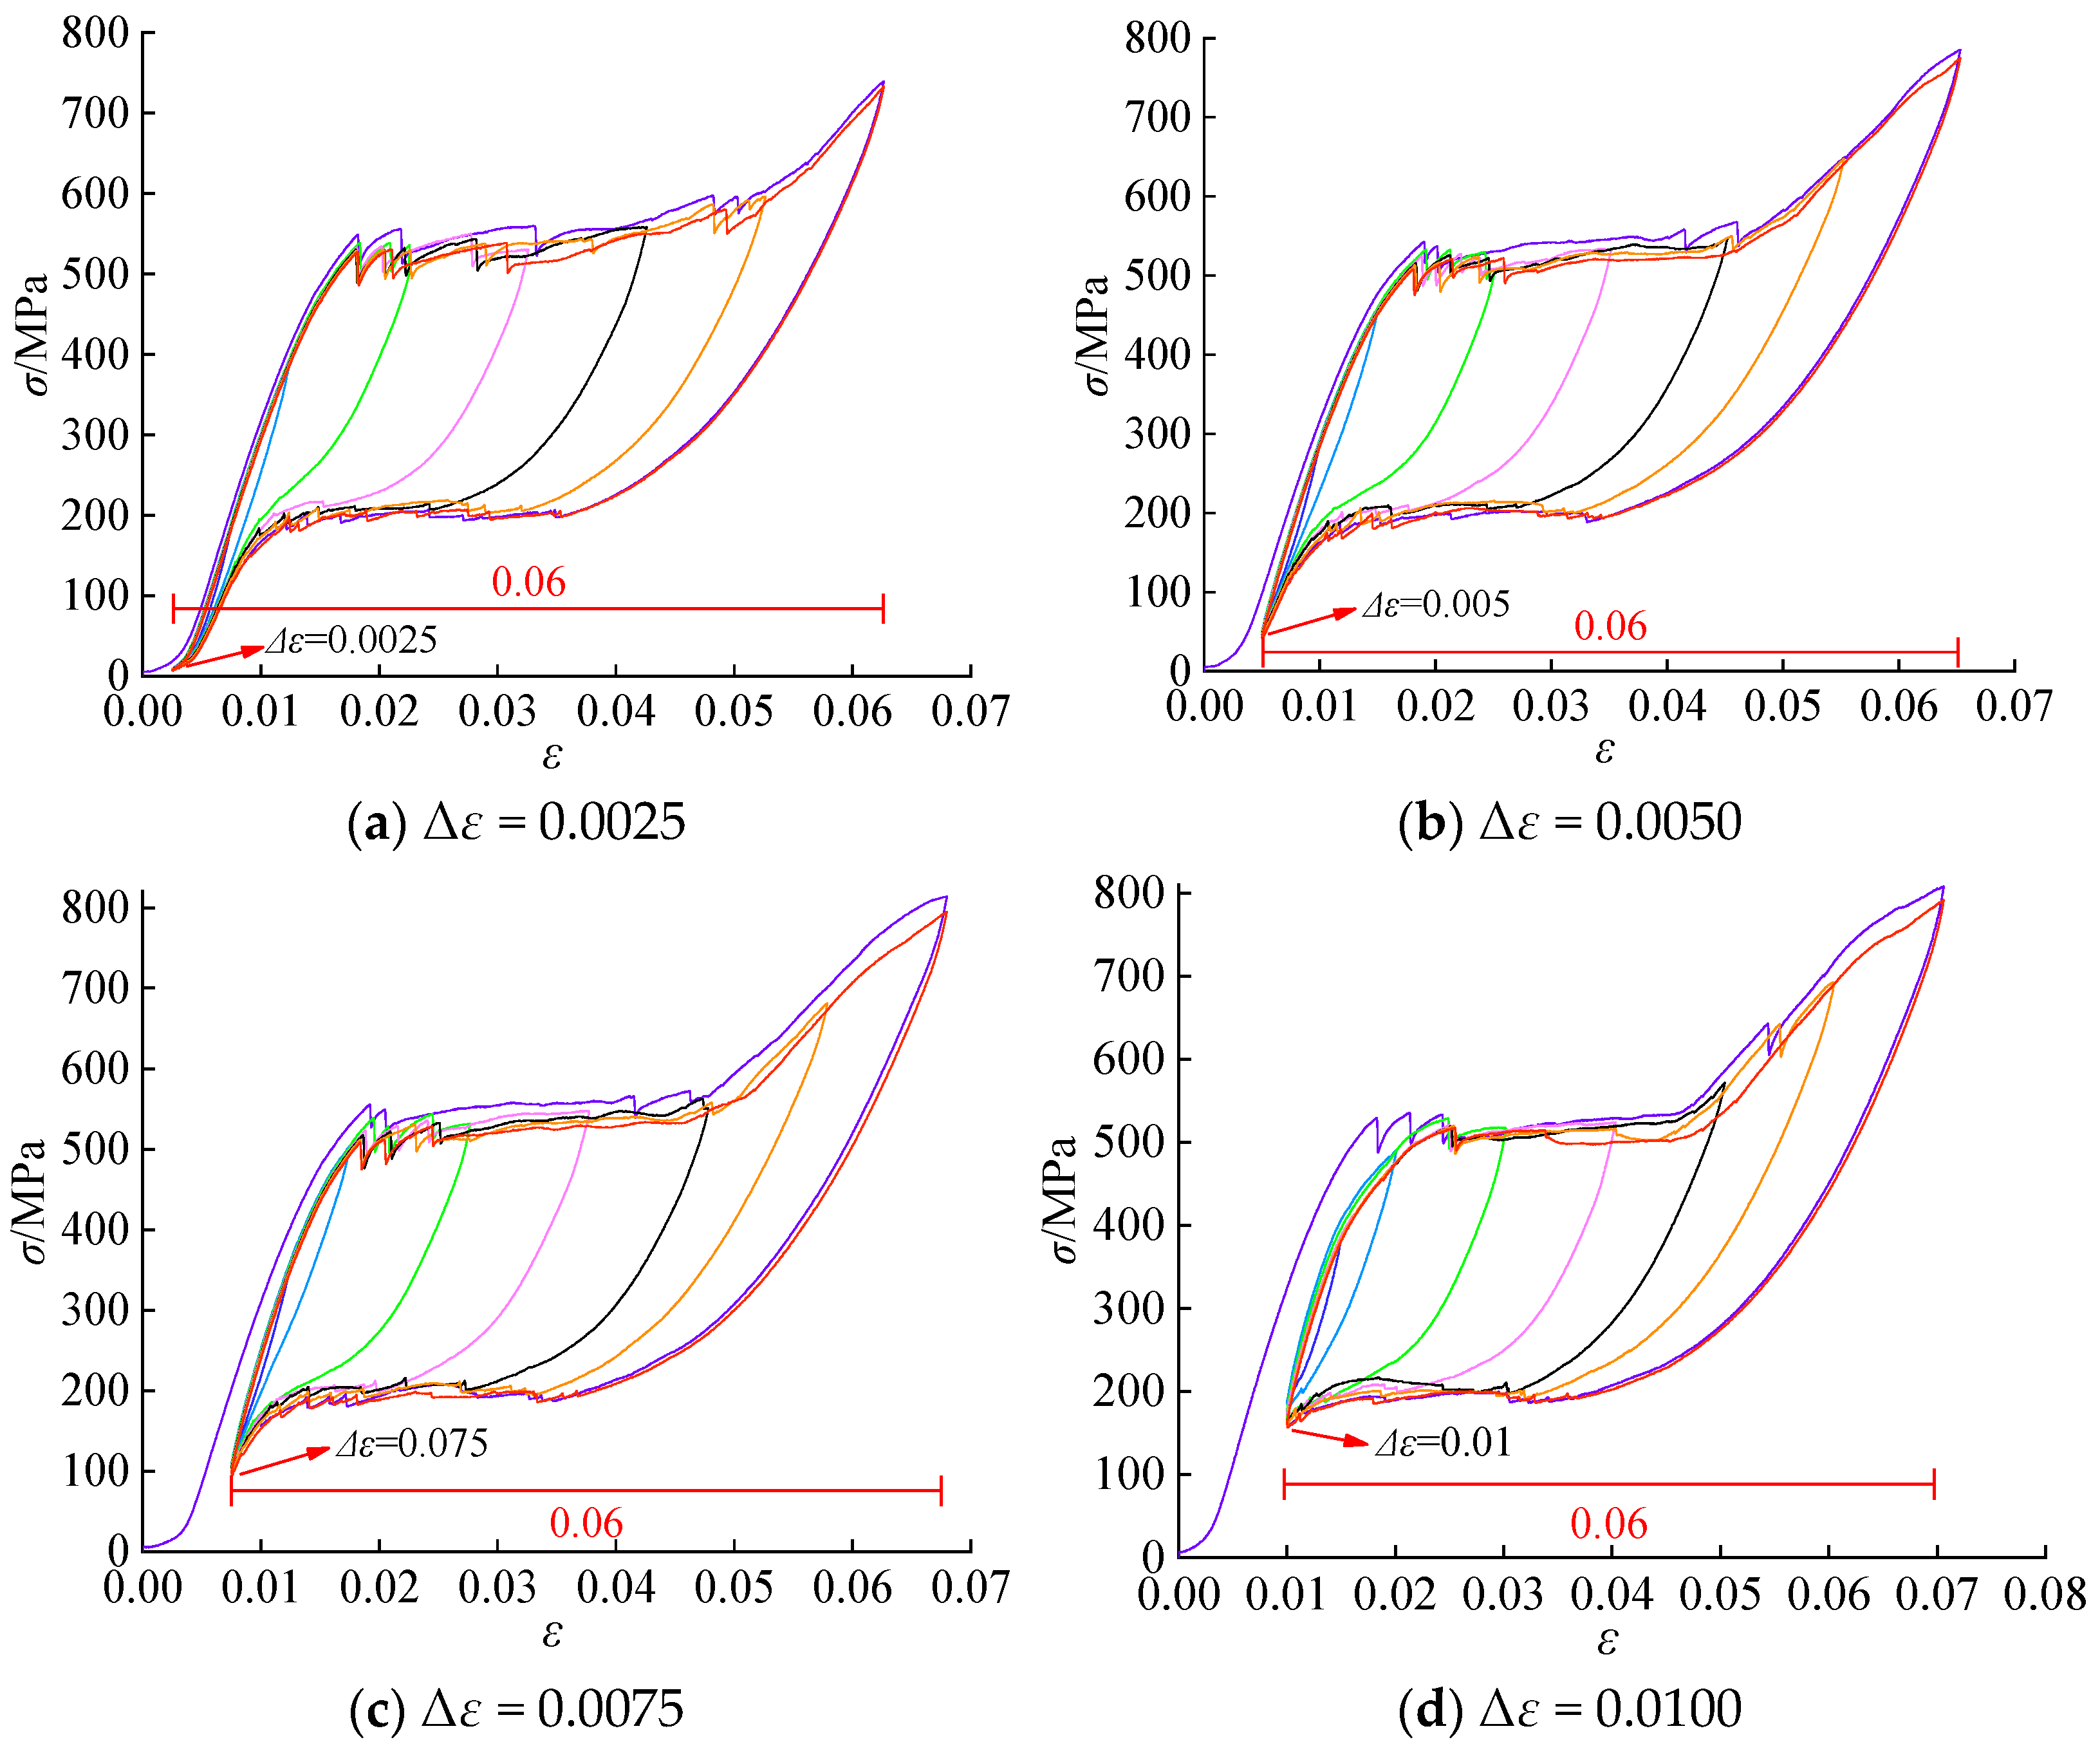
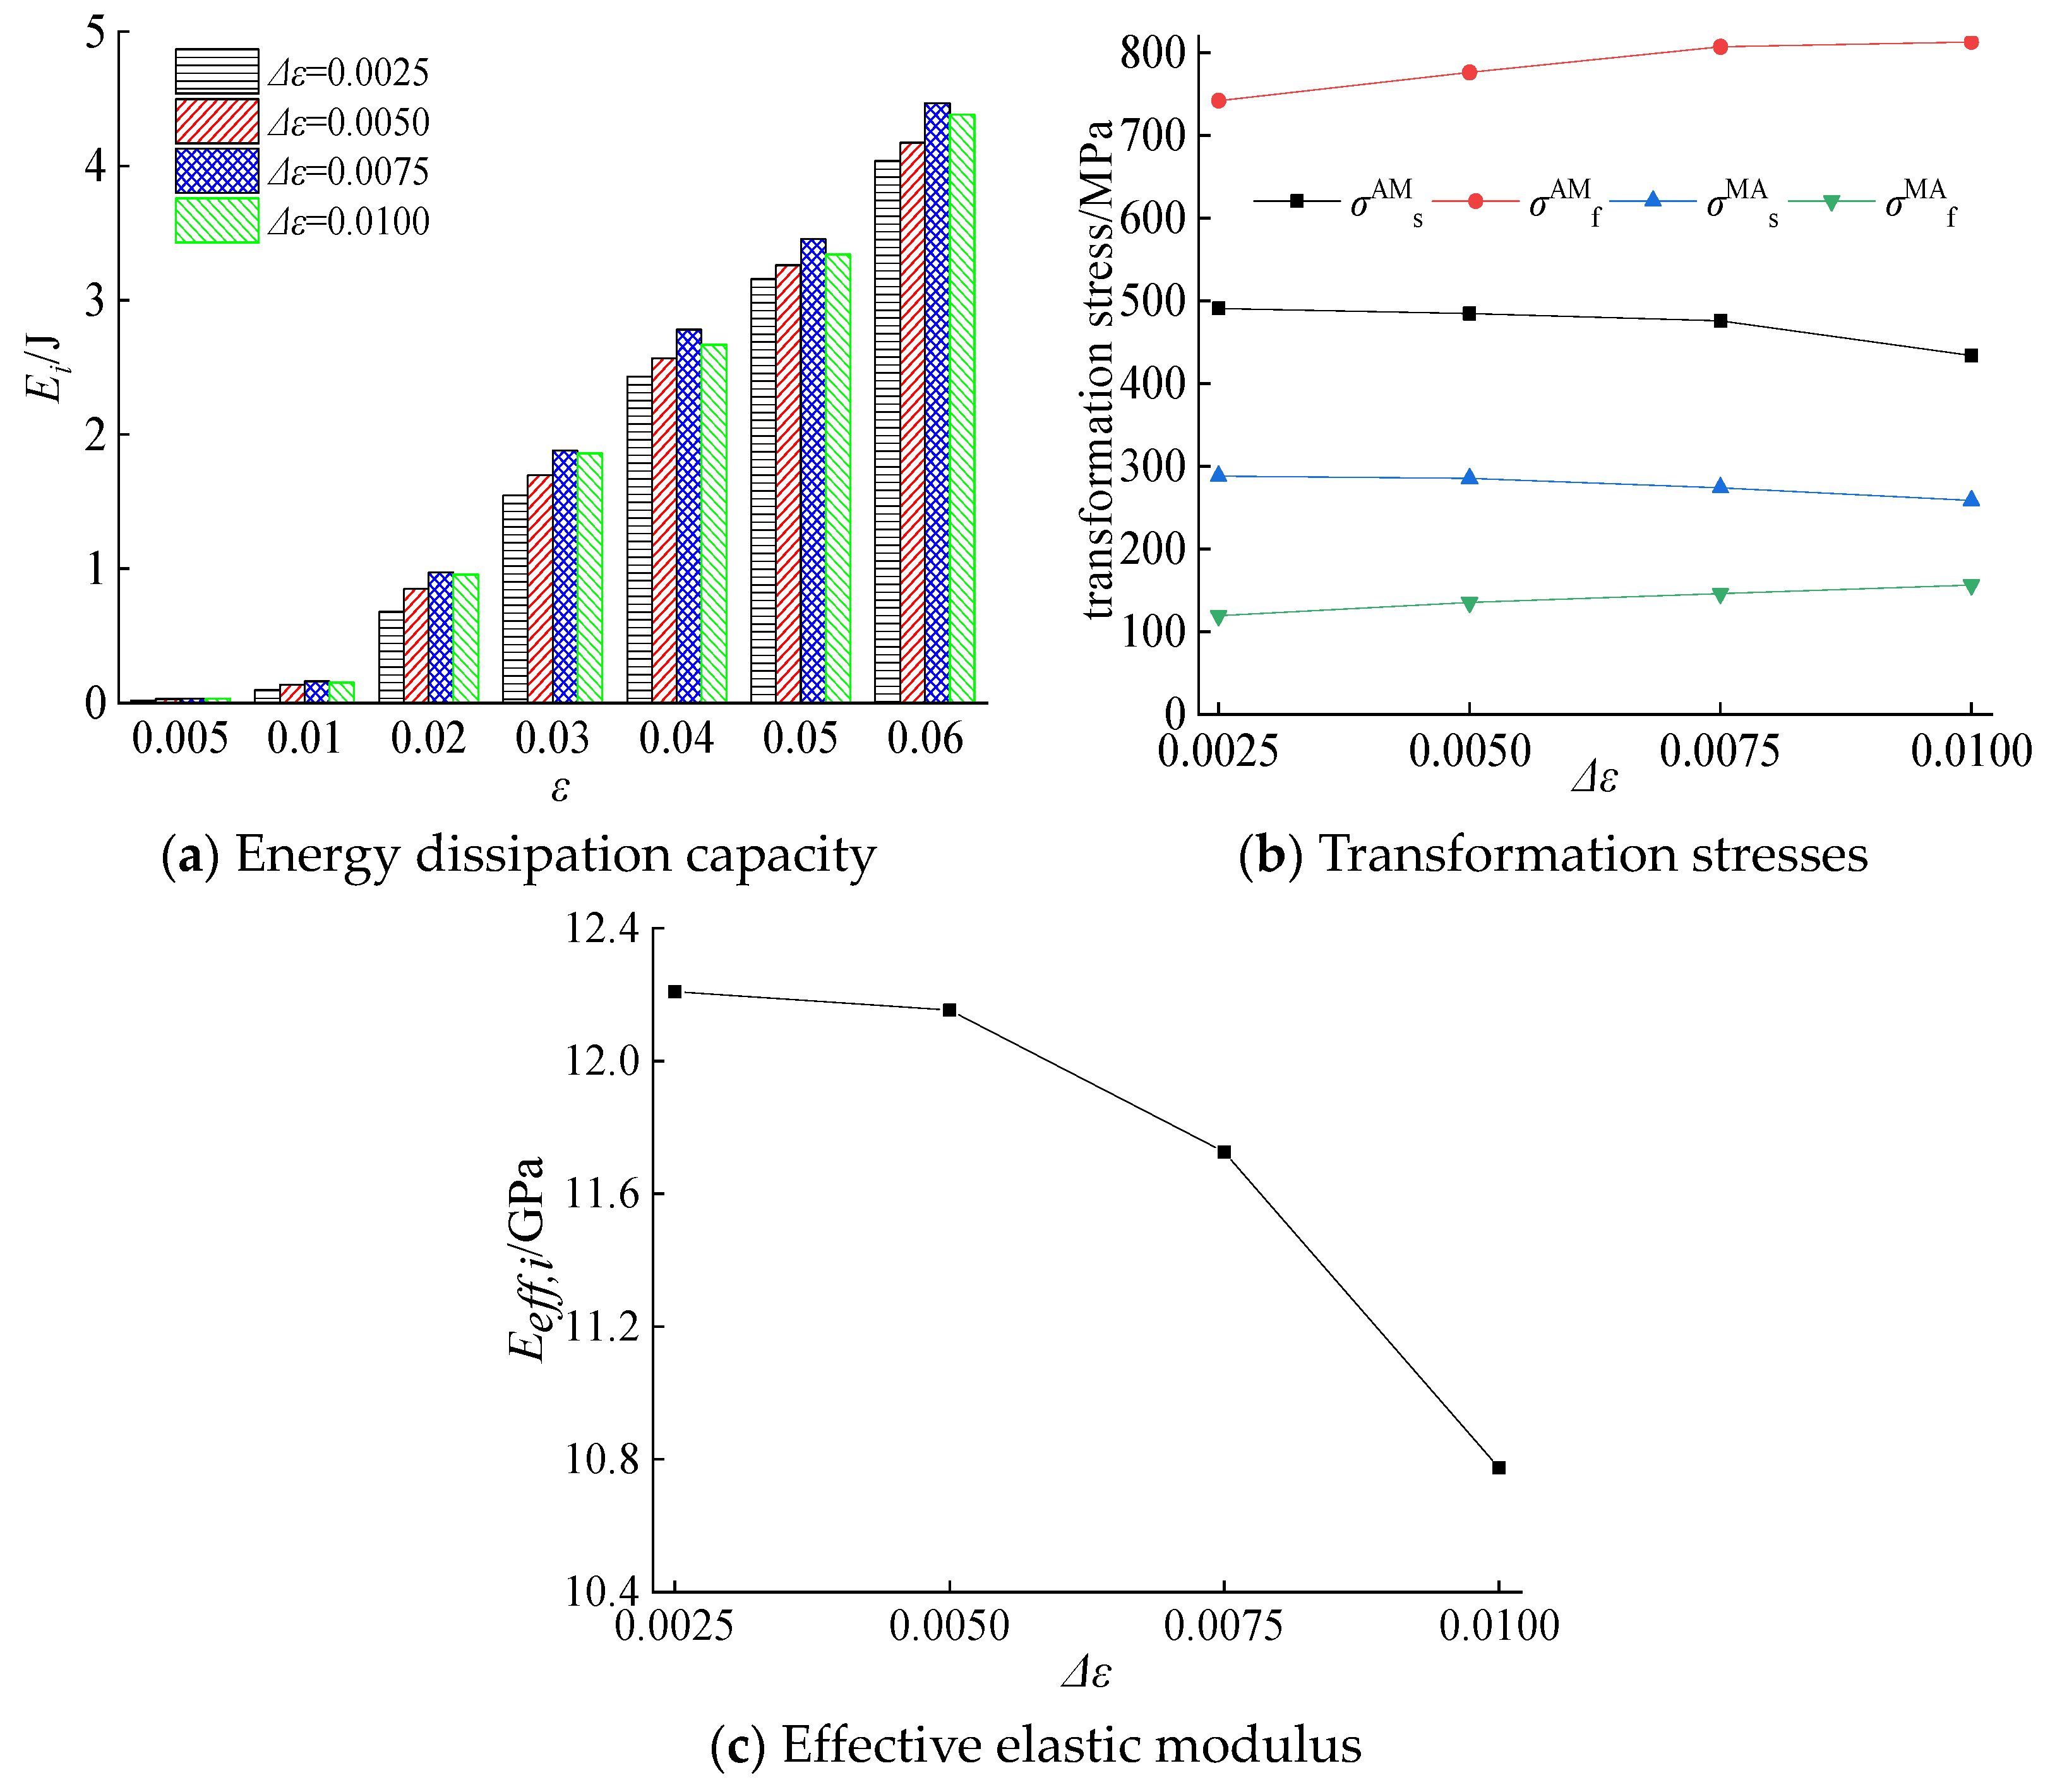
3.3. Effect of Initial Strain
4. Numerical Results
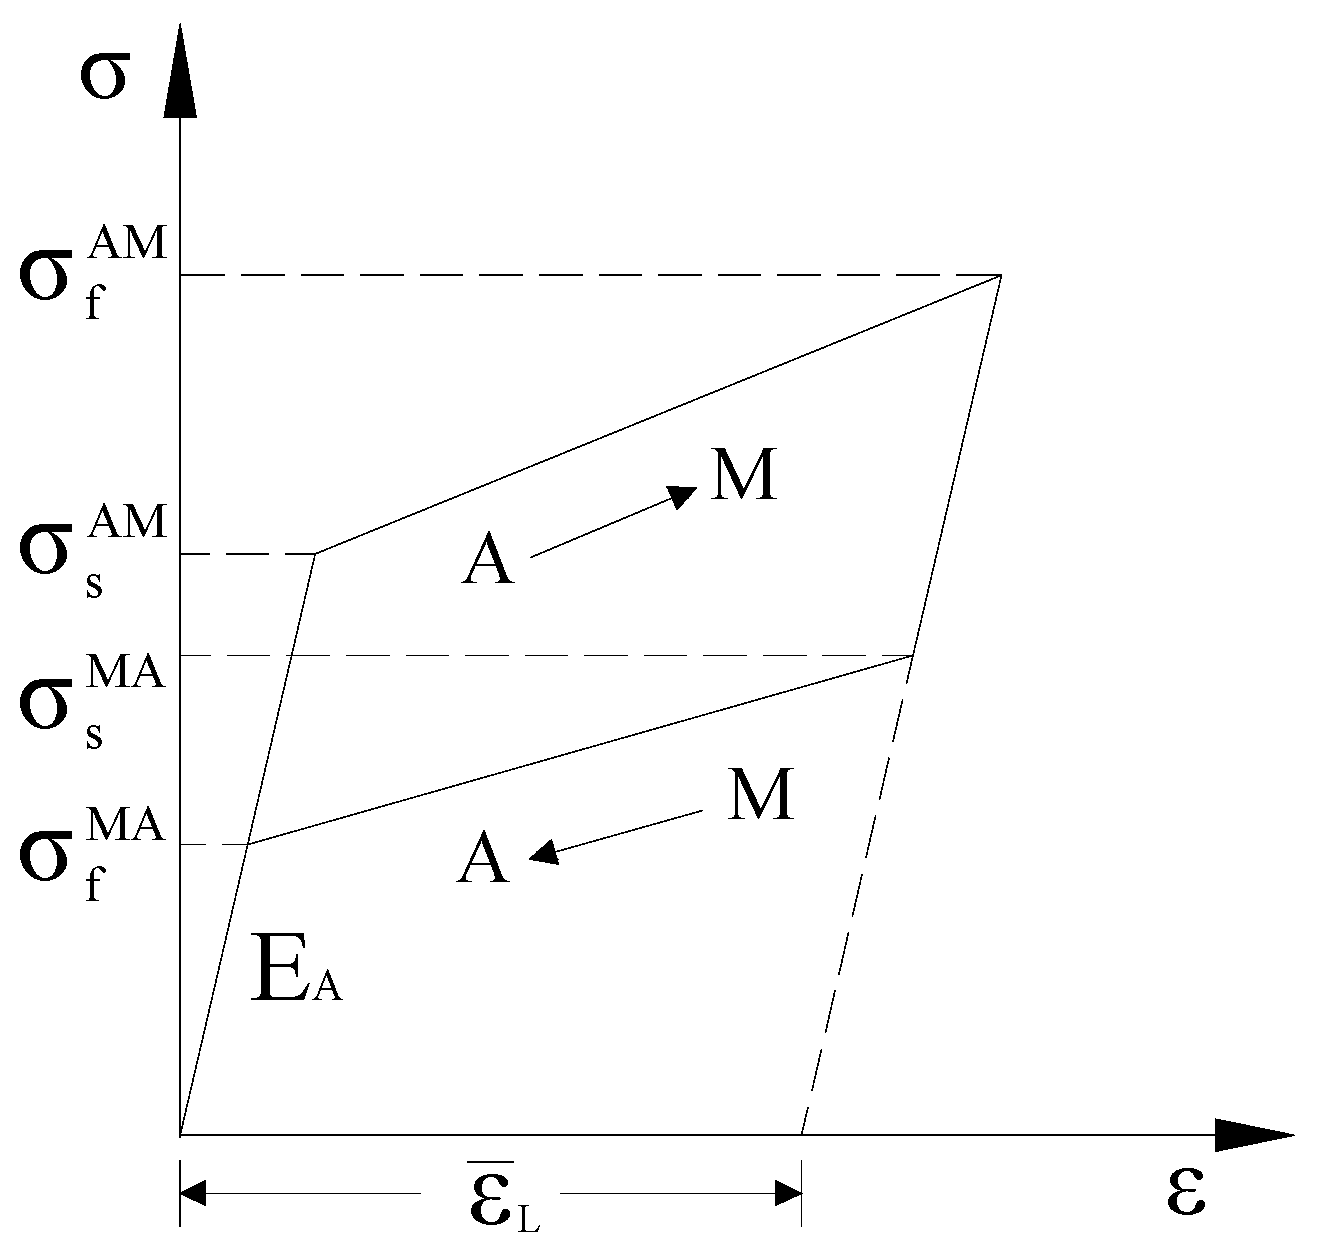
4.1. Numerical Model of the SMA Wire
4.2. Comparison of the Test and Numerical Results
4.2.1. Strain Amplitude
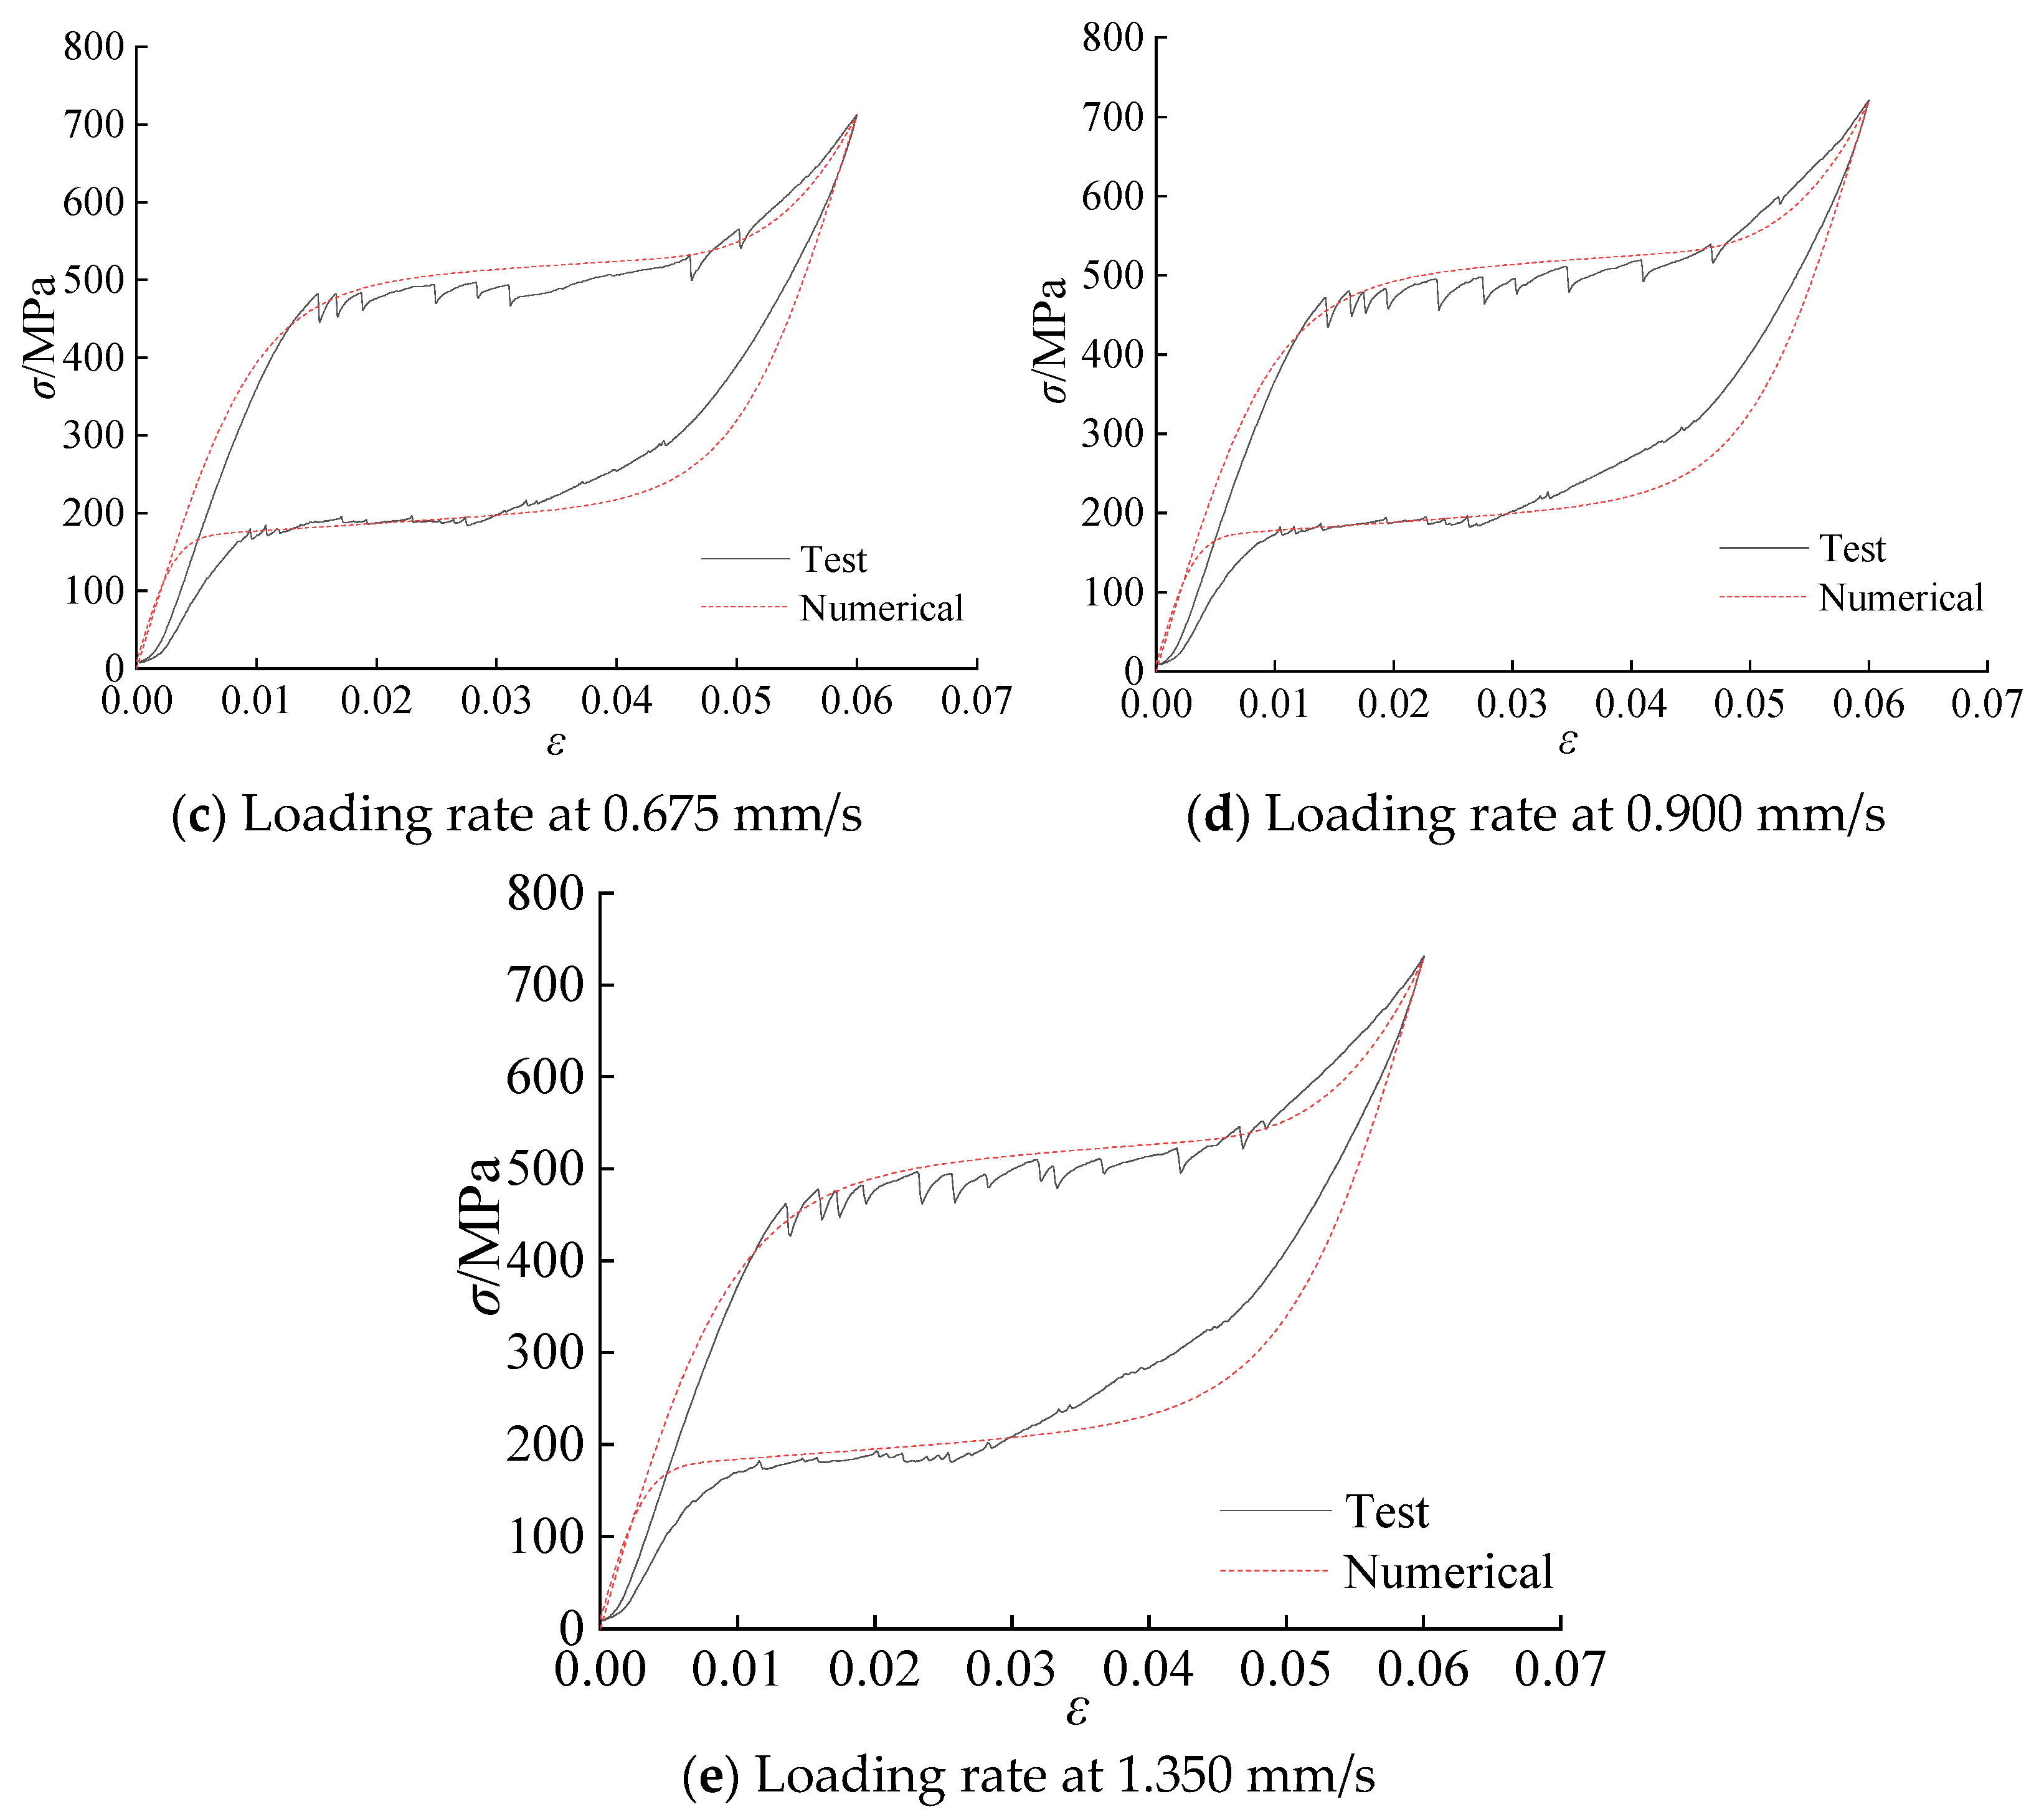
4.2.2. Loading Rate
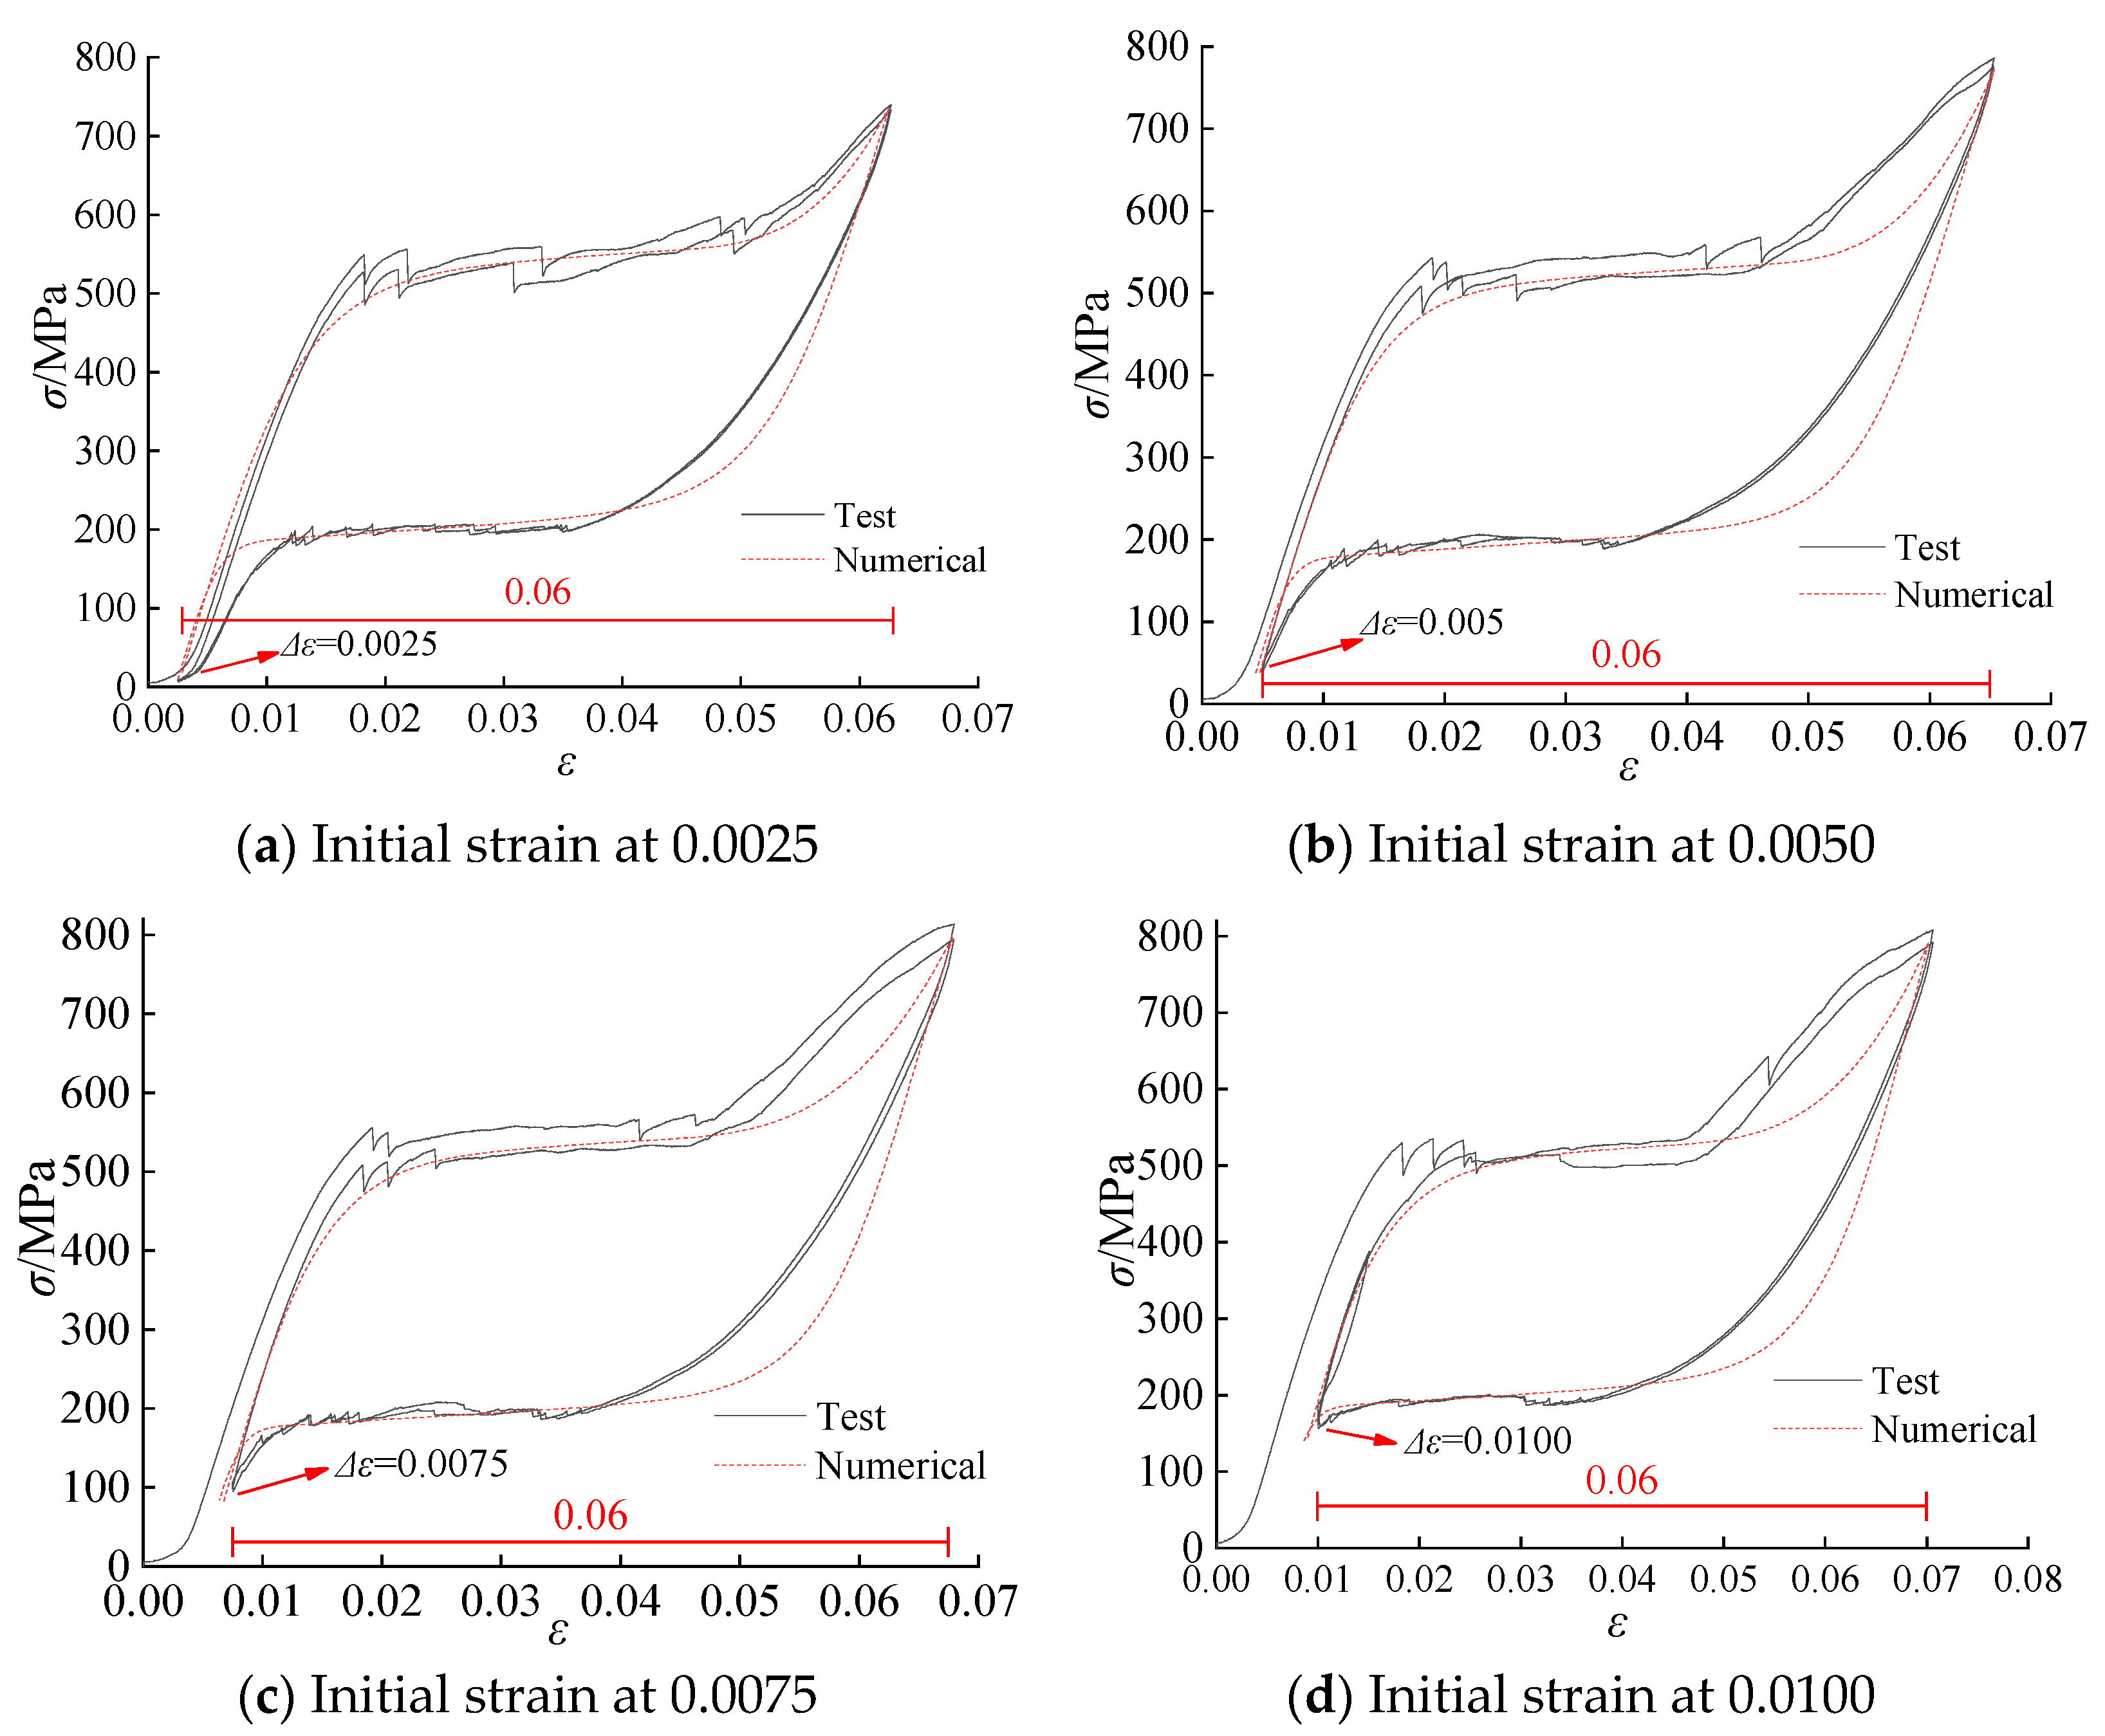
4.2.3. Initial Strain
5. Conclusions
- Number of cycles and strain amplitude. The mechanical properties of the SMA wires obtained by only one loading cycle with strain amplitude shows great agreement with that of 30 loading cycles at 0.06 strain, which exhibits a stable performance.
- Loading rate. The pinch effect of the hysteresis curves of the SMA wires will be enlarged with the increasing loading rates; meanwhile, the Eeff,i and slope of transformation stresses are also increased during the cyclic tensile test. The maximum Ei of the SMA wires appears at a loading rate of 0.675 mm/s.
- Initial strain. As the initial strain increases, the slope of the transformation curve between and gradually increases, while the Eeff,i and slope of the transformation curve between and decreases. The maximum Ei of the pre-tensioned SMA wires appears on the initial strain of 0.0075.
- The improved Graesser model programs in the SIMULINK toolbox of MATLAB can be used to simulate the mechanical property of the SMA wires with a different number of cycles, strain amplitudes, loading rates, and initial strains, but it also needs to study the improved numerical model of the pre-tensioned SMA wire under large deformation in the future.
Author Contributions
Funding
Institutional Review Board Statement
Informed Consent Statement
Data Availability Statement
Conflicts of Interest
References
- Costanza, G.; Paoloni, S.; Tata, M.E. Ir thermography and resistivity investigations on Ni-Ti shape memory alloy. Key Eng. Mat. 2014, 605, 23–26. [Google Scholar] [CrossRef]
- Mohd, J.J.; Leary, M.; Subic, A.; Gibson, M.A. A review of shape memory alloy research, applications and opportunities. Mater. Des. 2014, 56, 1078–1113. [Google Scholar] [CrossRef]
- Zhang, Y.; Zhu, S. Seismic response control of building structures with superelastic shape memory alloy wire dampers. J. Eng. Mech. 2008, 134, 240–251. [Google Scholar] [CrossRef]
- Qiu, C.X.; Zhu, S. Performance-based seismic design of self-centering steel frames with SMA-based braces. Eng. Struct. 2017, 130, 67–82. [Google Scholar] [CrossRef]
- Feng, W.; Fang, C.; Wang, W. Behavior and design of top flange-rotated self-centering steel connections equipped with SMA ring spring dampers. J. Constr. Steel Res. 2019, 159, 315–329. [Google Scholar] [CrossRef]
- GB 50010. Code for Seismic Design of Buildings Beijing; China Architecture & Building Press: Beijing, China, 2010. [Google Scholar]
- Abirami, T.; Loganaganandan, M.; Murali, G.; Fediuk, R.; Vickhram, S.R.; Vignesh, T.; Januppriya, G.; Karthikeyan, K. Experimental research on impact response of novel steel fibrous concretes under falling mass impact. Constr. Build Mater. 2019, 222, 447–457. [Google Scholar] [CrossRef]
- Murali, G.; Fediuk, R. A taguchi approach for study on impact response of ultra-high-performance polypropylene fibrous cementitious composite. J. Build. Eng. 2020, 30, 101301. [Google Scholar] [CrossRef]
- Svintsov, A.P.; Shchesnyak, E.L.; Fediuk, R.S.; Galishnikova, V.V. Monitoring of heating systems as a factor of energy safety of buildings. J. Build. Eng. 2020, 31, 101384. [Google Scholar] [CrossRef]
- Wang, W.; Fang, C.; Liu, J. Large size superelastic SMA bars: Heat treatment strategy, mechanical property and seismic application. Smart Mater. Struct. 2016, 25, 075001. [Google Scholar] [CrossRef]
- Li, H.N.; Liu, M.M.; Fu, X. An innovative re-centering SMA-lead damper and its application to steel frame structures. Smart Mater. Struct. 2018, 27, 075029. [Google Scholar] [CrossRef]
- Ibragimov, R.; Fediuk, R. Improving the early strength of concrete: Effect of mechanochemical activation of the cementitious suspension and using of various superplasticizers. Constr. Build. Mater. 2019, 226, 839–848. [Google Scholar] [CrossRef]
- Lesovik, V.; Voronov, V.; Glagolev, E.; Fediuk, R.; Alaskhanov, A.; Mugahed, Y.H.; Murali, G.; Baranov, A. Improving the behaviors of foam concrete through the use of composite binder. J. Build. Eng. 2020, 31, 101414. [Google Scholar] [CrossRef]
- Xue, S.D.; Wang, L.; Zhuang, P. Design and performance study of a SMA incorporated friction damaper. World Earth. Eng. 2006, 22, 1–6. [Google Scholar] [CrossRef]
- Ren, W.J.; Wang, L.Q.; Ma, Z.C. Investigation on mechanical behavior of innovative shape memory alloy-friction damper. Jianzhu Jiegou Xuebao 2013, 34, 83–90. [Google Scholar] [CrossRef]
- Liu, M.M.; Li, H.N.; Fu, X. Experimental and numerical analysis of an innovative re-centering shape memory alloys-shearing lead damper. Gongcheng Lixue 2018, 35, 52–58. [Google Scholar] [CrossRef]
- Huang, Z.; Li, H.N.; Fu, X. Optimum design of a re-centering deformation-amplified SMA damper. Gongcheng Lixue 2018, 36, 202–210. [Google Scholar] [CrossRef]
- Hu, S.J.; Gu, Q.; Jiang, J.; Xiong, J.G. Experimental study of the seismic performance for an innovative for an self-centering SMA brace. Gongcheng Lixue 2020. [Google Scholar] [CrossRef]
- Lin, Y.H.; Peng, H.H.; Zhang, S. Mechanical behavior of super elastic NiTi wires. Huanan Ligong Daxue Xuebao 2010, 38, 131–135. [Google Scholar] [CrossRef]
- Yan, S.; Wang, Q.; Wang, W. Experimental research on mechanical performance for pseudo-elasticity of shape memory alloy. Shenyang Jianzhu Daxue Xuebao 2010, 26, 458–463. [Google Scholar]
- Zhou, H.J.; Qi, S.K.; Yao, G.Z. Damping and frequency of a model cable attached with a pre-tensioned shape memory alloy wire: Experiment and analysis. J. Struct. Control Health Monit. 2018, 25, 1–19. [Google Scholar] [CrossRef]
- Lin, C.K.; Wang, Z.Q.; Yang, X.; Zhou, H.J. Experimental study on temperature effects on NiTi shape memory alloys under fatigue loading. Materials 2020, 13, 573–586. [Google Scholar] [CrossRef] [PubMed] [Green Version]
- Desroches, R.; Mccormick, J.; Delemont, M. Cyclic properties of superelastic shape memory alloy wires and bars. J. Struct. Eng. 2004, 130, 38–46. [Google Scholar] [CrossRef]
- Qian, H.; Li, H.N.; Song, G.B. Constitutive model of shape memory alloy based on plastic theory: Experiment and simulation. J. Funct. Mater. 2007, 38, 1114–1118. [Google Scholar] [CrossRef]
- Wang, J.; Moumni, Z.; Zhang, W. A thermomechanically coupled finite-strain constitutive model for cyclic pseudoelasticity of polycrystalline shape memory alloys. Int. J. Plast. 2017, 97, 194–221. [Google Scholar] [CrossRef]
- Xu, X.; Cheng, G.M.; Zheng, J.H. Tests on pretrained superelastic NiTi shape memory alloy rods: Towards application in self-centering link beams. Adv. Civ. Eng. 2018, 2018, 2037376. [Google Scholar] [CrossRef] [Green Version]
- Wang, B.; Songye Zhu, S.Y.; Casciati, F. Experimental study of novel self-centering seismic base isolators incorporating superelastic shape memory alloys. J. Struct. Eng. 2020, 146, 04020129. [Google Scholar] [CrossRef]
- Graesser, E.J.; Cozzarelli, F.A. Shape memory alloys as new materials for seismic isolation. J. Eng. Mech. 1991, 117, 2590–2608. [Google Scholar] [CrossRef]


| Element | Content/% | Element | Content/% | Element | Content/% |
|---|---|---|---|---|---|
| Ni | 55.9600 | Ti | 43.9835 | H | 0.0005 |
| Cr | 0.0070 | Co | 0.0030 | C | 0.0050 |
| Fe | 0.0060 | Cu | 0.0060 | Others | 0.0290 |
| Influencing Factor | Value | E | Y | α | fT | a | εMf | fM |
|---|---|---|---|---|---|---|---|---|
| Strain amplitude | 0.005–0.06 | 45,000 | 480 | 0.0190 | 0.77 | 250 | 0.040 | 42,500 |
| Loading rate/mm/s | 0.225 | 45,000 | 470 | 0.0190 | 0.78 | 280 | 0.040 | 42,500 |
| 0.450 | 47,000 | 480 | 0.0190 | 0.74 | 275 | 0.040 | 42,500 | |
| 0.675 | 49,000 | 500 | 0.0190 | 0.71 | 270 | 0.040 | 42,500 | |
| 0.900 | 50,000 | 500 | 0.0200 | 0.67 | 265 | 0.040 | 42,500 | |
| 1.350 | 51,000 | 500 | 0.0210 | 0.63 | 255 | 0.040 | 42,500 | |
| Pre-tensioned | 0.0025 | 50,000 | 530 | 0.0200 | 0.70 | 282 | 0.040 | 42,500 |
| 0.0050 | 51,000 | 520 | 0.0190 | 0.72 | 290 | 0.040 | 42,500 | |
| 0.0075 | 52,000 | 508 | 0.0164 | 0.08 | 300 | 0.036 | 33,500 | |
| 0.0100 | 53,000 | 500 | 0.0150 | 0.87 | 310 | 0.036 | 33,300 |
| Step/N | Energy Dissipation Value Ei/(J) | Ultimate Force Fi/(N) | ||||
|---|---|---|---|---|---|---|
| Test | Numerical | ΔiE/% | Test | Numerical | ΔiF/% | |
| 1 | 0.017 | 0.010 | 39.73 | 327.23 | 366.82 | −12.10 |
| 2 | 0.097 | 0.089 | 7.69 | 362.55 | 381.64 | −5.26 |
| 3 | 0.68 | 0.64 | 4.77 | 462.36 | 478.06 | −3.39 |
| 4 | 1.43 | 1.39 | 3.43 | 495.45 | 492.88 | 0.52 |
| 5 | 2.20 | 2.24 | −2.24 | 513.20 | 501.66 | 2.25 |
| 6 | 2.84 | 3.08 | −8.65 | 549.94 | 525.58 | 4.43 |
| 7 | 3.56 | 3.77 | −6.04 | 703.70 | 682.69 | 2.98 |
| Loading Rate/(mm·s−1) | Energy Dissipation Value Ei/(J) | Ultimate Force Fi/(N) | ||||
|---|---|---|---|---|---|---|
| Test | Numerical | ΔiE/% | Test | Numerical | ΔiF/% | |
| 0.225 | 3.50 | 3.70 | −5.72 | 685.90 | 693.53 | −0.48 |
| 0.450 | 3.56 | 3.81 | −7.04 | 690.19 | 701.73 | 0.28 |
| 0.675 | 3.57 | 4.04 | −13.25 | 703.70 | 712.10 | 0.02 |
| 0.900 | 3.54 | 4.01 | −13.38 | 712.23 | 718.97 | 0.26 |
| 1.350 | 3.50 | 3.98 | −13.69 | 720.81 | 727.98 | 0.44 |
| Pre-Tension | Energy Dissipation Value Ei/(J) | Ultimate Force Fi/(N) | ||||
|---|---|---|---|---|---|---|
| Test | Numerical | ΔiE/% | Test | Numerical | ΔiF/% | |
| 0.0025 | 4.04 | 4.19 | −3.80 | 742.09 | 736.78 | 0.72 |
| 0.0050 | 4.17 | 4.23 | −1.41 | 776.71 | 772.45 | 0.55 |
| 0.0075 | 4.47 | 4.60 | −3.03 | 806.93 | 799.51 | 0.92 |
| 0.0100 | 4.38 | 4.37 | 0.33 | 812.87 | 802.39 | 1.29 |
Publisher’s Note: MDPI stays neutral with regard to jurisdictional claims in published maps and institutional affiliations. |
© 2021 by the authors. Licensee MDPI, Basel, Switzerland. This article is an open access article distributed under the terms and conditions of the Creative Commons Attribution (CC BY) license (http://creativecommons.org/licenses/by/4.0/).
Share and Cite
Zhang, B.; Zeng, S.; Tang, F.; Hu, S.; Zhou, Q.; Jia, Y. Experimental and Numerical Analysis of the Mechanical Properties of a Pretreated Shape Memory Alloy Wire in a Self-Centering Steel Brace. Processes 2021, 9, 80. https://doi.org/10.3390/pr9010080
Zhang B, Zeng S, Tang F, Hu S, Zhou Q, Jia Y. Experimental and Numerical Analysis of the Mechanical Properties of a Pretreated Shape Memory Alloy Wire in a Self-Centering Steel Brace. Processes. 2021; 9(1):80. https://doi.org/10.3390/pr9010080
Chicago/Turabian StyleZhang, Bo, Sizhi Zeng, Fenghua Tang, Shujun Hu, Qiang Zhou, and Yigang Jia. 2021. "Experimental and Numerical Analysis of the Mechanical Properties of a Pretreated Shape Memory Alloy Wire in a Self-Centering Steel Brace" Processes 9, no. 1: 80. https://doi.org/10.3390/pr9010080