Abstract
In this study, Cabernet Sauvignon red wine was subjected to reverse osmosis and nanofiltration processes at four different pressures (25, 35, 45, and 55 bar) and two temperature regimes (with and without cooling). The aim was to obtain concentrates with a higher content of phenolic compounds and antioxidant activity and to determine the influence of two membrane types (Alfa Laval RO98pHt M20 for reverse osmosis and NF M20 for nanofiltration) and different operating conditions on phenolics retention. Total polyphenol, flavonoid, monomeric anthocyanin contents, and antioxidant activity were determined spectrophotometrically. Flavan-3-ols and phenolic acids were analyzed on a high-performance liquid chromatography system and sample colour was measured by chromometer. The results showed that the increase in applied pressure and decrease in retentate temperature were favorable for higher phenolics retention. Retention of individual compounds depended on their chemical structure, membrane properties, membrane fouling, and operating conditions. Both types of membranes proved to be suitable for Cabernet Sauvignon red wine concentration. In all retentates, phenolic compounds content was higher than in the initial wine, but no visible color change (ΔE* < 1) was observed. The highest concentrations of phenolic compounds were detected in retentates obtained at 45 and 55 bar, especially with cooling.
1. Introduction
Wine is one of the most consumed alcoholic beverages, and its moderate consumption is recommended due to phenolic content and antioxidant activity, especially red wine varieties. The polyphenols are responsible for the colour, astringency, bitterness, and mouthfeel of the wine [1], but they are mostly known as strong antioxidants that protect the human body from the harmful effects of free radicals. Studies showed that their intake regulates oxidative stress in cells preventing cardiovascular, degenerative, and other chronic diseases [2,3]. Wine phenolics present a large group of several hundred compounds, including non-flavonoids (hydroxybenzoic acids, hydroxycinnamic acids, and stilbenes) and flavonoids (flavonols, dihydroflavonols, flavan-3-ols, tannins, and anthocyanins). They originate from grape skins and seeds from where they are extracted during crushing, maceration, and fermentation. Red wine contains a significantly higher concentration of phenolic compounds (1800–3000 mg/L) than white wine due to longer contact of skins and seeds with grape juice [4]. The concentrations of polyphenols in wine depend on several factors, such as grape variety, grape maturity and harvest date, climate, soil characteristics, pre-fermentation, fermentation, and aging conditions. The profile of anthocyanins for each grape variety is usually stable, but they can vary due to different vintage or above-mentioned factors [5]. Vinification procedures have a great effect on the composition and concentration of wine polyphenols. Maceration is often conducted for better extraction of color and flavor compounds from grape skins and seeds to juice, mostly during red wine production. Clarification is an inevitable step in the winemaking process, but it usually results in a decrease in phenolic compound concentration, depending on the phenols’ structure and clarifying agents [6]. Wine aging mainly affects the concentration of hydroxycinnamic esters, anthocyanidins, and tannins that are manifested through colour and astringency degree change [1].
Poor vintage, inadequate climate conditions, or winemaking procedures can result in a wine with phenolic compound content lower than desired. For that purpose, several techniques have been developed to extract, increase, or correct their quantity. Recently, membrane filtration stands out as a practical method due to low energy, low cost, mild temperatures, high efficiency, and no-additives requirement [7]. They imply pressure-driven membrane operations that are divided according to the membrane characteristics and pore size on microfiltration (MF), ultrafiltration (UF), nanofiltration (NF), and reverse osmosis (RO) [8].
Nanofiltration and reverse osmosis membranes are usually composite membranes with a high strength polymer as a supporting layer. That kind of arrangement provides the necessary permeability and selectivity, endurance, and ability to be back-flushed during cleaning [9]. During the filtration process, membranes split the main stream into two fractions: retentate that is retained on the membrane and permeate that is yielded through it. Wine permeate contains mostly water, ethanol, and small amounts of acetic acid, lactic acid, and several other low molecular weight compounds. This property enables the use of NF and RO membranes for wine dealcoholization under low-temperature conditions without any greater change in organoleptic properties of the initial wine [10,11,12,13]. On the other hand, membranes retain larger molecules, such as sugars, higher acids, and higher alcohols, phenolic and aroma compounds [14,15,16], that create osmotic pressure and concentration polarization on the membrane surface. Therefore, high transmembrane pressure should be applied to overcome the osmotic pressure and ensure optimal permeate flux. The most commonly used pressures are between 20 and 60 bar; today, even higher for the reverse osmosis process. The higher the pressure, the higher the permeate flux, although increased pressure can lead to faster membrane fouling and better bioactive compounds retention [17]. Those characteristics can be used for polyphenol extraction from wine industry wastewaters [18] or grape pomace extracts [19]. Bánvölgyi [20] used nanofiltration processes for red wine concentration to achieve higher concentrations of polyphenols in red wine. Such obtained wine concentrate can further be used as a drink or for wine color and aroma correction and low-alcohol wine production. Red wine concentrates with increased polyphenol content can also be used in the food and pharmaceutical industry as functional food [21].
This study aimed to obtain Cabernet Sauvignon red wine concentrates with increased polyphenol content and antioxidant activity. To establish optimal operating parameters, two types of membranes (RO98pHt for reverse osmosis and NF M20 for nanofiltration), four different pressures (25, 35, 45, and 55 bar), and two temperature regimes (with and without cooling) were applied for red wine concentration. The effect of different membranes and operating conditions on retention of total phenolic compounds, flavonoids, anthocyanins, and antioxidant activity in red wine concentrates was determined after each experimental run. Additionally, the color parameters of the obtained samples were determined.
2. Materials and Methods
2.1. Chemicals and Standards
Chemicals and standards used in this study were obtained as follows: gallic acid monohydrate, quercetin dihydrate, aluminum chloride, potassium persulfate, Trolox, 2,2′-azinobis(3-ethylbenzothiazoline sulfonic acid) (ABTS), 2,2-diphenyl-1-picrylhydrazil (DPPH), 2,4,6-tripyridyl-s-triazine (TPTZ), gallic acid, caffeic acid, catechin, and epicatechin from Sigma-Aldrich (St. Lois, MO, USA); Folin-Ciocalteu reagent, sodium carbonate, sodium nitrite, sodium hydroxide, potassium bisulfite, potassium chloride, sodium acetate, and hydrochloric acid from Kemika (Zagreb, Croatia); sodium acetate trihydrate, ferric chloride hexahydrate, and ammonium acetate from Gram-Mol (Zagreb, Croatia); copper(II) chloride from Acros Organics (New Jersey, NJ, USA); HPLC grade methanol and neocuproine from Merck (Darmstadt, Germany) and phosphoric acid (HPLC grade) from Fluka (Buchs, Switzerland).
2.2. Wine
Wine samples of Cabernet Sauvignon grapewine variety were produced at the Faculty of Agrobiotechnical Sciences, experimental field Mandićevac, Đakovo vineyard, Croatia, vintage 2018.
2.3. Concentration of Cabernet Sauvignon Red Wine
The concentration of red wine was conducted on LabUnit M20 (De Danske Sukkerfabrikker, Denmark) with a plate-and-frame module equipped with six composite Alfa Laval flat sheet polyamide membranes. Two types of membranes were applied: RO98pHt M20 (pH range 2–11, maximum temperature 60 °C, maximum pressure 55 bar and NaCl rejection ≥98%) and NF M20 (pH range 3–10, maximum temperature 50 °C, maximum pressure 55 bar and MgSO4 rejection ≥99%). The surface of one membrane was 0.0289 m2. The concentration was carried out at four different pressures (25, 35, 45, and 55 bar) and two temperature regimes (with and without cooling) for each membrane type. For each experimental run, a 3 L of the initial feed was used. Every 4 min, the permeate volume, and retentate temperature were recorded. At the end of each process, 1.3 L of retentate and 1.7 L of permeate were obtained. Water flux was measured before and after each experimental run at the same pressures (25, 35, 45, and 55 bar).
2.4. Total Polyphenol Content (TPC) Determination
Total polyphenol content was determined according to the Folin-Ciocalteu method [22]. A sample (0.2 mL) was mixed with 1.8 mL of deionized water, 10 mL of 3.3% Folin-Ciocalteu solution, and 8 mL of sodium carbonate solution (7.5%). For blank, a sample was replaced with water. Prepared mixtures were left at least 2 h in the dark, and then absorbance was measured at 765 nm by spectrophotometer (Cary 60 UV-Vis, Agilent Technologies, Santa Clara, CA, USA). For the calculation of concentration, the gallic acid calibration curve was used (gallic acid was diluted in distilled water to yield 0.5–4.0 g/L), and results were expressed as its equivalents (g GAE/L). Three repetitions were made for each sample.
2.5. Total Flavonoid Content (TFC) Determination
The method for total flavonoids content determination was as follows [23]: 0.5 mL of sample was mixed with 4 mL of distilled water and 0.3 mL of 5% sodium nitrite solution. After 5 min, 1.5 mL of 2% aluminum chloride solution was pipetted. Five minutes later, 2 mL of 1 M sodium hydroxide and 1.7 mL of distilled water were added. Distilled water was used as blank, and the absorbance was measured at 510 nm. The calibration curve of catechin was made by diluting it in ethanol in a concentration in the range of 0.2 to 2.0 g/L. Results were expressed as catechin equivalents (g CE/L) and as average values of 3 repetitions for each sample.
2.6. Monomeric Anthocyanin Content (MAC) Determination
A pH-differential method [24] for MAC determination was used. Samples (0.2 mL) were mixed with 2.8 mL of potassium chloride buffer (pH 1.0) and 2.8 mL of sodium acetate buffer (pH 4.5). Three repetitions were prepared for each sample. The absorbance was measured after 15 min at 512 (λvis-max) nm and 700 nm, and the following formula was used for concentration calculation:
where c(a) is the concentracion of anthocyanins (mg/L), A is the absorbance of a sample obtained from A = (A512 − A700)(pH 1.0) − (A512 − A700)(pH 4.5), MW is the molecurar weight of predominant anthocyanin in the sample (cyanidin-3-glucoside, MW = 449.2), DF is the dilution factor, ε is the molar absorptivity (cyanidin-3-glucoside, ε = 26,900) and l-pathlength (1 cm).
c(a)(mg/L) = (A × MW × DF × 1000)/(ε × l),
2.7. Polymeric Color Determination
For polymeric color determination [24], in one test tube, 0.2 mL of sample and 3.0 mL of distilled water were added, and in another test tube, 0.2 mL of sample, 2.8 mL of water, and 0.2 mL of 20% potassium bisulfite solution were added. The absorbance was measured after 15 min at 420, 512, and 700 nm. For each sample, three parallels were made, and the following parameters were calculated:
Colour density calculation (samples treated with water):
Color density = [(A420 nm − A700 nm) + (A512 nm − A700 nm)] × DF
Polymeric color = [(A420 nm − A700 nm) + (A512 nm − A700 nm)] × DF
Polymeric color calculation (samples treated with potassium bisulfite):
Percent polymeric color calculation:
Percent polymeric color (%) = (polymeric color/color density) × 100
2.8. Antioxidant Activity (AA) Determination
Four methods, DPPH, ABTS, ferric reducing/antioxidant power assay (FRAP), and cupric reducing antioxidant capacity (CUPRAC), were used for antioxidant activity determination. All results were expressed as Trolox equivalents (μmol TE/100 mL) as average values of three repetitions for each sample.
DPPH (2,2-diphenyl-1-picrylhydrazyl) free radicals [25] were dissolved in 96% ethanol, and 3 mL of that solution was mixed with 0.2 mL of sample. After 15 min, absorbance was measured at 517 nm. Water was used for blank trial.
ABTS or 2,2′-azinobis(3-ethyl-benzothiazoline-6-sulfonic acid) was dissolved in water to a 7 mM concentration, and 2.45 mM potassium persulfate was added to obtain a stock solution that was diluted in ethanol (96%) in a 2:70 ratio before analysis. Then, 0.2 mL of sample and 3.2 mL of ABTS were mixed and left in the dark for 95 min. The absorbance was measured at 734 nm [26]. For blank, the sample was replaced with distilled water.
FRAP (ferric reducing/antioxidant power assay) was conducted as follows [27]: 300 mM sodium acetate with pH 3.6, 10 mM TPTZ diluted in 40 mM hydrochloric acid, and 20 mM FeCl3 × 6H2O were mixed in 10:1:1 ratio, respectively and heated at 37 °C. Further, 3 mL of FRAP reagent was mixed with 0.2 L of sample (or water for blank). The absorbance was measured after 15 min at 593 nm.
CUPRAC (cupric reducing antioxidant capacity) method [28] is a simple method for antioxidant activity determination. Three reagents are needed: 10 mM CuCl2 × 2H2O solution, 7.5 mM neocuproine (Nc) solution, and 1 M ammonium acetate (NH4Ac) solution, pH = 7.0. In a test tube, 0.2 mL of sample (water for blank) was mixed with 1 mL of each reagent and 3.9 mL of distilled water. The color change was measured at 450 nm after 30 min.
2.9. HPLC Determination of Phenolic Compounds
Individual phenolic components were identified by high-performance liquid chromatography (HPLC) system 1260 Infinity II (Agilent Technologies, Santa Clara, CA, USA), equipped with a quaternary pump and PDA (photodiode array) detector. A Poroshell 120 EC-C18 column (4.6 × 100 mm2, 2.7 µm) and a Poroshell 120 EC-C18 guard column (4.6 × 5 mm2, 2.7 µm) were used. Solutions 0.1% H3PO4 and 100% methanol were used as mobile phases A and B, respectively. The flow was set to 1 mL/min, and the injected sample volume was 10 µL. The gradient was used as follows: 0 min 5% B, 3 min 30% B, 15 min 35% B, 22 min 37% B, 30 min 41% B, 32 min 45% B, 40 min 49% B, 45 min 80% B, 48 min 80% B, 50 min 5% B, 53 min 5% B. For calibration curves, following stock solutions were diluted with methanol: 16–80 mg/L of gallic acid (r2 = 1.0000), 8.5–125 mg/L of (+)-catechin (r2 = 0.9956), 8.4–125 mg/L of (−)-epicatechin (r2 = 0.9955) and 9.7–48.5 mg/L of caffeic acid (r2 = 0.9911). Caftaric and coutaric acid were tentatively identified by comparing their retention times and peak spectrum with those of authentic standards and literature data. Hydroxycinnamic acids were identified at 320 nm, and gallic acid, catechin, and epicatechin were identified at 280 nm. Samples were analyzed in duplicates.
2.10. Color Parameters Measurement
Color measurement of the analyzed samples was conducted on a chromometer CR-400 (Konica Minolta, Inc., Osaka, Japan). For color evaluation, a Lab system was used, and the following parameters were determined: L* indicates lightness (0 is black, and 100 is white); a* is redness (+) or greenness (−); b* is yellowness (+) or blueness (−); C* represents color saturation or chroma, and °h is the hue angle [29]. All samples were measured three times, and results were expressed as the mean value. The color difference between the initial wine and obtained retentates was determined by ΔE* value calculated by the following formula:
ΔE* = [(ΔL*)2 + (Δa*)2 + (Δb*)2]1/2,
2.11. Membrane Performance Determination
To evaluate membrane performance under different operating conditions, the following parameters were calculated:
where J is the permeate flux (L/m2h), Vp is the permeate volume (L), A is the membrane surface (m2), and t is time (hours). Further, the volume reduction factor (VRF) was calculated by:
where Vf is the initial feed volume (L) and VR is the retentate volume (L). Water flux was measured before and after each experimental run, and the fouling index (%) was calculated:
where JW0 and JW1 are the water fluxes (L/m2h) before and after wine concentration, respectively.
J = Vp/(A × t),
VRF = Vf/Vrt,
FI = (1 − JW1/JW0) × 100,
2.12. Statistical Analysis
The results were expressed as the mean ± standard deviation. Analysis of variance (ANOVA) and Fisher’s least significant difference (LSD) test (p < 0.05) were determined for statistical analyses in STATISTICA 13.1 (StatSoft Inc., Tulsa, OK, USA) software program.
3. Results and Discussion
3.1. Influence of Processing Parameters On Permeate Flux and Membrane Fouling
Four different transmembrane pressures (25, 35, 45, and 55 bar) and two temperature regimes (with and without cooling) were applied during reverse osmosis (RO) and nanofiltration (NF) of the Cabernet Sauvignon red wine variety. The initial temperature in all runs was 20 °C, but the final temperature of retentates depended on the applied pressure (the higher the pressure, the higher the retentate temperature). Higher retentate temperatures in all runs were achieved during the reverse osmosis process compared to the nanofiltration at the same pressures (Figure 1). The cooling regime resulted in lower temperatures than in the experiments without cooling, meaning that the lowest final retentate temperature was measured at 25 bar with cooling (35 °C for RO and 32 °C for NF processes), and the highest at 55 bar without cooling (56 °C for RO and 47 °C for NF processes). The increase in pressure and temperature also resulted in higher permeate flux. The pressure had the main influence, but the increase in permeate flux was also a result of a lower viscosity of the feed due to higher temperature [14,30]. The highest average permeate flux was recorded at 55 bar without cooling (17.75 L/m2h for RO and 39.45 L/m2h for NF processes), and the lowest one was measured at 25 bar with cooling (3.74 L/m2h during RO and 15.44 L/m2h during NF processes).
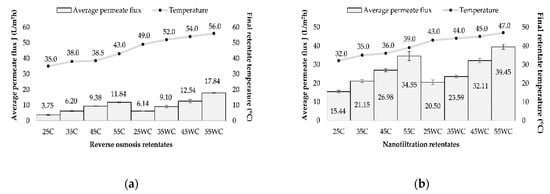
Figure 1.
Influence of transmembrane pressure (25, 35, 45, and 55 bar) on the average permeate flux (L/m2h) and retentate temperature (°C) during concentration of Cabernet Sauvignon red wine by reverse osmosis (a) and nanofiltration (b), with (C) and without cooling (WC).
Several factors influence the membrane filtration processes, such as membrane type, the number of membranes used, module arrangement, operating time, applied pressure, and temperature [20,31]. The increase in feed concentration and membrane fouling during reverse osmosis and nanofiltration processes results in an increase in osmotic pressure on the membrane surface that leads to a permeate flux decrease [17,31,32]. In this study, the volume reduction factor (VRF) was calculated, and its influence on permeate flux was observed (Figure 2).
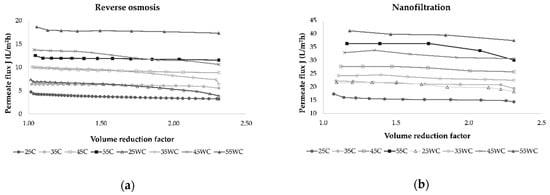
Figure 2.
Influence of retentate concentration index (Irt) on permeate flux (L/m2h) during concentration of Cabernet Sauvignon red wine by reverse osmosis (a) and nanofiltration (b) at 25, 35, 45, and 55 bar, with (C) and without cooling (WC).
In all experiments, the permeate flux decreased as the VRF value increased (2.31 was achieved at the end of each experiment), resulting in higher retention of bioactive compounds in the retentate. This behavior was a result of concentration polarization, fouling of the membrane, and osmotic pressure on the membrane surface [31,33,34]. The duration of each experimental run depended on applied pressure and temperature, and if these parameters were higher, the process took less time to obtain the desired volume of retentate and VRF. This is shown in Figure 3, where it can be observed that lower pressure and cooling regime resulted in a longer filtration process. Furthermore, the NF process was significantly shorter than RO at the same operating conditions.
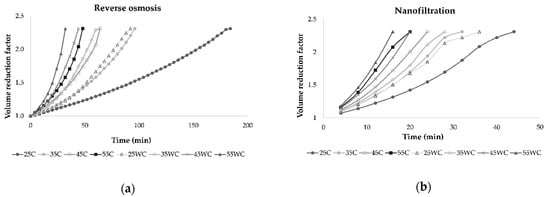
Figure 3.
Influence of process duration (min) on volume reduction factor during concentration of Cabernet Sauvignon red wine by reverse osmosis (a) and nanofiltration (b) at 25, 35, 45, and 55 bar, with (C) and without cooling (WC).
Gurak et al. [34] used the LabUnit 20 system for reverse osmosis concentration of grape juice. They established that transmembrane pressure increased from 40 to 60 bar and temperature increased from 20 to 40 °C leading to higher permeate flux. In this study, permeate flux during reverse osmosis and nanofiltration was the highest at 55 bar when cooling was not applied. The use of NF membranes resulted in higher permeate flux than RO membranes due to larger pore size [31]. During both processes, the retentate volume was reduced, and the VRF increased through time, lowering the permeate flux and increasing the membrane fouling. A VRF value of 2.31 was achieved in all experiments, but it was achieved faster at higher pressures due to higher permeate flux. Yammine et al. [19] obtained similar results for VRF using three different pressures, 10, 20, and 30 bar.
The permeate flux decline under constant operating pressure occurred due to membrane fouling, as mentioned. However, if a constant flux is ensured, a pressure increase will occur [35]. It is a consequence of sealing or blocking of the membrane pores and cake formation [36]. In this study, the flux of pure water was measured before and after each wine concentration to establish flux decline due to membrane fouling. Average values were calculated and are presented in Figure 4. It can be observed that during NF processes before and after wine concentration, water flux was higher than the ones in RO processes. During both processes, the water flux significantly decreased after wine concentration, compared to the one before concentration.
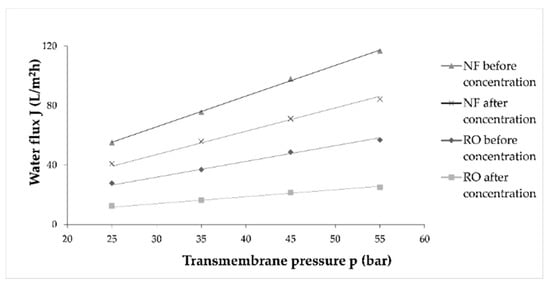
Figure 4.
Influence of different transmembrane pressure (bar) on water flux (L/m2h) before and after wine concentration by reverse osmosis (RO) and nanofiltration (NF) processes at 55 bar with cooling.
According to the water flux before and after wine concentration, the fouling index (FI) for RO and NF membranes was calculated and is presented in Table 1. The fouling index was significantly higher for RO membranes (average FI was 55.66%) than for NF membranes (26.76%). This was expected because RO membranes retain smaller molecules and ions due to smaller pore size and molecular weight cut-off (MWCO) than the NF membranes.

Table 1.
Fouling index (%) of reverse osmosis (RO) and nanofiltration (NF) membranes at four different pressures.
Membrane fouling and FI depend on the chemical composition of the feed, organic molecules, salt, and colloidal accumulation [35,37] and on the adsorption of organic compounds on the membrane surface. The adsorption of compounds on the membrane was a result of hydrophobic interactions [7]. Each compound contributes to the membrane fouling, depending on their chemical characteristics, such as molecular weight and polarity [38]. Increased adsorption of compounds and hydrophobic interactions on the membrane surface were correlated to higher flux decline [39]. Fouling of the membrane can increase the retention of bioactive compounds, but the permeate flux decline will eventually result in a slow concentration process, membrane deterioration, and high production costs [37].
3.2. Influence of Processing Parameters on Total Phenolic Compounds Retention
Total polyphenol content (TPC), total flavonoid content (TFC), monomeric anthocyanin content (MAC), and polymeric color (PC) of the initial wine and retentates obtained by reverse osmosis and nanofiltration are presented in Table 2 and Table 3, respectively. The concentrations of total phenolic compounds increased during reverse osmosis treatment of Cabernet Sauvignon red wine, especially at higher pressures and lower temperatures. When cooling was not applied, slightly lower retention of TPC was observed due to the higher permeability of the membrane [33,34]. The results showed that the highest concentration of TPC was measured in the RO retentate at 45 bar (3.06 g/L) and 55 bar (3.11 g/L) with cooling, and the lowest at 25 and 35 bar without cooling (2.51 and 2.50 g/L, respectively). However, during the reverse osmosis process, their concentration increased compared to the initial wine (1.85 g/L). The concentration of TPC also increased during the nanofiltration process, and the highest concentrations were found in all retentates obtained with cooling (without significant difference among applied pressures) and the retentate obtained at 55 bar without cooling (around 3 g/L).
Table 2.
Total polyphenol content (TPC), total flavonoid content (TFC), monomeric anthocyanin content (MAC), and polymeric color (PC) of an the initial Cabernet Sauvignon wine variety and retentates obtained by reverse osmosis at 25, 35, 45, and 55 bar with cooling (C) and without cooling (WC).
Table 3.
Total phenolic compounds of the initial Cabernet Sauvignon wine variety and retentates obtained by nanofiltration at 25, 35, 45, and 55 bar with cooling (C) and without cooling (WC).
The initial wine contained 0.71 g/L of TFC. The TFC content increased during the RO process, with the highest concentration at 45 bar (1.32 g/L) and 55 bar (1.39 g/L) with cooling, although there was no significant difference (p > 0.05) between those values and the one obtained at 55 bar without cooling (1.33 g/L). Nanofiltration processes at 45 and 55 bar resulted in similar TFC retention, and at those pressure, the highest concentrations (around 1.32 g/L) were measured with no significant difference between the two temperature regimes. The lowest concentrations of TFC in RO retentates were found at 25 and 35 bar without cooling (1.10 g/L for both) and in NF retentates at 25 bar with cooling (1.16 g/L).
Processes at 55 bar with cooling were the best in terms of monomeric anthocyanins retention, where the concentration was 170.12 mg/L in RO retentate and 162.48 mg/L in NF retentate, which is almost double the concentration found in the initial wine (88.38 mg/L). During processes without cooling, lower retention of MAC was observed compared to the processes with cooling. Compared to the RO membranes, NF membranes retained slightly higher concentrations of MAC when cooling was not applied at the same pressures.
Polymeric color represents the percentage of the color derived from polymerized material [33], and in the initial wine, 54.77% of polymeric color was measured. During the reverse osmosis process, an increase in polymeric color percentage was observed, but there was no significant difference among obtained retentates (average value was 60.85%). A similar trend for the polymeric color was observed during the nanofiltration process, where the average value among retentates was 60.75%, with no significant difference regarding pressure or temperature change.
Comparing two types of membranes, RO98pHt and NF M20, it was observed that both membranes retained phenolic compounds and both processes resulted in higher concentrations of TPC, TFC, and MAC than in the initial wine. RO processes with cooling resulted in retentates with similar content of TPC and TFC and higher concentrations of MAC in comparison to NF processes with cooling. However, when cooling was not applied, NF process retained slightly higher concentrations of total polyphenols, flavonoids, and monomeric anthocyanins. The highest difference was observed for MAC content at 55 bar without cooling (130.49 mg/L in RO retentate and 152.38 mg/L in NF retentate). Gurak et al. [34] established that higher pressure (60 bar) and lower temperature (20 °C) resulted in higher retention of MAC in grape juice. Reverse osmosis membranes retain smaller molecules and ions than nanofiltration ones, but this leads to faster membrane fouling and higher retentate temperature. Higher retentate temperature leads to higher membrane permeability and lower retention of phenolic compounds. Banvolgyi et al. [14] found that retention of resveratrol and anthocyanins during nanofiltration of red wine was higher at lower temperatures (20 °C). Similar results have been obtained during chokeberry juice concentration by reverse osmosis [33].
3.3. Influence of Processing Parameters on Individual Phenolic Compounds Retention
The concentrations of gallic acid, (+)-catechin, (−)-epicatechin, caffeic, caftaric, and coutaric acid in the initial Cabernet Sauvignon wine and retentates obtained by reverse osmosis and nanofiltration at 25, 35, 45, and 55 bar with and without cooling are presented in Table 4 and Table 5.
Table 4.
Concentration (mg/L) of individual phenolic compounds in the initial Cabernet Sauvignon wine variety and retentates obtained by reverse osmosis at 25, 35, 45, and 55 bar with cooling (C) and without cooling (WC).
Table 5.
Concentration (mg/L) of individual phenolic compounds in the initial Cabernet Sauvignon wine variety and retentates obtained by nanofiltration at 25, 35, 45, and 55 bar with cooling (C) and without cooling (WC).
One phenolic acid (gallic acid), two flavan-3-ols (catechin and epicatechin), and three hydroxycinnamic acids (caffeic, caftaric, and coutaric acid) were monitored in the initial red wine and retentates obtained by reverse osmosis and nanofiltration. Those components are characteristic of red wines, including the Cabernet Sauvignon wine variety [40,41,42]. The concentration of gallic acid in the initial wine was 23.2 mg/L, and after the reverse osmosis process, an increase in gallic acid concentration was observed, with the highest concentration at 55 bar with cooling (39.0 mg/L). The concentrations of catechin and epicatechin followed the same trend, increasing from 54.7 and 47.0 mg/L in the initial wine to 99.2 and 81.9 mg/L, respectively, in the RO retentate at 55 bar with cooling. The increase in transmembrane pressure had the same effect on the hydroxycinnamic acid retention, meaning that the highest concentrations of caffeic, caftaric, and coutaric acids were found in the retentate obtained at 55 bar with cooling. The increase in temperature in the RO process without cooling resulted in lower retention of all phenolic compounds compared to the regime with cooling. The change in applied pressure had the same influence in both temperature regimes.
The concentration of wine by nanofiltration resulted in an increase in all mentioned components, especially at 45 and 55 bar with cooling. The concentration of gallic acid increased from 23.2 mg/L in the initial wine to 29.5 mg/L in the NF retentates obtained with cooling, with no significant difference among pressures (p > 0.05). A small loss occurred when cooling was not applied. A similar trend was noticed for coutaric acid with the highest concentrations obtained with cooling (23.2–23.8 mg/L). The processes without cooling resulted in slightly higher retention of (+)-catechin than the regime with cooling at the same pressures, except for 55 bar with cooling where the concentration was highest (88.6 mg/L). Higher pressure and lower temperature were also beneficial for (−)-epicatechin, caffeic, and caftaric acid, with the highest concentrations obtained at 55 bar (73.0, 13.7, and 73.9 mg/L, respectively). The pressure change had no significant influence on caffeic acid concentration when cooling was not applied.
The retention of phenolic compounds depended on several factors. Membrane characteristics and operating conditions are the main ones. As stated before, pressure increase resulted in faster membrane fouling, increasing the retention of phenolic compounds. The retention of individual compounds depended on their molecular weight and polarity, membrane molecular weight cut-off (MWCO), membrane fouling index, and resistance [35]. In this study, the concentrations of individual phenolic compounds were slightly higher in the RO retentates than in the nanofiltration ones. Coutaric acid was an exception because its retention in NF retentates was similar to the one in RO retentates, even higher at lower pressures with cooling. It was expected that RO membranes show higher retention of phenolic compounds due to smaller pore size and MWCO value [43], but this was not the only parameter that affected phenolic retention. NF processes were significantly shorter, especially when cooling was not applied, compared to the RO processes. Long process duration can lead to higher degradation or permeation of individual compounds through the membrane [33]. Further, each compound reacts differently with the membrane surface that depends on the membrane and compounds’ chemical structure, hydrophobic, or hydrophilic interactions [44]. Cai et al. [38] studied the influence of membrane characteristics and six different phenolic compounds on membrane fouling. The analyzed phenolic compounds did not affect membrane fouling the same way, and it depended on their chemical properties, acidity coefficient, or molecular refractive index, etc. Besides operating conditions, membrane chemical composition played a significant role in membrane fouling, compounds adsorption, and retention.
3.4. Influence of Processing Parameters on Antioxidant Activity in Retentates
Phenolic compounds in wine affect the taste, feel, and color of wine, and they are mostly known as natural antioxidants [45]. Table 6 and Table 7 present antioxidant activity of Cabernet Sauvignon wine, RO, and NF retentates, determined by four different assays: DPPH, ABTS, FRAP, and CUPRAC. DPPH and ABTS are decolorization assays, while FRAP and CUPRAC are characterized by an absorbance increase at a certain wavelength as the antioxidants react with chromogenic reagent [46]. All assays differ in terms of principles and reaction conditions, and one was not sufficient to present the total antioxidant capacity of wine [47].
Table 6.
Antioxidant activity (2,2-diphenyl-1-picrylhydrazil DPPH, Trolox, 2,2′-azinobis(3-ethylbenzothiazoline sulfonic acid) (ABTS), ferric reducing/antioxidant power assay (FRAP), and cupric reducing antioxidant capacity (CUPRAC)) of the initial Cabernet Sauvignon wine variety and retentates obtained by reverse osmosis at 25, 35, 45, and 55 bar with cooling (C) and without cooling (WC).
Table 7.
Antioxidant capacity determined by four methods of the initial Cabernet Sauvignon wine variety and retentates obtained by nanofiltration at 25, 35, 45, and 55 bar with cooling (C) and without cooling (WC).
The antioxidant activity of the initial wine measured by DPPH, ABTS, FRAP, and CUPRAC assay was 10.34, 12.17, 1.86, and 69.46 μmol TE/100 mL, respectively. After the reverse osmosis process, antioxidant activity in all retentates increased. At higher pressures (45 and 55 bar) and when cooling was applied, higher antioxidant activity was measured. Higher temperature (without cooling regime) resulted in lower antioxidant activity of RO retentates compared to the ones obtained with cooling at the same pressures. There were no significant differences (p > 0.05) between values obtained at 25, 35, 45, and 55 bar without cooling, except for CUPRAC, where an increase in antioxidant activity was observed with pressure increment. This means that the pressure had a lower influence on antioxidant activity than temperature when cooling was not applied during the reverse osmosis process.
Table 7 presents the antioxidant activity of Cabernet Sauvignon red wine and retentates obtained by nanofiltration at 25, 35, 45, and 55 bar with and without cooling. The results showed that nanofiltration processes resulted in an increase in total antioxidant activity of all retentates comparing to the initial wine. Pressure increase had a low influence on the antioxidant activity of NF retentates. Slightly higher antioxidant activity was measured in retentates obtained at 55 bar at both temperature regimes. The CUPRAC assay was again an exception: higher pressure and temperature had a significant effect on the antioxidant activity of all retentates. This means that the highest antioxidant activity was measured at the highest pressure (55 bar) with cooling (149.99 µmol/100 mL). Compared to that, notable lower antioxidant activity was obtained when cooling was not applied, 113.82 µmol/100 mL at 55 bar. Compared to the RO process, the antioxidant activity of NF retentates was slightly higher when cooling was not applied.
It was visible that there was some difference between concentrations of phenolic compounds in RO and NF retentates, meaning that the type of membrane did not affect the retention of each compound equally. However, all obtained retentates contained higher concentrations of analyzed compounds and antioxidant activity than the initial wine. This means that both membranes, RO98pHt and NF M20, can be used for wine concentration and phenolic compounds retention. The findings in this study have been consistent with previous studies where it has been shown that membrane filtration can be used for chemical composition correction of must or wine or even wine industry waste [14,18,48,49,50,51]. Arboleda Mejia et al. [7] stated that nanofiltration membranes (three cellulose acetate and one commercial) are suitable for the recovery of phenolic compounds from red grape pomace extract. Further, Bánvölgyi et al. [20] used nanofiltration membranes at 30, 40, and 50 °C for the production of red wine concentrates with enriched valuable components (anthocyanins, resveratrol, etc.). They concluded that all concentrates had higher concentrations of analyzed compounds than the initial wine. At higher temperatures, retention of those compounds decreased, and loss occurred.
3.5. Influence of Processing Parameters on the Color of Obtained Retentates
Color parameters L*, a*, b*, C*, and °h were measured in the initial Cabernet Sauvignon wine and retentates obtained by reverse osmosis (Table 8) and nanofiltration (Table 9).
Table 8.
Color parameters (L*, a*, b*, °h, and C*) in the initial Cabernet Sauvignon wine and retentates obtained by reverse osmosis at 25, 35, 45, and 55 bar, with cooling (C) and without cooling (WC).
Table 9.
Color parameters (L*, a*, b*, °h and C*) in the initial Cabernet Sauvignon wine and retentates obtained by nanofiltration at 25, 35, 45, and 55 bar, with cooling (C) and without cooling (WC).
The results showed that the L* value in the initial wine (19.54) slightly decreased during RO and NF processes, meaning that those processes lowered the wine lightness. There was no significant change in the a* value in all retentates when cooling was applied, compared to the initial wine. A slight decrease was observed in samples without the cooling regime. The b* values were lower in RO and NF retentates than in the initial wine, with no significant difference (p > 0.05) among retentates obtained at 25, 35, and 45 bar at both temperature regimes. The hue angle (°h) in the initial wine was 31.99°, and this value decreased in RO and NF retentates. A slightly higher °h parameter was measured in retentates obtained at 45 and 55 bar in both temperature regimes than in the ones obtained at lower pressures. The C* value increased during both processes, especially at higher temperatures, meaning that membrane filtration processes resulted in more saturated color than the initial wine. However, colour changes measured by the Lab system in analyzed samples were not large enough to be distinguished by the human eye. This is proved by the ΔE* value that represents total color differences between the initial wine and obtained retentates. The human eye can distinguish color change when the ΔE* value is higher than 1, or 5 when the wine is observed through a glass [52]. In this study, results showed that RO and NF processes did not significantly change the colour of the initial wine (all ΔE* values were lower than 1).
4. Conclusions
This study showed that reverse osmosis and nanofiltration processes are suitable for fast red wine phenolic content correction. Both membrane filtration processes resulted in higher phenolic content than in the initial wine. Comparing the two types of membranes, RO98pHt M20 membranes retained slightly higher concentrations of most phenolic compounds than NF M20 due to smaller pore size, mostly when cooling was applied. The nanofiltration process resulted in a lower retentate temperature, shorter process duration, lower fouling index than the RO process. Four applied pressures had different effects on phenolics retention that were greater if the pressure was higher. Retentate temperature increased with the pressure, which had a small or no effect if cooling was applied. During reverse osmosis and nanofiltration processes without cooling, retentate temperature was higher, and it resulted in the loss of most compounds due to higher membrane permeability or thermal degradation. However, during both processes, no visible change was observed in the wine color determined by the Lab system. In conclusion, optimal operating parameters should be adjusted to achieve the desirable phenolic content and properties of red wine concentrates.
Author Contributions
Conceptualization, A.P., V.J. and J.M.; methodology, I.I., L.J., A.P. and M.K.; formal analysis, I.I., L.J., S.K. and B.M.; investigation, I.I., A.P. and M.K.; data curation, I.I., L.J. and A.P.; writing—original draft preparation, I.I., J.M.; writing—review and editing, A.P., V.J. and M.K.; supervision, A.P., L.J. and M.K.; project administration, A.P.; funding acquisition, A.P. All authors have read and agreed to the published version of the manuscript.
Funding
This research was funded by the Josip Juraj Strossmayer University in Osijek; Membrane processes: Influence of concentration on aroma and colour compounds in red wine, grant number ZUP2018-08.
Institutional Review Board Statement
Not applicable.
Informed Consent Statement
Not applicable.
Data Availability Statement
Not available.
Conflicts of Interest
The authors declare no conflict of interest.
References
- Garrido, J.; Borges, F. Wine and grape polyphenols—A chemical perspective. Food Res. Int. 2013, 54, 1844–1858. [Google Scholar] [CrossRef]
- Giovinazzo, G.; Grieco, F. Functional Properties of Grape and Wine Polyphenols. Plant Foods Hum. Nutr. 2015, 70, 454–462. [Google Scholar] [CrossRef] [PubMed]
- Meral, R. Antioxidant effects of wine polyphenols. Trakia J. Sci. 2008, 6, 57–62. [Google Scholar]
- Giovinazzo, G.; Carluccio, M.A.; Grieco, F. Wine Polyphenols and Health. In Bioactive Molecules in Food. Reference Series in Phytochemistry; Mérillon, J., Ramawat, K., Eds.; Springer Nature: Cham, Switzerland, 2019; pp. 1135–1155. ISBN 9783319780306. [Google Scholar]
- Fang, F.; Li, J.-M.; Zhang, P.; Tang, K.; Wang, W.; Pan, Q.-H.; Huang, W.-D. Effects of grape variety, harvest date, fermentation vessel and wine ageing on flavonoid concentration in red wines. Food Res. Int. 2008, 41, 53–60. [Google Scholar] [CrossRef]
- Balík, J.; Kyseláková, M.; Tříska, J.; Vrchotová, N.; Veverka, J.; Híc, P.; Totušek, J.; Lefnerová, D. The changes of selected phenolic substances in wine technology. Czech J. Food Sci. 2009, 26, S3–S12. [Google Scholar] [CrossRef]
- Arboleda Mejia, J.A.; Ricci, A.; Figueiredo, A.S.; Versari, A.; Cassano, A.; Parpinello, G.P.; De Pinho, M.N. Recovery of Phenolic Compounds from Red Grape Pomace Extract through Nanofiltration Membranes. Foods 2020, 9, 1649. [Google Scholar] [CrossRef] [PubMed]
- Ganorkar, P.; Nandane, A.; Tapre, A. Reverse Osmosis for Fruit Juice Concentration—A Review. Res. Rev. A J. Food Sci. Technol. 2012, 1, 23–36. [Google Scholar]
- Saha, B.; Torley, P.; Blackman, J.W.; Schmidtke, L.M. Review of processing technology to reduce alcohol levels in wines. In Proceedings of the 1st International Symposium Alcohol level reduction in wine-Oenoviti International Network, Bordeauxq, France, 6 September 2013; pp. 78–86. [Google Scholar]
- Ozturk, B.; Anli, E. Different techniques for reducing alcohol levels in wine: A review. BIO Web Conf. 2014, 3, 02012. [Google Scholar] [CrossRef]
- Gil, M.; Estévez, S.; Kontoudakis, N.; Fort, F.; Canals, J.M.; Zamora, F. Influence of partial dealcoholization by reverse osmosis on red wine composition and sensory characteristics. Eur. Food Res. Technol. 2013, 237, 481–488. [Google Scholar] [CrossRef]
- Pham, D.-T.; Stockdale, V.J.; Wollan, D.; Jeffery, D.W.; Wilkinson, K.L. Compositional Consequences of Partial Dealcoholization of Red Wine by Reverse Osmosis-Evaporative Perstraction. Molecules 2019, 24, 1404. [Google Scholar] [CrossRef] [PubMed]
- Longo, R.; Blackman, J.W.; Torley, P.J.; Rogiers, S.Y.; Schmidtke, L.M. Changes in volatile composition and sensory attributes of wines during alcohol content reduction. J. Sci. Food Agric. 2016, 97, 8–16. [Google Scholar] [CrossRef] [PubMed]
- Banvolgyi, S.; Savaş Bahçeci, K.; Vatai, G.; Bekassy, S.; Bekassy-Molnar, E. Partial dealcoholization of red wine by nanofiltration and its effect on anthocyanin and resveratrol levels. Food Sci. Technol. Int. 2016, 22, 677–687. [Google Scholar] [CrossRef] [PubMed]
- Bellona, C. Nanofiltration—Theory and Application. In Desalination; Kucera, J., Ed.; Scrivener Publishing LLC: Salem, MA, USA; Clarkson University: Potsdam, NY, USA, 2019; pp. 163–207. [Google Scholar]
- Massot, A.; Mietton-Peuchot, M.; Peuchot, C.; Milisic, V. Nanofiltration and reverse osmosis in winemaking. Desalination 2008, 231, 283–289. [Google Scholar] [CrossRef]
- Chakraborty, S.; Bag, B.C.; DasGupta, S.; Basu, J.K.; De, S. Prediction of permeate flux and permeate concentration in nanofiltration of dye solution. Sep. Purif. Technol. 2004, 35, 141–152. [Google Scholar] [CrossRef]
- Cassano, A. Recovery of Polyphenols from Wine Wastewaters by Membrane Operations. In Encyclopedia of Membranes; Springer: Berlin, Heidelberg, 2016; pp. 1717–1718. [Google Scholar]
- Yammine, S.; Rabagliato, R.; Vitrac, X.; Mietton-Peuchot, M.; Ghidossi, R. The use of nanofiltration membranes for the fractionation of polyphenols from grape pomace extracts. Oeno One 2019, 53, 11–26. [Google Scholar] [CrossRef]
- Banvolgyi, S.; Kiss, I.; Bekassy-Molnar, E.; Vatai, G. Concentration of red wine by nanofiltration. Desalination 2006, 198, 8–15. [Google Scholar] [CrossRef]
- Di Giacomo, G.; Taglieri, L. Production of Red Wine Polyphenols as Ingredient for the Food and Pharmaceutical Industry. Int. J. Food Sci. Nutr. Eng. 2012, 2, 12–15. [Google Scholar] [CrossRef][Green Version]
- Ough, C.S.; Amerine, M.A. Methods Analysis of Musts and Wines; John Wiley & Sons Inc.: New York, NY, USA, 1988. [Google Scholar]
- Kim, D.O.; Jeong, S.W.; Lee, C.Y. Antioxidant capacity of phenolic phytochemicals from various cultivars of plums. Food Chem. 2003, 81, 321–326. [Google Scholar] [CrossRef]
- Giusti, M.M.; Wrolstad, R.E. Characterization and measurement of anthocyanins by UV—Visible spectroscopy. In Current Protocols in Food Analytical Chemistry; Wrolstad, R.E., Schwartz, S.J., Eds.; John Wiley & Sons Inc.: New York, NY, USA, 2001; pp. 5–69. [Google Scholar]
- Brand-Williams, W.; Cuvelier, M.E.; Berset, C. Use of a free radical method to evaluate antioxidant activity. LWT Food Sci. Technol. 1995, 28, 25–30. [Google Scholar] [CrossRef]
- Re, R.; Pellegrini, N.; Proteggente, A.; Pannala, A.; Yang, M.; Rice-Evans, C. Antioxidant activity applying an improved ABTS radical cation decolorization assay. Free Radic. Biol. Med. 1999, 26, 1231–1237. [Google Scholar] [CrossRef]
- Benzie, I.F.F.; Strain, J.J. Ferric reducing/antioxidant power assay: Direct measure of total antioxidant activity of biological fluids and modified version for simultaneous measurement of total antioxidant power and ascorbic acid concentration. Methods Enzymol. 1999, 299, 15–27. [Google Scholar] [CrossRef] [PubMed]
- Özyürek, M.; Güçlü, K.; Tütem, E.; Bakan, K.S.; Erçaǧ, E.; Esin Çelik, S.; Baki, S.; Yildiz, L.; Karaman, Ş.; Apak, R. A comprehensive review of CUPRAC methodology. Anal. Methods 2011, 3, 2439–2453. [Google Scholar] [CrossRef]
- Vukoja, J.; Pichler, A.; Kopjar, M. Stability of Anthocyanins, Phenolics and Color of Tart Cherry Jams. Foods 2019, 8, 255. [Google Scholar] [CrossRef]
- Siddiqui, M.U.; Arif, A.F.M.; Bashmal, S. Permeability-selectivity analysis of microfiltration and ultrafiltration membranes: Effect of pore size and shape distribution and membrane stretching. Membranes 2016, 6, 40. [Google Scholar] [CrossRef]
- Popović, K.; Pozderović, A.; Jakobek, L.; Rukavina, J.; Pichler, A. Concentration of chokeberry (Aronia melanocarpa) juice by nanofiltration. J. Food Nutr. Res. 2016, 55, 159–170. [Google Scholar]
- Díaz-Reinoso, B.; Moure, A.; Domínguez, H.; Parajó, J.C. Ultra- and nanofiltration of aqueous extracts from distilled fermented grape pomace. J. Food Eng. 2009, 91, 587–593. [Google Scholar] [CrossRef]
- Pozderovic, A.; Popovic, K.; Pichler, A.; Jakobek, L. Influence of processing parameters on permeate flow and retention of aroma and phenolic compounds in chokeberry juice concentrated by reverse osmosis. Cyta J. Food 2016, 14, 382–390. [Google Scholar] [CrossRef]
- Gurak, P.D.; Cabral, L.M.C.; Rocha-Leão, M.H.M.; Matta, V.M.; Freitas, S.P. Quality evaluation of grape juice concentrated by reverse osmosis. J. Food Eng. 2010, 96, 421–426. [Google Scholar] [CrossRef]
- Koo, C.H.; Mohammad, A.W.; Suja’, F.; Meor Talib, M.Z. Use and development of fouling index in predicting membrane fouling. Sep. Purif. Rev. 2013, 42, 296–339. [Google Scholar] [CrossRef]
- El Rayess, Y.; Albasi, C.; Bacchin, P.; Taillandier, P.; Mietton-Peuchot, M.; Devatine, A. Analysis of membrane fouling during cross-flow microfiltration of wine. Innov. Food Sci. Emerg. Technol. 2012, 16, 398–408. [Google Scholar] [CrossRef]
- Koo, C.H.; Mohammad, A.W.; Suja’, F.; Meor Talib, M.Z. Review of the effect of selected physicochemical factors on membrane fouling propensity based on fouling indices. Desalination 2012, 287, 167–177. [Google Scholar] [CrossRef]
- Cai, M.; Hou, W.; Li, Z.; Lv, Y.; Sun, P. Understanding Nanofiltration Fouling of Phenolic Compounds in Model Juice Solution with Two Membranes. Food Bioprocess Technol. 2017, 10, 2123–2131. [Google Scholar] [CrossRef]
- Arsuaga, J.M.; López-Muñoz, M.J.; Sotto, A. Correlation between retention and adsorption of phenolic compounds in nanofiltration membranes. Desalination 2010, 250, 829–832. [Google Scholar] [CrossRef]
- Burin, V.M.; Arcari, S.G.; Costa, L.L.F.; Bordignon-Luiz, M.T. Determination of some phenolic compounds in red wine by RP-HPLC: Method development and validation. J. Chromatogr. Sci. 2011, 49, 647–651. [Google Scholar] [CrossRef] [PubMed]
- Jiang, B.; Zhang, Z.W. Comparison on phenolic compounds and antioxidant properties of cabernet sauvignon and merlot wines from four wine grape-growing regions in China. Molecules 2012, 17, 8804–8821. [Google Scholar] [CrossRef]
- Šeruga, M.; Novak, I.; Jakobek, L. Determination of polyphenols content and antioxidant activity of some red wines by differential pulse voltammetry, HPLC and spectrophotometric methods. Food Chem. 2011, 124, 1208–1216. [Google Scholar] [CrossRef]
- López-Muñoz, M.J.; Sotto, A.; Arsuaga, J.M.; Van der Bruggen, B. Influence of membrane, solute and solution properties on the retention of phenolic compounds in aqueous solution by nanofiltration membranes. Sep. Purif. Technol. 2009, 66, 194–201. [Google Scholar] [CrossRef]
- Conidi, C.; Cassano, A. Recovery of phenolic compounds from bergamot juice by nanofiltration membranes. Desalin. Water Treat. 2015, 56, 3510–3518. [Google Scholar] [CrossRef]
- López-Vélez, M.; Martínez-Martínez, F.; Valle-Ribes, C. Del The Study of Phenolic Compounds as Natural Antioxidants in Wine. Crit. Rev. Food Sci. Nutr. 2003, 43, 233–244. [Google Scholar] [CrossRef]
- Apak, R.; Güçlü, K.; Birsen, D.; Özyürek, M.; Esin Çelik, S.; Bektaşoğlu, B.; Berker, K.I.; Özyurt, D. Comparative evaluation of various total antioxidant capacity assays applied to phenolic compounds with the CUPRAC assay. Molecules 2007, 12, 1496–1547. [Google Scholar] [CrossRef] [PubMed]
- Büyüktuncel, E.; Porgalı, E.; Çolak, C. Comparison of total phenolic content and total antioxidant activity in local red wines determined by spectrophotometric methods. Food Nutr. Sci. 2014, 5, 1660–1667. [Google Scholar] [CrossRef]
- Kiss, I.; Vatai, G.; Bekassy-Molnar, E. Must concentrate using membrane technology. Desalination 2004, 162, 295–300. [Google Scholar] [CrossRef]
- Versari, A.; Ferrarini, R.; Parpinello, G.P.; Galassi, S. Concentration of grape must by nanofiltration membranes. Food Bioprod. Process. Trans. Inst. Chem. Eng. Part C 2003, 81, 275–278. [Google Scholar] [CrossRef]
- Pati, S.; La Notte, D.; Clodoveo, M.L.; Cicco, G.; Esti, M. Reverse osmosis and nanofiltration membranes for the improvement of must quality. Eur. Food Res. Technol. 2014, 239, 595–602. [Google Scholar] [CrossRef]
- Bui, K.; Dick, R.; Moulin, G.; Galzy, P. Partial Concentration of Red Wine by Reverse Osmosis. J. Food Sci. 1988, 53, 647–648. [Google Scholar] [CrossRef]
- Pérez-Magariño, S.; González-Sanjosé, M.L. Application of absorbance values used in wineries for estimating CIELAB parameters in red wines. Food Chem. 2003, 81, 301–306. [Google Scholar] [CrossRef]


Publisher’s Note: MDPI stays neutral with regard to jurisdictional claims in published maps and institutional affiliations. |
© 2021 by the authors. Licensee MDPI, Basel, Switzerland. This article is an open access article distributed under the terms and conditions of the Creative Commons Attribution (CC BY) license (http://creativecommons.org/licenses/by/4.0/).