Article

A Study on the Hydrolysis of Urea Contained in Wastewater and Continuous Recovery of Ammonia by an Enzymatic Membrane Reactor

by
Mukhtar Nuhu Yahya
1,*,
Hüseyin Gökçekuş
1,
Derin Orhon
1,2,
Bülent Keskinler
3,
Ahmet Karagunduz
3 and
Philip Isaac Omwene
3,4
1
Department of Civil Engineering, Faculty of Civil and Environmental Engineering Near East University, TRNC, Mersin 10, Nicosia 99138, Turkey
2
ENVIS Energy and Environmental Systems Research and Development Ltd., ITU ARI Technocity, Maslak, Istanbul 34469, Turkey
3
Faculty of Environmental Engineering, Gebze Technical University, Cumhuriyet, 2254. Sk. No:2, Gebze, Kocaeli 41400, Turkey
4
Faculty of Agriculture and Environmental Sciences, Muni University, Arua P.O. Box 725, Uganda
*
Author to whom correspondence should be addressed.
Processes 2021, 9(10), 1703; https://doi.org/10.3390/pr9101703
Submission received: 21 April 2021 / Revised: 3 June 2021 / Accepted: 16 June 2021 / Published: 23 September 2021
(This article belongs to the Special Issue Advances in Water and Wastewater Treatment Processes)

Abstract

:
1. Background: Urea is the main product of the nitrogenous breakdown of protein metabolism in mammals. In this study, process intensification for enzymatic hydrolysis of urea by urease enzyme (jack bean urease) was examined in a membrane reactor. 2. Methods: Batch and continuous enzymatic hydrolysis reactions were performed at different substrate concentrations to determine the digestibility and affinity of the substrate with that of the enzyme. The hydrolysate samples were obtained by an optimized continuous enzyme membrane reactor (EMR) coupled with an ultra-filtration membrane (250 kDa). Feed concentration varied from 100 to 500 mg/L. Laboratory experiments were conducted at room temperature (20 ± 1 °C), with a flow rate of 20 mL/min, urease concentration of 0.067 g/L, ionic strength (I = 0, 0.01, 0.05), and ammonium nitrogen addition of (0, 100 mg/L, 200 mg/L, 500 mg/L). Moreover, the effect of ionic strength, ammonium nitrogen concentration, feed concentration, and enzyme concentration on urea hydrolysis was examined. Scanning electron microscopy (SEM) and energy dispersive X-ray spectroscopy (EDAX) analysis were used to identify the physicochemical properties as well as the elemental composition of the Ultra-Filtration membrane used in this study. 3. Results: The study revealed that higher ionic strength and higher concentrations of NH4SO2 and ammonium nitrogen (NH3-N) inhibithydrolysis of urea by reducing the urease enzyme activity in the system over time. 4. Conclusions: Herein, a sustainable alternative for the conversion of urea to ammonia by utilizing urease in an EMR was demonstrated.

1. Introduction

Pure urea is a colorless, odorless solid that has a weak base but is stronger than most amides and can be hydrolyzed in the presence of acids, bases, and urease [1]. Urea in an aqueous solution with ammonium nitrate or magnesium sulphatethat can be applied to agricultural lands as foliar fertilizer. Urea not only enters the environment via the washing of fertilizers from agricultural lands and wastewater from urea production plants, but also by leaching from fields and agro-breeding farms, in effluents from plants using urea as raw materials, and from the final product of mammalian protein metabolism. Protein metabolism is the reason behind the abundance of urea in coastal systems. Due to the extensive use of urea by many industrial sectors, it is produced in large volumes in their waste [1,2].
Industrial and domestic wastewaters contain significant volumes of nitrogenous compounds, urea and ammonia inclusive. Urea is a major nitrogenous fertilizer used in agriculture. Annually, 100 million tons of urea are produced, of which abundant quantities are used as mineral fertilizer [3]. Considerable quantities of both urea and ammonia find their way into wastewater, mainly through runoffs that cause more harm than good to the environment and discharge large volumes of pollutants to receiving water bodies. This discharged wastewater from the production plants can have an NH3-N level of approximately 125 mg/L and a urea level of approximately 750 mg/L. Approximately 40–50% of the total nitrogen in municipal wastewater treatment plants is in the form of ammonium ions (NH4+) [4]. Ammonia is a toxic pollutant in wastewaters that both affects fish species and is undesirable for humans as it is oxidized by nitrifying microorganisms to form nitrite and nitrate [5]. Ammonia reacts with carbon dioxide at high temperatures and pressures industrially to form what is called urea.
Urea demand has increased significantly with the rapid development of chemical industries and population growth as food security is needed by all countries. Urea is not only an important nitrogen fertilizer per se, but is also a good raw material for chemical producing industries. Around 85% of the total ammonia production in the world is consumed as fertilizer, with the remaining 15% used in other industrial applications such as fibers, plastics, and explosives among others [6]. Currently, there is worldwide attention on achieving food security, which has made urea and other forms of agricultural fertilizers increasingly scarce [2].
Excessive plant growth in the ecosystem is generally caused by the overload of the two most harmful environmental problems’ common species, which are ammonia and ammonium NH3/NH4. These two generate the well-known eutrophication phenomenon and reduce water quality. Ammonia is a harmful air pollutant because of its adverse impact on human health as well as climate change. In this sense, ammonia production is considered as an industrial source of carbon dioxide emissions causing the greenhouse effect [6]. Apart from human activities, other large amounts of waste waters containing urea are generated from urea production processes. Moreover, coastal systems have been facing tremendous attacks from urea as a result of the anthropogenic activities of many industries in recent decades, which has attracted the attention of numerous researchers in order to devise a solution to this problem [2].
Several chemical processes exist for manufacturing ammonia. The three most well-known and widely used methods are the Haber–Bosch process, indirect electrochemical process, and urea decomposition. The Haber–Bosch process was developed a century ago and is implemented at a very high temperature of between 400 and 500 °C and a pressure of between 130 and 170 bar. In this process, gaseous hydrogen and nitrogen react over a metal catalyst at a high temperature and pressure [7]. This process is very costly as it requires higher temperatures and pressures. Secondly, an electrochemical process is also used for removing ammonia and other pollutants from wastewater. It is a reliable process for treating wastewater with the advantages of minimal sludge generation, high operating efficiency, and the ability to operate under a wide range of ambient temperatures. The limitations of this process include: chlorine ion concentration in wastewater, pH, current density, the electric voltage applied, and the type of anode used. Higher current densities also affect this system, as this leads to more electric power consumption and directly increases the operational cost [8]. Another process used in ammonia removal/recovery is urea decomposition by either catalytic, strong oxidant, or hydrolysis processes. All these processes listed above have their respective limitations and costs as all are conducted at high temperatures and pressures, which limits their usage by many industries [1].
Many methods can be used in urea recovery or removal, and more are either at the development level or are being newly introduced. These include: hydrolysis of urea, enzymatic hydrolysis, catalytic decomposition of urea, decomposition by strong oxidants, removal by adsorbents, electrochemical urea removal method, etc. [1,9]. Moreover, several ongoing researches are being funded by many industries on urea recovery and conversion to ammonia. Urea discharge is becoming a challenge for many industries because of environmental laws and regulations. This research aims to propose an alternative separation technique for the recovery of ammonia from urea, and if this ammonia is recovered, it can be used in ammonia-based fertilizers by farmers and can contribute to lowering the cost of wastewater treatment and environmental sustainability [10].
In this study, urea hydrolysis was analyzed in synthetic wastewater prepared in a laboratory. We also investigated the dependence of the enzyme (urease) on ionic strength, ammonium nitrogen addition and on different feed concentrations, as well as how all these features affect the hydrodynamic, design, and performance of the system. An effective enzyme membrane reactor (EMR) system was set up for the recovery of ammonia that will convert the problematic pollutant urea that is mostly found in industrial as well as agricultural runoffs into an attractive economical commodity.
Moreover, with the prospect of achieving the complete recovery of urea in wastewater by an enzymatic process, this work presents an interesting example of coupling a chemical/biological reaction and a membrane separation technology. In addition, integrating membrane technology with biological processes will also help in enhancing organic removal and thereby reducing the fouling effects in the membrane [11]. This system is proposed because of its uniqueness in terms of enriching the ammonium ion inside the reactor and separating it from foreign matter with less energy input. Moreover, the system will also have an advantage over the previous enzymatic systems in terms of conversion, enzyme stability, and efficiency [12]. The retention of enzymes in the system will make the slurry recycling economically sound and enhance the cleaning of the membrane. When implemented, the system will have the unique advantage of enzyme recovery, which is lacking in other conventional batch reactors. The membrane system will also help in the separation or selectivity of components in the reactor according to their molecular weights. Furthermore, the results of this research will be useful for any wastewater containing urea.

2. Materials and Methods

2.1. Batch Hydrolysis

Batch enzymatic hydrolysis reactions were performed at different substrate concentrations in order to determine the digestibility and affinity of the substrate with that of the enzyme. Consequently, rate model parameters were determined to provide a basis for comparison between the batch and the continuous-mode enzymatic hydrolysis. A batch system was used to establish the kinetic parameters (Vmax and Km), which are essential in analyzing substrate-enzyme interactions. The continuous operation will serve as a proof-of-concept for the development of an EMR system to be used in the conversion of urea to ammonia in wastewater treatment systems. The system will consist of a reactor coupled with an Ultra-Filtration membrane. In the batch experiments, 100, 200, 500, 1000, 2000, and 4000 mg/L urea-N were mixed with different concentrations of urease enzyme in a batch reactor. Urease concentrations of 0.20, 0.15, 0.10, and 0.067 g/L were studied to measure the activity of the urease at different concentrations and the time taken for the hydrolysis was measured and recorded. Furthermore, 0.067 g/L of enzyme (urease) was used in order to minimize the use of urease in the system as it is expensive. Moreover, higher enzymatic concentrations in membrane processes increase membrane fouling. Membrane fouling and enzyme activity decay are the two most significant limitations that affect the performance of an EMR. All this was done at room temperature and an effluent pH of between 7.0 and 7.5.

2.2. Materials Used

The urea used for this research was purchased from Merck KGaA,64271 (Darmstadt, Germany) with the following physicochemical properties: purity of 99.5%; pH value of 9.0; molar mass of 60.06 g/mol; density 1.34 g/cm3; and melting point of 132–134 °C. Furthermore, 100 mg/L and 500 mg/L of substrate concentration were used for all the analyses at a room temperature of 20 ± 1 °C and a fixed enzyme concentration of 0.067 g/L. Urease enzyme (EC.3.5.1.5 Lyophilized) was purchased from Merck (KGaA 64271, Darmstadt, Germany). The enzyme has a specific activity at 5 U/mg. After the enzyme solution was prepared, it was stored in a refrigerator at −5 °C for further use [13]. Deionized water used for the experiments was produced by the MilliQ SP ultra-pure-water purification system (Nilcon Millipore Ltd., Tokyo, Japan). All other chemicals were extra pure or guaranteed commercially available reagent.

2.3. Enzyme Hydrolysis Reaction

The standard method for determining the kinetic parameter involves running a series of enzyme assays at multiple substrate (urea) concentrations and measuring the initial rate of reactions. For this study, different substrate (urea) concentrations were used starting from 200 mg/L, 500 mg/L, 1000 mg/L, 2000 mg/L, and 4000 mg/L in order to determine the enzyme kinetic parameters ( K m and V m a x ) at pH variation from pH 4 to 10, and an enzyme (urease) concentration of 0.067 g/L.
After the hydrolysis was started, the reaction was ceased after 5 min via the addition of concentrated hydrochloric acid (HCl). All the collected samples were tested for ammonium-nitrogen in a Kjeldahl’s distillation machine as guided by the standards.

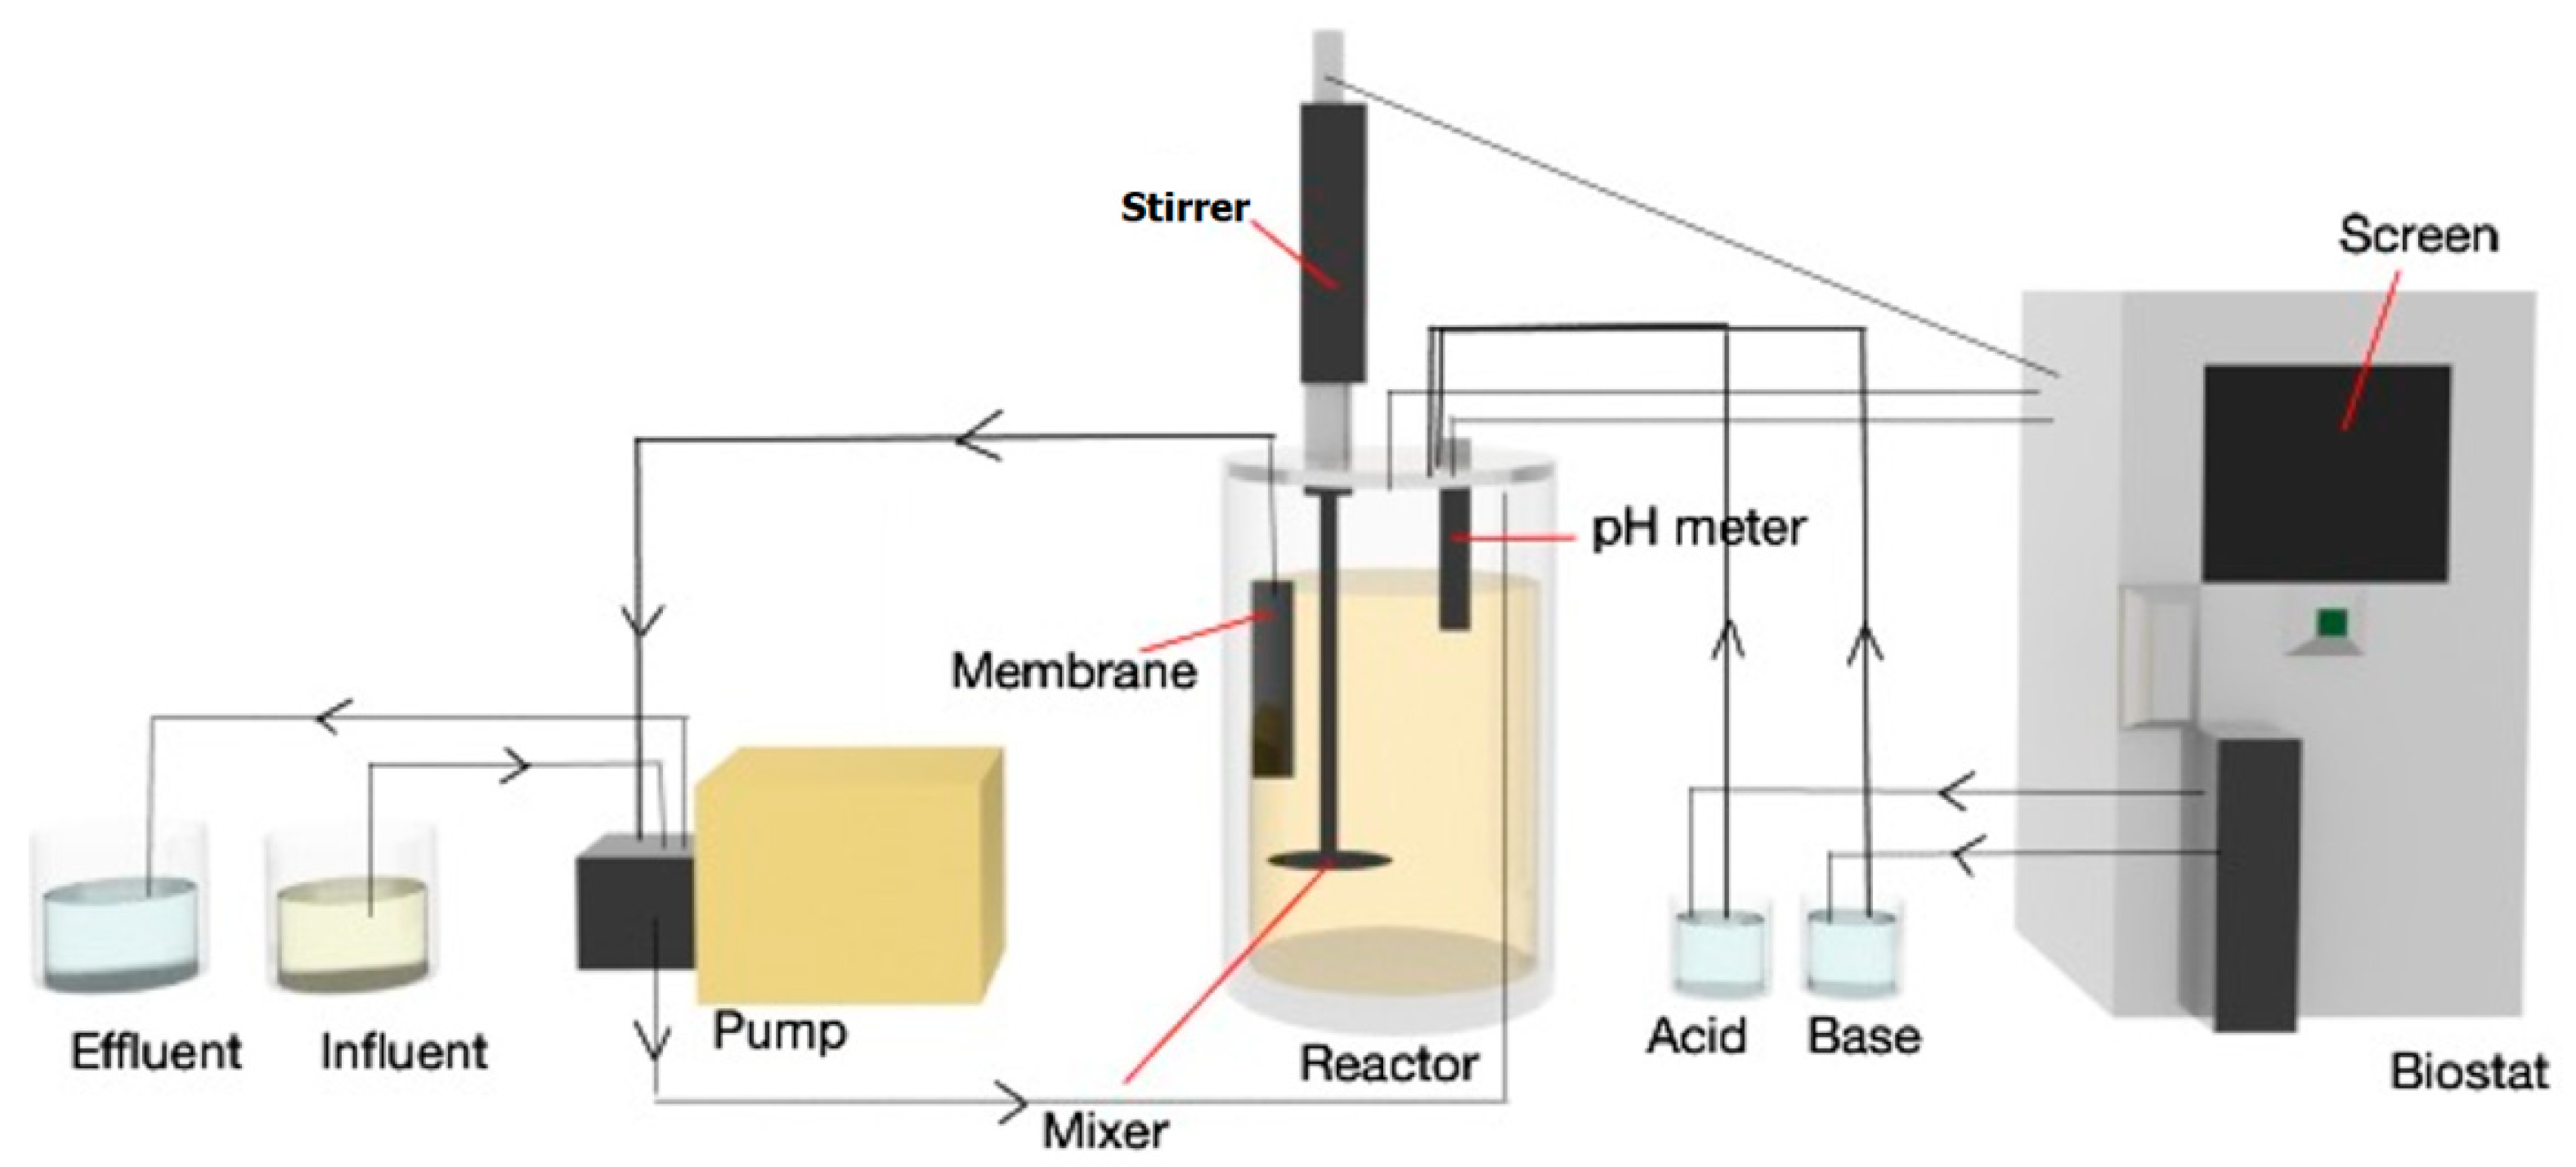
2.4. Continuous Enzymatic Hydrolysis of Urea

Continuous studies were carried out in a 4 L Bioreactor (BIOFLO 3000) coupled with an ultra-filtration membrane and stirred at 200 rpm. Two high pressure automated peristaltic pumps (Watson Marlow Peristaltic Pump Hydra cell, Falmouth, Cornwall, United Kingdom) equipped with a flow regulator were used to maintain the water in the reactor (Figure 1). The UF membrane used in this study was purchased from Sterlitech (Auburn, WA 98001, USA). The active layer of the UF membrane is made of polyvinylidene fluoride (PVDF) with a250 KDa molecular weight cut-off (MWCO). The UF membrane was expected to prevent the urease from passing to the permeate side of the membrane. Backwashing of the membrane was done with deionized water for 1 h after each experimental run, in order to keep the membrane clean and reduce fouling. To further reduce risks associated with contamination and mixing, all equipment used was thoroughly cleaned before usage and the reactor vessel was washed and sterilized.

2.5. Data Analysis and Experimental Reproducibility

The ammonium nitrogen analysis was determined using the Kjeldahl method [14]. The initial reaction velocity v was determined from the equation below.
v = C t t
where C t = concentration of NH4-N in mg/L and t = time taken for the conversion.
Experiments were performed in duplicate to ascertain the reproducibility of the process. SPSS version 21.0 was used for statistical analysis. One-way ANOVA (with Tukey post hoc test) was used for the analysis of significance in the comparison of multiple experimental results. The student’s t-test was used to evaluate statistical differences between results.

2.6. SEM and EDAX Technique

Scanning electron microscopy (SEM) and energy dispersion X-ray spectroscopy (EDX or EDAX) are chemical microanalysis techniques that are performed together in order to analyze or measure the atomic composition in a membrane before and after use in this study, for proper monitoring of the membrane and to minimize the fouling effect in the membrane used. The membranes used in this study were washed thoroughly with distilled water before being inserted into the reactor. After the system (EMR) was run, the used membranes were removed, weighed with a Mettler analytical balance, and dried at 60 °C before being takenfor EDAX analysis. The membranes were analyzed by an analyzer of dispersed energy, model EDAX marks Dxprime, with a CDU leap detector. Topographic analysis was also conducted using a JSM-5800LV microscope (JEOL). Morphology images are formed when the primary electron beams interact with the sample secondary electrons, while information on the sample composition isformed as a result of the back-scattering of the electrons. To obtain the elemental composition, we analyzed the topography images as well as the secondary X-rays emitted.

3. Results and Discussions

3.1. Effect of pH on Enzyme (Urease) Activity

To study the effect of pH on urease activity over a range of substrate concentrations, sodium hydroxide (NaOH) and hydrochloric acid (HCl) were used to raise and drop the pH values. Enzyme activity was evaluated using the Michaelis–Menten equation at different pH levels (4.0, 6.0, 7.0, 8.0, and at no pH control) and at room temperature (20 ± 1 °C). The effects of reaction pH on enzyme (urease) activity at different pH values are presented in Table 1 below. The results indicate higher enzyme activity at no pH control, as this has a K m value of 223.65 mg/L and V m a x of 13.83, which are lower compared to all other pH values even though the regression coefficient is not the highest. Based on the results shown below, the values of the enzyme kinetic parameters determined from the Lineweaver–Burk plot were selected as the best for urea hydrolysis.
The kinetic data were analyzed at different pH values using the initial rate method. Both K m and V m a x values were calculated using linear equations and the results are presented in Table 1 below. From the results obtained, it shows different values of Km and V m a x calculated at no pH control value to a pH value of 8. The K m and V m a x values at no pH control for the Lineweaver–Burk and Langmuir models were calculated to be 223.65 and 354.15 m/L, and 13.83 and 15.48 mg/L/min, respectively. The lower the K m value, the higher the affinity of enzyme for the substrate and vice versa. Normally, the effect or influence of pH on activity is usually caused by perturbations of enzyme distributed among differently protonated forms (range 4–9).
A study conducted by Yingjie and Cabral found sharp dependence of both K m and V m a x on pH when analysing urease in a pH range of 4–9 [14].

3.2. Effect of Enzyme Concentration on Batch Hydrolysis of Urea

The lifetime of a membrane used in an enzymatic process is prolonged by the action of the enzyme, and most enzymatic activities take place at lower temperatures and mild pH ranges. In a study by Munoz-Aguado in1996, it was reported that the use of lower amounts of enzymes in the membrane process can result in lower cleaning efficiency and higher cleaning duration, whereas higher enzymatic concentrations do not necessarily increase the cleaning action, thus increasing membrane fouling [15,16].
In Figure 2, the graph shows that the time taken for urea to hydrolyze in any wastewater containing urea depends on the amount of urease present or added. This also implies that the higher the enzyme urease concentration, the greater the conversion/hydrolysis. For this study, we will be using a urease concentration of 0.067 g/L.

3.3. Effect of Feed Concentration on Urease Activity

The effect of feed concentration on urea activity was studied at 100 mg/L and 500 mg/L urea-N concentrations with an enzyme concentration of 0.067 g/L and a flow rate of 20 mL/min. The experiments were performed at room temperature (20 ± 1 °C) with no pH control, as the activity of the urease can be affected by both pH and temperature variations.
According to the graph in Figure 3, for a substrate concentration of 100 mg/L, the ammonia concentration in the permeate increases gradually from an initial value of 33 mg/L to a maximum conversion value of 100 mg/L at 22 h. Total conversion of urea to ammonia was achieved after 22 h and the maximum time taken for the urease activity to elapse was 102 h. For the substrate concentration of 500 mg/L, the urea conversion to ammonia was shown to be around 50 mg/L at 0 h and reached a peak (500 mg/L) at around 18 h and the urease lost all its activity after 74 h. From the results, it can be concluded that the amount of NH4-N produced by the system is directly proportional to the initial concentration of the urea in wastewater; however, urease (enzyme) activity was adversely affected by high substrate concentration. These findings are in agreement with research conducted by Bremner, in which hydrolysis rate was affected by high urea concentration due to uncompetitive substrate inhibition or denaturation of enzymes at high urea concentrations [17].

3.4. Effect of Ammonium Sulphate (NH4)2SO4 Addition on Urease Activity

In this case, ammonium sulphate (NH4)2SO4 was added to the continuous reactor in order to determine its effect on urea hydrolysis. Concentrations of (NH4)2SO4 were varied from 0 to 500 mg/L in a continuous reactor containing urea (100 mg/L) and urease (concentration of 0.067 g/L) at a stirring speed of 200 rpm and at room temperature (20 ± 1 °C). The pH of the substrate was kept the same without being altered and all analyses were performed at room temperature.
As can be seen in Figure 4, urea hydrolysis to ammonia is the best with no addition of NH4-N, and this is achieved at around 10 h. Moreover, a drastic increase in the time for the urea to hydrolyze occurs as the ammonium nitrogen concentration is reduced, and this in turn increases the urease activity. The enzyme activity is higher with no NH4-N addition 0 mg/L (NH4)2SO4 although it takes more time to attain the maximum 100 mg/L urea hydrolysis (28 h). The results suggest that urease is inhibited by higher (NH4)2SO4 concentrations. This concurs with a research conducted by Deli Tong and Renkou Xu in 2011 [18]. In a similar study by Kumar and Wagenet, urease activity was reported to be lowest in alkaline and saline [19]. This study agrees with a study in which solutions of divalent salts Na2SO4 and (NH4)2SO4 were added to a solution containing enzyme. The efficiency of the formation of the polyelectrolyte-protein complexes was affected by the salt action; at low salt concentrations, the enzyme was drastically activated and it was inhibited at higher salt concentrations [20]. These data can be used to evaluate the optimal working conditions for bioremediation and wastewater treatment either on a pilot-scale or in big plants.

3.5. Effect of Feed Concentration pH on Urease Activity

The stability of enzymes is usually affected by the level of pH of the feed. Most enzyme activities are lost as a result of extremely high or low pH values. Optimum pH is achieved where the enzyme activity is the highest (7.0–7.4) as a rapid increase in pH may have a greater impact on urea hydrolysis [21]. For this study, a continuous system experiment was conducted using a UF membrane, but no pH adjustment was made as the feed solution pH was already at the optimum level for urea hydrolysis. The effect of pH on urease activity was determined in the range of pH 4–9 and at no pH control in a batch system experiment in this study; Lineweaver and Langmuir plots were used to evaluate the enzyme activity at different pH values and at room temperature of 20 ± 1 °C, and the results are presented in Table 1. The results indicate higher enzyme activity at no Ph control with Km = 223.65 mg/L and a Vmax = 13.83, and the lower the Km value, the higher the affinity of the enzyme for the substrate and vice versa. The batch system results serve as a reference for the continuous system. A research conducted by [22] shows that only slight differences were observed with a change in pH in the immobilization of urease. In another research conducted by Nelson and Cox [23], the effect of pH values results on the variations of enzymatic activity and alteration in charges of the protein and substrates in the reaction were investigated. The optimum pH for the activity of jack bean urease was reported to be between 7 and 8 [24].

3.6. Effect of Ionic Strength on Urease Activity

The ionic strength of a solution is the measure of the concentration of ions and is a key factor to consider in an enzymatic reaction. In this study, the ionic strength effect was also conducted by the addition of sodium chloride (NaCl) to the feed concentration. This was done in different ionic strength concentrations of I = 0, 0.01, and 0.05. Enzymes can be precipitated or denatured by the action of salts, solvents, and other reagents. Catalytic activity is the key performing parameter of any enzymatic process and depends solely on the concentrations of the substrates and the product, as well as on the pH and ionic strength [25]. Many studies have reported that an increase in ionic strength reduces enzyme activity [26]. Moreover, the stability and solubility of the enzyme as well as that of the substrate is found to be affected by increased ionic strength. Thus, the effect of salts on stability becomes a more important issue of concern. In a study by Bosco in 2002, the influence of ionic strength on the activity of lignin peroxides showed an S-shaped dependence of the residual activity of lip isoenzyme mixture (LIM) with respect to ionic strength. All these were done to predict the behavior of enzymes with regard to ionic strength and to the surrounding environment surrounding the enzyme molecule in general [26].
Figure 5 shows the influence of ionic strength on enzyme (urease) activity for ionic strength values of I = 0, 0.01, and 0.05. The graph shows a substantial decrease in the activity of urease with an increase in ionic strength over time. The graph also shows how ionic strength serves as an inhibitor in urea hydrolysis. This research agrees with the research conducted by Tikhonenko in 2009 in which the effects of inorganic mono-valent salts of different types were studied. The result shows that the solution of mono-valent salts NaCl, KCl, and NH4Cl decreases the enzyme urease activity drastically with an increase in ionic strength [20].

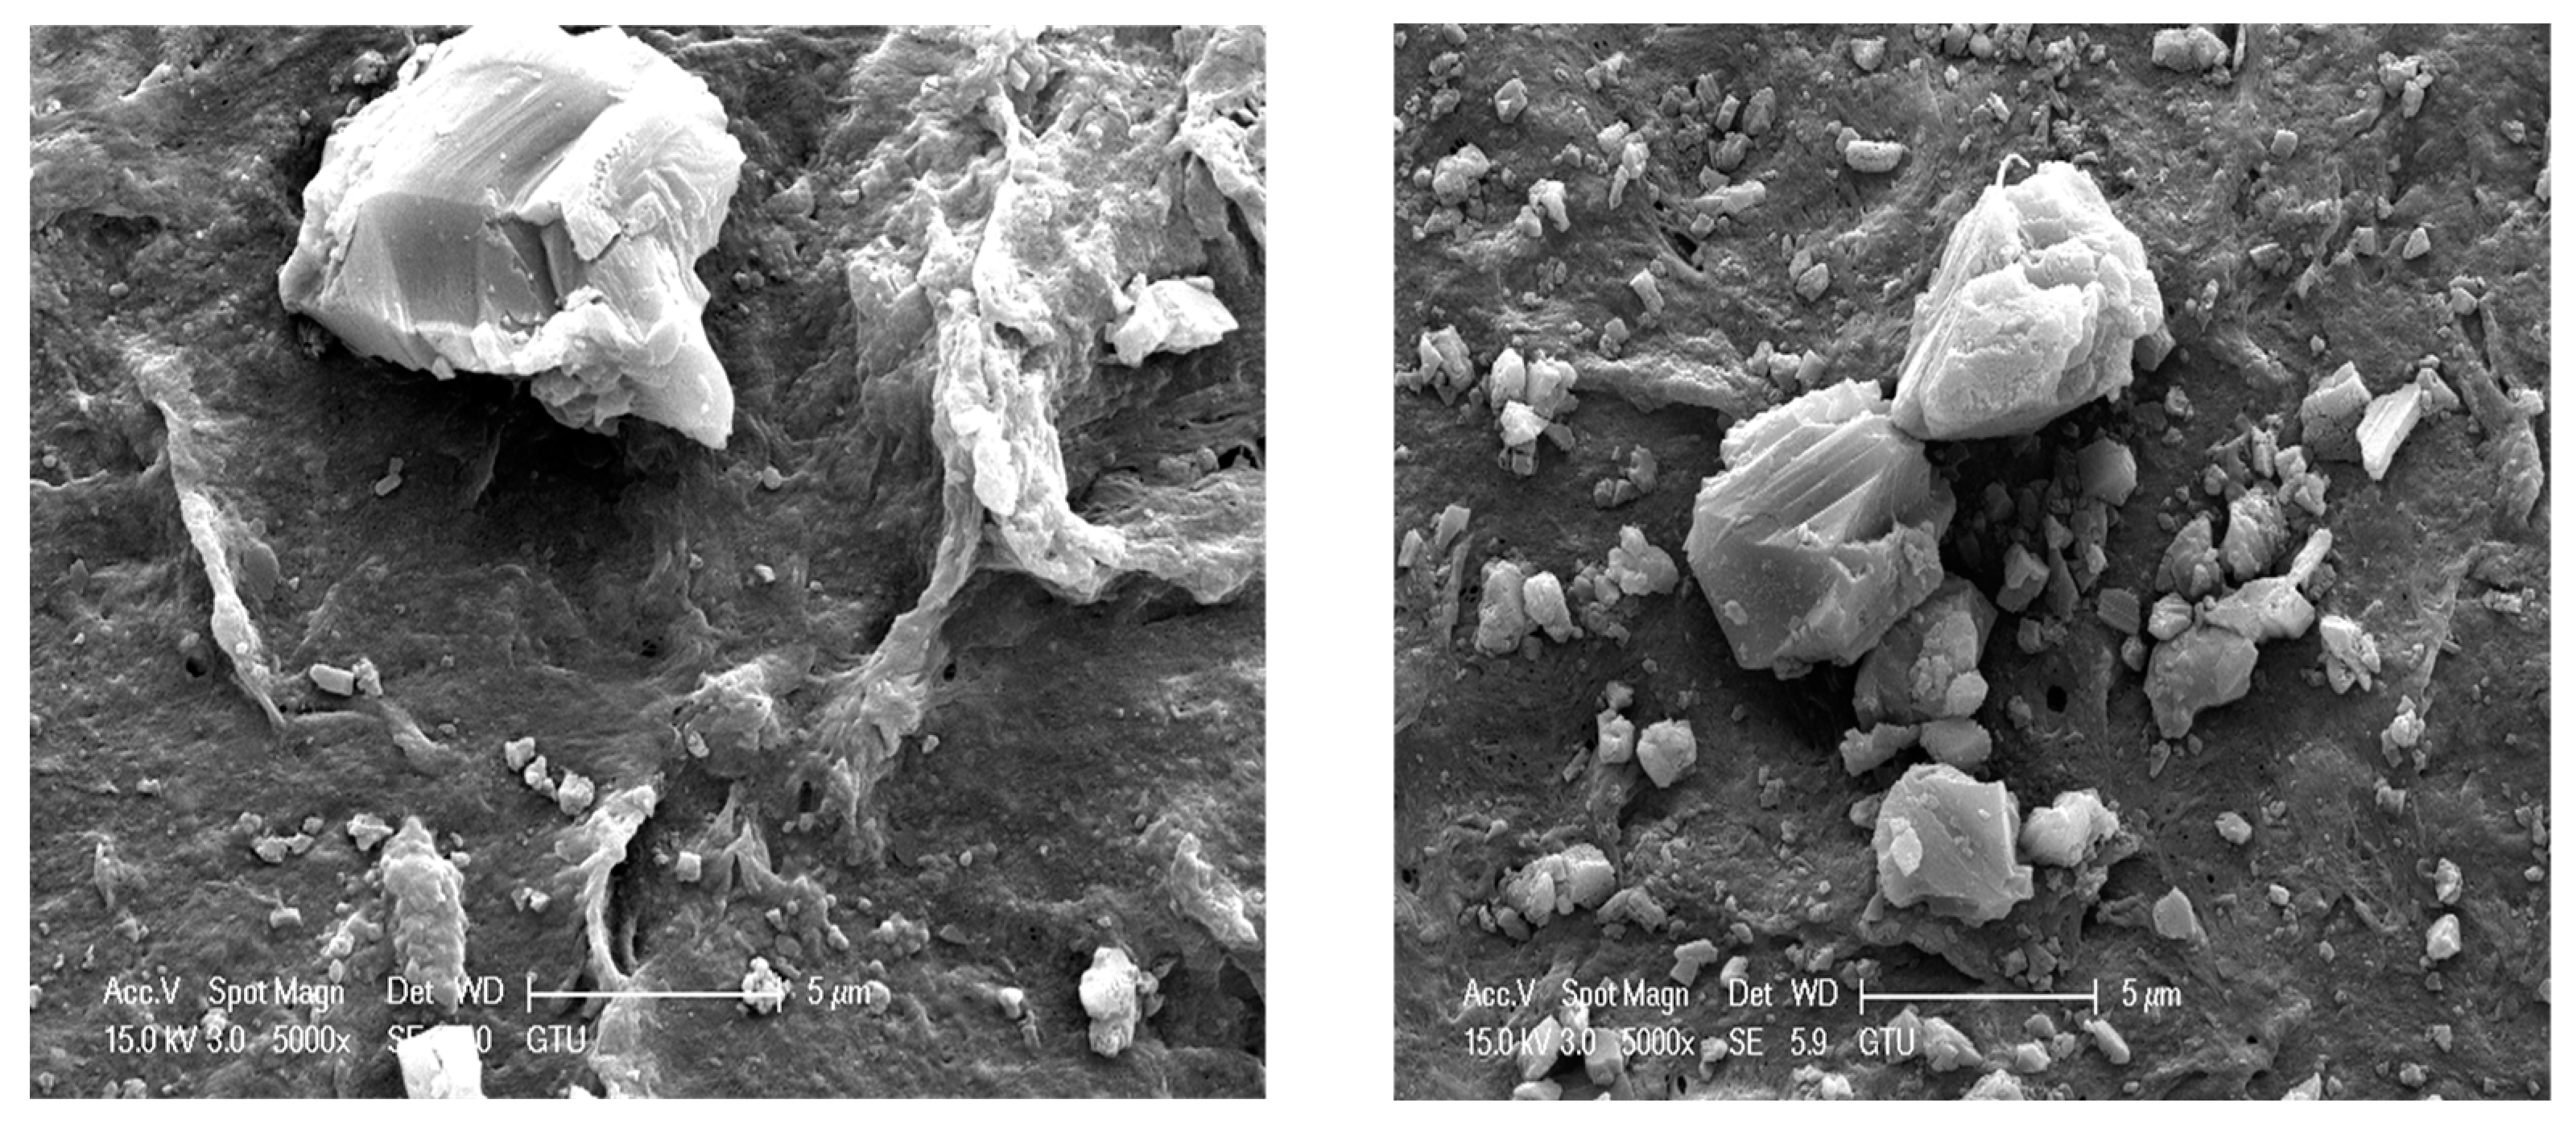
3.7. Analysis of Membrane Surface and Fouling

Membrane autopsy was performed by scanning electron microscopy (SEM) for analysis of membrane morphology. Energy-dispersive X-ray spectroscopy (EDAX) was used to study the physicochemical characteristics of the membrane. The results from the SEM analysis show different elementary compositions at different spots, as shown in Figure 6. The resolution in the images provided can be used to distinguish between a clean membrane and a membrane used in the reactor for easy identification. The EDAX results presented in Table 2 and Table 3 below show the elements that are attached or get stacked onto the membrane and the percentage of each element. Whereas Table 4 shows the composition of a clean membrane surface determined by an EDAX technique. For this study, the elements attached to the ultra-filtration membrane being used included a high percentage of oxygen, carbon, calcium fluorine, sodium, and some traces of iron, nickel, and aluminum (Figure 7). The presence of sodium in the membrane was a result of the nature of the manufacturing process, while that of calcium was due to the surface contamination effect.

4. Conclusions

This work presented a concept of an EMR system to achieve ammonia recovery from water containing urea. This EMR system, when put in place, will be used to hydrolyze urea from wastewater and convert itinto ammonia. The system will not only reduce the cost of ammonia recovery, but also reduce the environmental footprint associated with the removal process. From the results obtained, it can be concluded that the system provides an alternative targeting the conversion of urea to ammonia, and also the effect of inhibitors as well as activators in the conversion process. Moreover, another advantage of the proposed system is the continuous use of enzyme in the reactor, which is economical and will be an innovation that will attract stakeholders’ attention in wastewater reuse. Furthermore, the costs, energy, and environmental footprint associated with ammonia/ammonium recovery from wastewater are also reduced by this process as less urease is used. The results from this experiment show how the ionic strength effect and ammonium nitrogen addition serve as inhibitors in urea hydrolysis to ammonia and carbon dioxide and also reduce the urease activity. Moreover, the experiment also explored how wastewaters containing higher concentrations of urea can be hydrolyzed to ammonia and carbon dioxide using urease as an enzyme. This was done by varying the feed concentration from 100 to 500 mg/L as most wastewater containing urea contains approximately 750 mg/L of urea. However, the results showed that the system could be used in any wastewater treatment system containing urea or ammonia and will be a more economical and sustainable system over a batch process.

Author Contributions

Conceptualization, A.K., D.O. and B.K.; methodology, M.N.Y., B.K.; software, M.N.Y. and P.I.O.; validation, M.N.Y., P.I.O. and A.K.; formal analysis, M.N.Y. and P.I.O.; investigation, M.N.Y.; resources, A.K., B.K.; data curation, M.N.Y. and P.I.O.; writing—original draft preparation, M.N.Y.; writing—review and editing, M.N.Y., H.G. and A.K.; visualization, M.N.Y. and P.I.O.; supervision, H.G. and D.O., A.K. and B.K.; project administration, H.G., D.O., and B.K.; funding acquisition, M.N.Y. All authors have read and agreed to the published version of the manuscript.

Funding

This research received no external fund.

Institutional Review Board Statement

Not applicable.

Informed Consent Statement

Not applicable for this studies as the study is not involving humans and animals.

Data Availability Statement

Not applicable for this studies not involving humans.

Acknowledgments

The authors would like to thank Gebze Technical University for providing the laboratory where all the experiments were conducted.

Conflicts of Interest

The authors declare that they have no conflict of interest. There are no conflicts of interest regarding this submission.

References

  1. Urbańczyk, E.; Sowa, M.; Simka, W. Urea removal from aqueous solutions—A review. J. Appl. Electrochem. 2016, 46, 1011–1029. [Google Scholar] [CrossRef] [Green Version]
  2. Lilong, Y.; Weiguang, L.; Yuan, R.; Yu, L.; Ying, Z. Study on the way of urea removal by BAF. J. Chem. Soc. Pak. 2013, 35, 1081–1087. [Google Scholar]
  3. Glibert, P.M.; Harrison, J.; Heil, C.; Seitzinger, S. Escalating Worldwide use of Urea—A Global Change Contributing to Coastal Eutrophication. Biogeochemistry 2006, 77, 441–463. [Google Scholar] [CrossRef]
  4. Qin, Y.; Cabral, J.M. Review Properties and Applications of Urease. Biocatal. Biotransform. 2002, 20, 1–14. [Google Scholar] [CrossRef]
  5. Hasanoğlu, A.; Romero, J.; Pérez, B.; Plaza, A. Ammonia removal from wastewater streams through membrane contactors: Experimental and theoretical analysis of operation parameters and configuration. Chem. Eng. J. 2010, 160, 530–537. [Google Scholar] [CrossRef]
  6. Vecino, X.; Reig, M.; Bhushan, B.; Gibert, O.; Valderrama, C.; Cortina, J.L. Liquid fertilizer production by ammonia recovery from treated ammonia-rich regenerated streams using liquid-liquid membrane contactors. Chem. Eng. J. 2019, 360, 890–899. [Google Scholar] [CrossRef]
  7. Kyriakou, V.; Garagounis, I.; Vourros, A.; Vasileiou, E.; Stoukides, M. An Electrochemical Haber-Bosch Process. Joule 2020, 4, 142–158. [Google Scholar] [CrossRef]
  8. Ghimire, U.; Jang, M.; Jung, S.P.; Park, D.; Park, S.J.; Yu, H.; Oh, S.-E. Electrochemical Removal of Ammonium Nitrogen and COD of Domestic Wastewater using Platinum Coated Titanium as an Anode Electrode. Energies 2019, 12, 883. [Google Scholar] [CrossRef] [Green Version]
  9. Simka, W.; Piotrowski, J.; Robak, A.; Nawrat, G. Electrochemical treatment of aqueous solutions containing urea. J. Appl. Electrochem. 2009, 39, 1137–1143. [Google Scholar] [CrossRef]
  10. Guo, J.; Lee, J.-G.; Tan, T.; Yeo, J.; Wong, P.W.; Ghaffour, N.; An, A.K. Enhanced ammonia recovery from wastewater by Nafion membrane with highly porous honeycomb nanostructure and its mechanism in membrane distillation. J. Membr. Sci. 2019, 590, 117265. [Google Scholar] [CrossRef]
  11. Zarebska, A.; Nieto, D.R.; Christensen, K.; Søtoft, L.F.; Norddahl, B. Ammonium Fertilizers Production from Manure: A Critical Review. Crit. Rev. Environ. Sci. Technol. 2014, 45, 1469–1521. [Google Scholar] [CrossRef]
  12. Grimrath, A.; Berends, P.; Rabe, S.; Berger, R.G.; Linke, D. Koji fermentation based on extracellular peptidases of Flammulinavelutipes. Eur. Food Res. Technol. 2011, 232, 415–424. [Google Scholar] [CrossRef]
  13. American Public Health Association. Standard Methods for the Examination of Water and Wastewater, 20th ed.; American Public Health Association—American Water Works Association and Water Environmental Federation: Washington, DC, USA, 1998. [Google Scholar]
  14. Qin, Y.; Cabral, J.M.S. Kinetic studies of the urease-catalyzed hydrolysis of urea in a buffer-free system. Appl. Biochem. Biotechnol. 1994, 49, 217–240. [Google Scholar] [CrossRef]
  15. Muñoz-Aguado, M.; Wiley, D.; Fane, A. Enzymatic and detergent cleaning of a polysulfone ultrafiltration membrane fouled with BSA and whey. J. Membr. Sci. 1996, 117, 175–187. [Google Scholar] [CrossRef]
  16. Shi, X.; Tal, G.; Hankins, N.P.; Gitis, V. Fouling and cleaning of ultrafiltration membranes: A review. J. Water Process. Eng. 2014, 1, 121–138. [Google Scholar] [CrossRef]
  17. Bremner, J.M.; Chai, H.S. Effect of phosphoroamides on ammonia volatilization in soil treated with urea. Biol. SMD Fertil. Soil. 1989, 8, 227–230. [Google Scholar]
  18. Tong, D.; Xu, R. Effects of urea and (NH4)2SO4 on nitrification and acidification of Ultisols from Southern China. J. Environ. Sci. 2012, 24, 682–689. [Google Scholar] [CrossRef]
  19. Thenabadu, M.W.; Dharmakeerthi, R.S. Review urease activity in soils: A review. Nutr. Plant Sri Lanka 1996, 24, 159–195. [Google Scholar]
  20. Tikhonenko, S.A.; Saburova, E.A.; Durdenko, E.N.; Sukhorukov, B.I. Enzyme-polyelectrolyte complex: Salt effects on the reaction of urease with polyallylamine. Russ. J. Phys. Chem. A 2009, 83, 1781–1788. [Google Scholar] [CrossRef]
  21. Engelhardt, S.; Vogel, J.; Duirk, S.E.; Moore, F.B.; Barton, H.A. Assessment of urea hydrolysis as a pretreatment strategy to improve total nitrogen rejection from urine using aquaporin-based membranes in forward osmosis. J. Water Process. Eng. 2020, 34, 101135. [Google Scholar] [CrossRef]
  22. Nicolau, E.; Fonseca, J.J.; Rodriguez-Martinez, J.A.; Richardson, T.-M.J.; Flynn, M.; Griebenow, K.; Cabrera, C.R. Evaluation of a Urea Bioelectrochemical System for Wastewater Treatment Processes. ACS Sustain. Chem. Eng. 2014, 2, 749–754. [Google Scholar] [CrossRef]
  23. Nelson, D.L.; Cox, M.M. Lehninger’s Principles of Biochemistry, 4th ed.; W.H. Freeman and Company: New York, NY, USA, 2004. [Google Scholar]
  24. Revilla, M.; Alexander, J.; Glibert, P.M. Oceanography: Methods Urea analysis in coastal waters: Comparison of enzymatic and direct methods. Limnol. Oceanogr. Methods 2005, 3, 290–299. [Google Scholar] [CrossRef]
  25. Bolivar, J.M.; Nidetzky, B. The Microenvironment in Immobilized Enzymes: Methods of Characterization and Its Role in Determining Enzyme Performance. Molecules 2019, 24, 3460. [Google Scholar] [CrossRef] [PubMed] [Green Version]
  26. Bosco, F.; Capolongo, A.; Ruggeri, B. Effect of Temperature, pH, Ionic Strength, and Sodium Nitrate on Activity of LiPs: Implications for Bioremediation. Bioremediat. J. 2002, 6, 65–76. [Google Scholar] [CrossRef]
Figure 1. Schematic diagram of the submerged membrane reactor attached to a bench top BIOSTAT system.
Processes 09 01703 g001
Figure 2. Rate of urea hydrolysis by urease activity.
Processes 09 01703 g002
Figure 3. Effect of feed concentration on urease activity in urea conversion.
Processes 09 01703 g003
Figure 4. Effect of ammonium-nitrogen addition on urease activity in urea conversion.
Processes 09 01703 g004
Figure 5. Effect of ionic strength on urease activity in urea conversion.
Processes 09 01703 g005
Figure 6. Scanning electron microscopy (SEM) images of the used UF membrane after being used inside the reactor.
Processes 09 01703 g006
Figure 7. Chemical composition of ultra-filtration membrane determined by the energy dispersive X-ray spectroscopy (EDAX) technique.
Processes 09 01703 g007
Table 1. Enzyme kinetic values for K m and V m a x at different pH values by using the linearized model.
pHKinetic Parameters ( K m ,   V m a x )Lineweaver–BurkLangmuir
No control pHmg/L223.65354.15
mg/L·min13.8315.48
determining coefficient, R20.94460.9973
pH 4mg/L334.73724.69
mg/L·min15.7720.2
determining coefficient, R20.96010.9824
pH 6mg/L353.35675.26
mg/L·min12.3715.8
Determining coefficient, R20.80660.9854
pH 7mg/L418.47525.23
mg/L·min15.116
Determining coefficient, R20.97240.9873
pH 8mg/L630.251042
mg/L·min15.4316.81
Determining coefficient, R20.90840.9078
Table 2. Elemental composition of the used membrane surface determined by the EDAX technique at different spots.
Spot 1ElementConc. (%mass)Net Int. ErrorSpot 2ElementConc. (%mass)Net Int. Error
C58.370.01 C18.570.01
O26.930.01 O42.160.01
F3.120.06 F8.480.01
Na30.04 Na2.780.02
Ca4.760.05 Mg1.480.03
Fe1.610.32 Al0.780.03
Ni2.210.21 Ca25.480.01
Total100- Fe0.130.57
Ni0.120.56
Total100-
Table 3. Elemental composition of the used membrane surface determined by the EDAX technique.
Spot 3ElementConc. (%mass)Net Int. ErrorSpot 4ElementConc. (%mass)Net Int. Error
C13.80.01 C10.960.01
O40.320.01 O46.670.01
F7.980.02 Al0.790.02
Na2.90.03 Ca41.580
Al1.180.02
Ca33.520.01
Fe0.180.58
Ni0.130.58
Total100 Total100
Table 4. Elemental composition of the clean membrane surface determined by the EDAX technique.
Spot 3ElementConc. (%mass)Net Int. Error
C40.320.01
O6.550.03
F48.170.01
Al1.060.03
Ca3.670.06
Fe0.18 0.59
Ni0.150.57
Total100
Publisher’s Note: MDPI stays neutral with regard to jurisdictional claims in published maps and institutional affiliations.

