Article

A New Clark-Type Layered Double Hydroxides-Enzyme Biosensor for H2O2 Determination in Highly Diluted Real Matrices: Milk and Cosmetics

by
Mauro Tomassetti
1,2,*,
Riccardo Pezzilli
3,*,
Giuseppe Prestopino
3,
Francesco Di Biagio
3,
Corrado Di Natale
1 and
Pier Gianni Medaglia
3
1
Department of Electronic Engineering, University of Rome “Tor Vergata”, Via del Politecnico 1, 00133 Rome, Italy
2
Department of Chemistry, University of Rome “La Sapienza”, P.le A. Moro 5, 00185 Rome, Italy
3
Department of Industrial Engineering, University of Rome “Tor Vergata”, Via del Politecnico 1, 00133 Rome, Italy
*
Authors to whom correspondence should be addressed.
Processes 2021, 9(11), 1878; https://doi.org/10.3390/pr9111878
Submission received: 4 August 2021 / Revised: 14 October 2021 / Accepted: 19 October 2021 / Published: 21 October 2021
(This article belongs to the Section Materials Processes)

Abstract

:
A new catalase amperometric biosensor for hydroperoxides detection has been built as part of research aimed at the development of biosensors based on layered double hydroxides (LDH) used as support for enzyme immobilization. The fabricated device differs from those developed so far, usually based on an LDH enzyme nanocomposite adsorbed on a glassy carbon (GC) electrode and cross-linked by glutaraldehyde, since it is based on an amperometric gas diffusion electrode (Clark type) instead of a GC electrode. The new biosensor, which still uses LDH synthesized by us and catalase enzyme, is robust and compact, shows a lower LOD (limit of detection) value and a linearity range shifted at lower concentrations than direct amperometric GC biosensor, but above all, it is not affected by turbidity or emulsions, or by the presence of possible soluble species, which are reduced to the cathode at the same redox potential. This made it possible to carry out accurate and efficient determination of H2O2 even in complex or cloudy real matrices, also containing very low concentrations of hydrogen peroxide, such as milk and cosmetic products, i.e., matrices that would have been impossible to analyze otherwise, using conventional biosensors based on a GC–LDH enzyme. An inaccuracy ≤ 7.7% for cosmetic samples and ≤8.0% for milk samples and a precision between 0.7 and 1.5 (as RSD%), according to cosmetic or milk samples analyzed, were achieved.

1. Introduction

Layered double hydroxides (LDHs), which can be considered synthetic derivatives of hydrotalcite, are a large family of lamellar solids with positively charged brucite-like host layers and exchangeable anions in the interlayer space, as illustrated in Figure 1. The literature on LDHs is now substantial [1,2] due to their unique versatility in chemical composition and physical properties, using many different pairs of metal ions (MII, MIII) and a large variety of interlayer anions, including both organic and inorganic species (chlorides, fluorides, carbonates, nitrates, etc.) [3] and to the wide possible selection of synthesis routes permitting tunable morphology and architectural structure. LDHs and related composites are very promising in many different application fields, such as industry, metallurgy (anticorrosion), biomedical and pharmaceutical applications (drug delivery), energy harvesting, environment (pollution absorbing) [4,5,6,7,8,9], and analytical devices (sensors and biosensors) [10,11,12,13,14,15,16,17,18,19,20,21,22,23,24,25].
We were particularly interested in the possible applications in the field of biosensors given the previous experience of some of the present authors in this area [26,27,28]. Indeed, recently [29], we developed both an enzyme catalase biosensor and a simple catalytic sensor based on LDH for the determination of hydrogen peroxide. In particular, for the fabrication of the biosensor, we relied on some amperometric biosensors reported in the literature [10,11,12,13,14,15,16,17,18,19,20,21,22,23,24,25], developed using various types of LDHs and enzymes, and typically based on modified glassy carbon electrodes with the LDH-enzyme matrix cross-linked by glutaraldehyde vapors [10,12,15,17]. We followed this pattern and developed a biosensor, which provided good response and long lifetime [29]. However, similarly to all other modified GC enzyme sensors of this type [10,11,12,13,14,15,16,17,18,19,20,21,22,23,24,25], the major drawback of these biosensors, which greatly limits their application, is the high sensitivity to possible interferences that may occur in the analysis of real samples, which show turbidity or emulsions (this is the case, for instance, of alimentary products containing proteins or fats), or when other contained species can interact with the working electrode, for instance if oxidizing species, which can also be reduced, are present. The possibility of such interferences has been demonstrated in our previous work [29], but it is also evidenced in many reports by other authors [10,11,12,13,14,15,16,17,18,19,20,21,22,24,25] (see Supplementary Table S1), so much so that, in certain studies, the strong interference with some ions has been effectively leveraged to fabricate inhibition biosensors [11,12,13]. To overcome this inconvenience, in the present study, we have built a different type of catalase biosensor, which still makes use of adsorbed catalase enzyme on LDH, but that no longer uses a GC electrode, being based instead on an amperometric Clark-type electrode, i.e., an amperometric sensor with a gas permeable membrane overlapping a platinum working electrode, with an assembly geometry completely different from the GC type sensor. This new biosensor configuration permitted to avoid all interferences, caused both by turbidity or emulsion, and especially to interact whit redox water-soluble species, which can be reduced directly to the cathode regardless of the presence and action of the used enzyme. Particularly, in the case of the present research, it also allowed the H2O2 determination in certain real matrices, such as milk and common cosmetic preparations. These matrices are very difficult to analyze in a simple, fast and inexpensive way, because they usually contain very low concentrations of hydrogen peroxide and are also cloudy, so that they are impossible to be analyzed with a simple GC–LDH biosensor, as listed in Supplementary Table S1.

2. Materials and Methods

2.1. LDH Preparation

In recent decades, many different LDH synthesis routes have been reported. For instance, several LDHs were prepared simply by coprecipitation method [30], by using the sol-gel technique [31], by replacement of LDH interlayer anions through anion exchange, or by using calcination–reconstruction methods [1,32]. Recently, a novel cheap and mild synthesis, which does not involve the use of organic solvents or surfactants, has been proposed, named the hydrothermal method [33,34], yielding LDH films grown directly on a metal substrate (e.g., a thin aluminum foil). In this case, the metal foil acts both as source of metal ions during synthesis and as the substrate supporting the interconnected LDHs. In the present work, this procedure was employed to fabricate the [ZnIIAlIII (OH)2]+ NO3 LDHs (referred to as (Zn–Al–NO3) LDH in the following sections) that have been used to build our simple biosensor [29,35,36]. The hydrothermal growth was carried out using aluminum-coated wafer (50 µm thickness) immersed in a nutrient solution of 5 mM equimolar concentration of zinc nitrate hexahydrate (Zn (NO3)2∙6H2O) and hexamethylenetetramine (C6H11N4), both from Sigma-Aldrich (Steinheim, Germany). Hexamethylenetetramine was used as a pH regulator; when temperature was increased, ammonia was released through amine hydrolyzation, and the pH of the solution was maintained at ≥7.0. During LDH growth, the sample was kept in a Teflon vessel and maintained at 80 °C in a thermostated oven until 24 h. Then, the sample was cooled at room temperature and washed with ethanol and deionized water to remove the residuals on top of LDH surface. Finally, the (Zn–Al–NO3) LDH film was cautiously scraped by a scalpel and a white LDH highly porous powder was obtained [35].

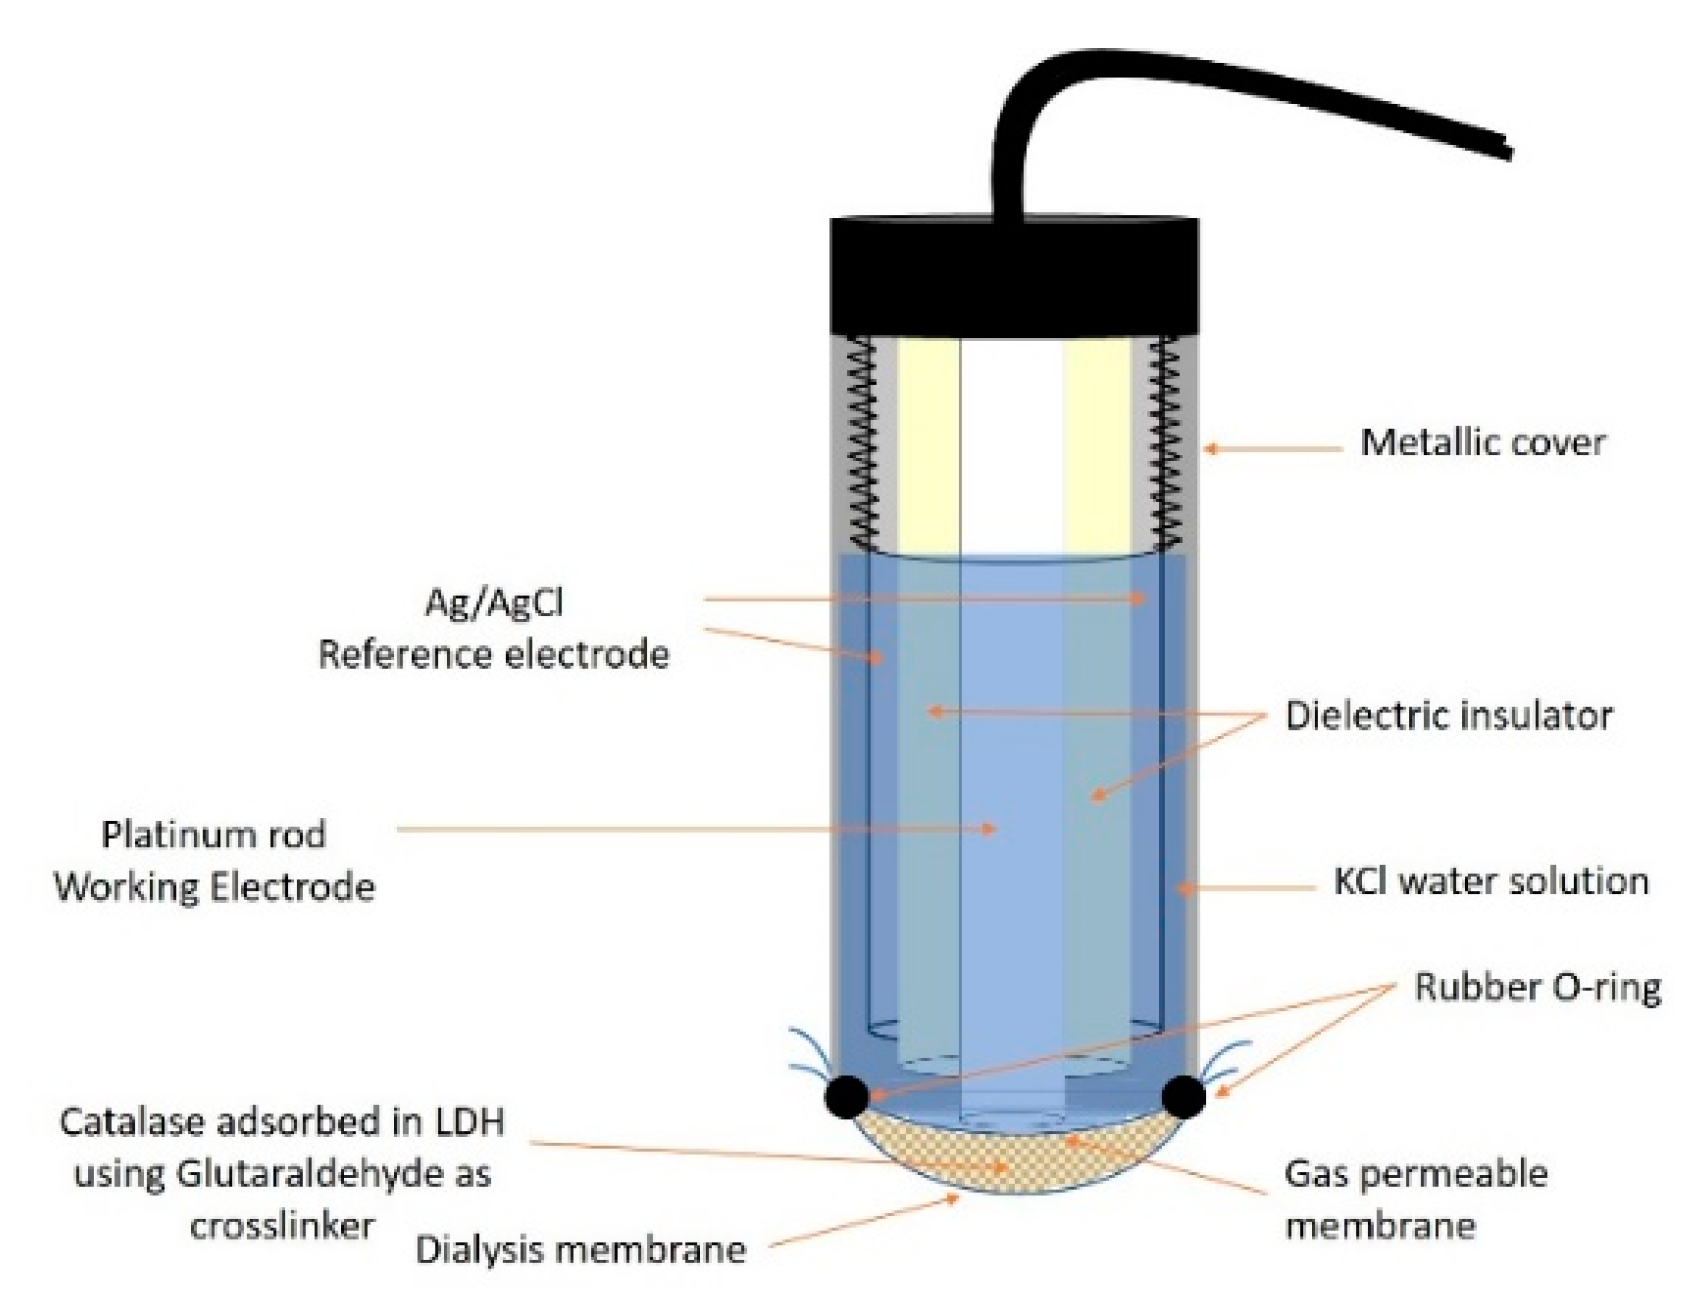
2.2. Enzyme Biosensor Preparation and Measurements

To prepare the biosensor, 15 mg of the synthesized (Zn–Al–NO3) LDH was placed in the center of a damp dialysis membrane (D9777, Sigma-Aldrich, UK). Subsequently, 20 mg of catalase from bovine liver (EC 1.11.1.6) by Sigma-Aldrich (Steinheim, Germany) was added to the LDH powder and then gently homogenized after adding two drops (about 10 μL) of pH 7 and 0.1 M phosphate buffer (Fisher Chemical). Lastly, the dialysis membrane containing the mixture of LDH and catalase enzyme was placed in a cylindrical glass vessel equipped with an emery lid (5.5 cm in diameter, 2.8 cm high) near an open small glass crystallizer (1.5 cm in diameter) containing 30 mg of glutaraldehyde (25%). The glass vessel was sealed by its emery lid, permitting the glutaraldehyde vapors to saturate the inner atmosphere, thereby producing the cross-linking action over 15–20 min. Finally, the dialysis membrane was gently stretched at the end of a Clark electrode using a small rubber O-ring, so that the LDHs with the cross-linked enzyme remained rinsed between the dialysis and the gas permeable membranes (Figure 2).
The tip of the assembled electrode was then dipped in 20 mL of 0.1 M phosphate buffer in a glass cell, thermostated at 25 °C. After applying a constant cathode–anode voltage of −0.6 V, the biosensor response was allowed to stabilize under gentle stirring with a magnetic stirrer for about 20 min. After that, a calibration curve was built by adding 0.05 mL of 3% by weight of hydrogen peroxide standard solution each time and recording the current variation when the steady state was reached after each addition. The current in the external circuit was observed to increase immediately after each addition. The immobilized catalase enzyme catalyzed the following reaction:
2 H 2 O 2 c a t a l a s e O 2 + 2 H 2 O
The produced oxygen was immediately reduced at the cathode of the Clark electrode, causing the prompt build-up of the output current. Obviously, when determining the calibration curves, the volume changes after each addition of the hydrogen peroxide solution were considered, although such variations were very small. A “blank” calibration curve was also constructed by assembling the biosensor as described above, but without using the enzyme, to evaluate the extent of the possible catalytic action of LDH alone on the decomposition of hydrogen peroxide.
The possible interfering substances were also tested following the same experimental procedures used to assess the response to standard H2O2 solutions. Each interfering species was added up to a final concentration in solution equal to that of hydrogen peroxide (i.e., 140 mM); only in the case of potassium permanganate was the final concentration equal to 28 mM.
The calibration curves “in matrix” for the analysis of milk and cosmetic samples were also constructed with the same procedure used to obtain all other calibration curves. Both the sample of fresh cow’s milk and the two samples of cosmetics were commercial products, purchased at a local shop in the city of Rome (Italy).
Finally, all the calibration curves reported in this work were constructed every day and all represent the average of at least three determinations, carried out on the same day in which the biosensor was used for any purpose. It also allowed us to verify that each calibration line remained constant during the same day, at least within the limits of the confidence interval.

2.3. Apparatus and Survey

The amperometric measurements were performed in a glass cell thermostated at 25 °C under stirring (see Supplementary Figure S1), using a Keithley 6517B picoammeter/voltage supply (Keithley Instruments, Inc., Cleveland, OH, USA), to which a gas diffusion amperometric electrode (Clark-type) was connected. The cathode of the amperometric sensor was a cylindrical platinum bar (1.0 mm in diameter) biased at −0.6 V with respect to the anode. The latter was a small cylindrical tube (5.65 mm in diameter) made of Ag/AgCl, concentric to the cathode and separated from it by a plastic insulator. Anode and cathode were enclosed in a stainless-steel case (12 mm in diameter), closed at one end by a gas permeable membrane (BO5279B from YSI incorporated, Yellow Spring Instrument Ohio USA), which was stretched and fastened with a rubber O-ring. The inner tube was filled by KCl 0.05 M solution. The cathodic reaction when oxygen was reduced to the cathode was:
O 2 + 2 H 2 O + 4 e 4 O H
While the following reaction occurred to the anode:
4 A g + 4 C l 4 A g C l + 4 e
The infrared measurements were carried out from 455 and 4000 cm−1 with a Perkin-Elmer FTIR 100 spectrophotometer (Milan, Italy) using powdered samples in KBr pellets.
The X-ray diffraction (XRD) spectra were obtained by RIGAKU 167 Geigerflex ϑ–2ϑ Bragg–Brentano diffractometer equipped with a Cu target (λCu Kα = 1.5418 Å), refurbished with a goniometer control system by DFP Technologies and equipped with a Cybe-star scintillation detector.
Finally, the scanning electron microscope (SEM) images were taken with a field emission scanning electron microscope (FE-SEM) (model LEO SUPRA 1250, Oberkochen, Germany).

3. Results

3.1. Characterization of the LDH-Enzyme Compound

The characterization of the LDH enzyme compound was performed using infrared spectroscopy (FTIR), x-ray diffraction (XRD), and scanning electron microscopy (SEM), whose results are summarized in Figure 3a,b, and Supplementary Figure S2, respectively.
All three techniques clearly reveal that LDH and catalase interacted with each other. In particular, this is demonstrated observing the most significant infrared spectral features of LDH and catalase enzyme reported in Figure 3a (see also Ref. [37]). In the FTIR spectrum of LDH (spectrum 2), a broad band in the 3000–3800 cm−1 range, centered at approximately 3450 cm−1 (attributed to hydrogen bonds formed between the hydroxides and the hydration water molecules [38]), a small absorption peak at 1617 cm−1 (bending vibration of the interlayer water molecules [39]), and an extremely intense one at 1384 cm−1 can be observed (vibration of free interlayer nitrate anions [40]). The spectrum of catalase (spectrum 5) shows a broad band around 3380 cm−1 (-OH and -NH stretching vibration [41,42]), a very wide and intense absorbance peak between 1700 and 1550 cm−1 (corresponding to coupled stretching and/or bending amide vibrational modes [41,43]), and one modest peak at 1390 cm−1; two weak absorbance features appear in the 1300–1150 cm−1 region (ascribable to N–H in-plane bending modes coupled with C–N stretching mode [41,43]). Between about 800 and 525 cm−1, spectrum 2 presents a broad downward trend (arises from to the lattice vibration modes relevant to the Zn–OH translation lattice modes [39]), while spectrum 5 has a very jagged transmittance peak. All these spectral features, which clearly differentiate the FTIR spectra of LDH and catalase, can be found overlapping in the FTIR spectrum of the LDH and catalase mixture (spectrum 3), thereby revealing the interaction of LDH and enzyme. Upon catalase immobilization, changes in the vibration peaks occurred. The broad peak due to amino and hydroxyl groups was enlarged and appeared with a redshift at about 3350 cm−1 [42]. In addition, the peak at 1617 cm−1 overlaps to the amide related broad band at 1641 cm−1 of catalase. It is worth identifying that the presence of glutaraldehyde, especially at the low concentration used, does not make any significant contribution (spectrum 6). The interaction between LDH and enzyme is also confirmed by the splitting of the XRD peaks (see Figure 3b, curve 2) relevant to the (003) and (006) basal reflections of the lamellar LDH structure [32,44]. The surface morphology of the pristine LDH and of the modified compound with catalase enzyme immobilized onto the LDH matrix are shown in the SEM images reported in Supplementary Figure S2a and Supplementary Figure S2b, respectively. As can be seen, the pristine (Zn–Al–NO3) LDH has a plate-like morphology with a microscopically smooth surface, while the LDH with immobilized enzyme exhibits a globular-like microstructure. Interestingly, a similar effect has been also reported in other type of bio nano-hybrid materials (see Ref. [45]).

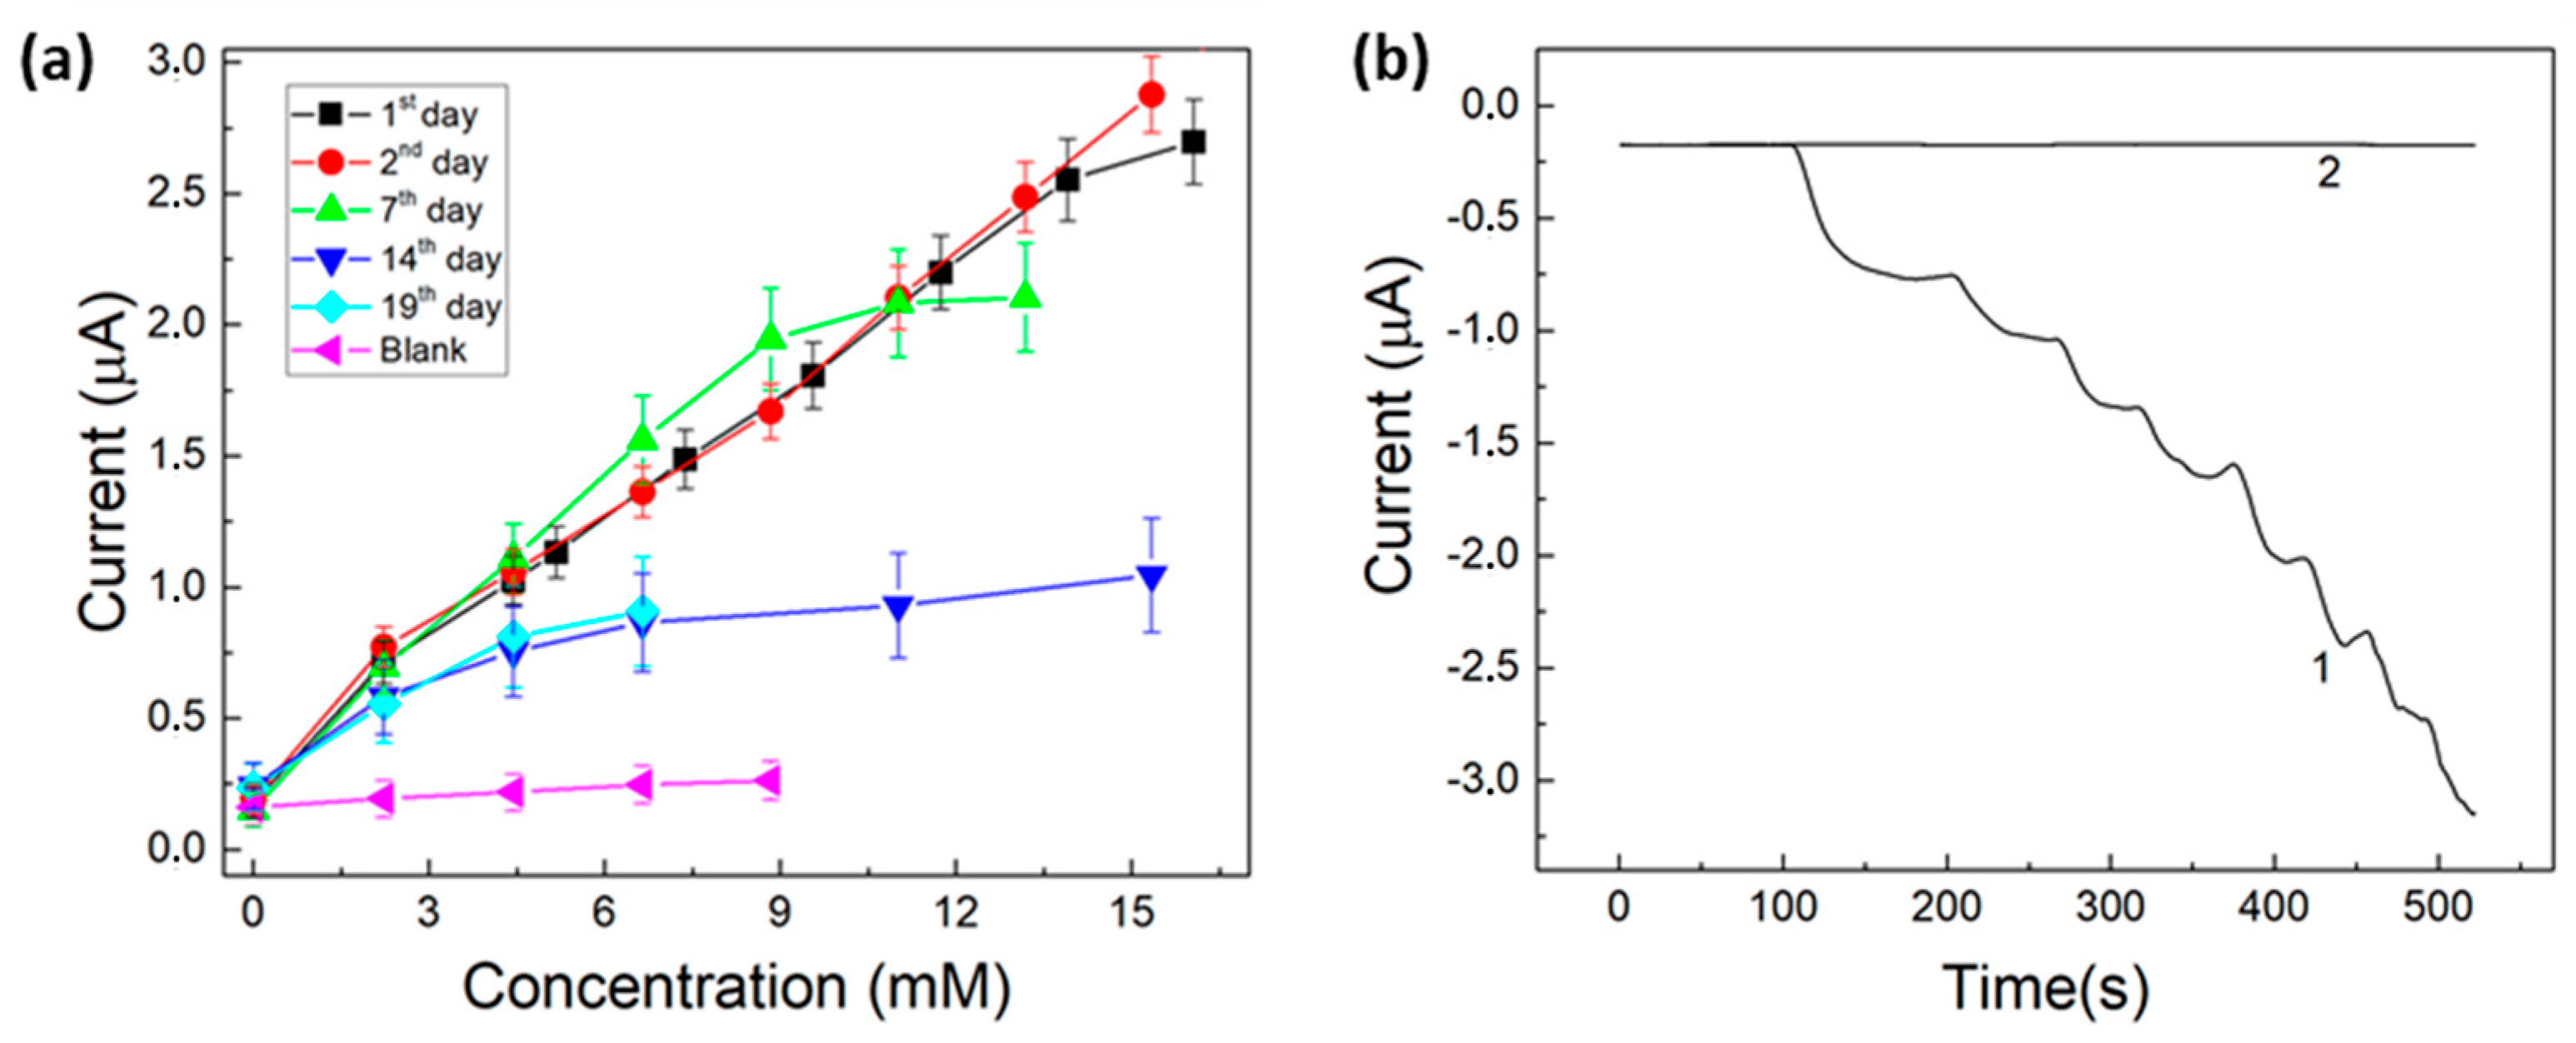
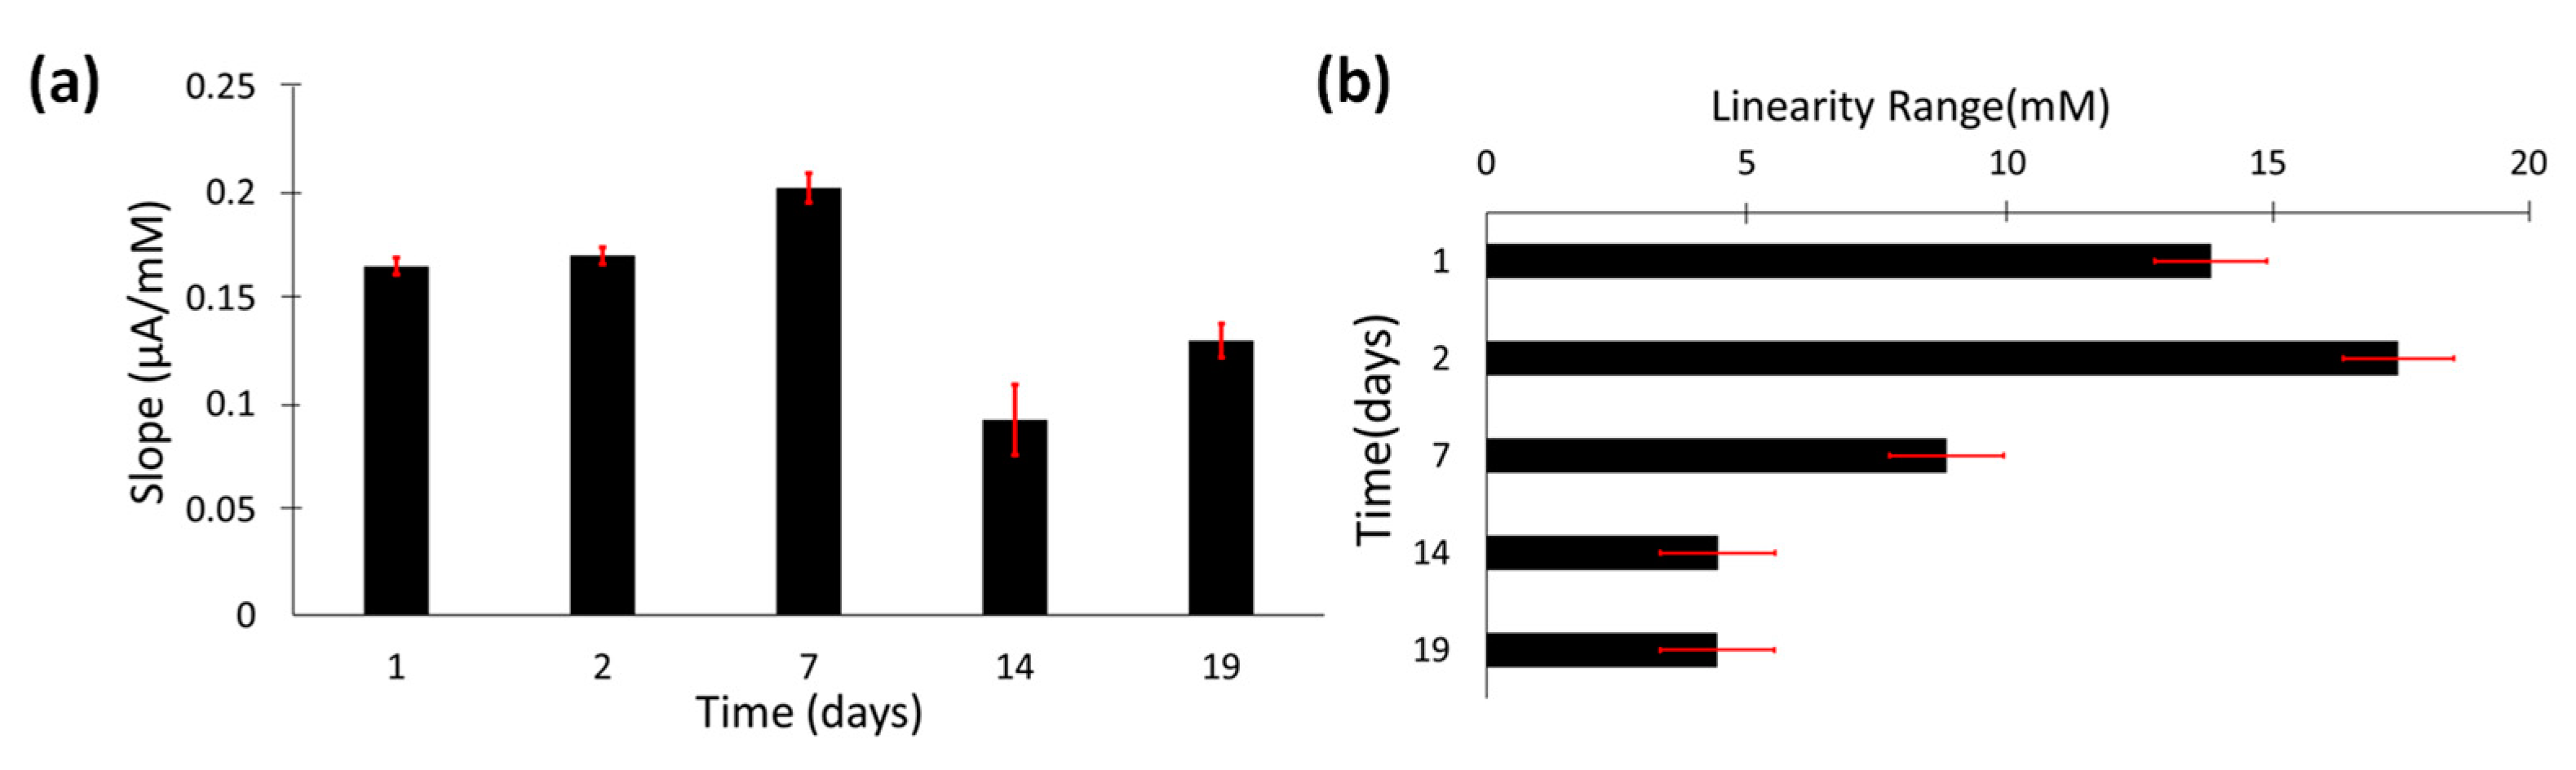
3.2. Characterization of the Biosensor

The analytical characterization of the performance of the catalase biosensor, under addition of hydrogen peroxide substrate, was carried out by building calibration curves daily for a period of about 20 days from the assembly of the biosensor. However, regarding the lifetime, even if we decided to stop the systematic recording of the response after this period, out of curiosity, we also recorded one last time the response of the Clark-type biosensor, which we stored in the refrigerator at +5 °C, after more than two and a half months from its construction, verifying that it still responded similarly to on the nineteenth day. Nevertheless, in the work, we wrote and guaranteed a lifetime of only 19–20 days; this is the period of time during which its response was followed systematically, not occasionally. Some of the most significant calibration curves constructed in this time frame, obtained as described in Section 2.2, are reported in Figure 4a. Figure 4b shows the raw experimental data collected as a function of time, under subsequent additions of hydrogen peroxide solution and used to build a 2nd day typical calibration curve. The “blank” curve obtained, as already mentioned, with the sensor having the same design but without the catalase enzyme, is also reported. The linearity ranges with confidence intervals of the calibration curves reported in Figure 4a are shown in Supplementary Figure S3, while the values of slopes and linearity intervals are summarized as bar diagrams in Figure 5a,b, respectively.
As can be seen in Figure 5, the calibration curve with the widest linearity range and with a good slope value is that obtained on the second day by the assembly of the biosensor, whereas that with the highest slope value is the one built on the seventh day from preparation. In addition, the slope value of the calibration curves slightly increases from the first to the seventh day, and the linearity range tends to decrease from the second day onwards. However, it is worth identifying that, when considering the associated experimental error, the values of the slope of calibration curves until the seventh day are not very different from each other and are of almost equivalent magnitude. Finally, concerning the response time of the biosensor, it varies little, between 60 and 65 s, during the first seven to eight days from preparation, while it increases significantly from the fifteenth day onwards. The main analytical data for the best calibration curve of the LDH-catalase enzyme biosensor in its lifetime (2nd day) are listed in Table 1.

3.3. Interference Overcoming

As mentioned in the abstract, the main purpose of this work, compared to previous studies reported in the literature [10,11,12,13,14,15,16,17,18,19,20,21,22,24,25], was to fabricate a more manageable and robust catalase biosensor that was not affected by the limitations caused by turbidity, due, for example, to the presence of poorly soluble proteins, by emulsions caused by fats, or by possible interfering redox substances, especially soluble ions capable of self-reducing, in whole or in part, at the same potential of oxygen reduction. For this reason, tests have been carried out with redox species which had been shown to interfere with the previously developed GC–LDH-catalase biosensor [29]. The results of these interference tests are summarized in Table 2 and compared to those previously obtained with the GC–LDH-catalase biosensor [29]. Interestingly, all the tested substances that produced interference in the previous device design [29] no longer produced any interference on the response of the biosensor studied in this work.

3.4. Measurement in Real Matrices

Based on these promising results, subsequent analyses were carried out on real cloudy and milky-type samples, also known to contain very small concentrations of H2O2, although the exact concentration of the latter was not indicated on their commercial packaging. This is the case of some cosmetic products and of a very popular food such as cow’s milk, which, according to the literature [46,47], may contain very modest concentrations (up to 2 mg L−1) of H2O2. As regards the former, the determination of H2O2 concentration was performed in two cosmetic products identified by the abbreviations LB1 and LB2 in the following. At first, two “in matrix” calibration lines were constructed in two aqueous buffer solutions containing one or the other of the two investigated cosmetic matrices. Then, the resulting straight lines were used to determine the concentration in H2O2 of the two cosmetic products by linear interpolation. The graphical method of these two determinations, shown in Figure 6a,b, respectively, gave a concentration (averaged over three repeated determinations) of 0.78 ± 0.05 g L−1 for sample LB1 and 1.30 ± 0.05 g L−1 for sample LB2.
Since it is not easy to compare these results with those obtainable with a different, but equally rapid and inexpensive, analytical method (e.g., spectrophotometric, or common electrochemical), given the strong turbidity and coloring (cosmetics) of the samples, and not wanting to resort to much more laborious methods that also require very long measurement times and expensive procedures, such as some instrumental methods, it was therefore decided to make a rough estimate of the accuracy of our measurements in real samples that are difficult to analyze, using the standard addition method. The recovery values obtained by this method are shown in Table 3. In all cases, they are between about 100.8 and 107.7%.
Under no circumstances did the Δ% of the experimental recovery exceed 10% compared to the nominal value. Therefore, it can be reasonably argued that these results provide an indication of the sufficient accuracy of the method. As far as the milk sample is concerned, the concentration of hydrogen peroxide that may be contained is, according to the literature [47], extremely low. In this case, Gran’s plot method [48,49] was applied “in matrix”, that is, by making known additions of H2O2 to a phosphate buffer solution containing 10% by volume of commercial cow’s milk. Lastly, the extrapolation of the obtained values made it possible to determine the traces of H2O2 already contained in the milk sample. The measurement procedure is shown graphically in Figure 7.
This type of analysis provided for our milk sample a concentration of H2O2 of 2.2 ± 0.9 mg L−1, averaged over three repeated determinations. Furthermore, also in this case, the standard addition method was applied to estimate the accuracy of our measurements (see Table 4), and once again, a sufficient level of trust can be given to the accuracy of the performed measurements, since the calculated percentage recoveries were always between about 92.0 and 107.8%.

4. Discussion

The catalase biosensor proposed here for the determination of hydroperoxides, such as hydrogen peroxide, using LDH as a support for the enzyme immobilization, is not the first electrochemical biosensor which uses this special support to this purpose. In fact, as already mentioned, several biosensors based on LDHs and different enzymes have been previously reported [10,11,12,13,14,15,16,17,18,19,20,21,22,23,24,25]. However, in almost all cases, three electrode systems were used, with the electrodes immersed in three different cells connected by agar bridges or porous septa. This clearly makes these biosensors poor suitable for applications in real matrices. On the contrary, the biosensor proposed in the present work is a very robust and compact device operating in a single thermostated cell; therefore, it is much more practical and convenient for measurements on real and very diluted samples. In addition, this is because, although the new biosensor shows lower calibration sensitivity and a longer response time than a previous developed GC-type biosensor [29] (essentially due to the fact that the oxygen developed by the enzymatic reaction must cross a gas-permeable membranes before reducing to the platinum cathode, while in the case of the direct amperometric GC biosensor, oxygen can immediately reduce to the cathode), its linearity range has shifted by at least a decade at lower concentrations than that of the direct amperometric GC biosensor. This, of course, is very important when samples with extremely low H2O2 concentrations are to be analyzed. Furthermore, it is the only biosensor, among those who use LDH to immobilize the enzyme, proposed in the literature, to be based on a Clark-type electrode used as an electrochemical detector, thus having the advantage of being equipped with a special gas-permeable membrane. This allows the biosensor to not suffer from any turbidity of the real aqueous sample or from any suspended particles, but above all, from electrolytes or oxidizing molecules that, in the case present in solution, could interfere with the redox measurement, if this is carried out using, for example, a modified GC electrode. We have demonstrated that such interference is eliminated when a Clark-type LDH biosensor is employed, since the interfering redox species cannot cross the gas-permeable membrane of the Clark electrode and does not reduce at the cathode. Furthermore, the same membrane constitutes a barrier that cannot be crossed for every particle or molecule (both organic and inorganic), which is not a gaseous species. On the other hand, we want to observe that the essential aim of this research was accomplish a biosensor free of any interference and to analyze real matrices that are impossible to analyze with a simple GC-LDH biosensor, listed in Supplementary Table S1. In addition, the device geometry and the materials from which the catalase electrode reported in this work is made make it a biosensor not only suitable for determining hydrogen peroxide, but also any other hydroperoxides, even organic hydroperoxides soluble in hydrophobic solutions [50]. However, until now, it has not been possible to carry out experiments in this direction due to the difficulty of finding organic hydroperoxides on the market, mainly due to their danger and the numerous precautions needed to their transport and storage; this type of experiment has therefore been postponed to future research.

5. Conclusions

The proper operation of the fabricated catalase biosensor also proves that the LDH used is an excellent support for enzymatic immobilization, as already reported in the literature [10,15]. In addition, the coupling of the enzymatic immobilization in LDH with the Clark-type electrode makes it possible to analyze without any interference.
Finally, the type of LDH we synthesized and used, i.e., (Zn–Al–NO3) LDH, in addition to being effective for the purpose of building biosensors, is also extremely practical, since it is very simple to synthesize, using the method of growing the LDH film directly on the aluminum metal substrate with the hydrothermal growth method.

Supplementary Materials

The following are available online at https://www.mdpi.com/article/10.3390/pr9111878/s1, Figure S1: Clark-LDH-catalase enzyme-biosensor: measurement apparatus. Figure S2: SEM images showing the top surface morphology of (a) LDH as grown, wet with phosphate buffer and dried, (b) LDH + catalase enzyme, wet with phosphate buffer and dried. Scale bar 2 µm. Figure S3: Clark-type LDH-catalase enzyme biosensor. Linearity ranges and confidence intervals as a function of lifetime: (a) 1st day, (b) 2nd day, (c) 7th day, (d) 14th day, (e) 19th day, and (f) blank. Table S1: Most relevant LDH based biosensors reported in the literature.

Author Contributions

M.T.: Conceptualization, Methodology, Writing—original draft. R.P.: Data curation, Investigation, Writing—review and editing. G.P.: Investigation, Writing—review and editing. F.D.B.: Data curation. C.D.N.: Supervision. P.G.M.: Resources, Supervision. All authors have read and agreed to the published version of the manuscript.

Funding

This research received no external funding.

Institutional Review Board Statement

Not applicable.

Informed Consent Statement

Not applicable.

Data Availability Statement

Research data can be obtained from the author.

Acknowledgments

This work was supported by University of Rome “Tor Vergata”. The authors wish to thank Gabriele Magna for the assistance in performing FTIR analysis.

Conflicts of Interest

The authors declare no conflict of interest.

References

  1. Forano, C.; Costantino, U.; Prévot, V.; Gueho, C.T. Layered Double Hydroxides (LDH). In Developments in Clay Science; Elsevier: Amsterdam, The Netherlands, 2013; Volume 5, pp. 745–782. ISBN 978-0-08-099364-5. [Google Scholar]
  2. Laipan, M.; Yu, J.; Zhu, R.; Zhu, J.; Smith, A.T.; He, H.; O’Hare, D.; Sun, L. Functionalized Layered Double Hydroxides for Innovative Applications. Mater. Horiz. 2019, 7, 715–745. [Google Scholar] [CrossRef]
  3. de Roy, A.; Forano, C.; Malki, K.E.; Besse, J.-P. Anionic Clays: Trends in Pillaring Chemistry; Springer: Boston, MA, USA, 1992. [Google Scholar]
  4. Zhang, F.; Zhang, C.; Song, L.; Zeng, R.; Liu, Z.; Cui, H. Corrosion of In-Situ Grown MgAl-LDH Coating on Aluminum Alloy. Trans. Nonferrous Met. Soc. China 2015, 25, 3498–3504. [Google Scholar] [CrossRef]
  5. Bi, X.; Zhang, H.; Dou, L. Layered Double Hydroxide-Based Nanocarriers for Drug Delivery. Pharmaceutics 2014, 6, 298–332. [Google Scholar] [CrossRef] [PubMed]
  6. Kuthati, Y.; Kankala, R.K.; Lee, C.-H. Layered Double Hydroxide Nanoparticles for Biomedical Applications: Current Status and Recent Prospects. Appl. Clay Sci. 2015, 112–113, 100–116. [Google Scholar] [CrossRef]
  7. Han, J.; Meng, X.; Lu, L.; Wang, Z.L.; Sun, C. Triboelectric Nanogenerators Powered Electrodepositing Tri-Functional Electrocatalysts for Water Splitting and Rechargeable Zinc-Air Battery: A Case of Pt Nanoclusters on NiFe-LDH Nanosheets. Nano Energy 2020, 72, 104669. [Google Scholar] [CrossRef]
  8. Ma, L.; Wang, Q.; Islam, S.M.; Liu, Y.; Ma, S.; Kanatzidis, M.G. Highly Selective and Efficient Removal of Heavy Metals by Layered Double Hydroxide Intercalated with the MoS42− Ion. J. Am. Chem. Soc. 2016, 138, 2858–2866. [Google Scholar] [CrossRef] [PubMed]
  9. Lv, L.; He, J.; Wei, M.; Evans, D.G.; Duan, X. Uptake of Chloride Ion from Aqueous Solution by Calcined Layered Double Hydroxides: Equilibrium and Kinetic Studies. Water Res. 2006, 40, 735–743. [Google Scholar] [CrossRef]
  10. Shan, D.; Cosnier, S.; Mousty, C. Layered Double Hydroxides: An Attractive Material for Electrochemical Biosensor Design. Anal. Chem. 2003, 75, 3872–3879. [Google Scholar] [CrossRef]
  11. Shan, D.; Mousty, C.; Cosnier, S. Subnanomolar Cyanide Detection at Polyphenol Oxidase/Clay Biosensors. Anal. Chem. 2003, 76, 178–183. [Google Scholar] [CrossRef]
  12. Mousty, C.; Vieille, L.; Cosnier, S. Laccase Immobilization in Redox Active Layered Double Hydroxides: A Reagentless Amperometric Biosensor. Biosens. Bioelectron. 2007, 22, 1733–1738. [Google Scholar] [CrossRef]
  13. Shan, D.; Cosnier, S.; Mousty, C. HRP/[Zn–Cr–ABTS] Redox Clay-Based Biosensor: Design and Optimization for Cyanide Detection. Biosens. Bioelectron. 2004, 20, 390–396. [Google Scholar] [CrossRef]
  14. Chen, H.; Mousty, C.; Cosnier, S.; Silveira, C.; Moura, J.J.G.; Almeida, M.G. Highly Sensitive Nitrite Biosensor Based on the Electrical Wiring of Nitrite Reductase by [ZnCr-AQS] LDH. Electrochem. Commun. 2007, 9, 2240–2245. [Google Scholar] [CrossRef]
  15. Chen, H.; Mousty, C.; Chen, L.; Cosnier, S. A New Approach for Nitrite Determination Based on a HRP/Catalase Biosensor. Mater. Sci. Eng. C 2008, 28, 726–730. [Google Scholar] [CrossRef]
  16. Shan, D.; Wang, Y.; Zhu, M.; Xue, H.; Cosnier, S.; Wang, C. Development of a High Analytical Performance-Xanthine Biosensor Based on Layered Double Hydroxides Modified-Electrode and Investigation of the Inhibitory Effect by Allopurinol. Biosens. Bioelectron. 2009, 24, 1171–1176. [Google Scholar] [CrossRef]
  17. Ding, S.-N.; Shan, D.; Xue, H.-G.; Zhu, D.-B.; Cosnier, S. Glucose Oxidase Immobilized in Alginate/Layered Double Hydroxides Hybrid Membrane and Its Biosensing Application. Anal. Sci. 2009, 25, 1421–1425. [Google Scholar] [CrossRef] [PubMed] [Green Version]
  18. Shan, D.; Yao, W.; Xue, H. Amperometric Detection of Glucose with Glucose Oxidase Immobilized in Layered Double Hydroxides. Electroanalysis 2006, 18, 1485–1491. [Google Scholar] [CrossRef]
  19. Fernández, L.; Ledezma, I.; Borrás, C.; Martínez, L.A.; Carrero, H. Horseradish Peroxidase Modified Electrode Based on a Film of Co–Al Layered Double Hydroxide Modified with Sodium Dodecylbenzenesulfonate for Determination of 2-Chlorophenol. Sens. Actuators B Chem. 2013, 182, 625–632. [Google Scholar] [CrossRef]
  20. Zhai, C.; Guo, Y.; Sun, X.; Zheng, Y.; Wang, X. An Acetylcholinesterase Biosensor Based on Graphene–Gold Nanocomposite and Calcined Layered Double Hydroxide. Enzym. Microb. Technol. 2014, 58–59, 8–13. [Google Scholar] [CrossRef] [PubMed]
  21. Wang, Y.; Wang, Z.; Rui, Y.; Li, M. Horseradish Peroxidase Immobilization on Carbon Nanodots/CoFe Layered Double Hydroxides: Direct Electrochemistry and Hydrogen Peroxide Sensing. Biosens. Bioelectron. 2015, 64, 57–62. [Google Scholar] [CrossRef] [PubMed]
  22. Yuan, J.; Xu, S.; Zeng, H.-Y.; Cao, X.; Dan Pan, A.; Xiao, G.-F.; Ding, P.-X. Hydrogen Peroxide Biosensor Based on Chitosan/2D Layered Double Hydroxide Composite for the Determination of H2O2. Bioelectrochemistry 2018, 123, 94–102. [Google Scholar] [CrossRef]
  23. Vajedi, F.S.; Dehghani, H. A High-Sensitive Electrochemical DNA Biosensor Based on a Novel ZnAl/Layered Double Hydroxide Modified Cobalt Ferrite-Graphene Oxide Nanocomposite Electrophoretically Deposited onto FTO Substrate for Electroanalytical Studies of Etoposide. Talanta 2020, 208, 120444. [Google Scholar] [CrossRef]
  24. Li, J. A Novel Electrochemical Biosensor Based on Layered Hydroxide Nanosheets/DNA Composite for the Determination of Phenformin Hydrochloride. Int. J. Electrochem. Sci. 2021, 210237. [Google Scholar] [CrossRef]
  25. Farhat, H.; Célier, J.; Forano, C.; Mousty, C. Evaluation of Hierarchical Glucose Oxidase/Co3Mn-CO3 LDH Modified Electrodes for Glucose Detection. Electrochim. Acta 2021, 376, 138050. [Google Scholar] [CrossRef]
  26. Campanella, L.; Lelo, D.; Martini, E.; Tomassetti, M. Organophosphorus and Carbamate Pesticide Analysis Using an Inhibition Tyrosinase Organic Phase Enzyme Sensor; Comparison by Butyrylcholinesterase+choline Oxidase Opee and Application to Natural Waters. Anal. Chim. Acta 2007, 587, 22–32. [Google Scholar] [CrossRef]
  27. Tomassetti, M.; Martini, E.; Campanella, L.; Favero, G.; Carlucci, L.; Mazzei, F. Comparison of Three Immunosensor Methods (Surface Plasmon Resonance, Screen-Printed and Classical Amperometric Immunosensors) for Immunoglobulin G Determination in Human Serum and Animal or Powdered Milks. J. Pharm. Biomed. Anal. 2013, 73, 90–98. [Google Scholar] [CrossRef]
  28. Tomassetti, M.; Angeloni, R.; Martini, E.; Castrucci, M.; Campanella, L. Enzymatic DMFC Device Used for Direct Analysis of Chloramphenicol and a Comparison with the Competitive Immunosensor Method. Sens. Actuators B Chem. 2018, 255, 1545–1552. [Google Scholar] [CrossRef]
  29. Tomassetti, M.; Pezzilli, R.; Prestopino, G.; Natale, C.D.; Medaglia, P.G. Fabrication and Characterization of a Layered Double Hydroxide Based Catalase Biosensor and a Catalytic Sensor for Hydrogen Peroxide Determination. Microchem. J. 2021, 170, 106700. [Google Scholar] [CrossRef]
  30. Boclair, J.W.; Braterman, P.S. Layered Double Hydroxide Stability. 1. Relative Stabilities of Layered Double Hydroxides and Their Simple Counterparts. Chem. Mater. 1999, 11, 298–302. [Google Scholar] [CrossRef] [PubMed]
  31. Lopez, T.; Bosch, P.; Ramos, E.; Gomez, R.; Novaro, O.; Acosta, D.; Figueras, F. Synthesis and Characterization of Sol−Gel Hydrotalcites. Structure and Texture . Langmuir 1996, 12, 189–192. [Google Scholar] [CrossRef]
  32. Laipan, M.; Xiang, L.; Yu, J.; Martin, B.R.; Zhu, R.; Zhu, J.; He, H.; Clearfield, A.; Sun, L. Layered Intercalation Compounds: Mechanisms, New Methodologies, and Advanced Applications. Prog. Mater. Sci. 2020, 109, 100631. [Google Scholar] [CrossRef]
  33. Xu, Z.P.; Stevenson, G.; Lu, C.-Q.; Lu, G.Q. (Max). Dispersion and Size Control of Layered Double Hydroxide Nanoparticles in Aqueous Solutions. J. Phys. Chem. B 2006, 110, 16923–16929. [Google Scholar] [CrossRef]
  34. Guo, X.; Zhang, F.; Evans, D.G.; Duan, X. Layered Double Hydroxide Films: Synthesis, Properties and Applications. Chem. Commun. 2010, 46, 5197. [Google Scholar] [CrossRef] [PubMed]
  35. Scarpellini, D.; Leonardi, C.; Mattoccia, A.; Di Giamberardino, L.; Medaglia, P.G.; Mantini, G.; Gatta, F.; Giovine, E.; Foglietti, V.; Falconi, C.; et al. Solution-Grown Zn/Al Layered Double Hydroxide Nanoplatelets onto Al Thin Films: Fine Control of Position and Lateral Thickness. J. Nanomater. 2015, 2015, 1–8. [Google Scholar] [CrossRef]
  36. Richetta, M.; Digiamberardino, L.; Mattoccia, A.; Medaglia, P.G.; Montanari, R.; Pizzoferrato, R.; Scarpellini, D.; Varone, A.; Kaciulis, S.; Mezzi, A.; et al. Surface Spectroscopy and Structural Analysis of Nanostructured Multifunctional (Zn, Al) Layered Double Hydroxides: XPS and UPS Investigation of Nanostructured Multifunctional LDH. Surf. Interface Anal. 2016, 48, 514–518. [Google Scholar] [CrossRef] [Green Version]
  37. Zeng, R.-C.; Li, X.-T.; Liu, Z.-G.; Zhang, F.; Li, S.-Q.; Cui, H.-Z. Corrosion Resistance of Zn–Al Layered Double Hydroxide/Poly(Lactic Acid) Composite Coating on Magnesium Alloy AZ31. Front. Mater. Sci. 2015, 9, 355–365. [Google Scholar] [CrossRef]
  38. Chai, H.; Xu, X.; Lin, Y.; Evans, D.G.; Li, D. Synthesis and UV Absorption Properties of 2,3-Dihydroxynaphthalene-6-Sulfonate Anion-Intercalated Zn–Al Layered Double Hydroxides. Polym. Degrad. Stab. 2009, 94, 744–749. [Google Scholar] [CrossRef]
  39. Feng, Y.; Li, D.; Wang, Y.; Evans, D.G.; Duan, X. Synthesis and Characterization of a UV Absorbent-Intercalated Zn–Al Layered Double Hydroxide. Polym. Degrad. Stab. 2006, 91, 789–794. [Google Scholar] [CrossRef]
  40. Arizaga, G.G.C.; Gardolinski, J.E.F.D.C.; Schreiner, W.H.; Wypych, F. Intercalation of an Oxalatooxoniobate Complex into Layered Double Hydroxide and Layered Zinc Hydroxide Nitrate. J. Colloid Interface Sci. 2009, 330, 352–358. [Google Scholar] [CrossRef]
  41. Sel, E.; Ulu, A.; Ateş, B.; Köytepe, S. Comparative Study of Catalase Immobilization via Adsorption on P(MMA-Co-PEG500MA) Structures as an Effective Polymer Support. Polym. Bull. 2021, 78, 2663–2684. [Google Scholar] [CrossRef]
  42. El-Shishtawy, R.M.; Ahmed, N.S.E.; Almulaiky, Y.Q. Immobilization of Catalase on Chitosan/ZnO and Chitosan/ZnO/Fe2O3 Nanocomposites: A Comparative Study. Catalysts 2021, 11, 820. [Google Scholar] [CrossRef]
  43. Barreca, D.; Neri, G.; Scala, A.; Fazio, E.; Gentile, D.; Rescifina, A.; Piperno, A. Covalently Immobilized Catalase on Functionalized Graphene: Effect on the Activity, Immobilization Efficiency, and Tetramer Stability. Biomater. Sci. 2018, 6, 3231–3240. [Google Scholar] [CrossRef] [PubMed]
  44. Prestopino, G.; Arrabito, G.; Generosi, A.; Mattoccia, A.; Paci, B.; Perez, G.; Verona-Rinati, G.; Medaglia, P.G. Emerging Switchable Ultraviolet Photoluminescence in Dehydrated Zn/Al Layered Double Hydroxide Nanoplatelets. Sci. Rep. 2019, 9, 11498. [Google Scholar] [CrossRef]
  45. Geraud, E.; Prevot, V.; Forano, C.; Mousty, C. Spongy Gel-like Layered Double Hydroxide–Alkaline Phosphatase Nanohybrid as a Biosensing Material. Chem. Commun. 2008, 1554–1556. [Google Scholar] [CrossRef]
  46. Nascimento, C.F.; Santos, P.M.; Pereira-Filho, E.R.; Rocha, F.R.P. Recent Advances on Determination of Milk Adulterants. Food Chem. 2017, 221, 1232–1244. [Google Scholar] [CrossRef] [PubMed]
  47. Ivanova, A.S.; Merkuleva, A.D.; Andreev, S.V.; Sakharov, K.A. Method for Determination of Hydrogen Peroxide in Adulterated Milk Using High Performance Liquid Chromatography. Food Chem. 2019, 283, 431–436. [Google Scholar] [CrossRef] [PubMed]
  48. Moody, G.J.; Thomas, J.D.R. Selective Ion-Sensitive Electrodes. Sel. Annu. Rev. Anal. 1973, 3, 59. [Google Scholar] [CrossRef]
  49. Mascini, M. Uses of Known Addition, Gran’s Plots and the Related Methods with Ion-Selective Electrodes. In Ion-Selective Electrode Reviews; Elsevier: Amsterdam, The Netherlands, 1981; Volume 2, pp. 17–71. ISBN 978-0-08-028434-7. [Google Scholar]
  50. Campanella, L.; Capesciotti, G.; Russo, M.; Tomassetti, M. Study of the Catalytic Mechanism of the Enzyme Catalase on Organic Hydroperoxides in Non-Polar Organic Solvent. Curr. Enzym. Inhib. 2008, 4, 86–92. [Google Scholar] [CrossRef]
Figure 1. Schematic representation of the layered double hydroxide (LDH) structure, showing the staking of the positively charged [ Zn 1 x 2 + Al x 3 + ( OH ) 2 ] x + brucite-like sheets separated by the negatively charged [ A x / n n · yH 2 O ] x interlamellar spaces.
Processes 09 01878 g001
Figure 2. Clark-LDH-catalase enzyme biosensor.
Processes 09 01878 g002
Figure 3. (a) FTIR spectra in KBr pellets: (1) pristine KBr, (2) LDH, wet with phosphate buffer and dried, (3) LDH + catalase mixture, wet with phosphate buffer and dried, (4) LDH + catalase + glutaraldehyde mixture, wet with phosphate buffer and dried, (5) pristine catalase enzyme, wet with phosphate buffer and dried, and (6) pristine glutaraldehyde. (b) X-ray diffraction patterns of (1) LDH as grown, wet with phosphate buffer and dried, and (2) LDH + catalase, wet with phosphate buffer and dried. The main basal reflections of the pristine (Zn–Al–NO3) LDH phase and of the (Zn–Al–NO3) LDH phase after interaction with catalase are labelled by diamonds (◊) and stars (⋆), respectively.
Processes 09 01878 g003
Figure 4. (a) Clark-type LDH-catalase enzyme biosensor. Amperometric calibration curves recorded by increasing H2O2 concentration as a function of lifetime. Each point represents the mean of at least three repeated determinations. (b) Raw experimental data of a typical calibration curve of the fabricated Clark-type LDH-catalase enzyme biosensor, recorded as a function of time (2nd day) under subsequent additions of hydrogen peroxide solution (curve 1), and blank curve without enzyme (curve 2). Each addition was 0.05 mL of H2O2 (0.3% by weight) water solution.
Processes 09 01878 g004
Figure 5. Clark-type LDH-catalase enzyme biosensor response vs. H2O2 substrate concentration. (a) Slope and (b) linearity range values as a function of lifetime.
Processes 09 01878 g005
Figure 6. (a) Measurement of H2O2 concentration in LB1 cosmetic sample. The experimental calibration curve in matrix and the extrapolated hydrogen peroxide concentration (★), equal to 0.78 ± 0.05 g L−1, are shown. Each point represents the mean of at least three repeated determinations. (b) Measurement of H2O2 concentration in LB2 cosmetic sample. The experimental calibration curve in matrix and the extrapolated hydrogen peroxide concentration (★), equal to 1.30 ± 0.05 g L−1, are shown. Each point represents the mean of at least three repeated determinations.
Processes 09 01878 g006
Figure 7. Determination of H2O2 concentration in commercial cow’s milk sample. Experimental calibration curve in matrix and hydrogen peroxide concentration (★), equal to (2.2 ± 0.9) mg L−1, found by Gran’s plot method (see inset). Each point represents the mean of at least three repeated determinations.
Processes 09 01878 g007
Table 1. Best analytical data of the Clark-type LDH-catalase enzyme biosensor in its lifetime (2nd day). Comparison with data of direct amperometric GC biosensor.
Linear Regression
(y = μA; x = mM)
Linearity Range (mM)R2LOD (mM)RSD%Response Time (s)
Present Worky = (0.1704 ± 0.0044)∙x + (0.2599 ± 0.0460)0.021–17.5 0.99540.0210.3665
Ref. [29]y = (10.09 ± 0.29)∙x + (115.1 ± 29.1)0.25–1580.99760.20.58.5
Table 2. Inferences in hydrogen peroxide determination using the fabricated Clark-type LDH-catalase enzyme biosensor (this work) and the previously developed GC–LDH-catalase biosensor (Ref. [29]). Each added interfering species had a final concentration in solution equal to that of hydrogen peroxide.
Percent Interferences of Oxidant or Antioxidant Compounds to H2O2 Analysis, Using LDH-Clark Enzymatic Catalase Biosensor Percent Interferences of Oxidant or Antioxidant Compounds to H2O2 Analysis, Using LDH-Glassy Carbon Catalase Biosensor
% response increase, to H2O2 response, in presence of potassium permanganate aqueous solution.0%260%
% response increase, to H2O2 response, in presence of sodium nitrate aqueous solution.0%3%
% response decrease, to H2O2 response, in presence of Fe3+ aqueous solution.0%32.3%
(transient peak 124%)
% response decrease, to H2O2 response, in presence of sodium ascorbate aqueous solution.0%5.6%
% response decrease, to H2O2 response, in presence of sodium nitrite aqueous solution.0%1%
Table 3. Experimental percent recovery for hydrogen peroxide addition in cosmetic samples by Clark-type LDH-catalase enzyme biosensor.
SampleFound Concentration in Cosmetic Sample (g L−1)H2O2 Additions (g L−1)Found + Added Nominal Value (g L−1)Experimental Value (g L1)Δ (%) (RSD% = 0.7)Percent Recovery (RSD% = 0.7)
LB10.781.302.082.247.69107.69
LB10.783.804.584.784.37104.37
LB21.301.803.103.327.10107.10
LB21.303.805.105.140.78100.78
Table 4. Experimental percent recovery for hydrogen peroxide addition in commercial cow’s milk sample by Clark-type LDH-catalase enzyme biosensor.
Found H2O2 Concentration in Milk Sample (mg L−1)Additions of H2O2 (mg L−1)Found + Added Nominal Value (mg L−1)Experimental Value (mg L−1)Δ (%) (RSD% = 1.5)Percent Recovery (RSD% = 1.5)
2.2200202.2218.07.8107.8
2.2500502.2462.1−8.092.0
2.2700702.2726.53.5103.5
Publisher’s Note: MDPI stays neutral with regard to jurisdictional claims in published maps and institutional affiliations.

