The Prediction of Possibilities of CO Poisoning and Explosion during Syngas Leakage in the UCG Process


Abstract
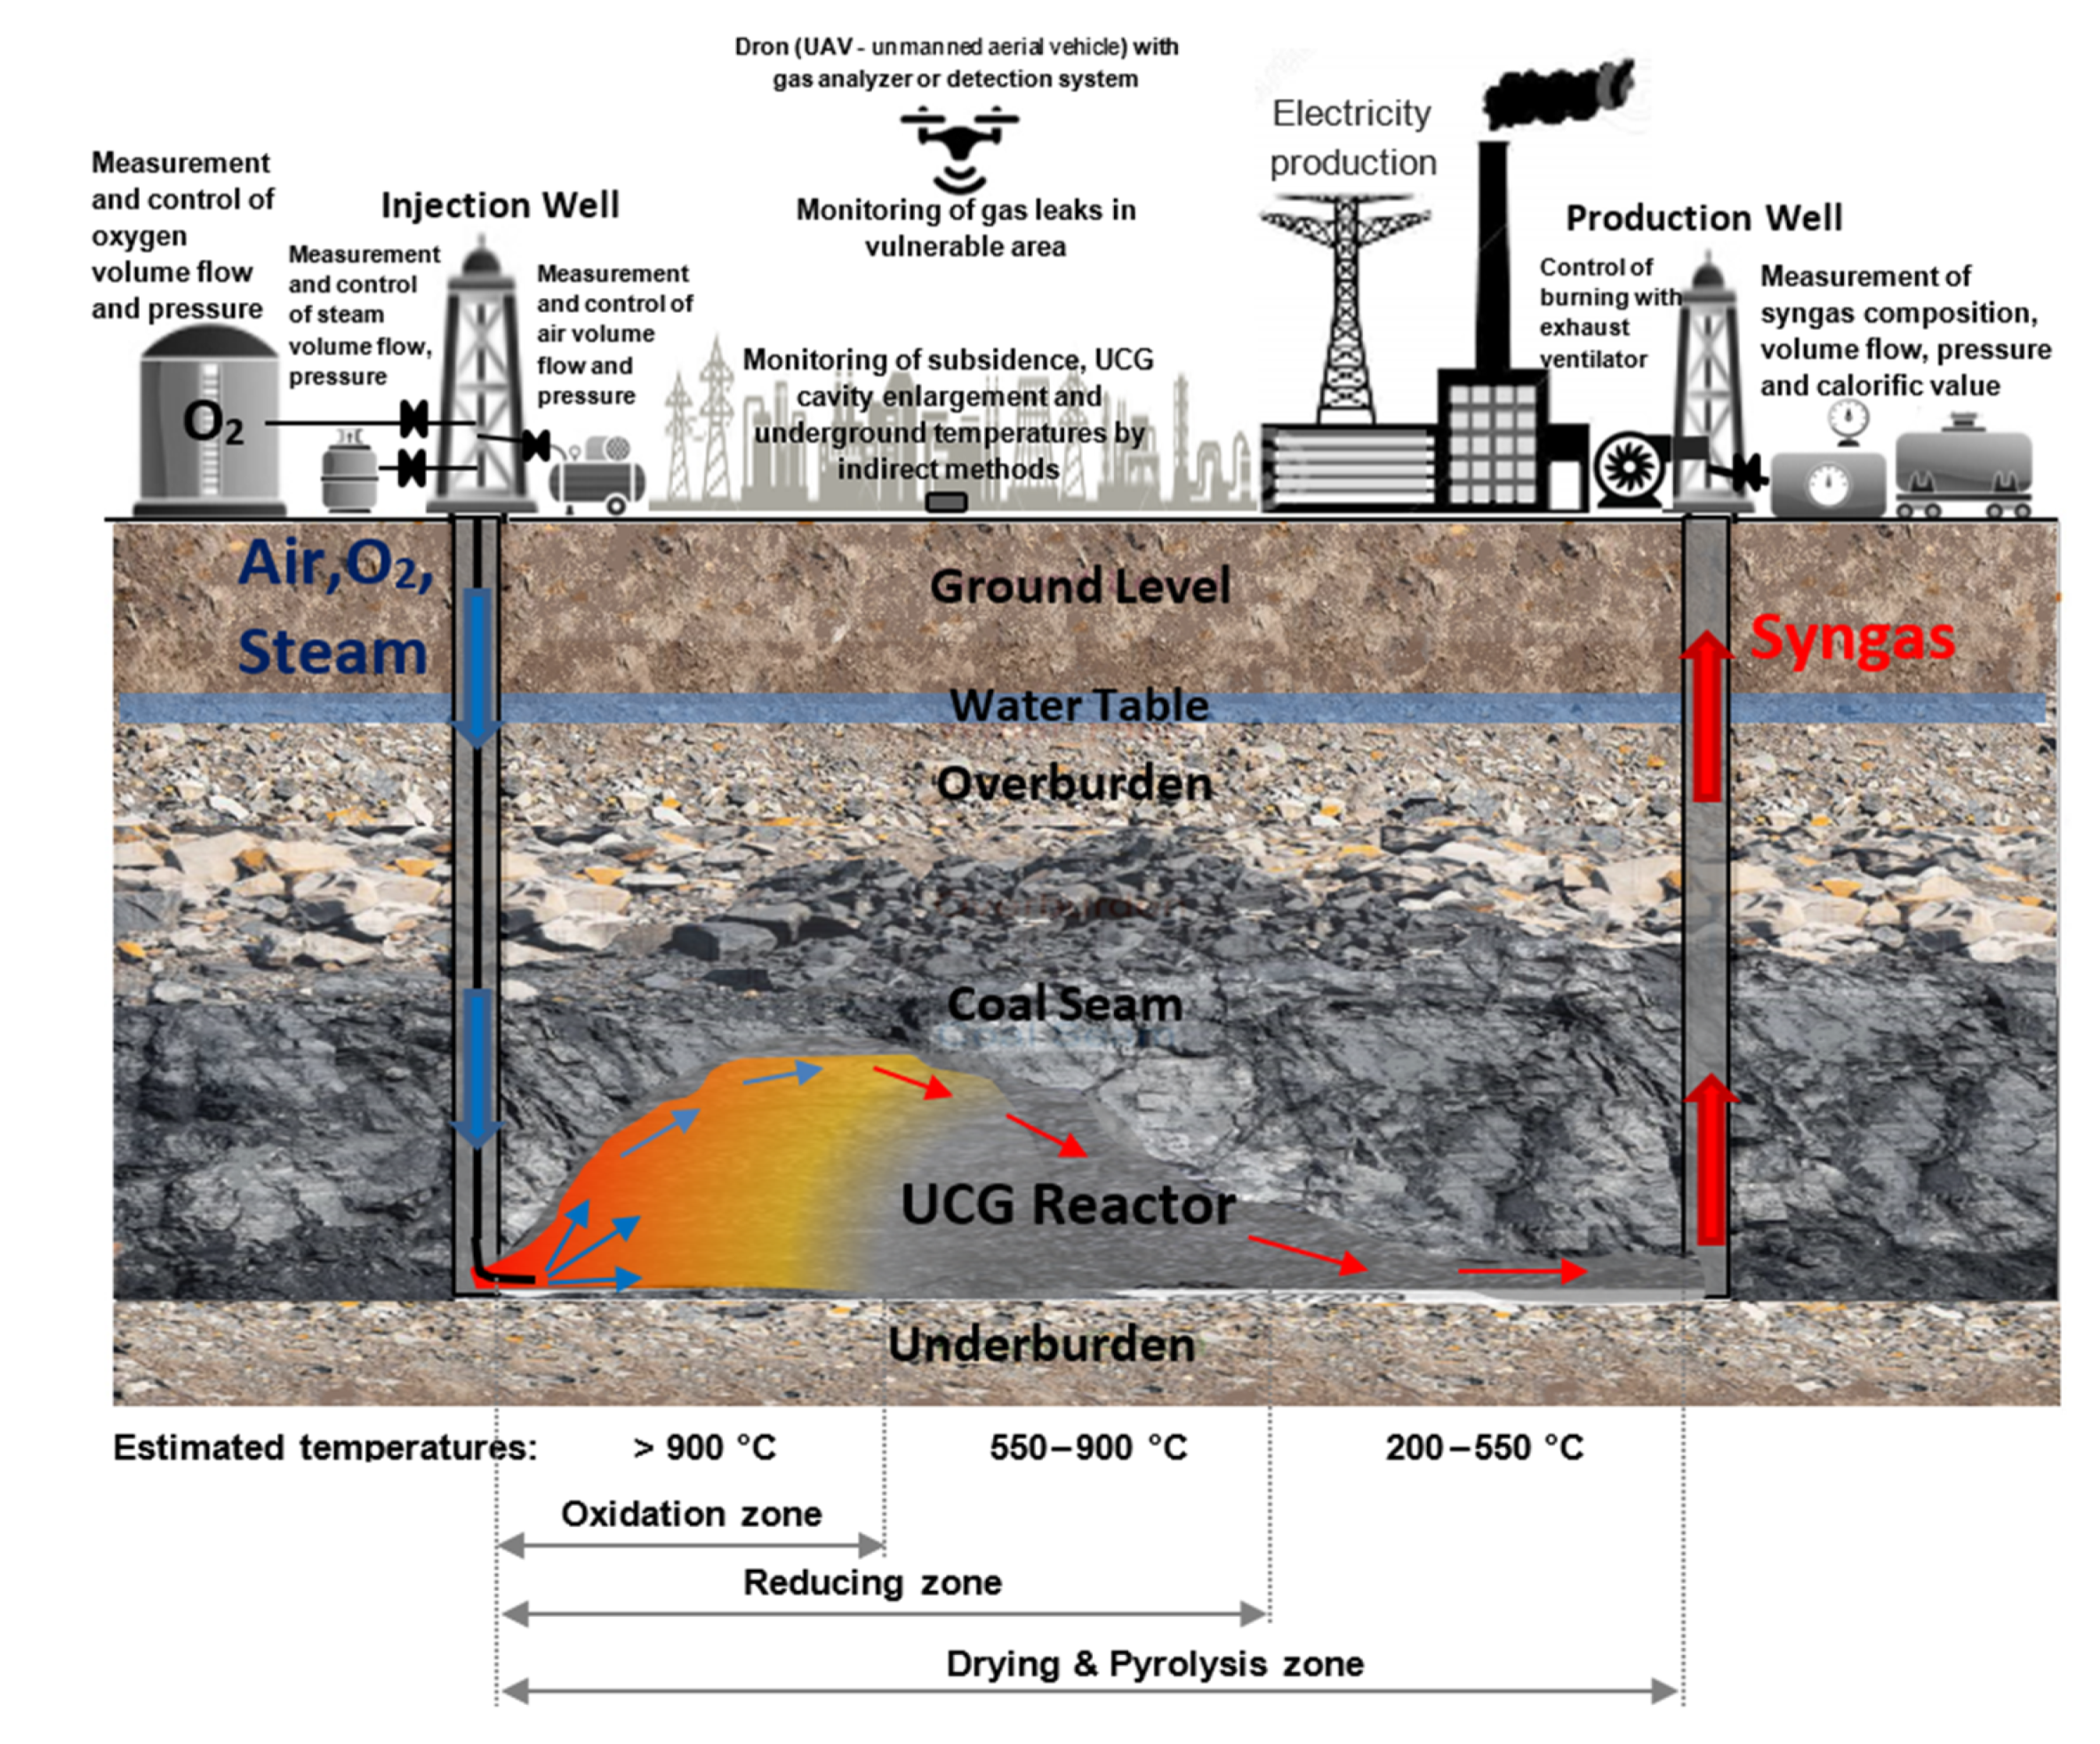
:1. Introduction
2. Materials and Methods
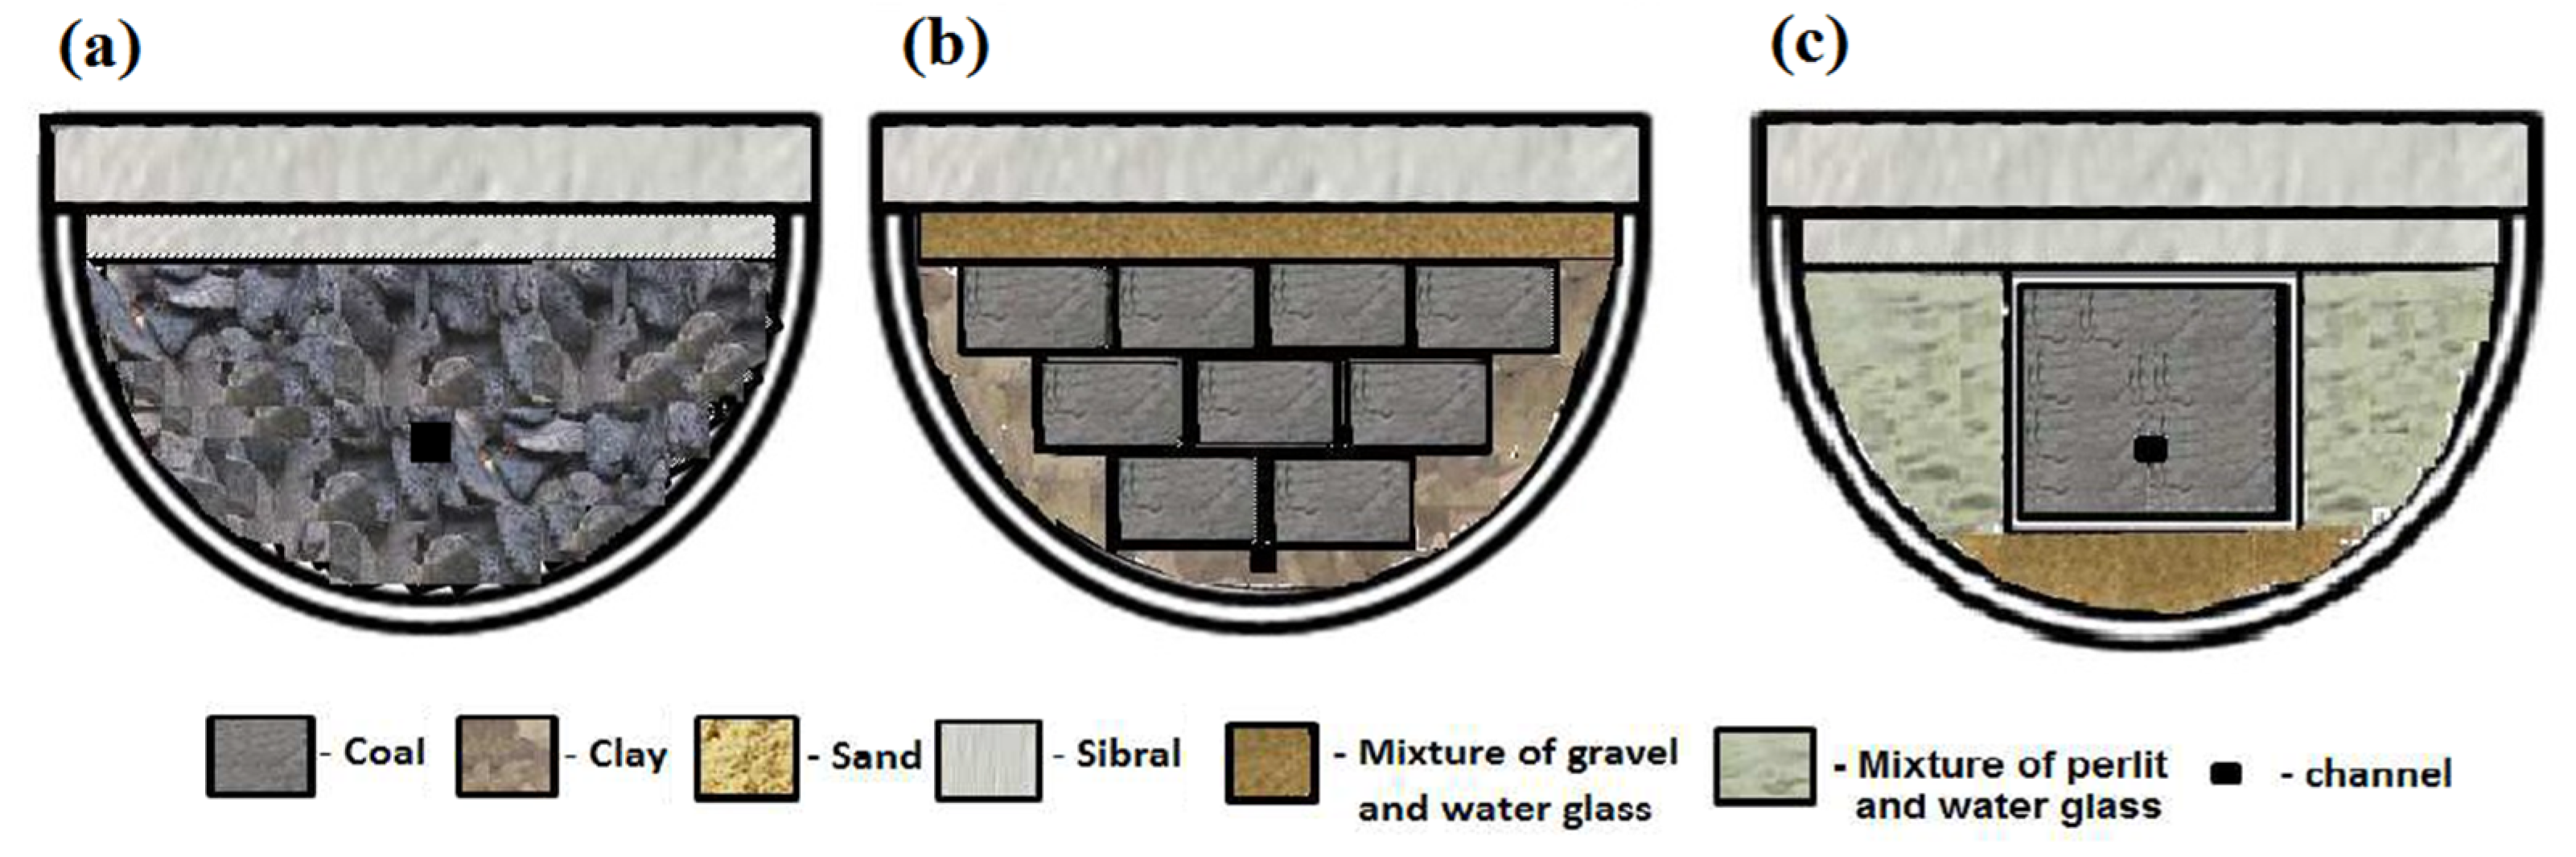
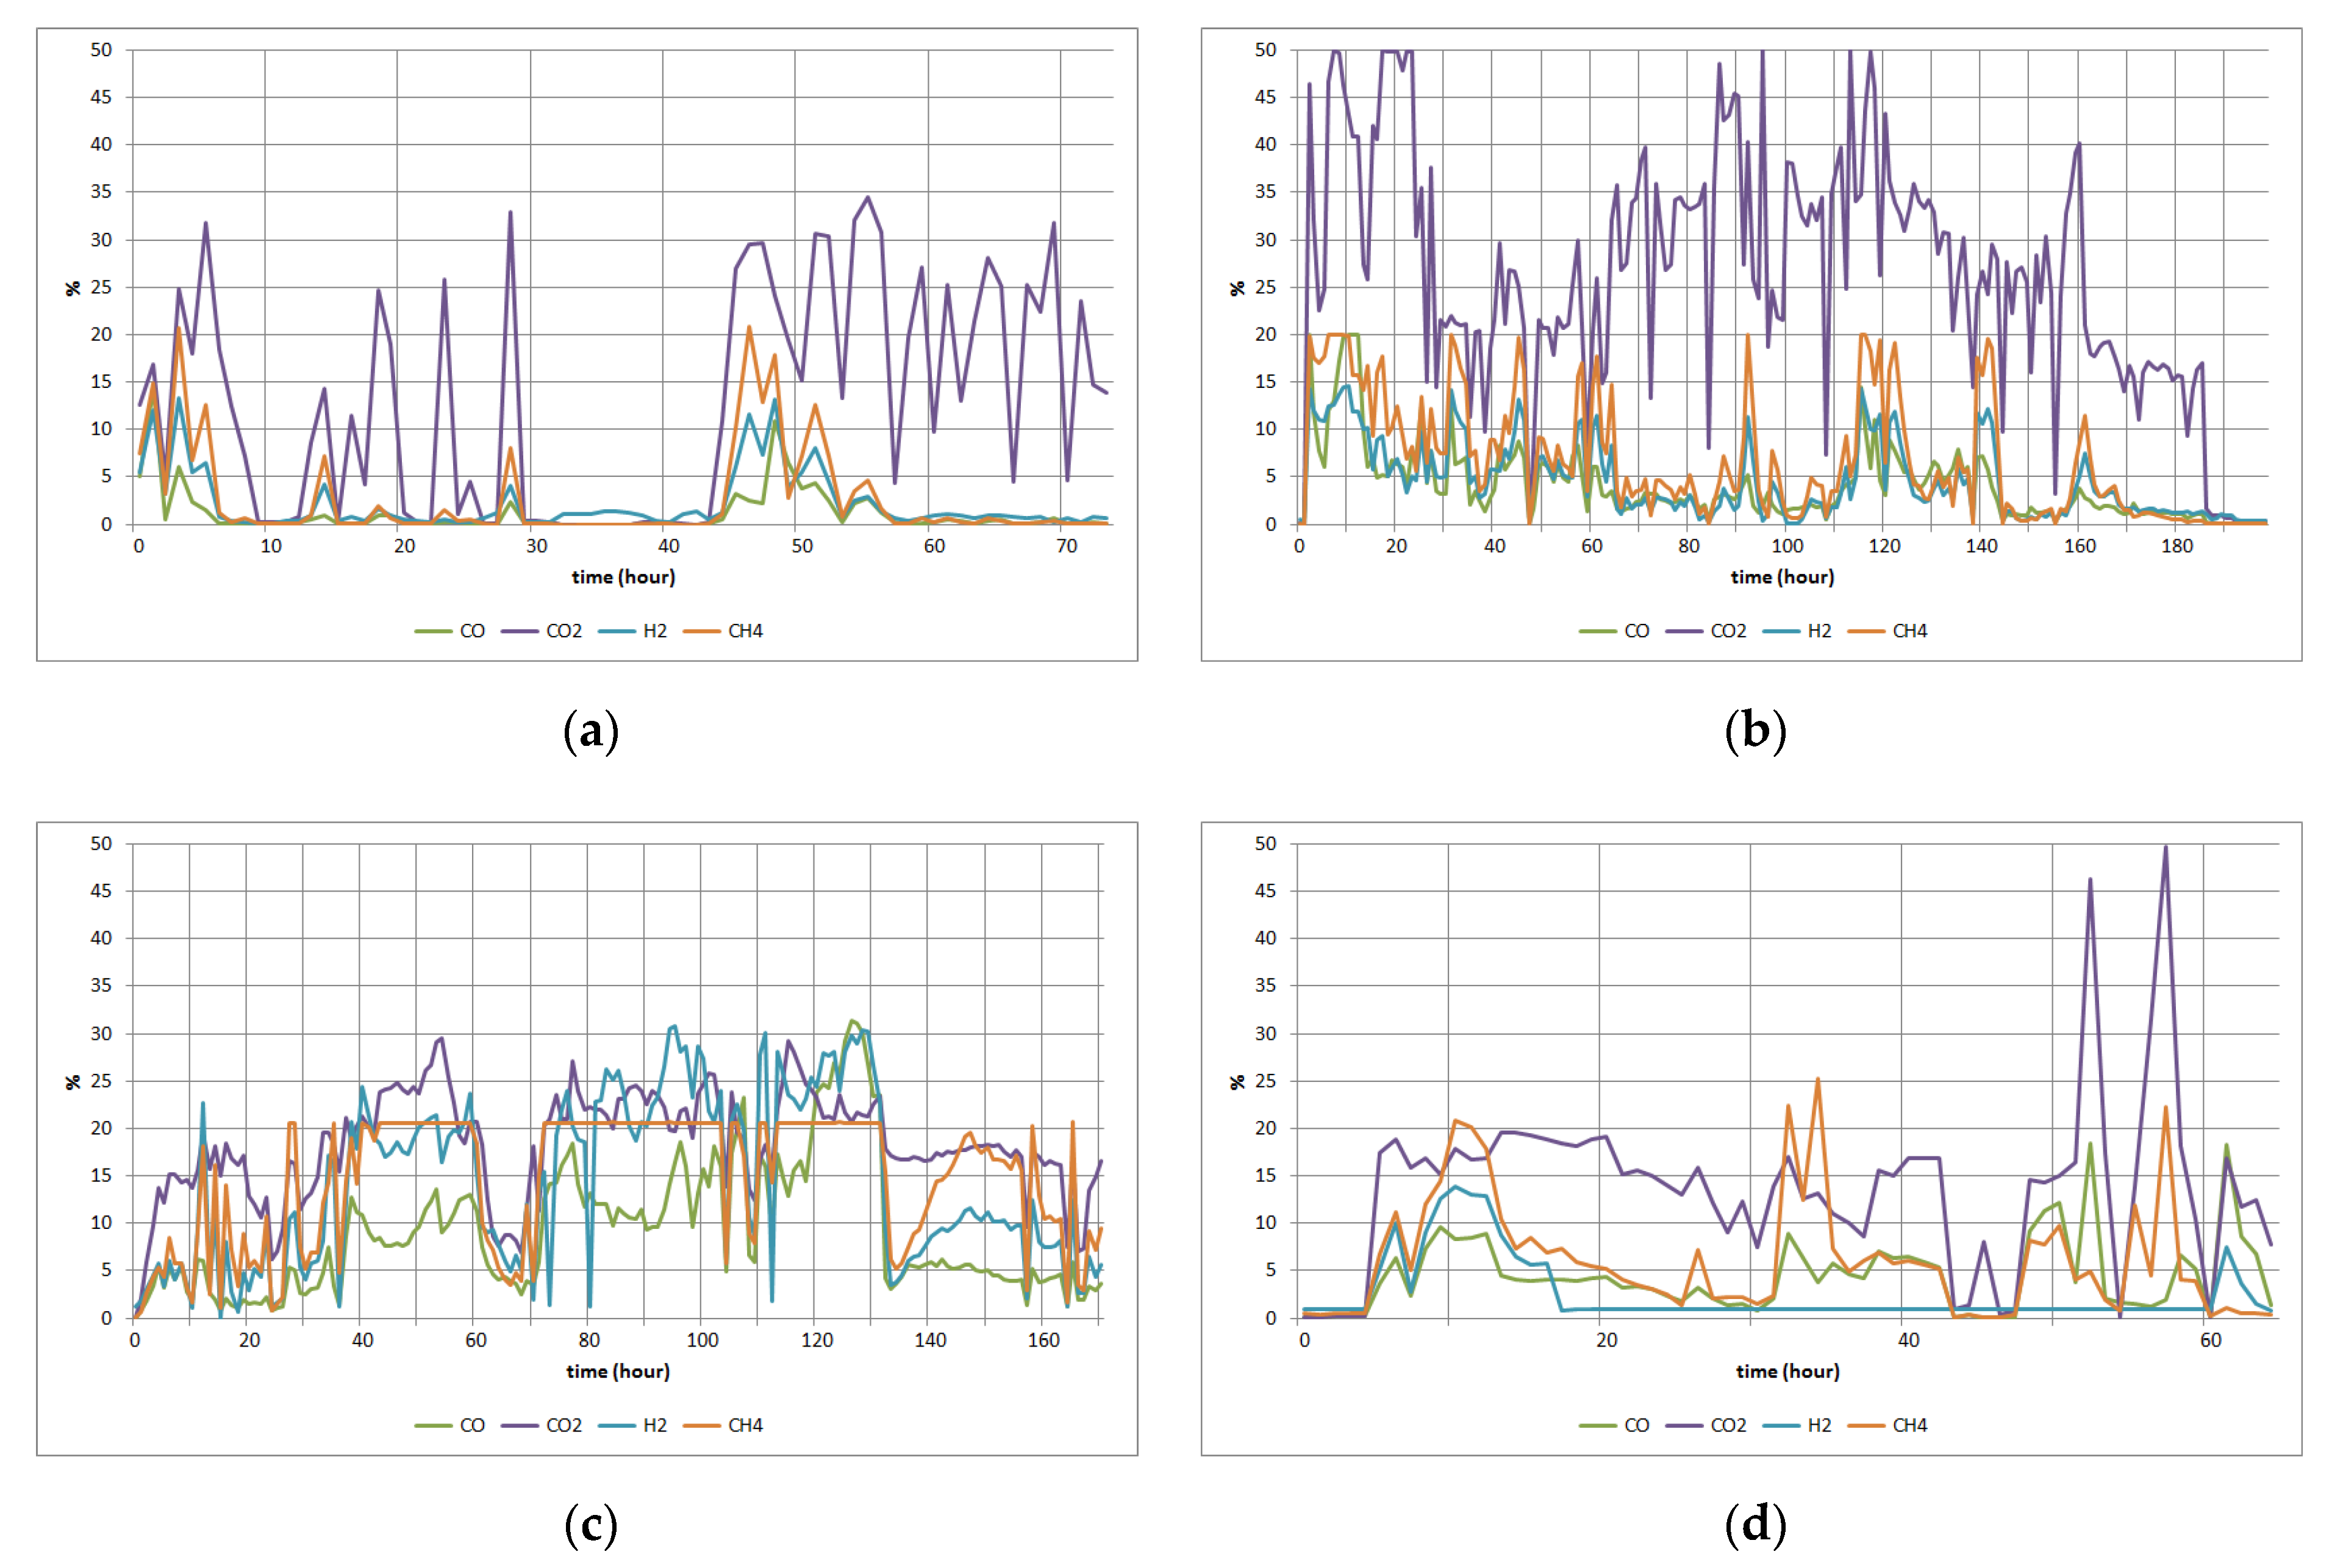
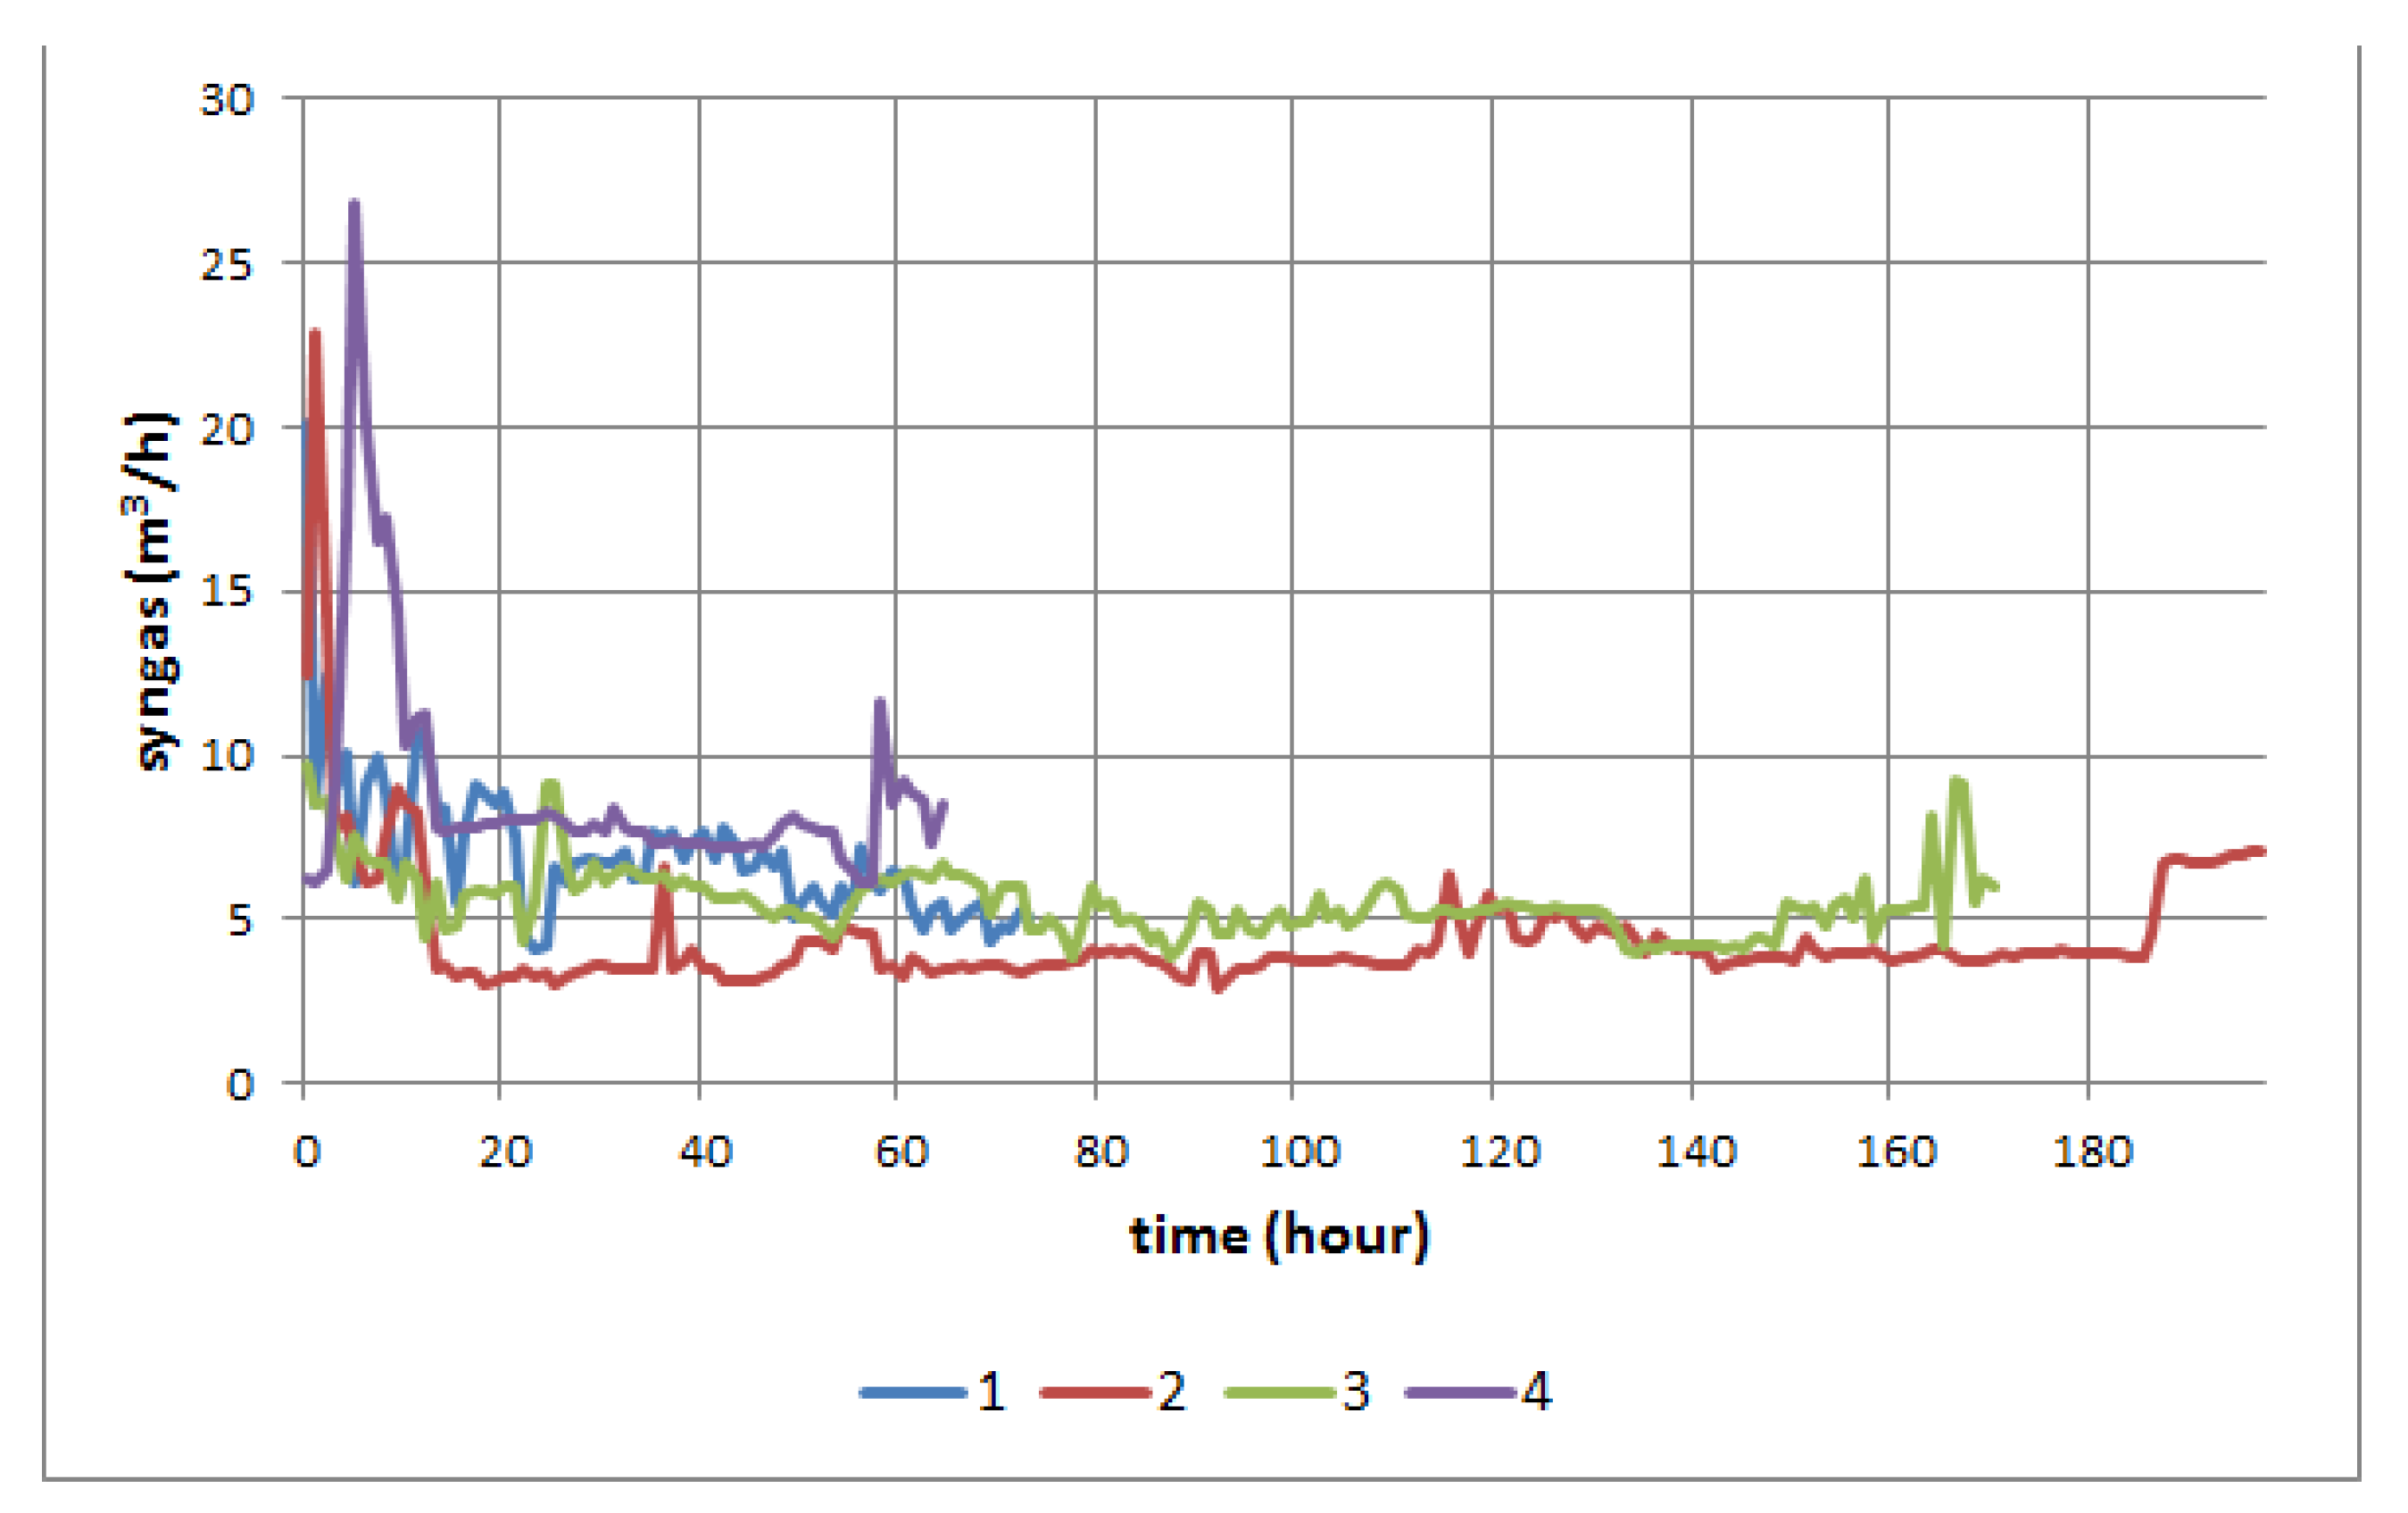
2.1. Experiments
2.2. Theoretical Background
2.2.1. The Mathematical Model of Material Balance for UCG Process
2.2.2. The Mathematical Model for Mixing of Gasses
QIN = 0
3. Results
3.1. Results of the Model of Material Balance
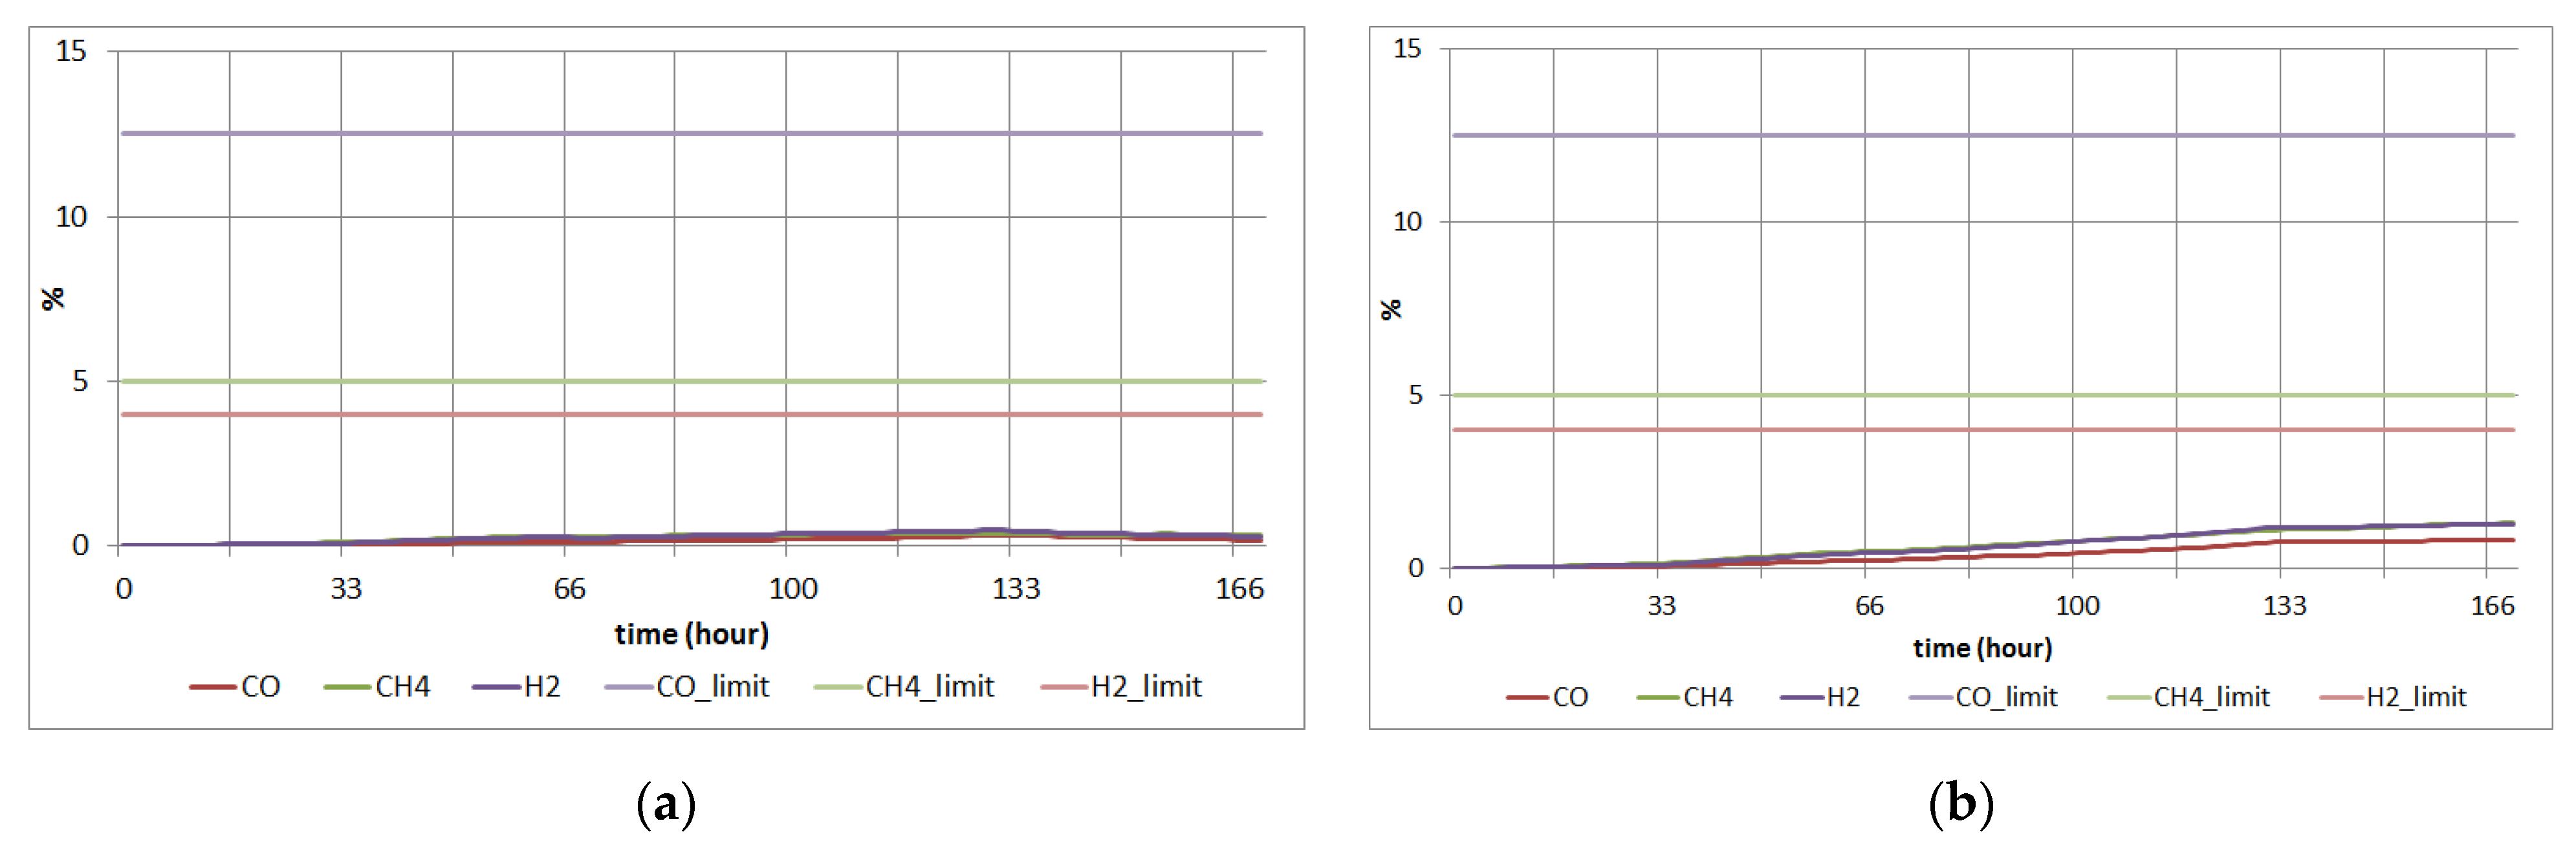
3.2. Simulation Study for an Explosion
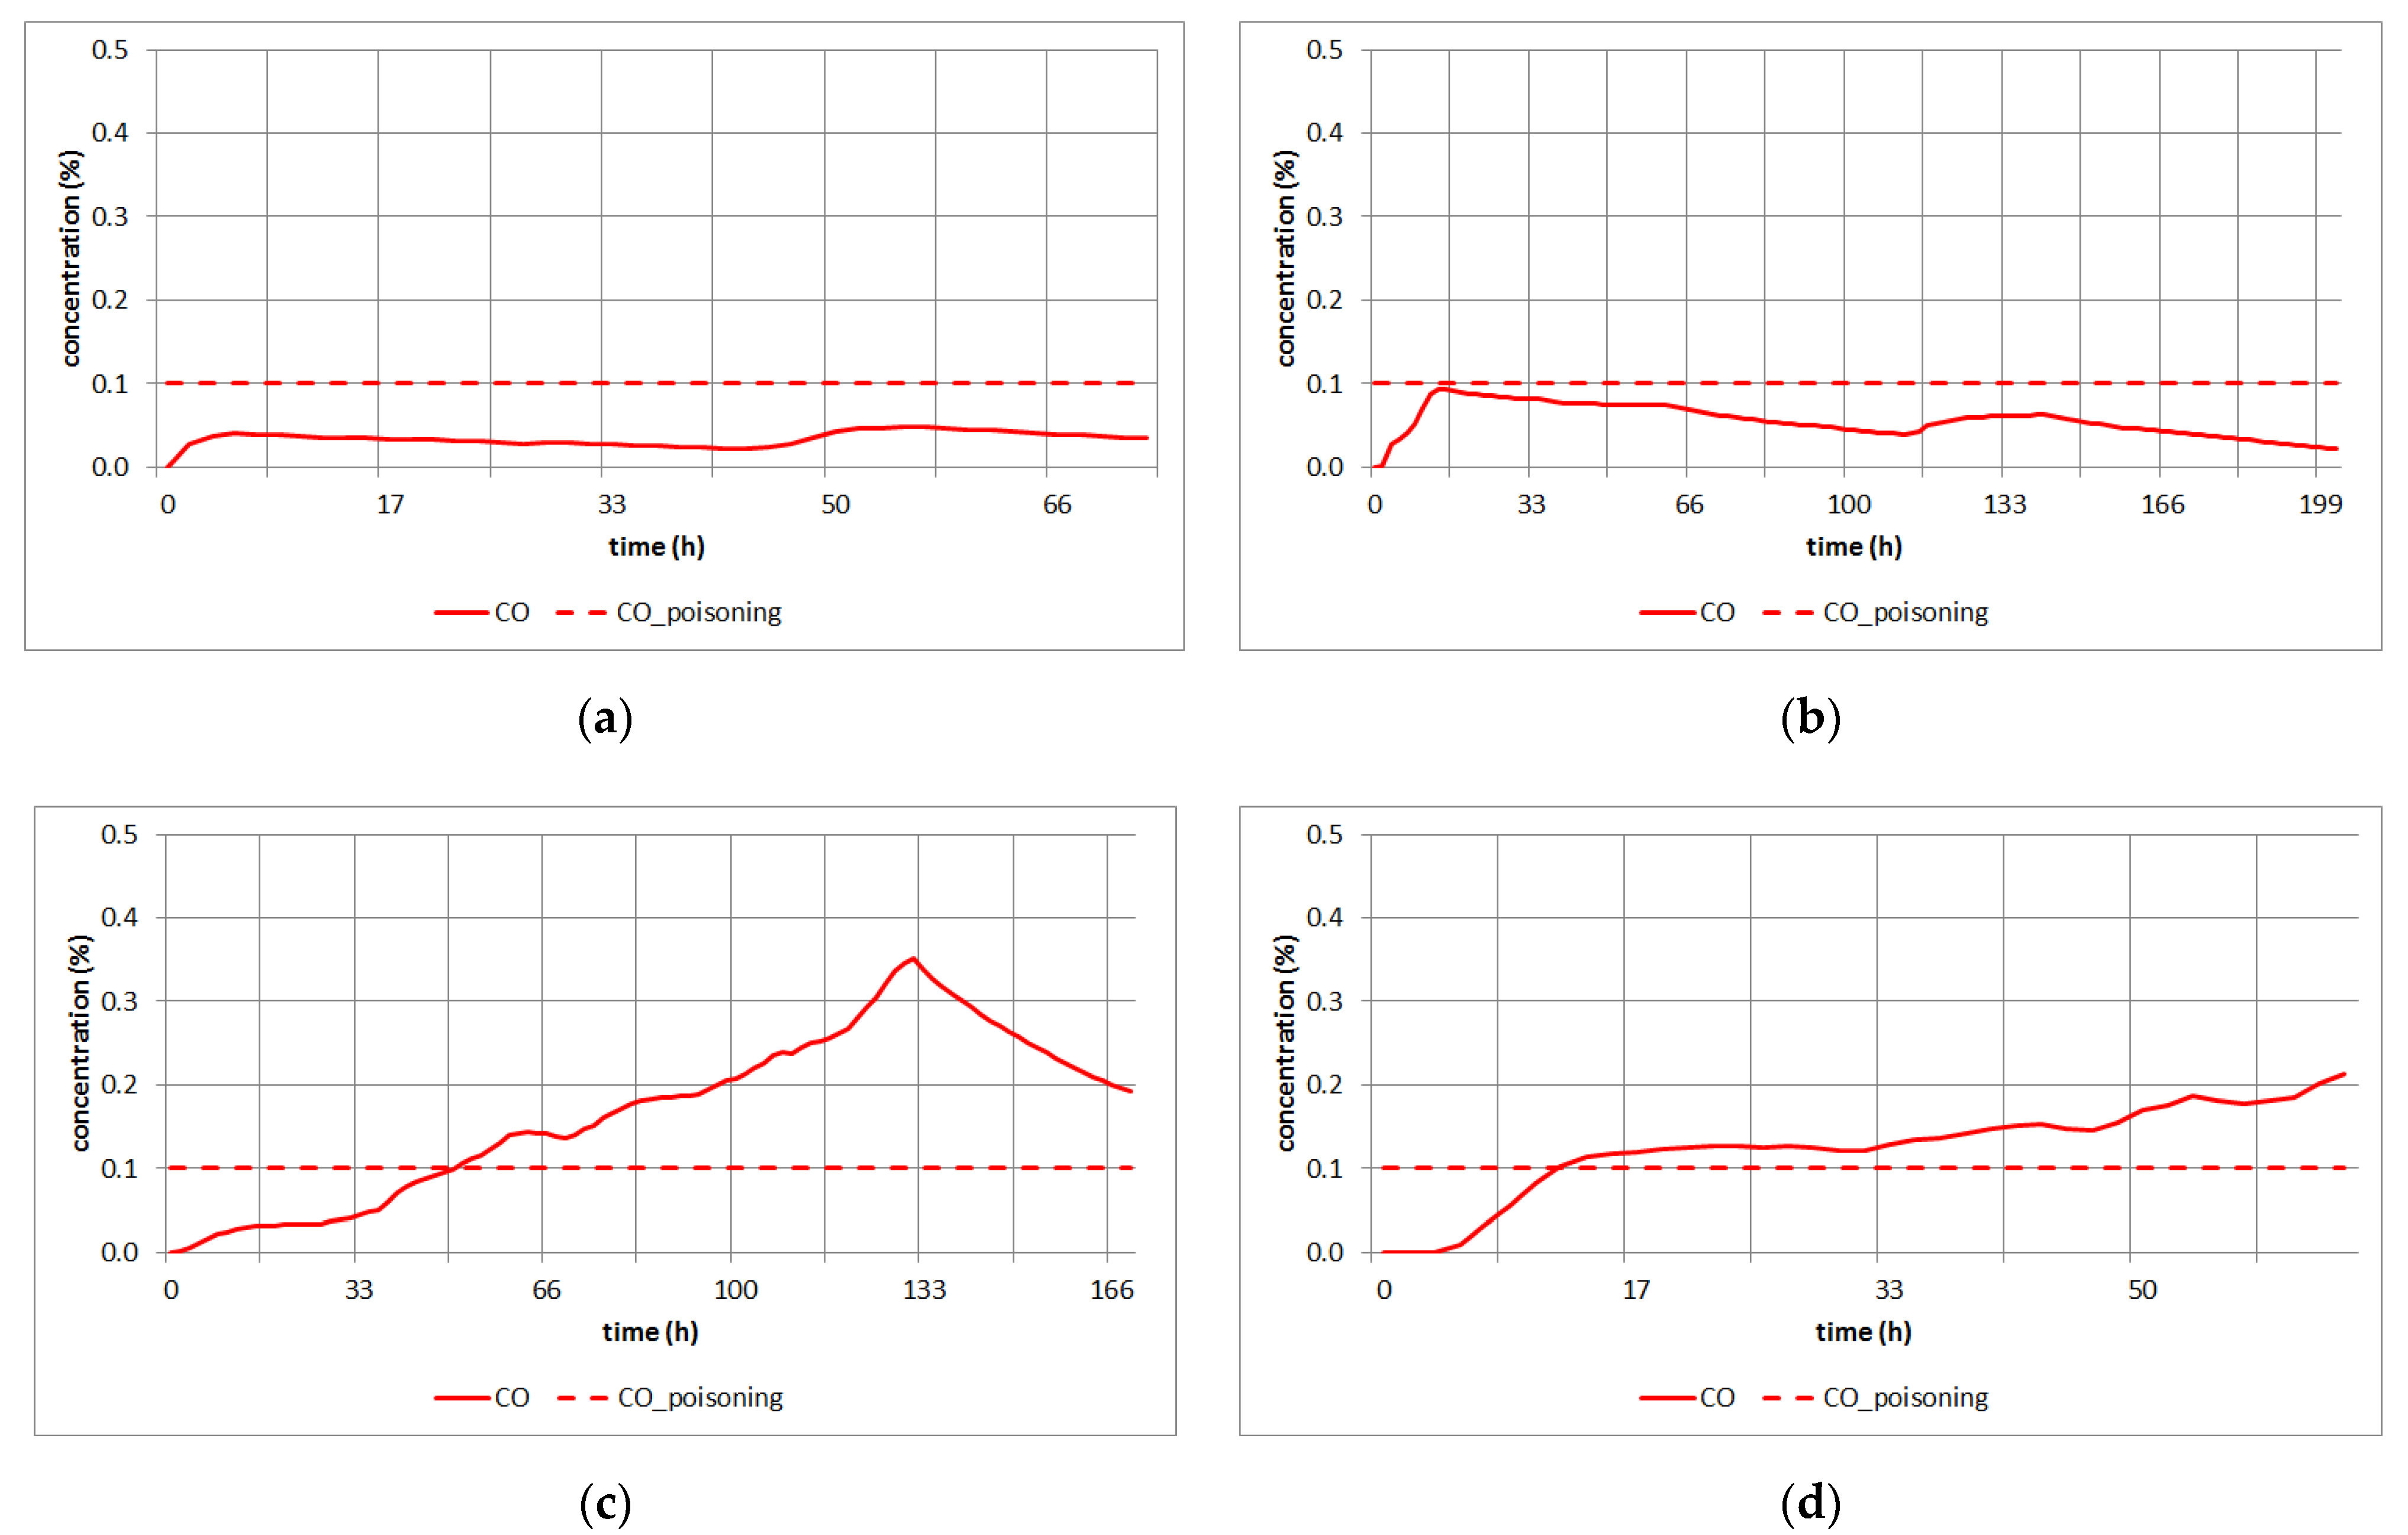
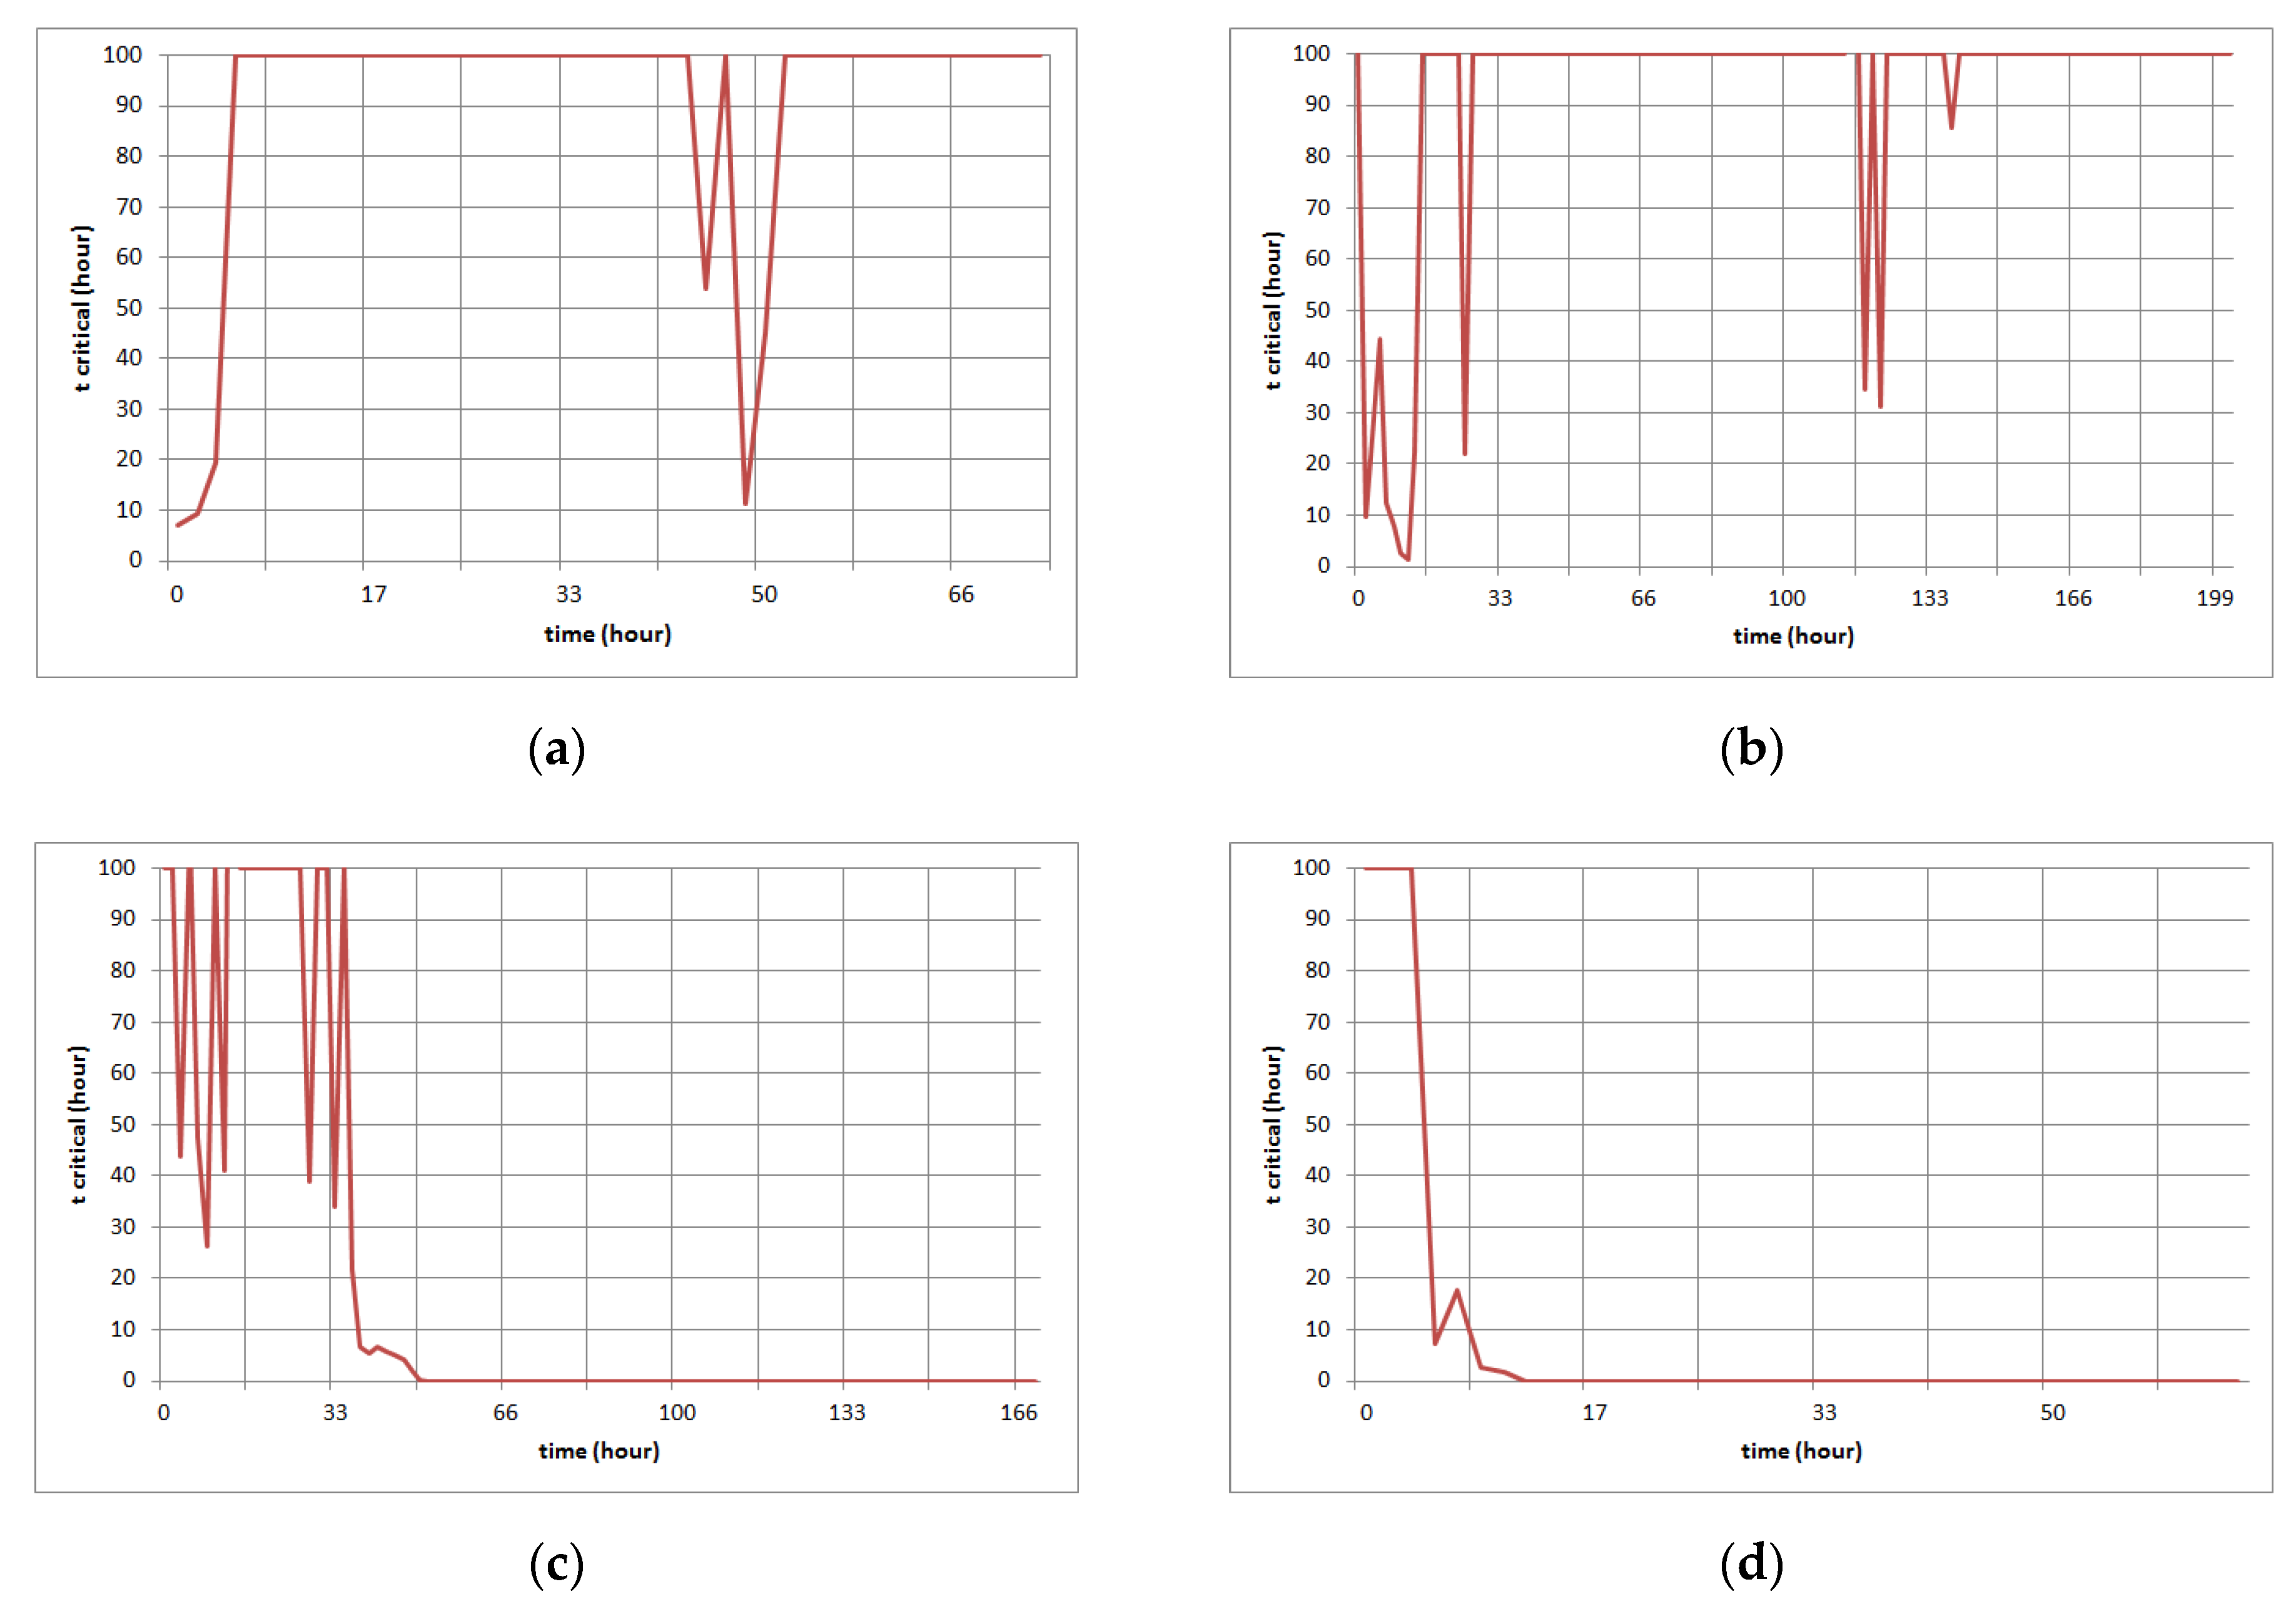
3.3. Simulation Study for CO Poisoning
3.4. The Proposal of the Model for Prediction Critical Time of CO Poisoning
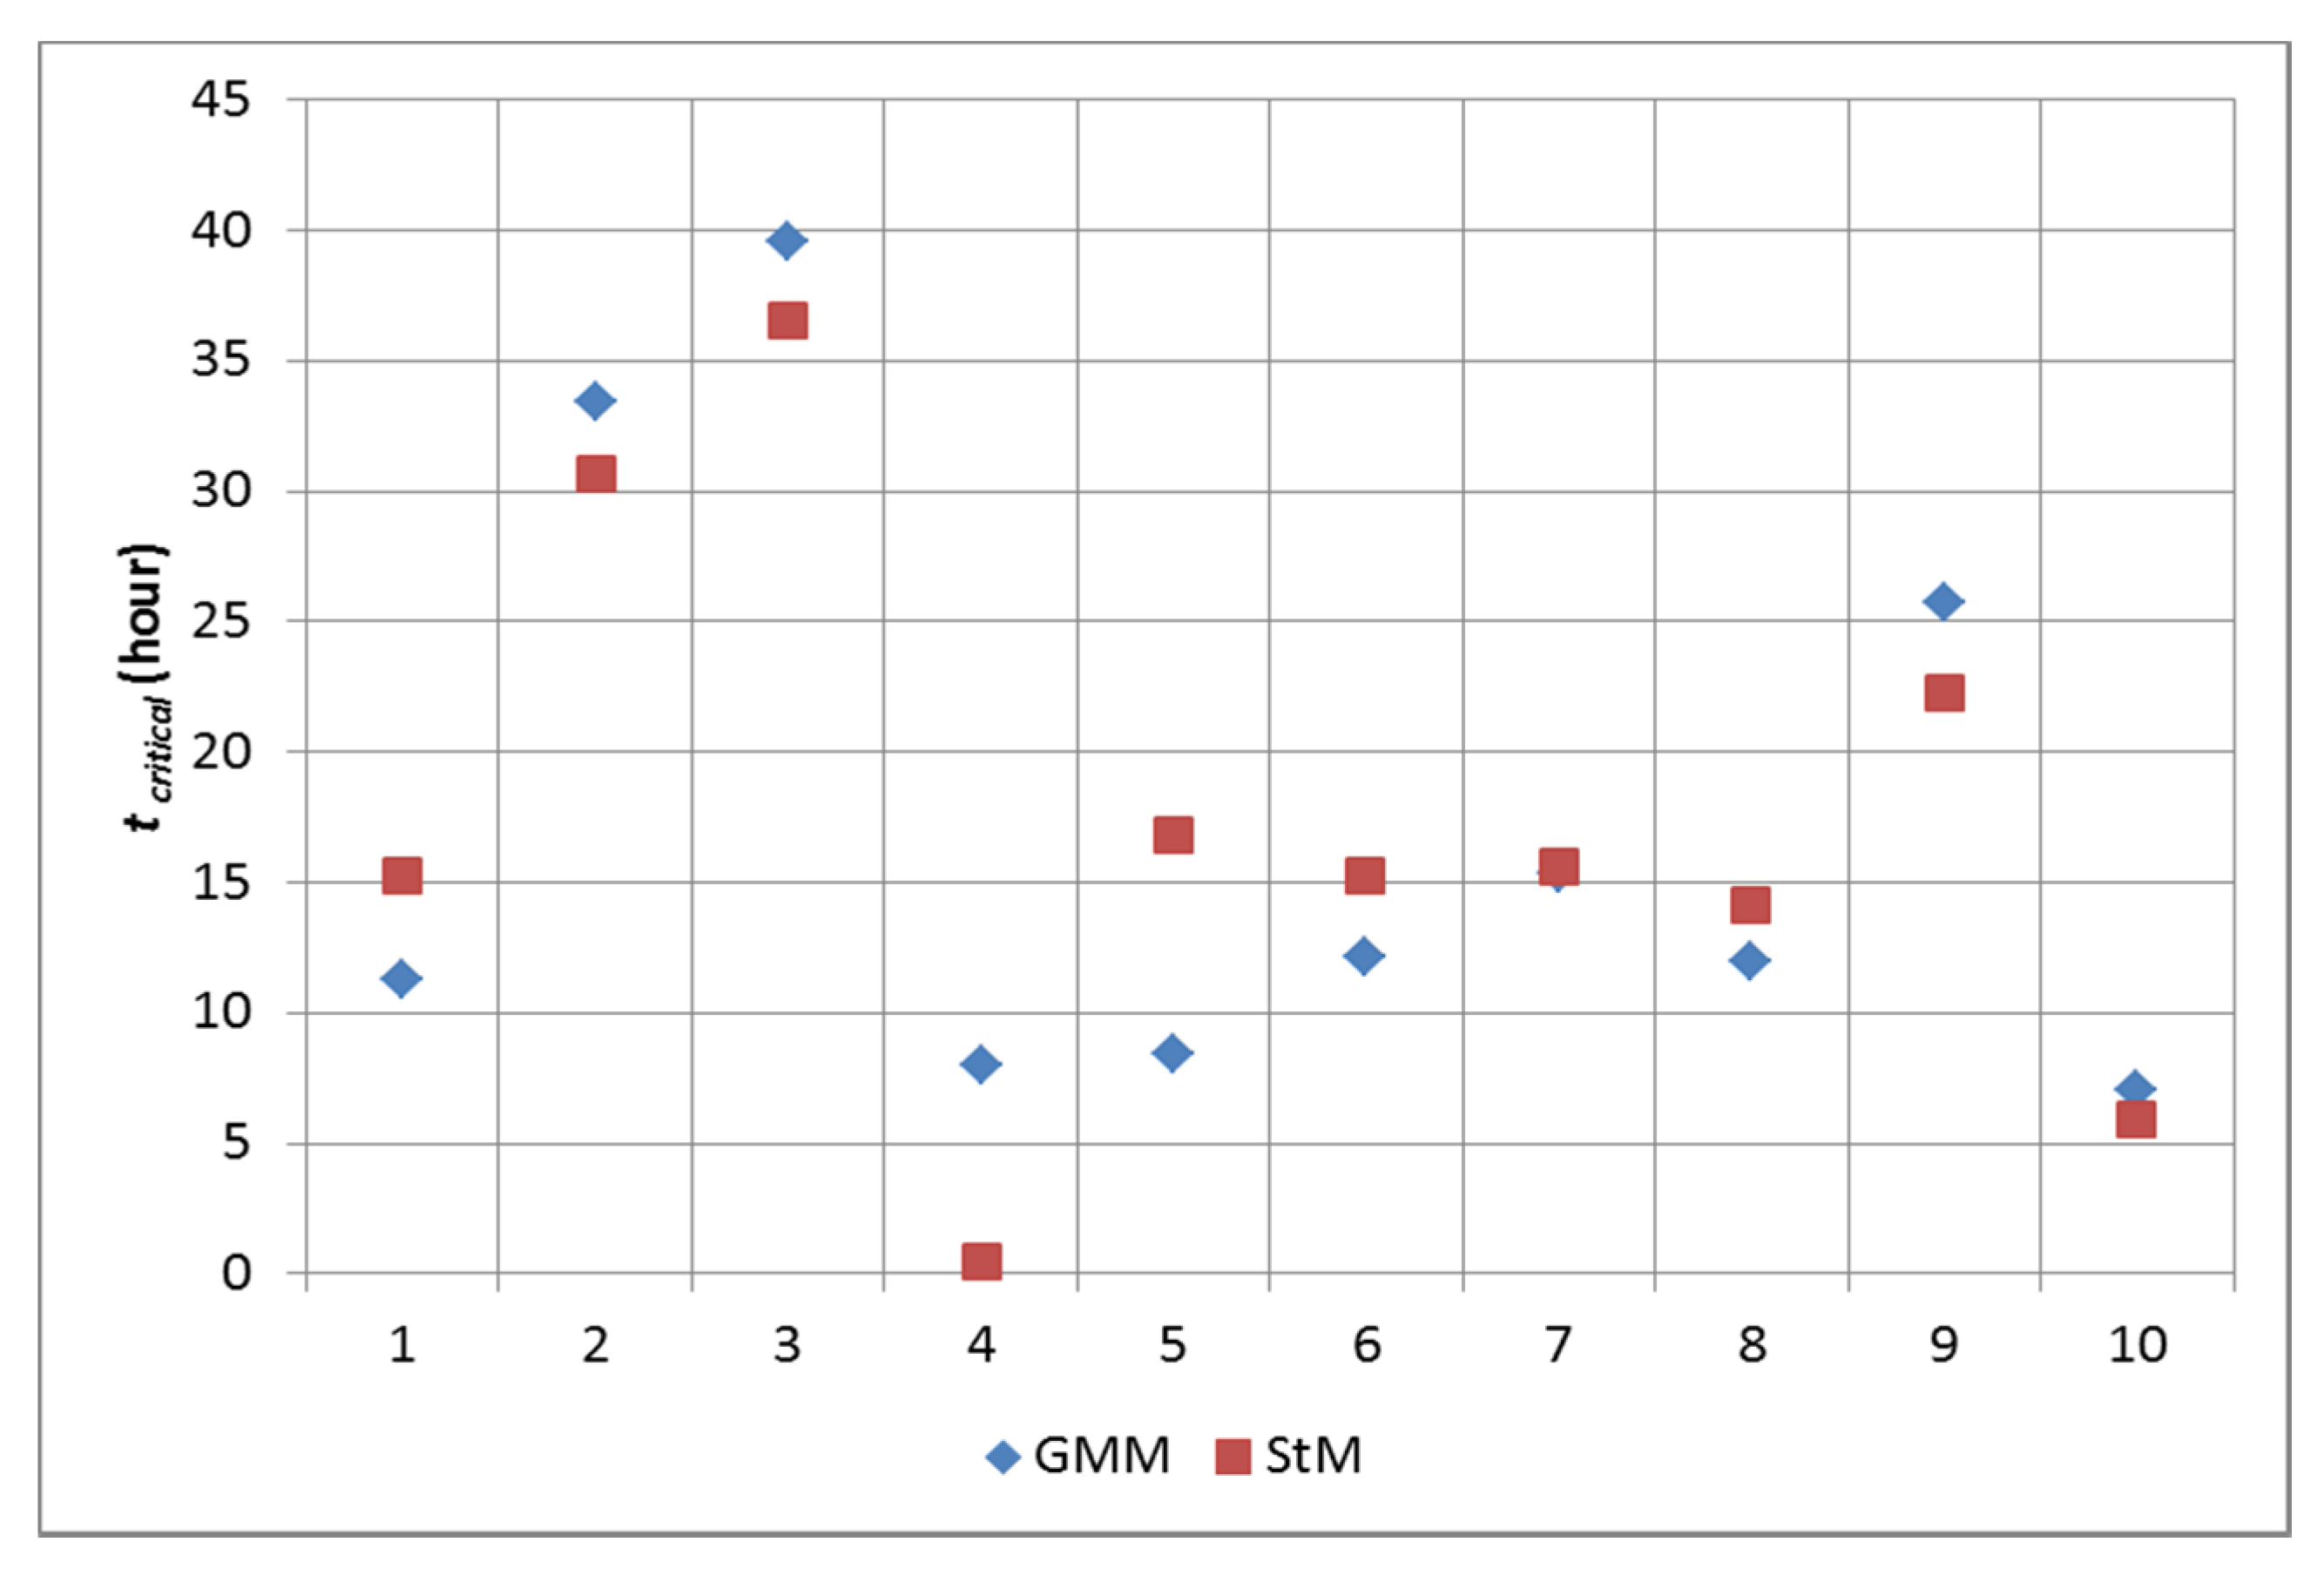
3.4.1. The Static Model for Prediction of the Critical Time of CO Poisoning
- The size (volume) of the space in which is mixed the leaking syngas from the UCG process with air,
- Percentage of leaking syngas,
- The volume flow of fresh air supplied to space.
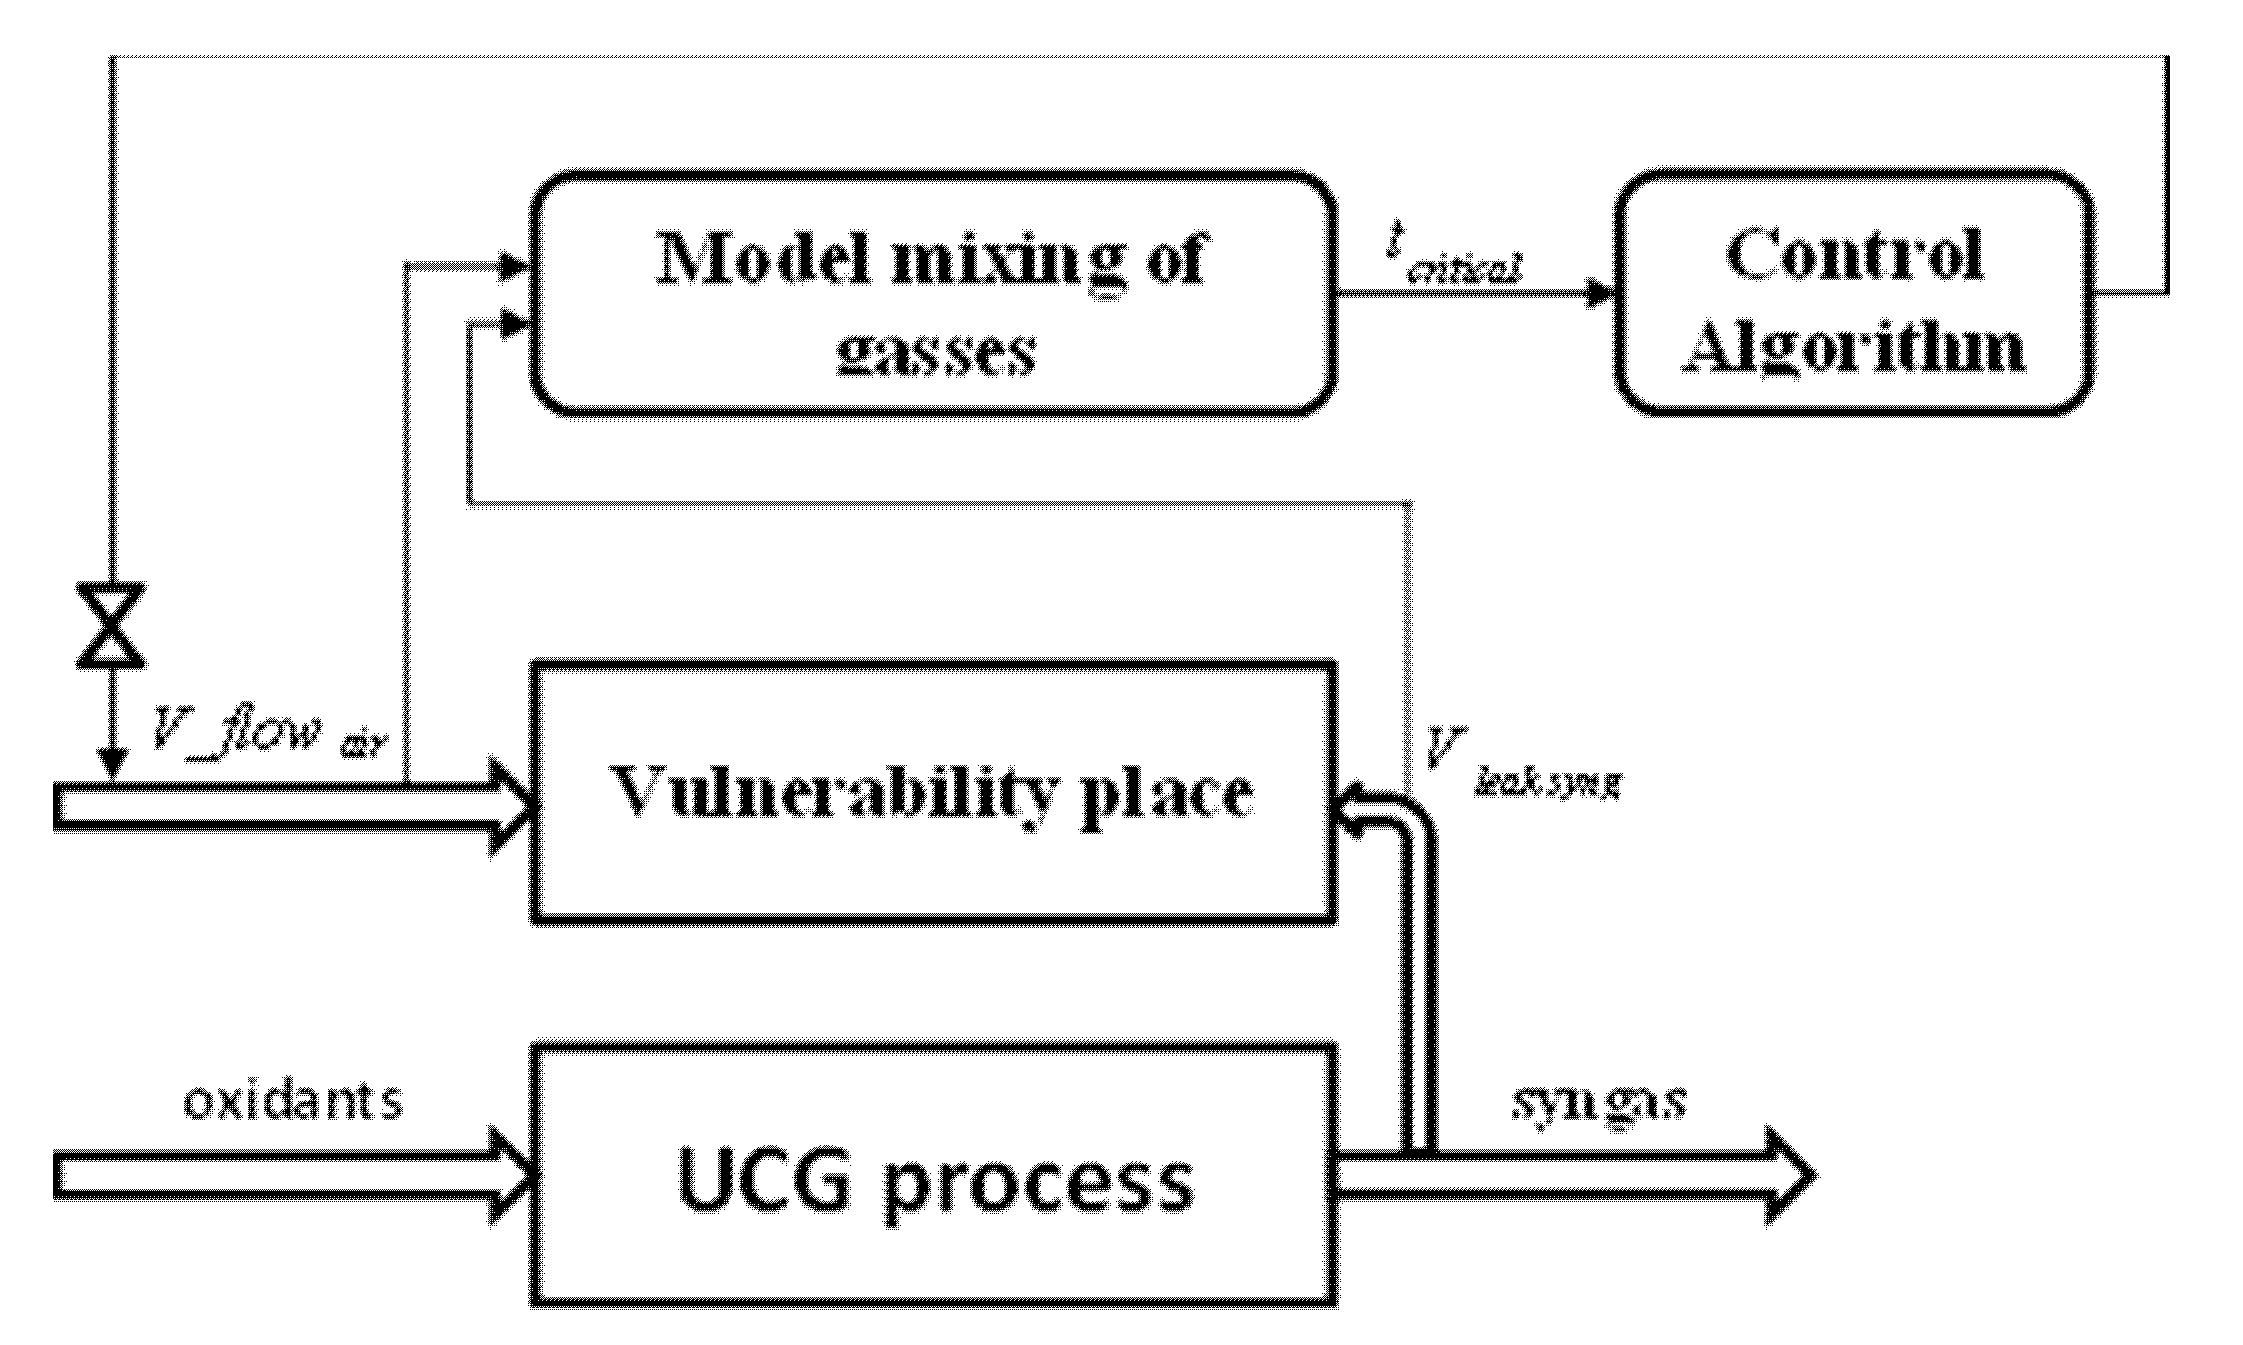
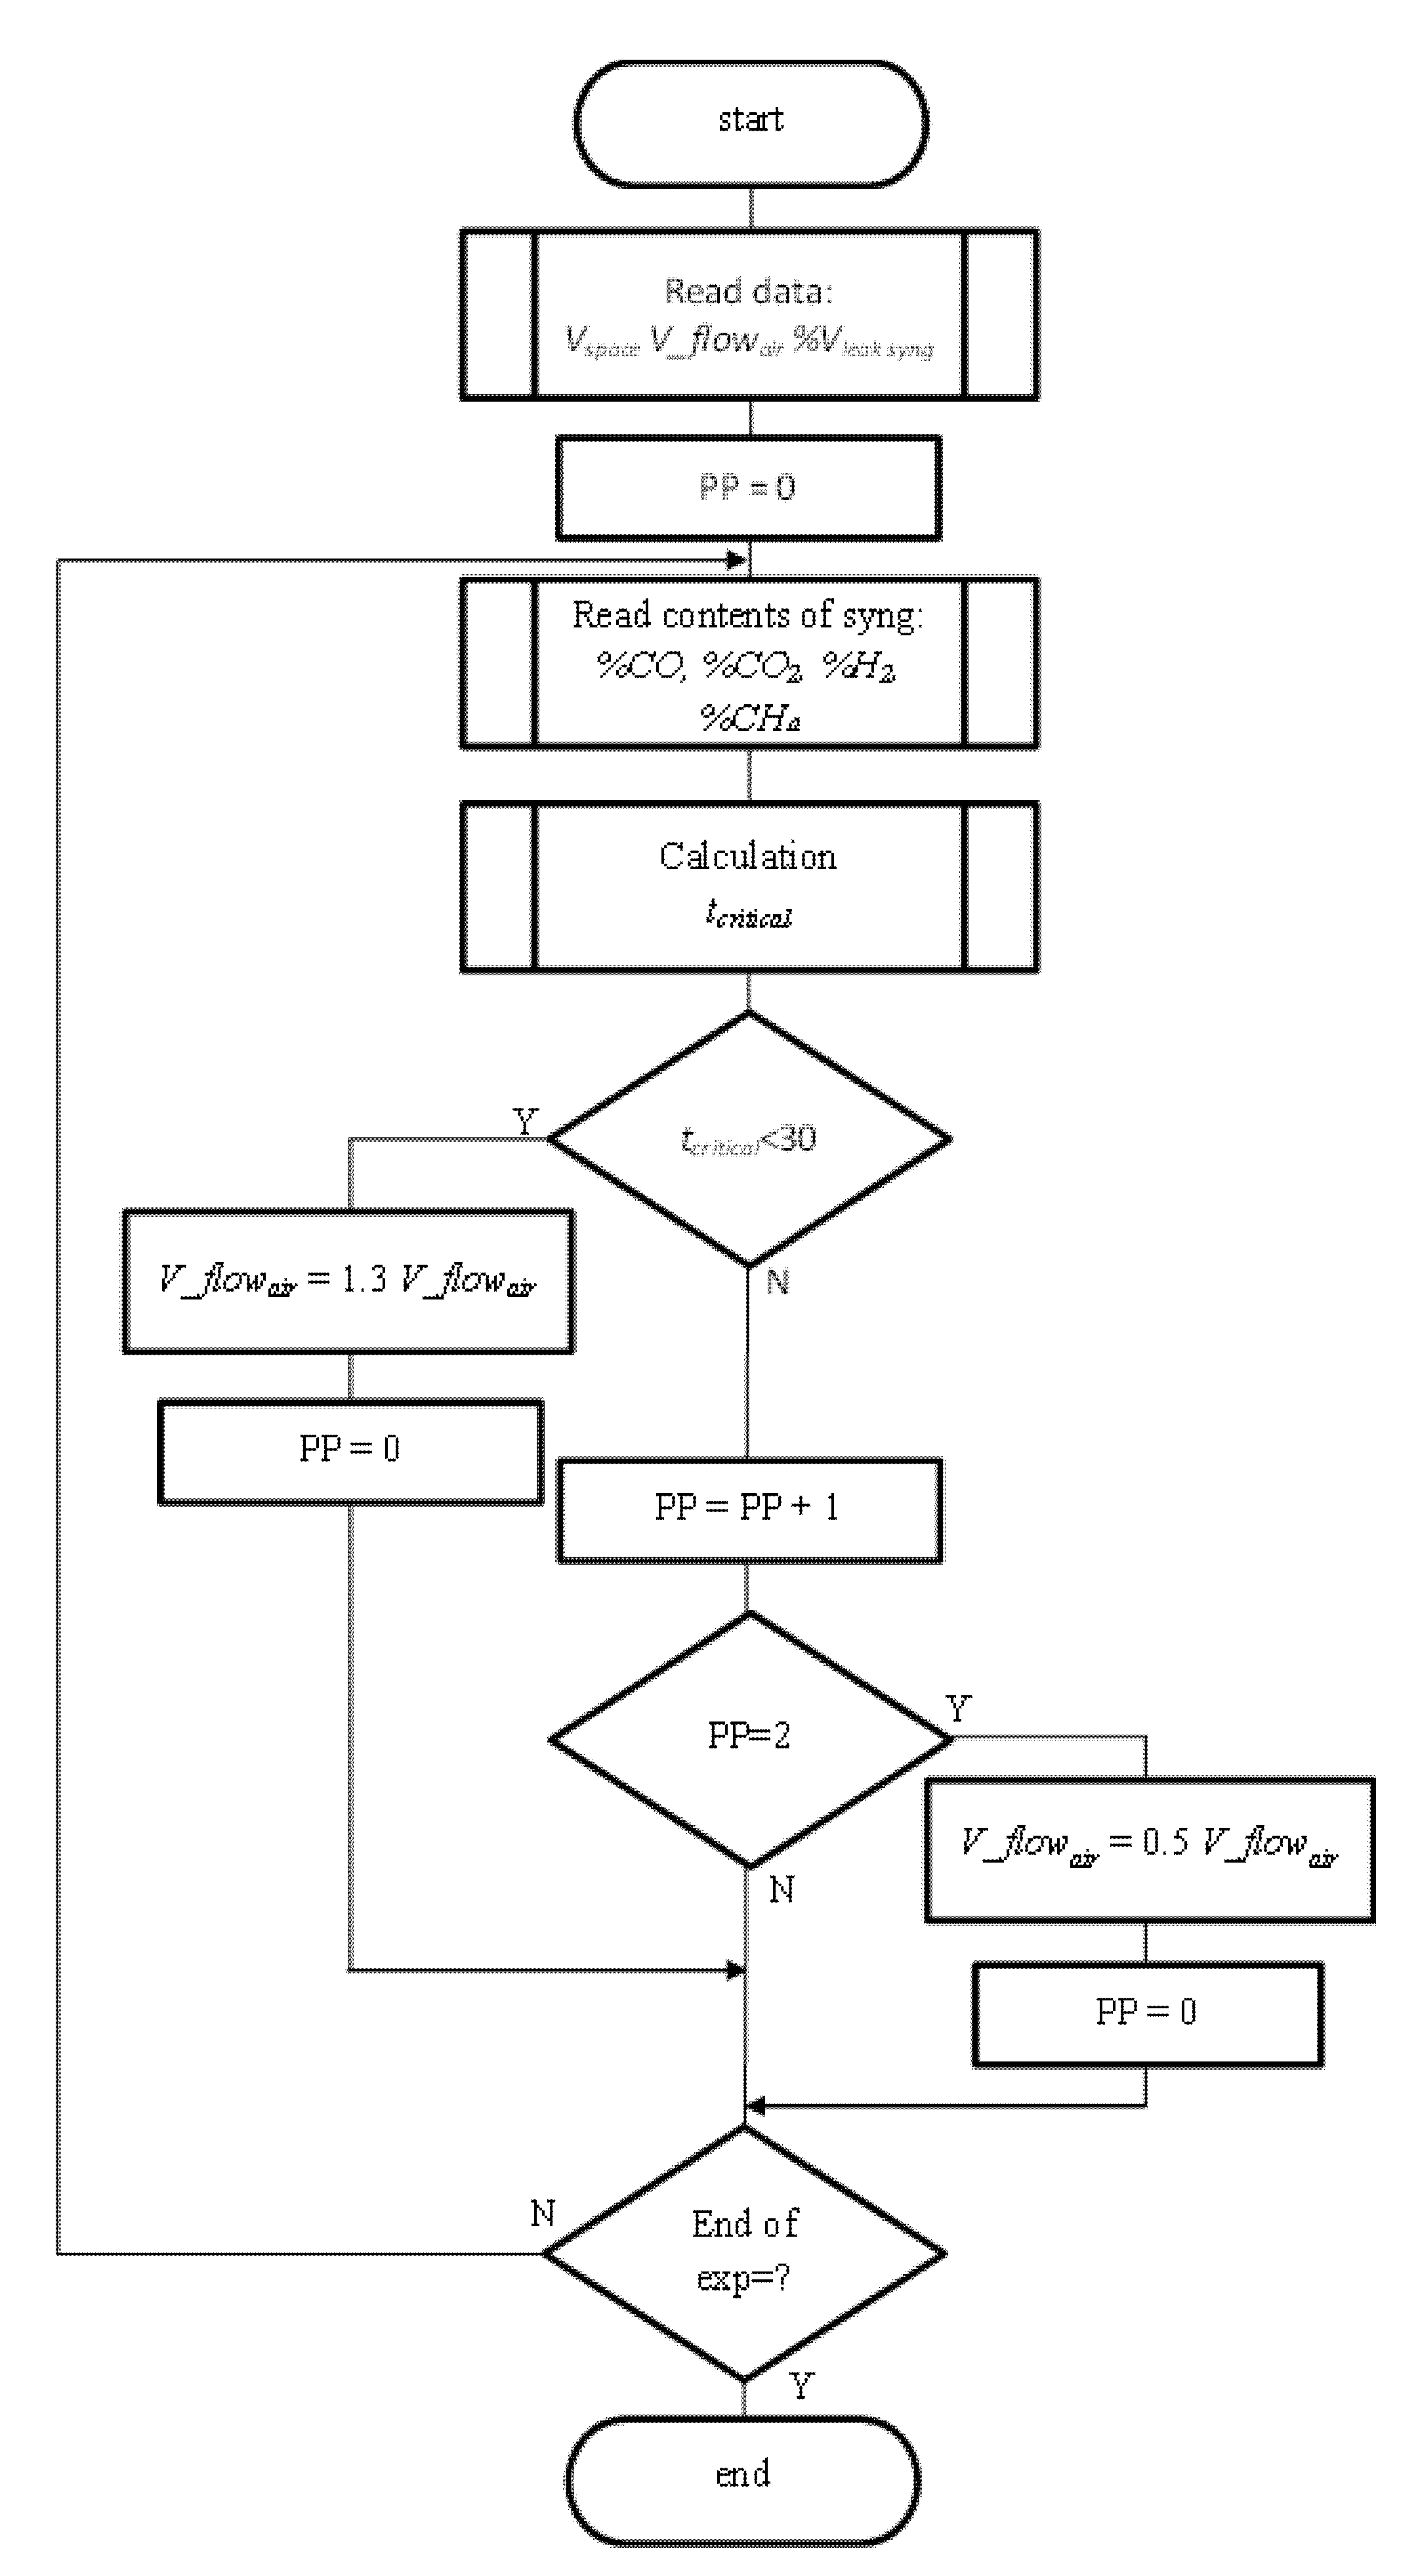
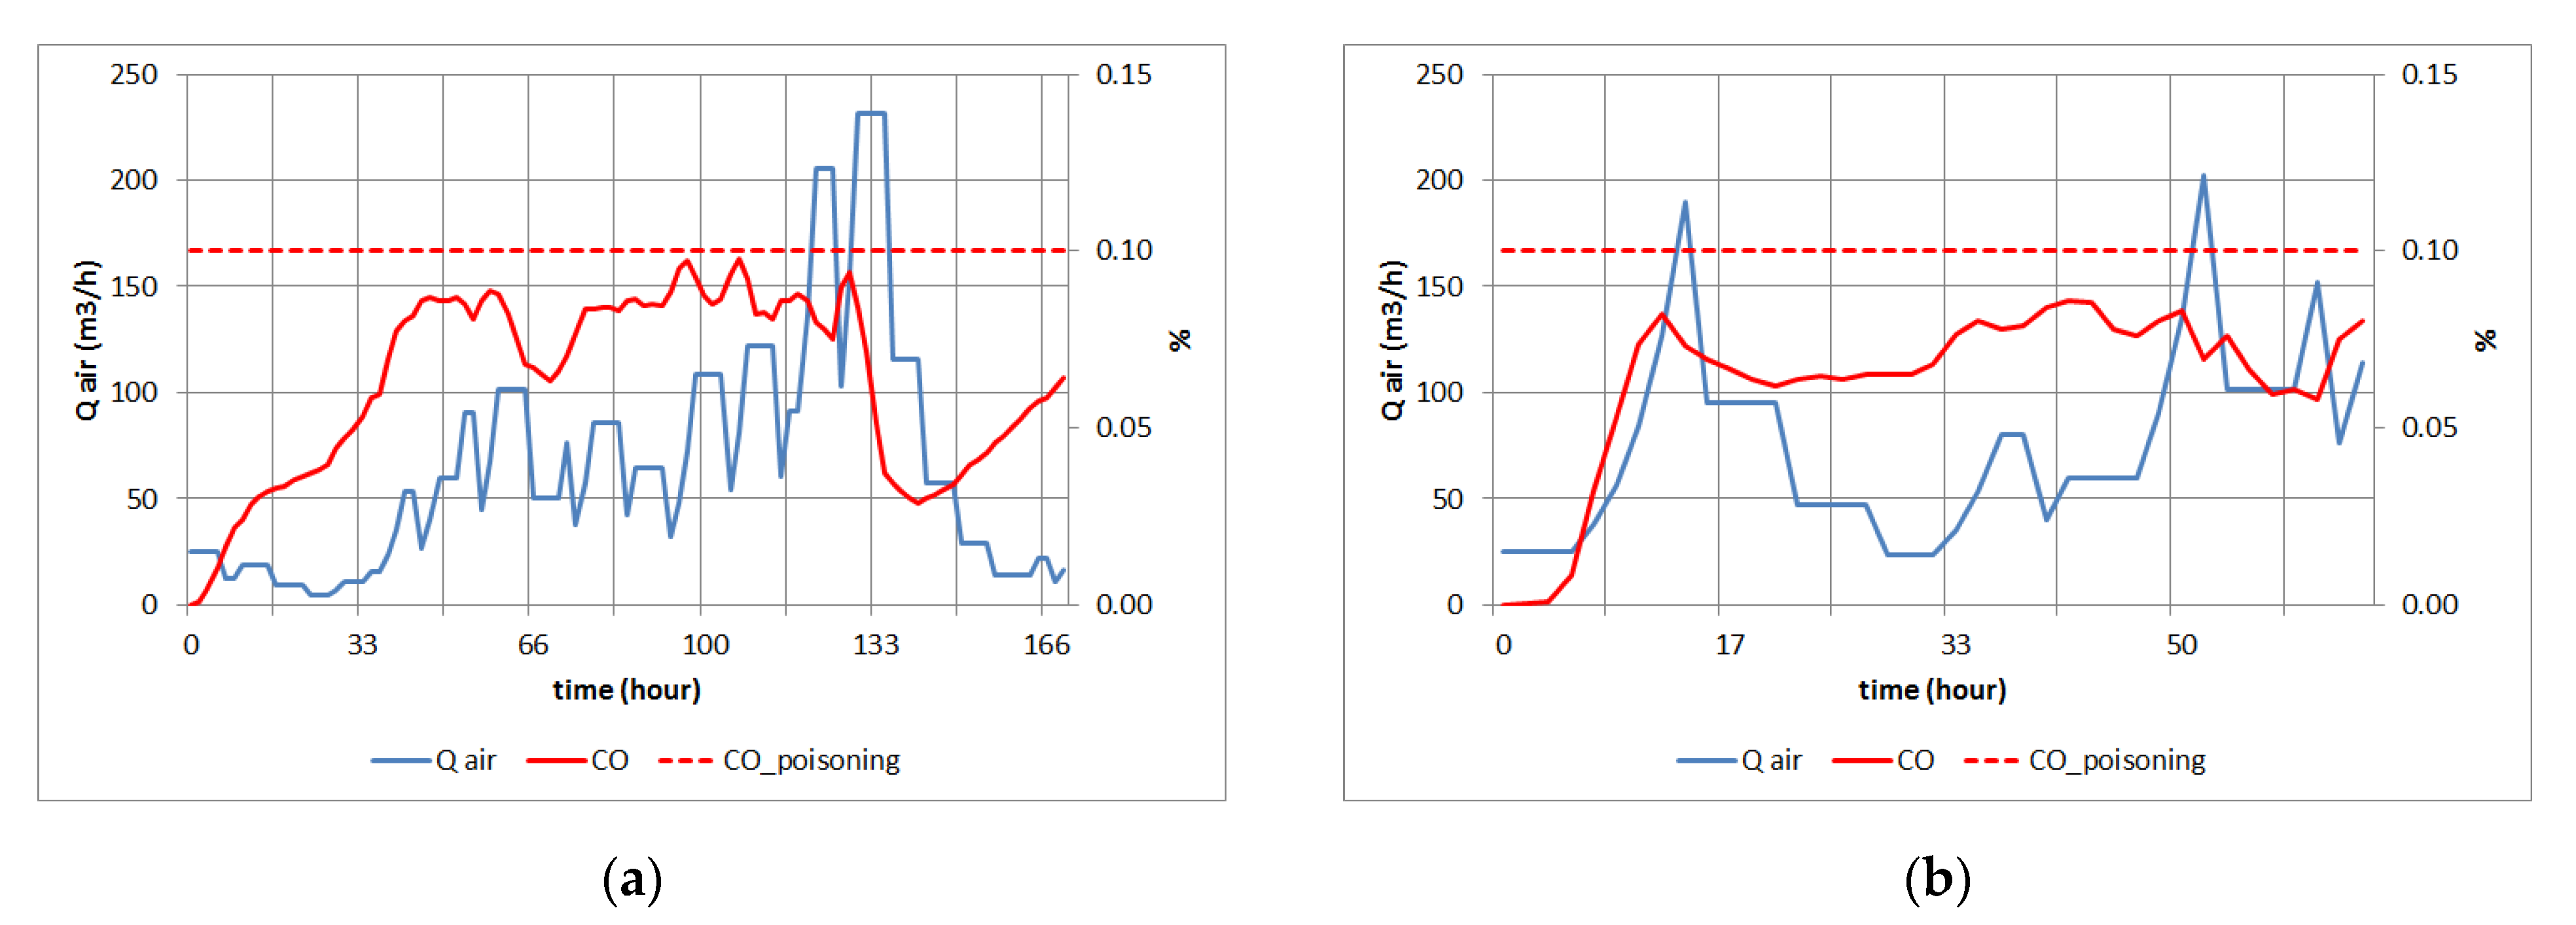
3.4.2. Dynamic Control of the Process as Prevention CO Poisoning in Vulnerability Zones
4. Conclusions
Author Contributions
Funding
Institutional Review Board Statement
Informed Consent Statement
Data Availability Statement
Acknowledgments
Conflicts of Interest
References
- Sajjad, M.; Rasul, M.G. Review on the Existing and Developing Underground Coal Gasification Techniques in Abandoned Coal Seam Gas Blocks: Australia and Global Context. In Proceedings of the 1st International E–Conference on Energies, Basel, Switzerland, 14–31 March 2014; pp. 1–16. Available online: http://sciforum.net/paper/view/2347 (accessed on 24 August 2021).
- Bhutto, A.W.; Bazmi, A.A.; Zahedi, G. Underground coal gasification: From fundamentals to applications. Prog. Energy Combust. Sci. 2013, 39, 189–214. [Google Scholar] [CrossRef]
- Couch, G. Underground Coal Gasification; IEA Clean Coal Centre: London, UK, 2009; Report No.: CCC/151; ISBN 978-92-9029-471-9. [Google Scholar]
- Kostúr, K.; Sasvari, T.; Koštial, I.; Laciak, M.; Durdán, M.; Kačur, J.; Kuffa, S.; Mikula, J.; Ďurove, J.; Vavrek, P.; et al. Underground Coal Gasification by Thermal Decomposition; Research Report of Project APVV-0582-06; TU FBERG: Košice, Slovakia, 2008. [Google Scholar]
- Prabu, V.; Jayanti, S. Underground coal-air gasification based solid oxide fuel cell system. Appl. Energy 2012, 94, 406–414. [Google Scholar] [CrossRef]
- Stanczyk, K.; Kapusta, K.; Wiatowski, M.; Swiadrowski, J.; Smolinski, A.; Rogut, J.; Kotyrba, A. Experimental simulation of hard coal underground gasification for hydrogen production. Fuel 2012, 91, 40–50. [Google Scholar] [CrossRef]
- Seifi, M.; Abedi, J.; Chen, Z. Application of porous medium approach to simulate UCG process. Fuel 2014, 116, 191–200. [Google Scholar] [CrossRef]
- Mohanty, D. An overview of the geological controls in underground coal gasification. In Proceedings of the Workshop on Challenges and Opportunities of Underground Coal Gasification in India (UCG), New Delhi, India, 13–14 February 2017; Volume 76. [Google Scholar] [CrossRef] [Green Version]
- Zeleňák, S.; Škvareková, E.; Seňová, A.; Wittenberger, G. The Usage of UCG Technology as Alternative to Reach Low-Carbon Energy. Energies 2021, 14, 3718. [Google Scholar] [CrossRef]
- Kotyrba, A.; Stanczyk, K. Sensing underground coal gasification by ground penetrating radar. Acta Geophys. 2017, 65, 1185–1196. [Google Scholar] [CrossRef] [Green Version]
- Longjun, D.; Wei, Z.; Xibing, L.; Weiwei, S.; Zewei, W. Collaborative localization method using analytical and iterative solutions for microseismic/acoustic emission sources in the rockmass structure for underground mining. Eng. Fract. Mech. 2019, 210, 95–112. [Google Scholar] [CrossRef]
- Longjun, D.; Qingchun, H.; Xiaojie, T.; Youfang, L. Velocity-Free MS/AE Source Location Method for Three-Dimensional Hole-Containing Structures. Engineering 2020, 6, 827–834. [Google Scholar] [CrossRef]
- Hesser, D.F.; Mostafavi, S.; Kocur, G.K.; Markert, B. Identification of acoustic emission sources for structural health monitoring applications based on convolutional neural networks and deep transfer learning. Neurocomputing 2021, 453, 1–12. [Google Scholar] [CrossRef]
- Su, F.Q.; Itakura, K.I.; Deguchi, G.; Ohga, K. Monitoring of coal fracturing in underground coal gasification by acoustic emission techniques. Appl. Energy 2017, 189, 142–156. [Google Scholar] [CrossRef] [Green Version]
- Sermet, E. Environmental limitations for underground coal gasification—The Lublin coal basin case study (EAST PART OF POLAND). In Proceedings of the 16th International Multidisciplinary Scientific Geoconference (SGEM 2016), Albena, Bulgaria, 30 June–6 July 2016; pp. 267–272. [Google Scholar]
- Yang, L.H.; Pang, X.L.; Liu, S.Q.; Chen, F. Temperature and Gas Pressure Features in the Temperature-control Blasting Underground Coal Gasification. Energy Sources PART A-Recovery Util. Environ. Eff. 2010, 32, 1737–1746. [Google Scholar] [CrossRef]
- Škvarekova, E.; Taušová, M.; Seňová, A.; Wittenberger, G.; Nováková, J. Statistical Evaluation of Quantities Measured in the Detection of Soil Air Pollution of the Environmental Burden. Appl. Sci. 2021, 11, 3294. [Google Scholar] [CrossRef]
- McInnis, J.; Singh, S.; Huq, I. Mitigation and adaptation strategies for global change via the implementation of underground coal gasification. Mitig. Adapt. Strateg. Glob. Chance 2016, 21, 479–486. [Google Scholar] [CrossRef]
- Hower, J.C.; Copley, G.C.; O’Keefe, J.M.K.; Hower, J.M. The further adventures of Tin Man: Vertical temperature gradients at the Lotts Creek coal mine fire, Perry County, Kentucky. Int. J. Coal Geol. 2012, 101, 16–20. [Google Scholar] [CrossRef]
- Tokarz, A.; Grabowski, J.; Nowak, D. Improvement of the UCG process safety in a georeactor surroundings under emergency conditions. In Proceedings of the 16th International Multidisciplinary Scientific Geoconference (SGEM 2016), Albena, Bulgaria, 30 June–6 July 2016; pp. 473–480. [Google Scholar]
- Prodan, M.; Ghicioi, E.; Laszlo, R.; Nalboc, I.; Suvar, S.; Nicola, A. Experimental and Numerical Study of Ignition and Flame Propagation for Methane–Air Mixtures in Small Vessels. Processes 2021, 9, 998. [Google Scholar] [CrossRef]
- Molayemat, H.; Torab, F.M. Evaluation of coalbed methane potential in Parvadeh IV coal deposit in central Iran using a combination of MARS modeling and Kriging. J. Min. Environ. 2017, 8, 305–320. [Google Scholar] [CrossRef]
- Krause, E.; Krzemien, A.; Smolinski, A. Analysis and assessment of a critical event during an underground coal gasification experiment. J. Loss Prev. Process. Ind. 2015, 33, 173–182. [Google Scholar] [CrossRef]
- Yang, L.H.; Zhang, X.; Liu, S.Q. The Temperature Features of the Thermal-explosion Oxygen-steam Underground Coal Gasification in Approximately Horizontal Coal Seams. Energy Sources PART A-Recovery Util. Environ. Eff. 2011, 33, 1483–1492. [Google Scholar] [CrossRef]
- Yang, L.H.; Liu, S.Q. Temperature-control Blasting Underground Coal Gasification in the Inclined Coal Seams with a Short Wall. Energy Sources PART A-Recovery Util. Environ. Eff. 2010, 32, 532–541. [Google Scholar] [CrossRef]
- Obileke, K.; Mamphweli, S.; Meyer, E.L.; Makaka, G.; Nwokolo, N. Development of a Mathematical Model and Validation for Methane Production Using Cow Dung as Substrate in the Underground Biogas Digester. Processes 2021, 9, 643. [Google Scholar] [CrossRef]
- Laouafa, F.; Farret, R.; Vidal-Gilbert, S.; Kazmierczak, J.-B. Overview and modeling of mechanical and thermomechanical impact of underground coal gasification exploitation. Mitig. Adapt. Strat. Glob. Chang. 2016, 21, 547–576. [Google Scholar] [CrossRef]
- Soukup, K.; Hejtmánek, V.; Čapek, P.; Stanczyk, K.; Šolcová, O. Modeling of contaminant migration through porous media after underground coal gasification in shallow coal seam. Fuel Process. Technol. 2015, 140, 188–197. [Google Scholar] [CrossRef]
- Wrona, P.; Rozanski, Z.; Pach, G.; Domagala, L. The application of a jet fan for the control of air and methane streams mixing at the excavations cross—The results of numerical simulation. Manag. Syst. Prod. Eng. 2016, 23, 156–162. [Google Scholar] [CrossRef]
- Škvareková, E.; Tomášková, M.; Wittenberger, G.; Zeleňák, S. Analysis of risk factors for underground coal gasification. Manag. Syst. Prod. Eng. 2019, 27, 227–235. [Google Scholar] [CrossRef] [Green Version]
- Howaniec, N.; Kuna-Gwoździewicz, P.; Smoliński, A. Assessment of Emission of Selected Gaseous Components from Coal Processing Waste Storage Site. Sustainability 2018, 10, 744. [Google Scholar] [CrossRef] [Green Version]
- Perkins, G. Mathematical modelling of in situ combustion and gasification. Proc. Inst. Mech. Eng. Part A J. Power Energy 2018, 232, 56–73. [Google Scholar] [CrossRef]
- Ekrieligoda, T.C.; Marshall, A.M. A coupled thermal-mechanical numerical model of underground coal gasification (UCG) including spontaneous coal combustion and its effects. Int. J. Coal Geol. 2018, 199, 31–38. [Google Scholar] [CrossRef]
- Shabbar, S.; Janajreh, I. Thermodynamic equilibrium analysis of coal gasification using Gibbs energy minimization method. Energy Convers. Manag. 2013, 65, 755–763. [Google Scholar] [CrossRef]
- Otto, C.; Kempka, T. Synthesis Gas Composition Prediction for Underground Coal Gasification Using a Thermochemical Equilibrium Modeling Approach. Energies 2020, 13, 1171. [Google Scholar] [CrossRef] [Green Version]
- Bleecker, M.L. Chapter 12—Carbon monoxide intoxication. Handb. Clin. Neurol. 2015, 131, 191–203. [Google Scholar] [CrossRef]
- Harris, M.L.; Mainiero, R.J. Monitoring and removal of CO in blasting operations. Saf. Sci. 2008, 46, 1393–1405. [Google Scholar] [CrossRef]
- Durdán, M.; Terpák, J.; Kačur, J.; Laciak, M.; Flegner, P. Modeling of material balance from the experimental UCG. Acta Polytech. 2020, 60, 391–399. Available online: https://ojs.cvut.cz/ojs/index.php/ap/article/view/5987 (accessed on 24 August 2021). [CrossRef]
- Balu, K.; Satyamurthi, N.; Ramalingam, S.; Deebika, B. Problems on Material and Energy Balance Calculation; I K International Publishing House: New Delhi, India, 2009. [Google Scholar]
- Ghasem, N.; Henda, R. Principles of Chemical Engineering Processes: Material and Energy Balances, 2nd ed.; CRC Press: Boca Raton, FL, USA, 2014. [Google Scholar]
- Krajňák, J.; Homišin, J.; Grega, R.; Kaššay, P.; Urbanský, M. The failures of flexible couplings due to self-heating by torsional vibrations—validation on the heat generation in pneumatic flexible tuner of torsional vibrations. Eng. Fail. Anal. 2021, 119, 1–13. [Google Scholar] [CrossRef]
- Kostúr, K.; Laciak, M.; Durdán, M. Some influences of underground coal gasification on the environment. Sustainability 2018, 10, 1512. [Google Scholar] [CrossRef] [Green Version]
- Janásek, D.; Potoček, T.; Svetlík, J. Dangerous Substances, 1st ed.; University of Zilina: Zilina, Slovakia, 2004. [Google Scholar]
- Nassimi, A.M.; Jafari, M.; Farrokhpour, H.; Keshavarz, M.H. Constants of explosive limits. Chem. Eng. Sci. 2017, 173, 384–389. [Google Scholar] [CrossRef] [Green Version]
- Struttmann, T.; Scheerer, A.; Prince, T.S.; Goldstein, L.A. Unintentional carbon monoxide poisoning from an unlikely source. J. Am. Board Fam. Pract. 1998, 11, 481–484. [Google Scholar] [CrossRef] [PubMed] [Green Version]
- Goldstein, M. Carbon monoxide poisoning. J. Emerg. Nurs. 2008, 34, 538–542. [Google Scholar] [CrossRef] [PubMed] [Green Version]


| Moisture (%) | Ash (%) | C (%) | H (%) | N (%) | O (%) | S (%) | |
|---|---|---|---|---|---|---|---|
| input coal | 20.4 | 24.1 | 35.9 | 3.1 | 0.6 | 15 | 0.9 |
| unburned coal | 0 | 30.4 | 45.1 | 3.9 | 0.7 | 18.8 | 1.1 |
| Entering Material (kg) | Leaving Material (kg) | Losses/Syngas Leak | |||||||
|---|---|---|---|---|---|---|---|---|---|
| exp. | Gcoal | Gair | Goxygen | Gunburncoal | Gash | Ggas | Gcondensate | Glosses (kg) | Glosses (%) |
| 1 | 521 | 1504 | 21 | 167 | 75 | 1403 | 85 | 316 | 15.4 |
| 2 | 532 | 903 | 130 | 32 | 119 | 1238 | 53 | 123 | 7.9 |
| 3 | 214 | 1179 | 129 | 0 | 52 | 1285 | 11 | 174 | 11.4 |
| 4 | 472 | 1946 | 130 | 66 | 94 | 2001 | 11 | 376 | 14.8 |
| Model 1 (6) | Model 2 (7) | Model 3 (8) | |
|---|---|---|---|
| Multiple R | 0.898 | 0.915 | 0.918 |
| R Square | 0.807 | 0.836 | 0.843 |
| Adjusted R Square | 0.751 | 0.755 | 0.717 |
| Standard Error | 6.969 | 5.706 | 6.127 |
| a0 | 80.910 | 61.847 | 59.006 |
| a1 | −0.492 | 0.006 | 0.007 |
| a2 | −3.656 | −0.310 | −0.177 |
| a3 | − | −2.955 | −3.165 |
| a4 | − | − | 1.890 |
(m3) | (m3/h) | (%) | tcritical (hour) | |
|---|---|---|---|---|
| 1000 | 25 | 15 | 0.60 | 15.24 |
| 900 | 22 | 10 | 0.45 | 30.62 |
| 800 | 20 | 8 | 0.40 | 36.50 |
| 700 | 15 | 20 | 1.33 | 0.47 |
| 600 | 10 | 15 | 1.50 | 16.80 |
| 1100 | 28 | 15 | 0.54 | 15.29 |
| 1200 | 30 | 15 | 0.50 | 15.57 |
| 1300 | 14 | 17 | 1.21 | 14.13 |
| 1400 | 20 | 14 | 0.70 | 22.29 |
| 500 | 5 | 20 | 4.00 | 5.88 |
Publisher’s Note: MDPI stays neutral with regard to jurisdictional claims in published maps and institutional affiliations. |
© 2021 by the authors. Licensee MDPI, Basel, Switzerland. This article is an open access article distributed under the terms and conditions of the Creative Commons Attribution (CC BY) license (https://creativecommons.org/licenses/by/4.0/).
Share and Cite
Laciak, M.; Durdán, M.; Kačur, J.; Flegner, P.; Benková, M. The Prediction of Possibilities of CO Poisoning and Explosion during Syngas Leakage in the UCG Process. Processes 2021, 9, 1912. https://doi.org/10.3390/pr9111912
Laciak M, Durdán M, Kačur J, Flegner P, Benková M. The Prediction of Possibilities of CO Poisoning and Explosion during Syngas Leakage in the UCG Process. Processes. 2021; 9(11):1912. https://doi.org/10.3390/pr9111912
Chicago/Turabian StyleLaciak, Marek, Milan Durdán, Ján Kačur, Patrik Flegner, and Marta Benková. 2021. "The Prediction of Possibilities of CO Poisoning and Explosion during Syngas Leakage in the UCG Process" Processes 9, no. 11: 1912. https://doi.org/10.3390/pr9111912