Abstract
The application of Computational Fluid Dynamics (CFD) to energy-related problems has increased in the last decades in both renewable and conventional energy conversion processes. In recent years, the application of CFD in the study of hydraulic, marine, tidal, and hydrokinetic turbines has focused on the understanding of the details of the complex turbulent flow and also in improving the prediction of the performance of these devices. There are several complexities involved in the simulation of Vertical Axis Turbine (VAT) for hydrokinetic applications. One of them is the necessity of a dynamic mesh model. Typically, the model used in the simulation of these devices is the sliding mesh technique, but in recent years the fast development of the overset (also known as chimera) mesh technique has caught the attention of the academic community. In the present paper, a comparison between these two techniques is done in order to establish their advantages and disadvantages in the two-dimensional simulation of vertical axis turbines. The comparison was done not only for the prediction of performance parameters of the turbine but also for the capabilities of the models to capture complex flow phenomena in these devices and computational costs.
1. Introduction
Due to the global concern related to climate change, some worldwide challenges and international warnings revolve around the usage of fossil fuels. The reduction in the consumption of fossil fuels and the increment in the use of renewable energies is a primary objective to mitigate this global concern. The present work focused on the use of small-scale Vertical Axis Turbine (VAT) to convert the kinetic energy available in river streams (hydrokinetic energy) into mechanical work. In recent years, extensive research work has been done to understand the dynamics of the flow around VATs and also in the improvement of the efficiency of these devices [1,2,3,4]. Typically, the study of these devices can be done with three different techniques: experimental, analytical, and computational. Regarding experimental techniques, the most common are performed in scale prototypes either in water tunnels/channels [5,6,7] or towing tanks [8,9,10]. These experimental techniques require large-scale facilities and precise measurement systems, which, in general, are expensive. Analytic and semi-empirical techniques such as the Streamtube model [11,12], free wake vortex models [13,14,15], and cylinder and line actuator models [16,17,18], among others, are considered simple to implement but highly dependent on experimental data. The most common computational technique used in the simulation of Vertical Axis Turbines (VAT) is Computational Fluid Dynamics (CFD) in which the governing equations of the dynamics of flow are solved in a computational domain that needs to be discretized in elements (Control volumes).
In the literature, a great deal of work can be found related to the simulation of vertical axis turbines for wind, marine, and hydrokinetic applications; but, in few of them the details of the correct configuration of the numerical methods and models that are typically used in this kind of simulations are addressed. Some of the details and parameters that influence the numerical results and that are typically studied are related to the correct use of two- or three-dimensional models, the space and time discretization, and turbulence modelling. Balduzzi et al. studied the influence of several different parameters in two-dimensional models of VAT such as the Turbulence model, computational domain dimensions, and number of revolutions required for convergence of the torque coefficient. It was found that the most suitable Unsteady Reynolds Navier–Stokes (URANS) turbulence model for this application is the k-ω SST. For the computational domain size, it is recommended that it should be significantly extended in order to reduce the influence of the boundary conditions, and for the rotating domain (when using sliding mesh technique) it is always less than twice the turbine diameter in order to reduce computational costs [19]. Rezaiha et al. found that the size of the rotating domain is negligible and a difference of less than 1% was observed for 2D simulations of Vertical Axis Wind Turbines (VAWT) using diameter of the rotating domain between 1.25D and 2D where D is the diameter of the turbine [20]. A convergence criterion for the torque coefficient was proposed so that in two consecutive revolutions the difference in this parameter should be lower than 0.1%, which is typically achieved after eight revolutions when using the sliding mesh techniques [19]. Maitre et al. studied the influence of the near wall refinement as the precision of the prediction of the global performance of the turbine. It was found that too-coarse grids tend to overestimate the stall condition of the blades and, in general, to underestimate the power coefficient. Maitre et al. also studied the accuracy of two-dimensional CFD simulations in the prediction of the power coefficient of VAT and it was observed that the computational results were always higher than the experimental measurements except for small tip speed ratios (λ). This overprediction of two-dimensional models is important for small-scale VAT in which the losses due to the blade tips and arm-blade junctions are not included [21].
One of the most challenging aspects of using CFD in the simulation of a vertical axis turbine is related with the dynamic mesh required due to the motion of the blades of the turbine. Remeshing methods are practically prohibited for this application due to the large motion of the blades, which represents a very high computational cost. Dynamic mesh techniques that do not involve remeshing, such as sliding and overset (also known as chimera) mesh, are suitable for this application. In both techniques, two or more computational domains that are meshed independently can be merged in order to generate the relative motion between them. In the sliding mesh technique, the meshes do not overlap but they are connected through a boundary that is called interface. At every time step, the meshes slide relative to each other along the interface, typically with a prescribed motion (for VATs rotation is involved). The governing equations are solved at every time step in both domains but information between meshes must be interchanged along the interface, which requires the estimation of the fluxes across interfaces, which, in general, are non-conformal [22]. The overset mesh technique consists of creating independent meshes and allows overlapping between them. Typically, one or more near body meshes and at least one background mesh are required to apply this technique. The governing equations are solved on both meshes and on the overlapping region (also known as overset boundary). The solution is interpolated and shared between the meshes in order to impose the correct boundary conditions [23]. The main advantages of this method are that the meshes can be generated independently, reducing the complexity of mesh generation and the total number of elements. One restriction is that the size of the elements of each mesh on the overlapping boundaries must be similar. To summarize, even though in both techniques the meshes are generated independently, they must be merged before running the simulation. The main differences between OM and SM are: (1) The meshes overlap in OM but do not overlap in SM; (2) a clear and fixed interface is generated between the two meshes in SM and interchange of information is performed every time step; and (3) in OM, an overlapping region is generated every time step and the solution of both meshes is interpolated in this region.
Most of the CFD studies of VAT (both for wind and hydrokinetic applications) reported in the literature were performed using sliding mesh (e.g., [24,25]) and in recent years the application of the overset method for VAT has increased. Kozak studied the unsteady effects of vertical axis wind turbines with overset meshes, proposing some recommendations to correctly configure the overset overlapping [26]. Mclean studied the performance improvement of vertical axis wind turbine with active blade pitch control using CFD and polygonal overset meshes. It was concluded that a fully coupled solver has a better performance when using the overset mesh technique [27]. Lei et al. used the overset mesh method to study an offshore vertical axis wind turbine in pitch and surge motion. Only one rotating overset domain and one background mesh were used. A convergence analysis was done, in which six different meshes were generated and the number of elements in both domains were changed simultaneously. The overset mesh method showed a good ability to capture the complex flow dynamic when both pitch and surge motions were included [28]. Regarding the simulation of VAT for hydrokinetic applications, Kinsey and Dumas studied the effect of the wake blockage in the performance of crossflow turbines (three blades with high solidity). Three meshes were used for each blade and one mesh was used as background; all the meshes used were generated with polyhedral elements. A convergence study using three different numbers of total elements was performed, but no detail of the number of elements in each mesh was given. Numerical results show very good agreement with experimental data and the application of overset mesh was significant since only the background mesh was changed in order to study different blockage ratios [29]. Gorle et al. studied flow control based in circulation control of a vertical axis hydrokinetic turbine in order to improve its performance. A two-dimensional CFD simulation was performed, in which the overset technique was used in order to model not only the rotation of the blades but also the pitching motion. Numerical results showed very interesting findings about the controlled flow and the versatility of overset mesh in the study of flow control for VAT based on circulation control; nevertheless, no details of a convergence analysis and the number of meshes were provided [30].
In the present paper, a detailed comparison between the sliding mesh (SM) technique and overset mesh (OM) technique is shown and discussed. It is important to clarify that the objective of the present work was not focused on finding which is the best strategy, SM or OM, to reproduce a particular set of experimental data, but better to point out the differences, advantages, and disadvantages of each of them in the simulation of VATs. To achieve this objective, a vertical axis turbine design was simulated with both techniques and the results of the performance parameters were compared between them. Moreover, a comparison of pressure, velocity, and vorticity fields obtained by both techniques was performed; this allowed obtaining a better idea of the capabilities of the models to capture complex flow phenomena. Finally, a mesh convergence analysis was done for both techniques so that the number of elements was similar when using either technique.
2. Configuration of Study
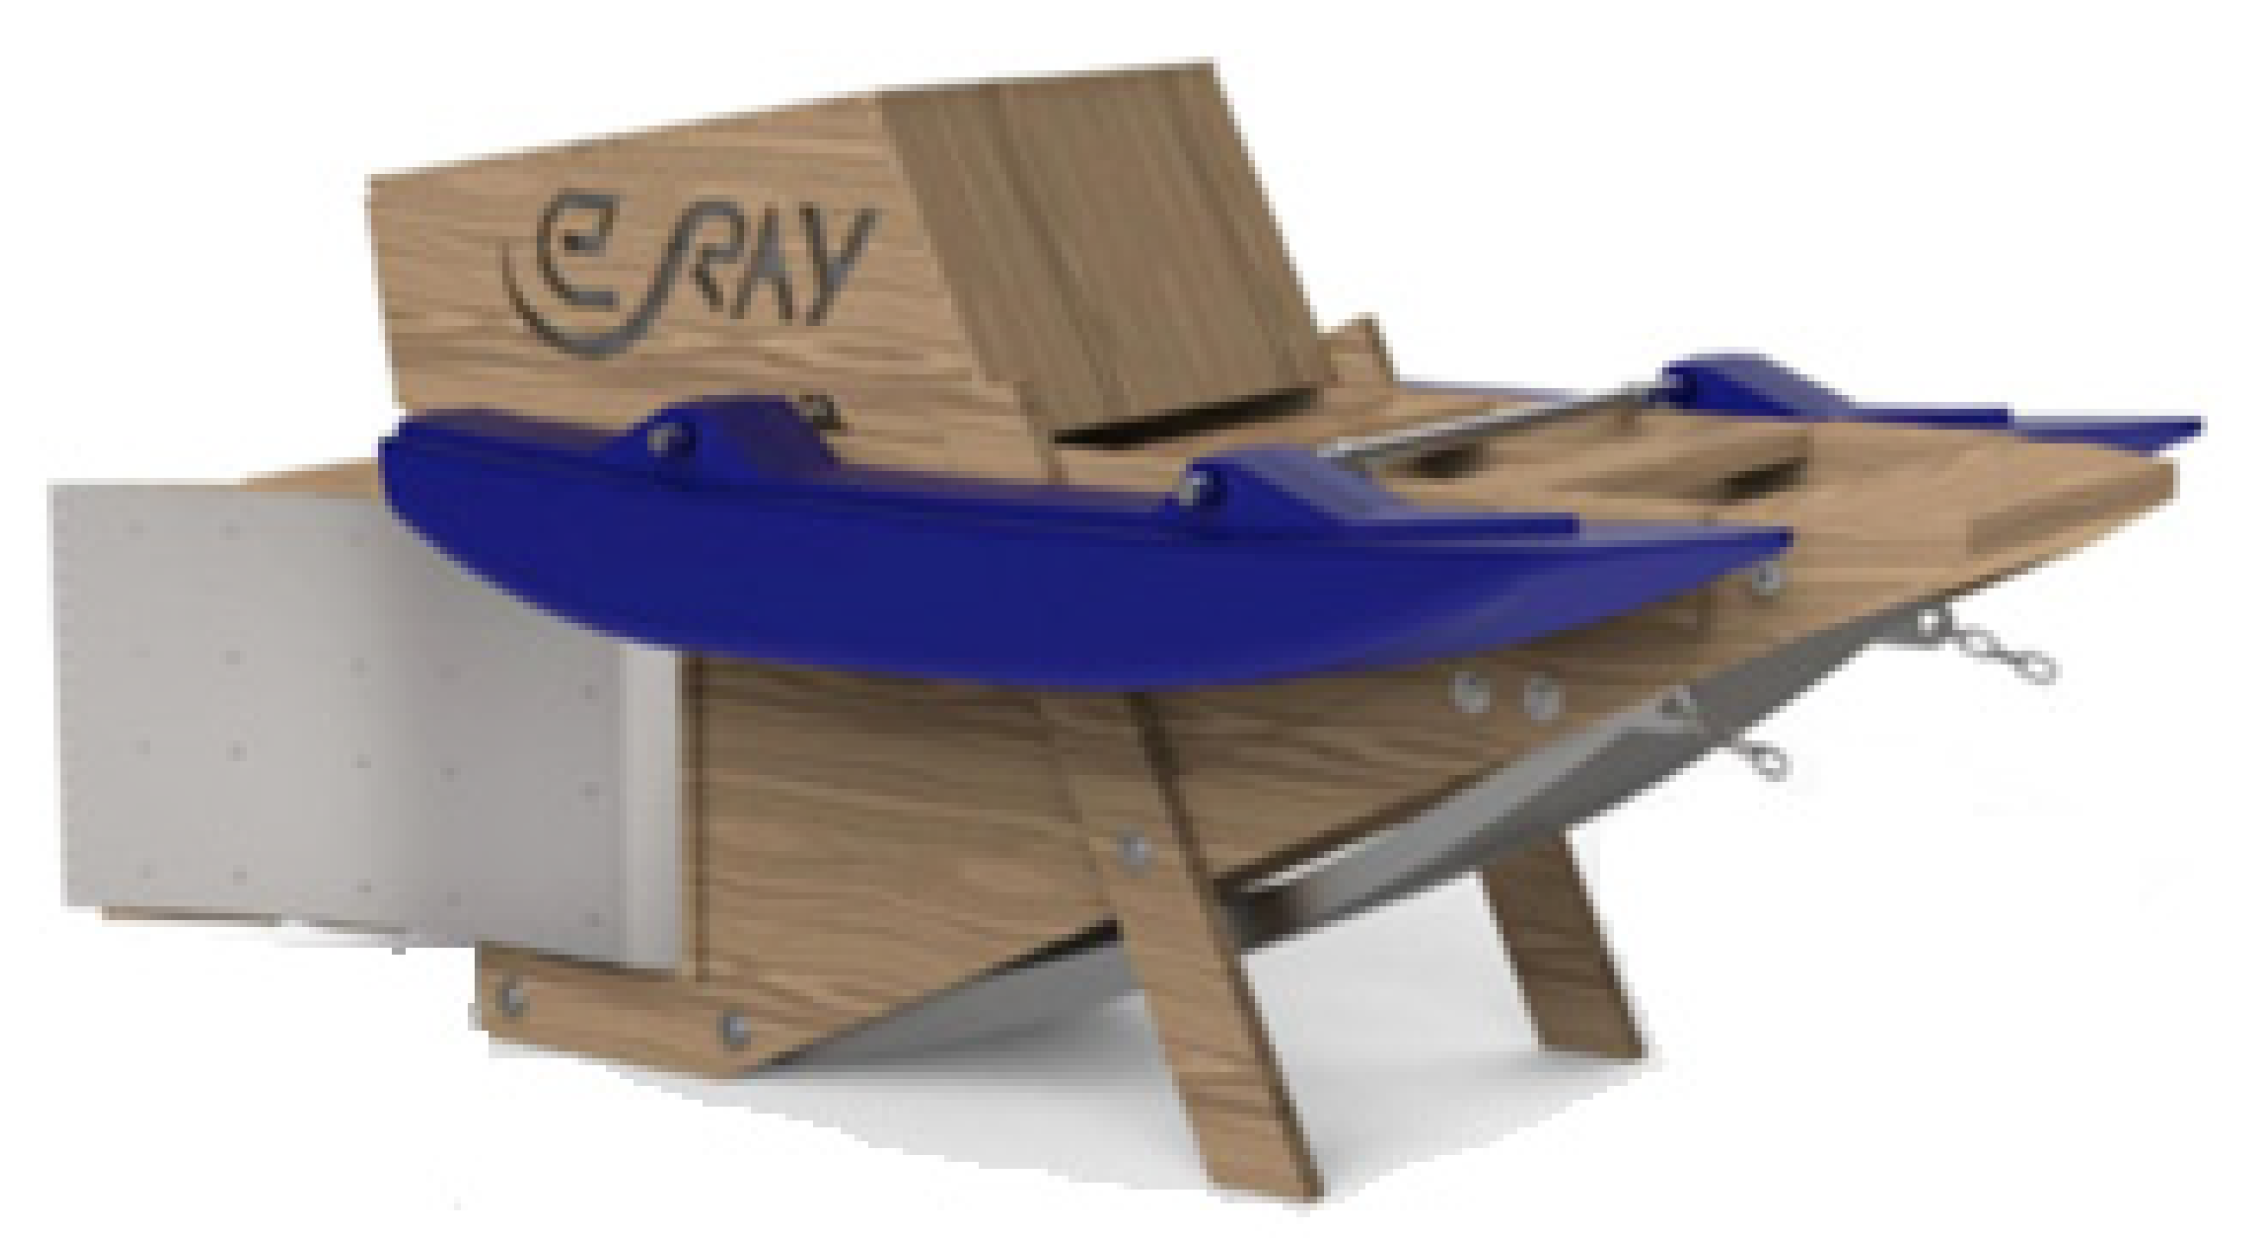
The study case was based on a vertical axis hydrokinetic turbine that was designed by e.Ray Europa Gmbh [31]. This turbine was designed with the purpose of being used in rivers of low to medium stream current velocities. The objective was that the turbine generates electricity (approximately 1 kW at 2.2 m/s) for a floating station that measures several river parameters (level, velocity, temperature, etc.) for management and monitoring. The turbine design expects a peak performance at a Tip Speed Ratio (TSR) of 2. Figure 1 shows the floating station and Table 1 lists the geometric characteristics of the turbine.
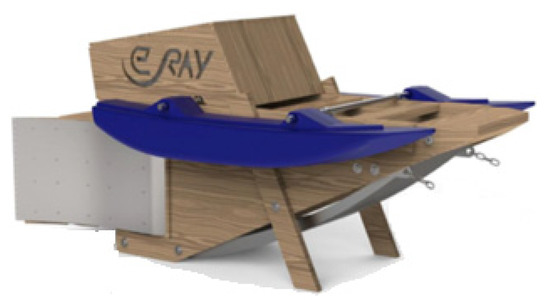
Figure 1.
Floating station.

Table 1.
Aerodynamic profile and turbine’s dimensions.
The performance of a vertical axis turbine is characterized by three nondimensional parameters: Tip Speed Ratio (TSR), moment coefficient (CM), and power coefficient (CP). TSR is the ratio between the tangential velocity of the turbine to the free stream velocity of the flow, and it is given by Equation (1), where ω is the angular speed of the turbine, R is the radius of the turbine, and U∞ is the velocity of the free stream.
The moment coefficient is the nondimensional form of the torque generated by the turbine when it operates at a given TSR. The torque is nondimensionalized with respect to the maximum torque that the turbine could generate with the available kinetic energy (see Equation (2)),
where T is the torque generated by the turbine, is the density of the fluid, and A is the frontal area of the turbine (i.e., Span × diameter). Finally, the power coefficient is the nondimensional form of the mechanical power generated by the turbine at a given TSR (see Equation (3)).
For Vertical Axis Wind Turbines, CM and CP are only function of TSR since the Reynolds number (based on the free stream velocity) of this application is high (O(106) or more); but for hydrokinetic applications, the Reynolds number is not higher than O(105), so that an effect of this parameter is observed on the performance curves [8,32].
3. Computational Setup
3.1. Computational Domain Size
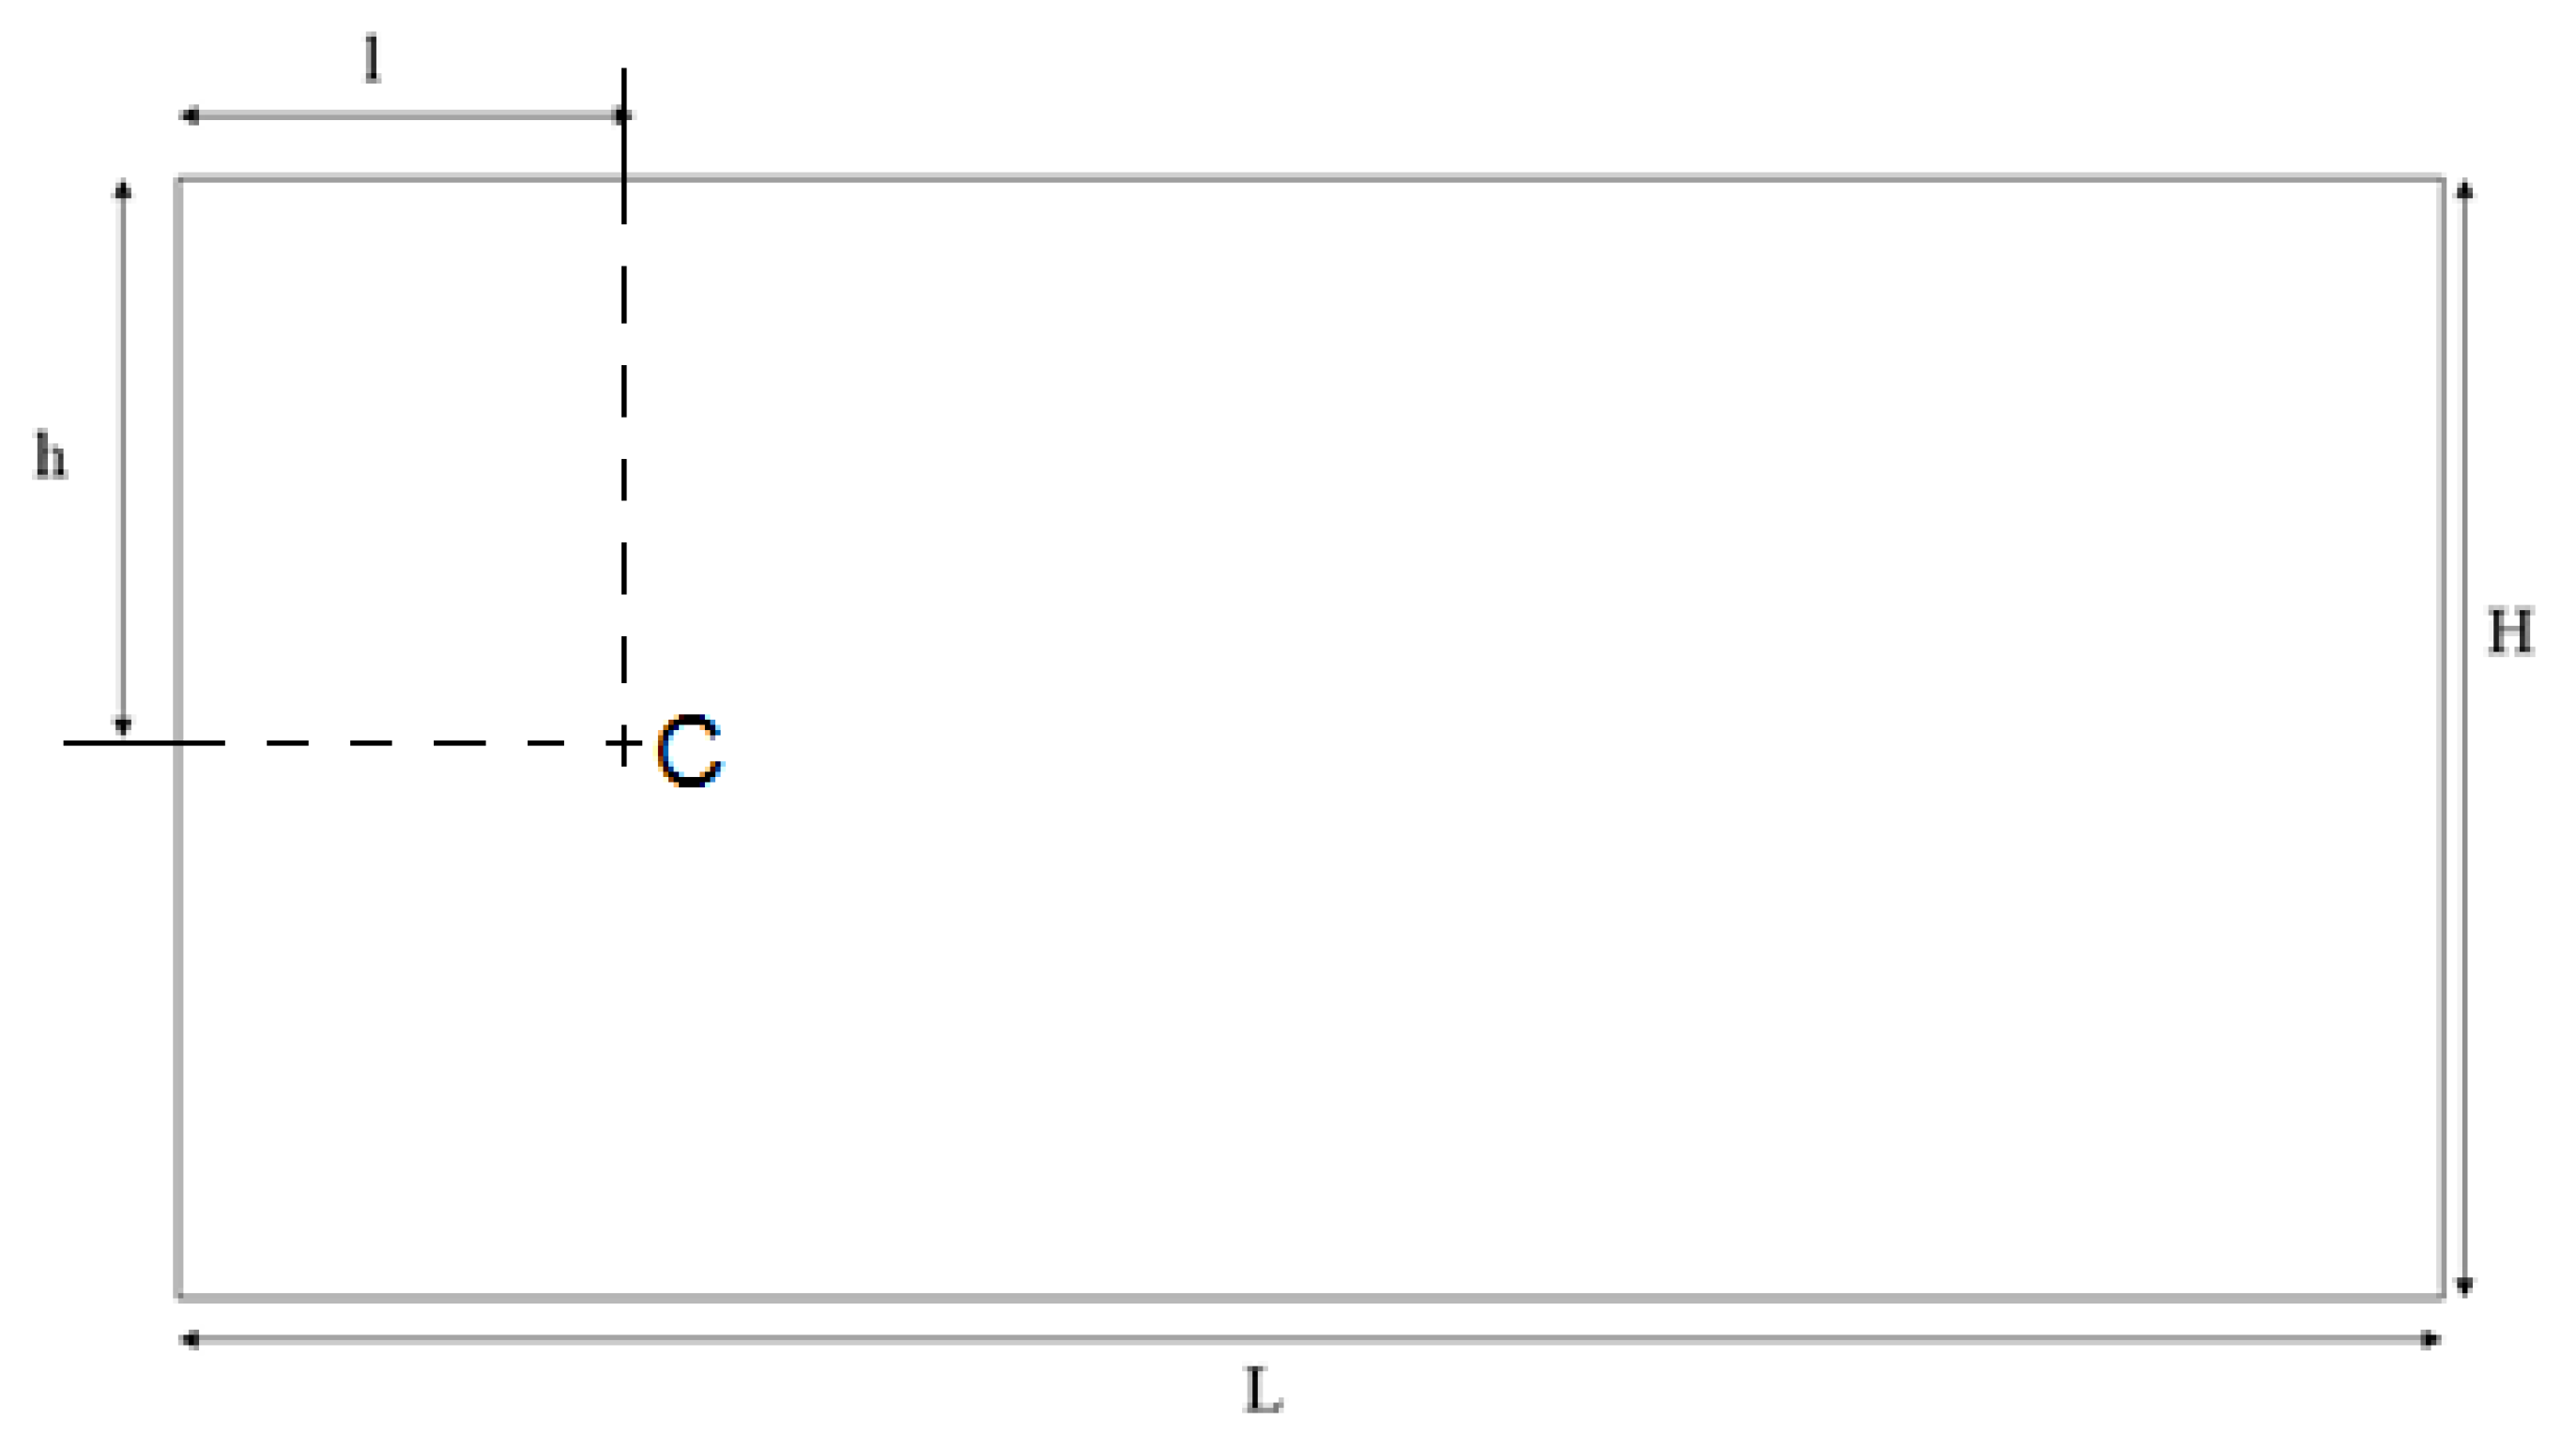
Figure 2 shows a schematic of the two-dimensional computational domain used in the present study. The height (H) is 15 times the diameter of the turbine (D), while the length of the computational domain (L) is 20D. These dimensions satisfy the criteria mentioned in the literature. The letter C indicates the position of the axis of the turbine, which is located closer to the left boundary of the computational domain, so that the distance l is 5D. while h is 7.5D. The size of the computational domain was the same for both meshing techniques, for comparison purposes.
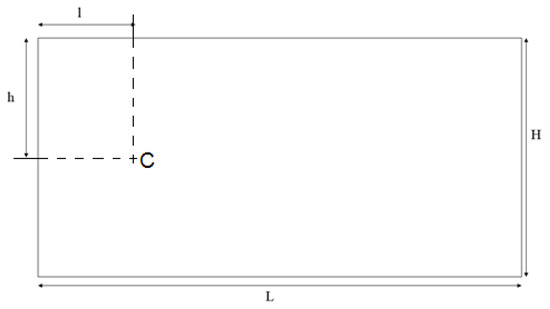
Figure 2.
Computational domain.
3.2. Mesh Generation
In order to correctly resolve the turbulent boundary layer over the surface of the blades, the size of the first element of the mesh in the normal direction of the blades surface should satisfy the restriction of y+ < 1 [19,21]. In the context of VAWT simulations, this criterion needs to be satisfied independently of the meshing technique that is used. The y+ is a dimensionless parameter for the distance to the wall, which is the characteristic length scale of turbulent wall-bounded flows (see Equation (4)).
Here ν is the kinematic viscosity, y is the distance to the wall, and uτ is the friction velocity that is defined as:
where τw is the shear stress at the wall and ρ is the density of the fluid. A priori, the shear stress is unknown so the process to determine the correct size of the first element close to the blade surface is by trial and error. As a first approximation, typically a flat plate model of the blade can be used to generate the coarser grid used in the convergence analysis process. Once the meshes are generated and the simulations are run, then the averaged and distribution of y+ values for the blade in one revolution should be checked.
Other parameters that are important in the generation of the mesh close to the surface of the blades (Boundary layer mesh) are the total height, the growth rate, and the total number of layers used. The total height should be enough in order to include the developed boundary layer at every time step; of course, at high angles of attack this is difficult to achieve. The growth rate follows the rules typically used in every Reynolds Averaged Navier–Stokes (RANS) simulation, in which values between 1.1 and 1.2 are acceptable. Based on the size of the first element, the growth rate, the total height, and the method (linear, geometric, exponential, hyperbolic, etc.) used in the boundary layer mesh generation, then the total number of layers can be specified. The first step to generate the boundary layer mesh is to create a database with the XY points that define the blade profile. Using these points, the upper and lower surfaces of the profile are generated and discretized using at least 200 segments for each surface. Finally, the structured mesh is generated by extrusion. For both techniques (SM and OM), the commercial software Pointwise V18 was used in the present study.
3.2.1. Sliding Mesh (SM)
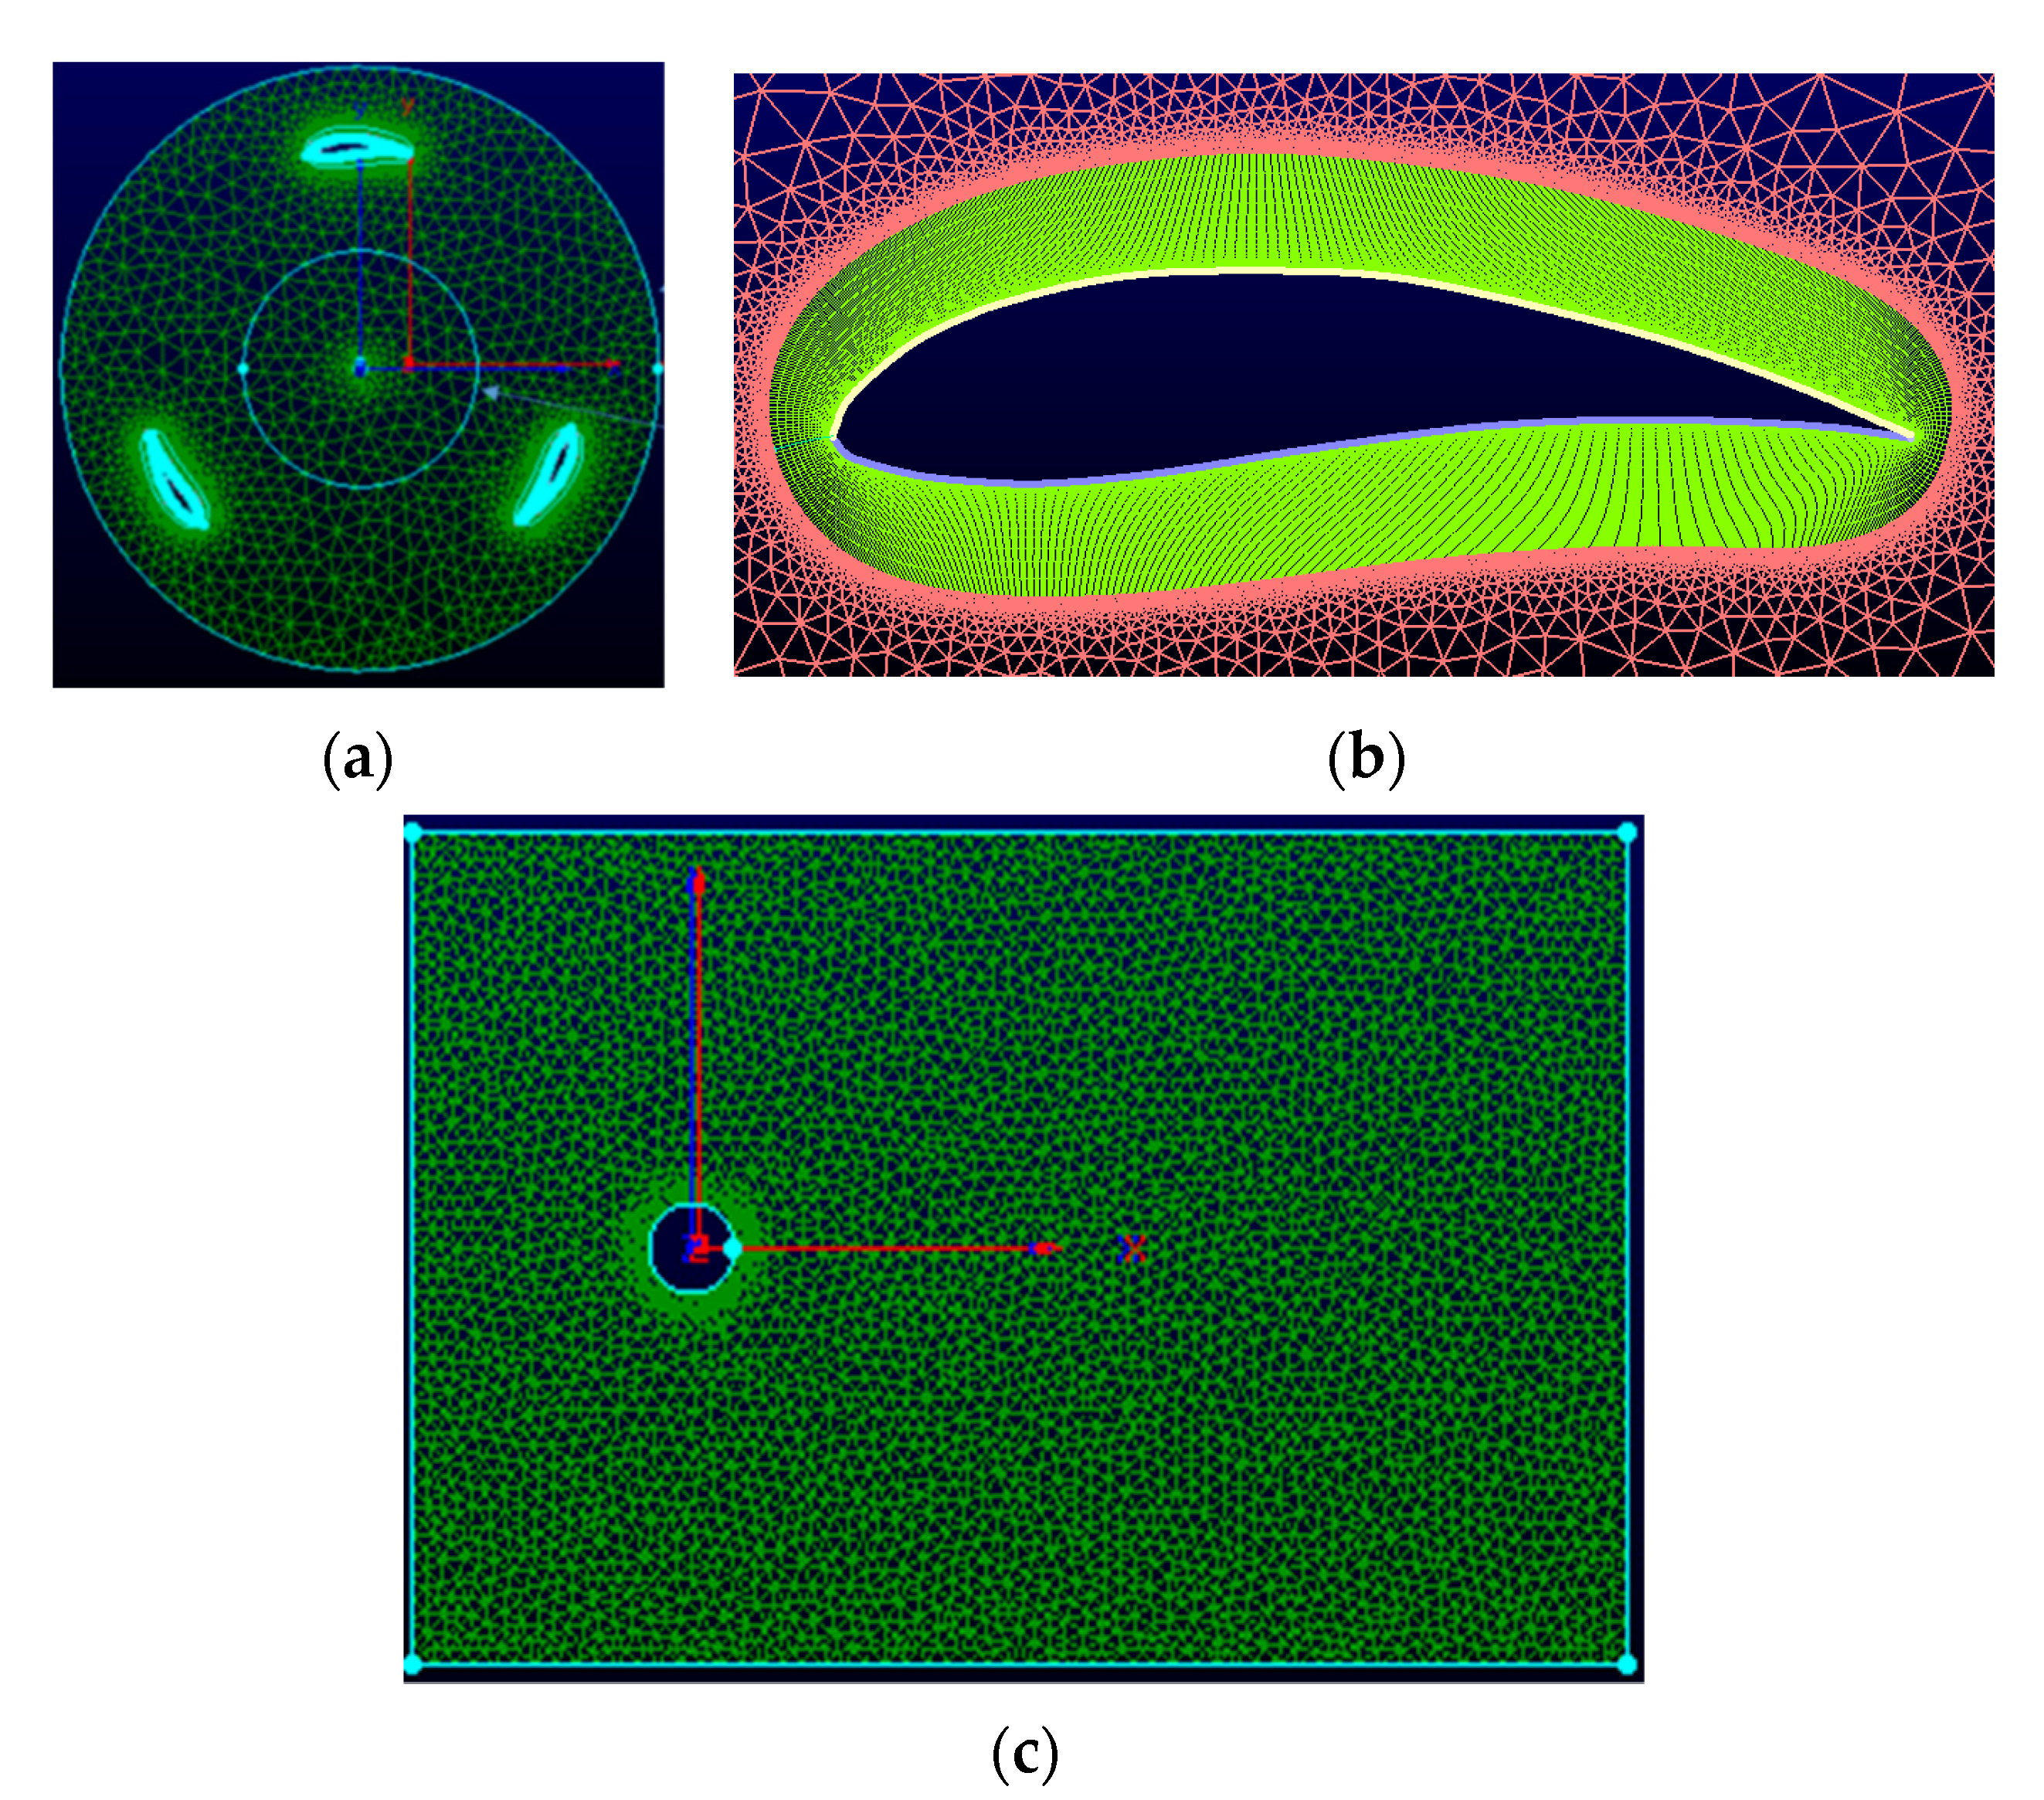
When using the SM technique in VAT simulations, the computational domain must be divided in two: a stationary and a rotational domain. These two domains are connected through a numerical interface. The rotational domain is represented by a cylinder that includes a structured mesh close to the surface of the blade and an unstructured one in the rest of the domain. The diameter of the rotating domain is 1.5D. In the present study, for the structured mesh (boundary layer) a growth rate of 1.2 was used, with a total height of 14.2 mm and 22 layers. A hyperbolic extrusion algorithm with a Kinsey–Barth smoothing parameter of 1.6 was used in the generation of the structured mesh. Figure 3a shows the details of the rotating mesh in which the details of the structured mesh close to the blades of the turbine can be observed. Figure 3b shows the detail of the mesh close to the blade surface. It is clear that the resolution close to the blade was very high in order to achieve the target value of y+ < 1.
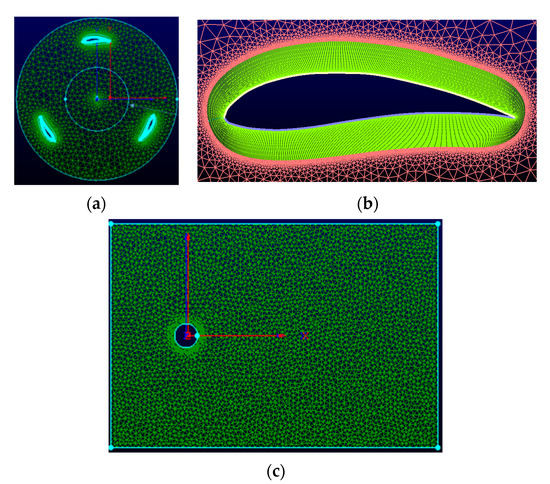
Figure 3.
Dimensions and border conditions. (a) Rotational domain, (b) detail of the mesh close to the blade, (c) stationary domain.
Figure 3c shows the mesh used for the stationary domain; in this case the complete domain was discretized with triangles with refinements in the region close to the rotational domain.
For the convergence analysis, it was necessary to have the generation of meshes that have the number of elements between 73,125 and 256,899, as shown in Table 2. The size and estimated y+ for the first element of the boundary layer mesh is presented in Table 3. As the size of the first element decreased, the total number of elements increased in order to keep an acceptable ratio of increment in the size of the elements between all the regions of the mesh.

Table 2.
Meshes used in the convergence analysis (SM).

Table 3.
Parameterization of the mesh of the blades (SM).
3.2.2. Overset Mesh (OM)
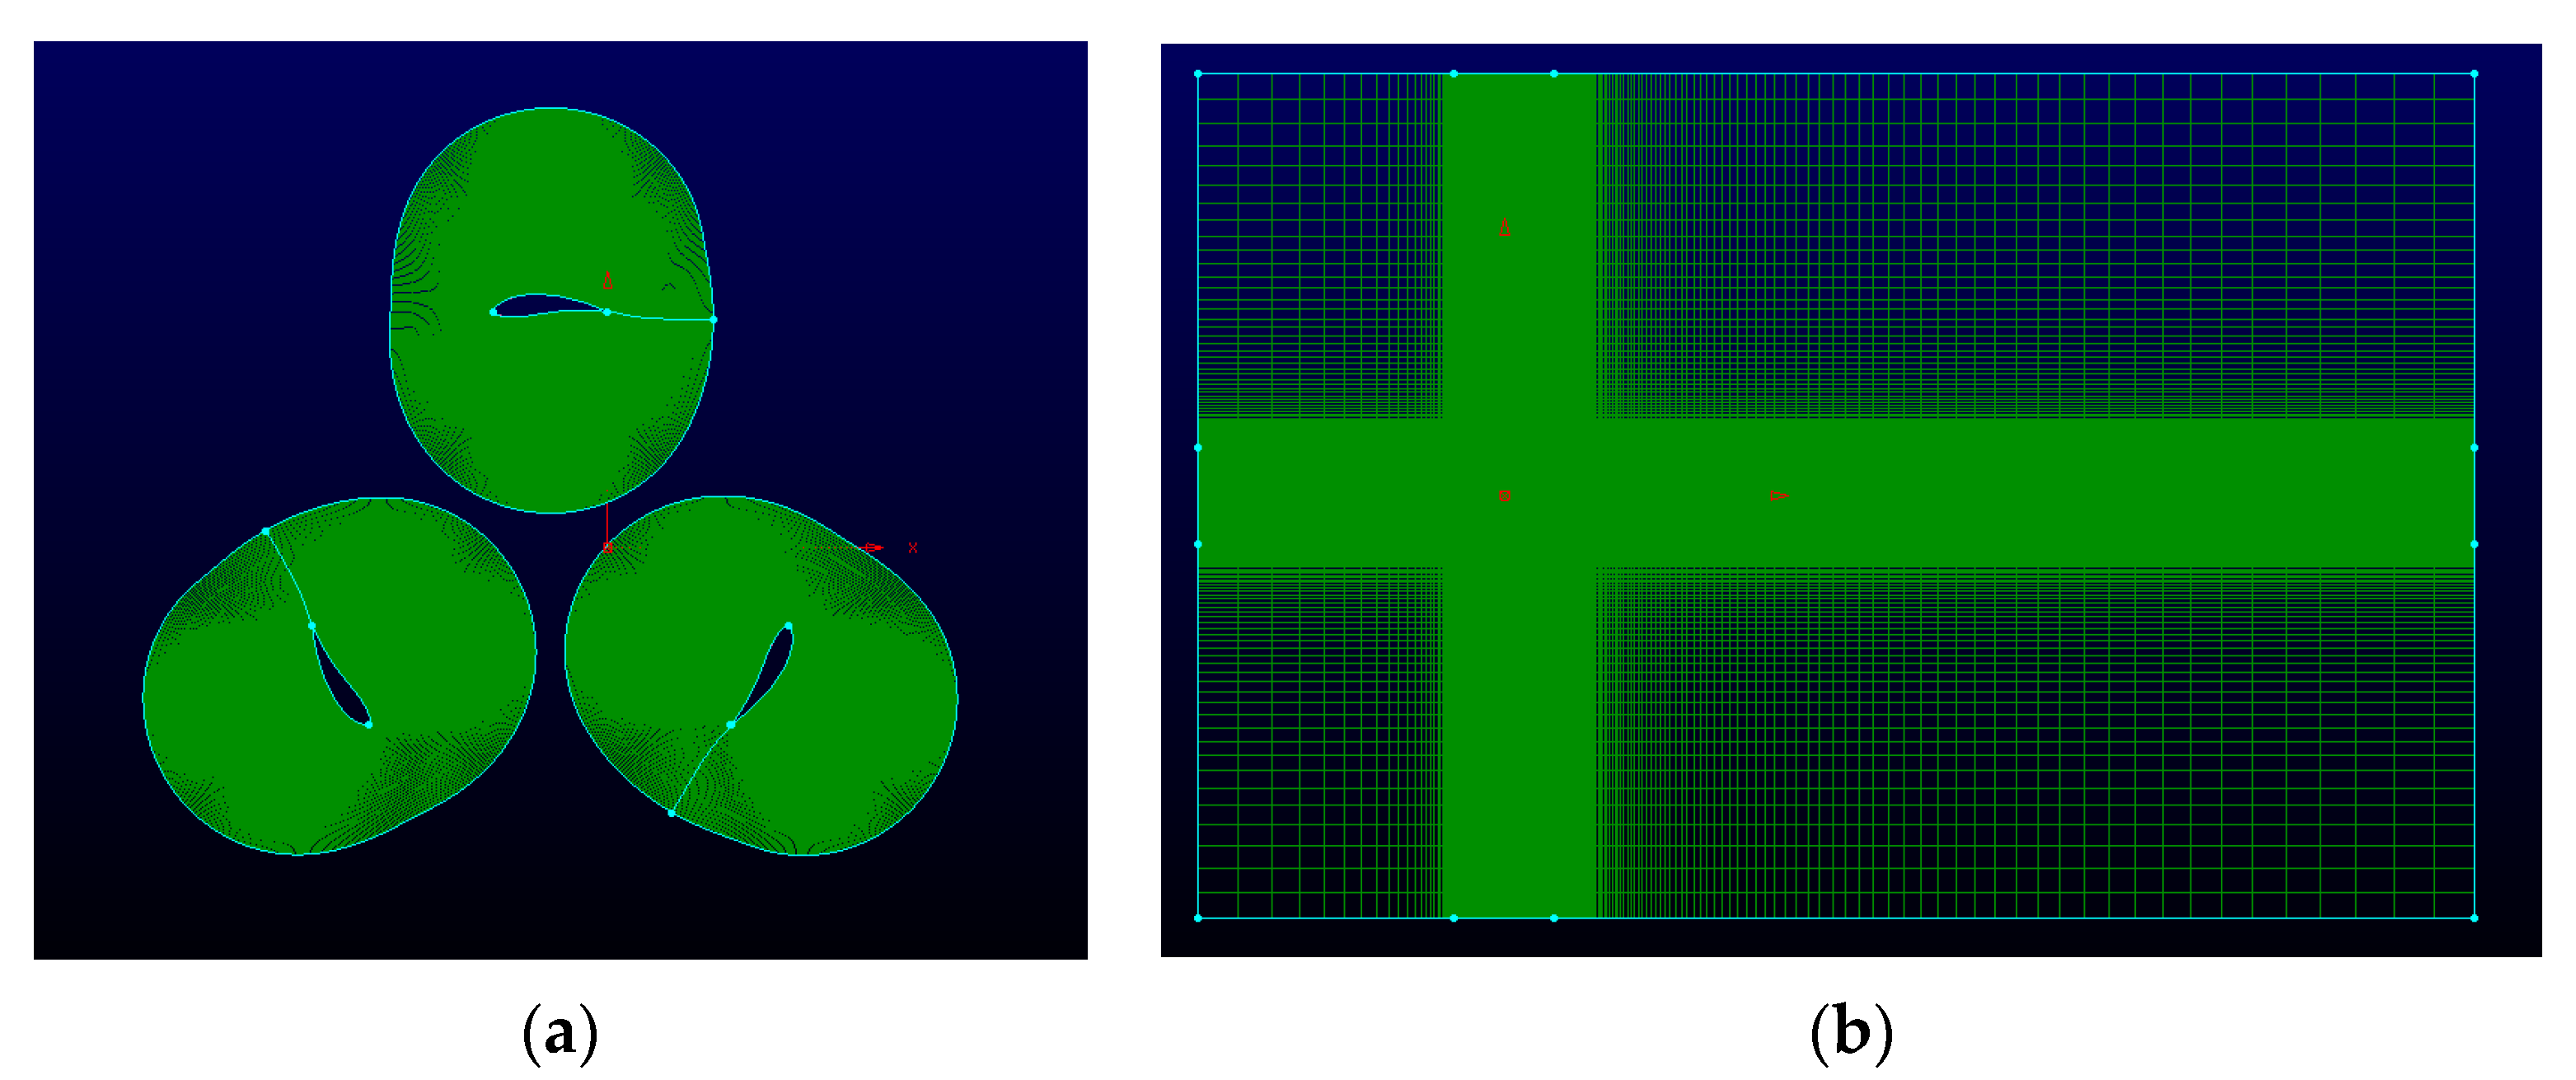
For the OM technique, it was necessary to generate the meshes (background and near body mesh) independently. Figure 4a shows the near body mesh, which was fully structured, and it was obtained from extrusion of the discretized blade surface. In this case, a growth rate of 1.2 and a total of 46 layers were used. These parameters allowed having a total height for the boundary layer mesh of 240.7 mm. This total height was higher than the value used in the SM technique, which is a requirement in the OM technique in order to avoid that the receptor cells of the background mesh are too close to the blade surface. Another aspect that is important when generating the near body mesh is that the size of the elements (approx. 3 mm) close to the overset boundary should be of the same size as those in the background mesh. Figure 4b shows the background mesh, which was also structured. A refinement zone was clearly observed in the region where the turbine was located. Since the mesh was structured, the refinement propagated to the boundaries, which had some advantages such as the improvement in the resolution in the region where the wake was expected. However, at the same time, it increased the number of elements in regions such as upstream where such a high resolution was not needed. In general, the OM technique allows using structured meshes in both near body and background, which brings important benefits such as the reduction of the total number of elements and the computational cost.
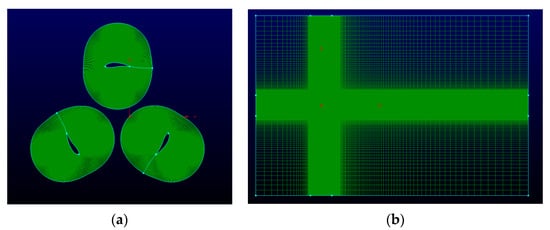
Figure 4.
Meshes used in OM (a) Near body, (b) Background mesh.
In this case, the convergence analysis consisted of the variation of the number of elements in the near body mesh based on the expected y+ while adjusting the background mesh number of elements and size in order to avoid donor cells close to the blade surface. Based on the convergence study performed for the SM method, the total number of meshes used in the OM method was reduced to three. Table 4 shows the parameters used to generate the meshes and the total number of elements. It was clear that the total number of elements of the three meshes was close to the total number of elements of the meshes 4 and 5 used in the convergence study with SM technique.

Table 4.
Meshes used in the convergence analysis (OM).
3.3. Boundary Conditions and Solver Configuration
The simulations were performed with the commercial software Ansys Fluent V 19. In both cases (SM and OM), the flow was considered transient, incompressible, turbulent, and Newtonian. The fluid used in the simulation was liquid water at 20 °C. The Reynolds number based on the chord length ranged between 1 × 10⁵ to 3 × 10⁵ and the inlet velocity was fixed to 1.5 m/s. Table 5 shows the boundary conditions used in the simulations. The boundaries named inlet, outlet, top, and bottom correspond to the left, right, upper, and lower surfaces of the computational domain, as shown in Figure 2. The inlet boundary had a uniform velocity, which was applied in the normal direction. The inflow turbulence was estimated using a turbulence intensity of 5% and a length scale of one-tenth of the chord length (15 mm). Moving wall boundary conditions were used in the upper and lower surfaces of the computational domain, while, at the outlet, a fixed gauge pressure of 0 Pa was used. Besides these boundary conditions, both dynamic mesh techniques required a definition of an interface between the stationary and rotational domains, in the case of the SM method and between the near-body and background meshes in the OM method.

Table 5.
Parameters of the boundary conditions.
Table 6 shows the different cases that were simulated for different Tip Speed Ratios (TSR). The TSR of the turbine was changed by increasing the angular speed of the turbine from 3.46 to 11.54 rad/s while keeping the inflow velocity fixed at 1.5 m/s. To obtain stable results, each simulation needed 10 revolutions of the turbine with a time step of 0.001 s, and 30 iterations were performed per time step. According to Rezaiha, a maximum azimuthal increment ( of 0.5° was required in the simulation of VAWT in order achieve a correct time discretization that did not impact the prediction in Cp. In the present study, a maximum of 0.66° was used and the average value of used in all the simulations was 0.43°

Table 6.
TSR and time step used in the simulations.
For every time step, the convergence criteria were set to 1 × 10⁻⁶ for all the residuals. The pressure-velocity coupling used in the simulation was fully COUPLED.
For comparison purposes, in both techniques (SM and OM) the turbulence model that was used was the because of its excellent prediction of the flow for this specific application, already reported in the literature. Regarding spatial and time discretization, second order schemes were used for all the equations.
4. Numerical Results
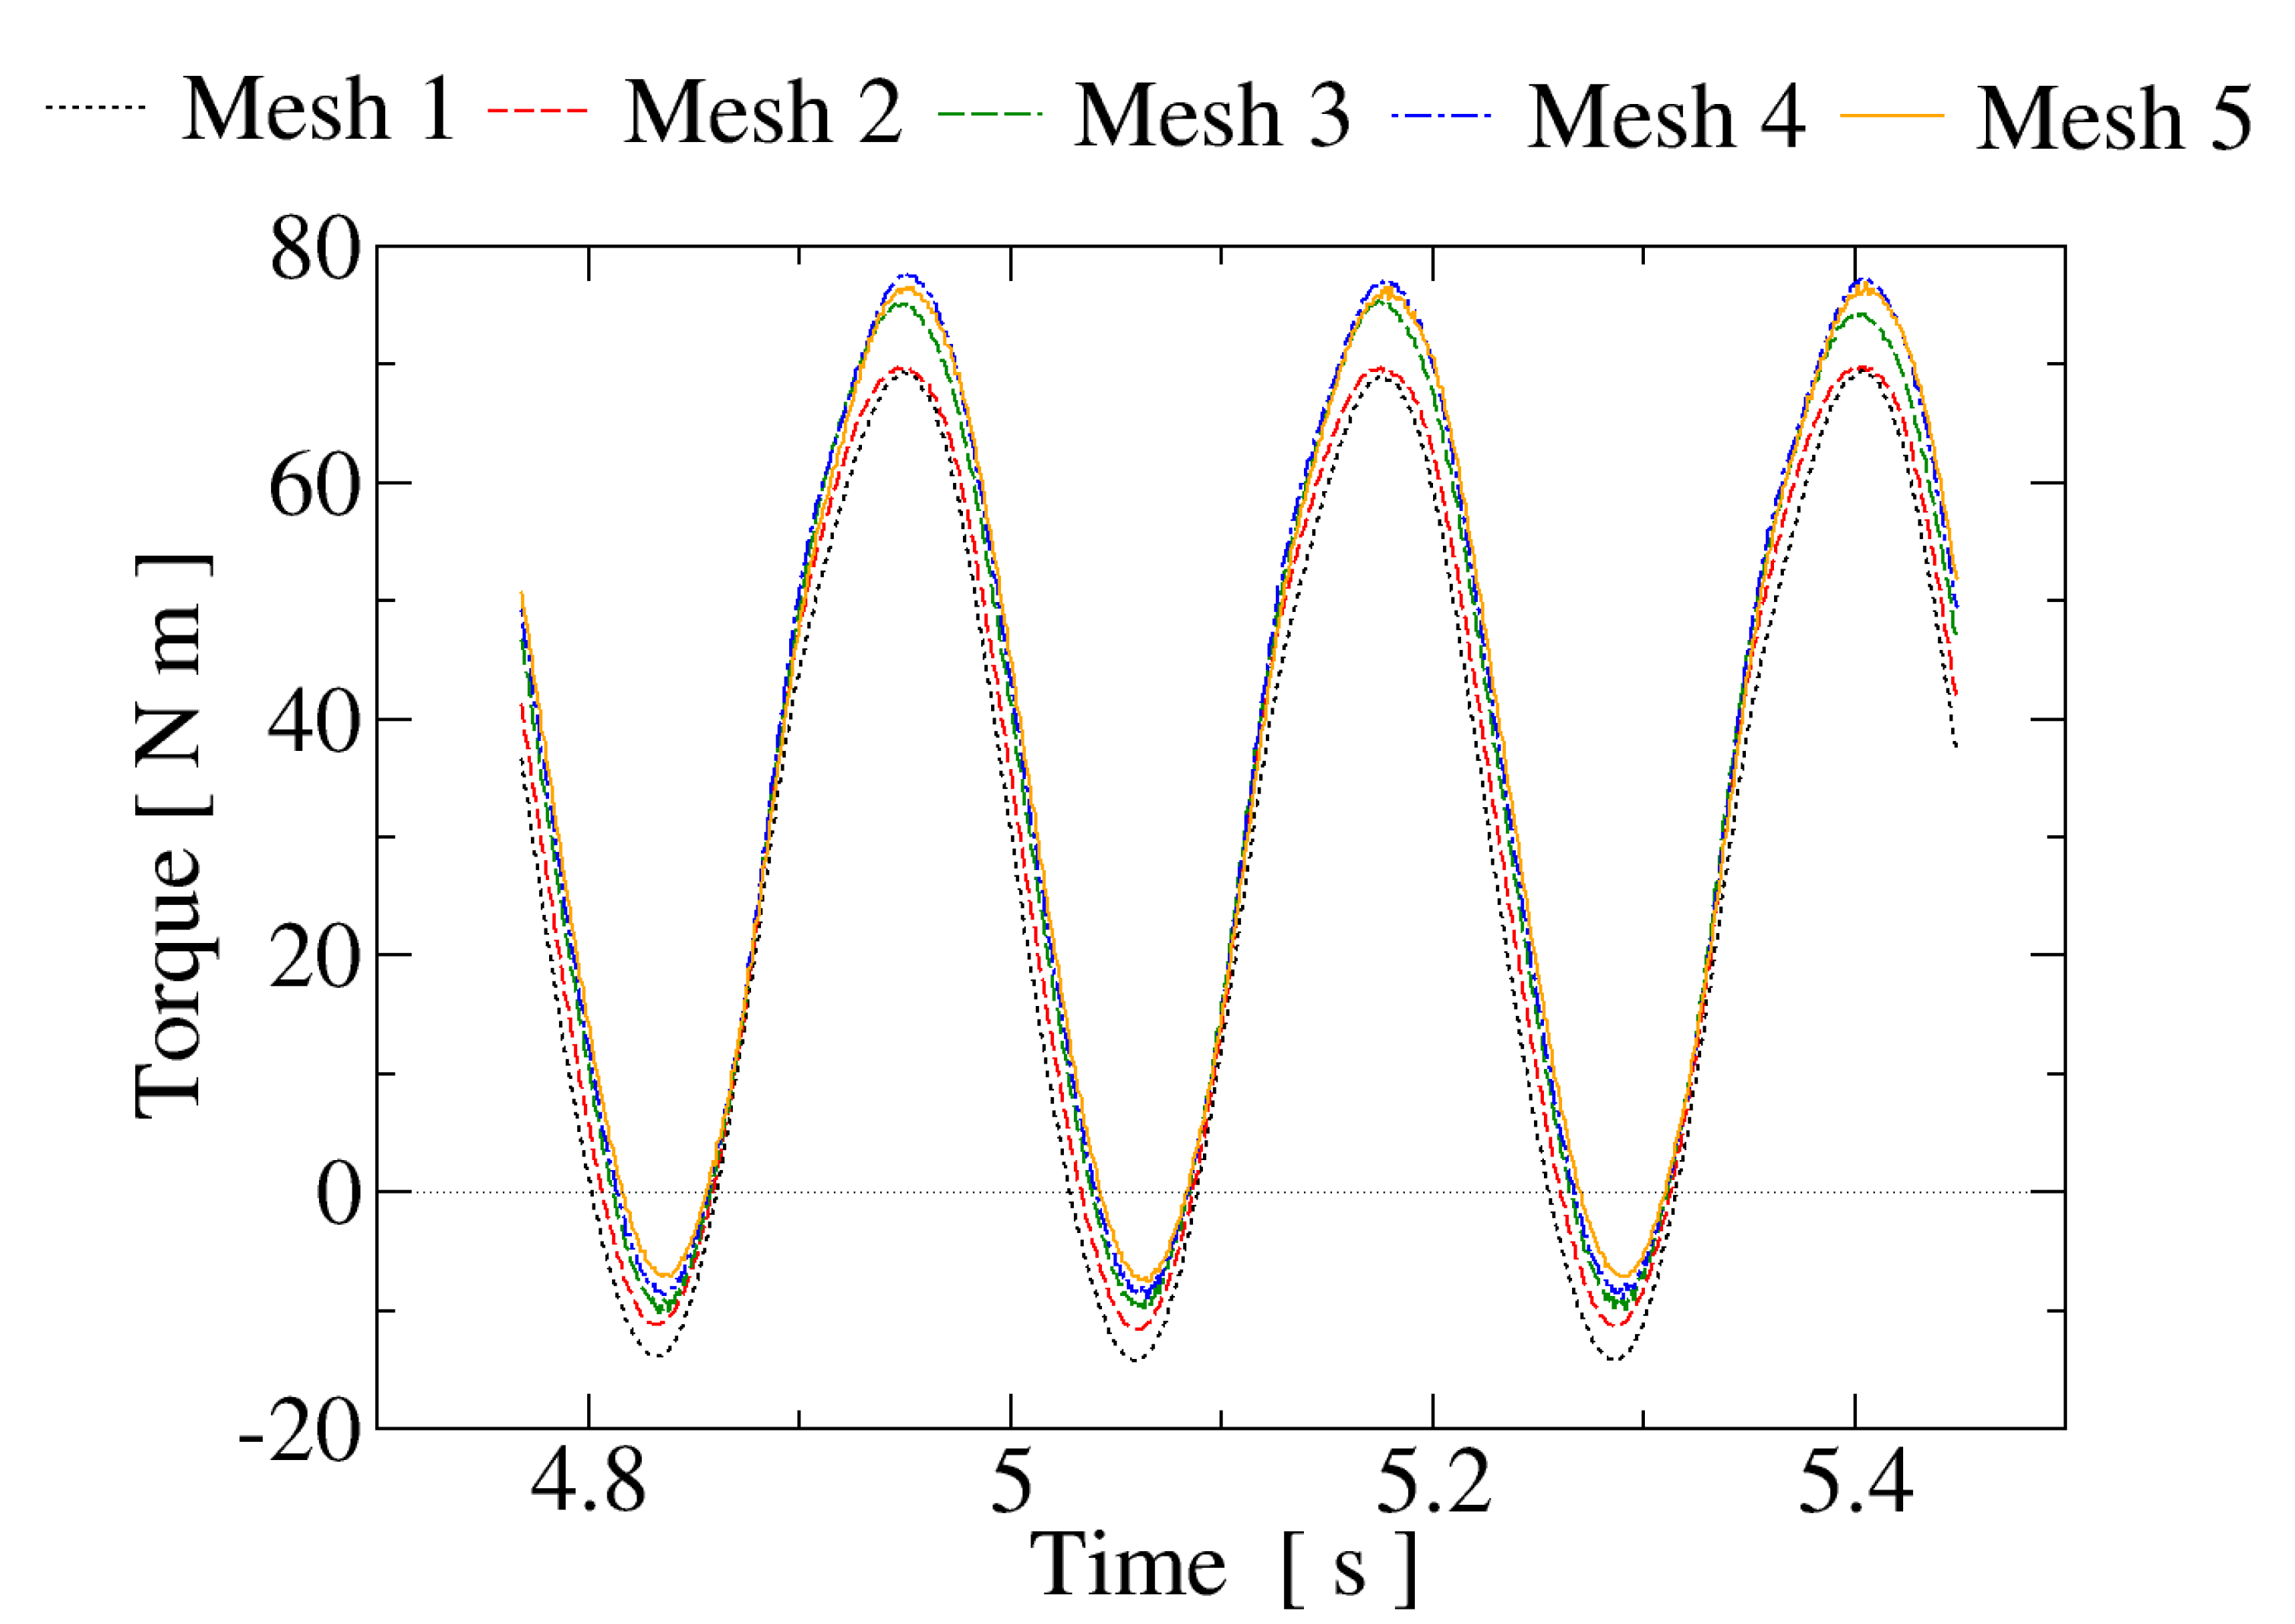
The variable used for the convergence analysis was the total torque generated by the turbine, which was computed as an average in the last (10th) rotation of the turbine. As it is shown in Figure 5, the total torque (at a TSR = 2) had a periodic evolution in time with three peaks per revolution. The same behavior in time was observed for the OM technique (not shown) but with a lower average value.
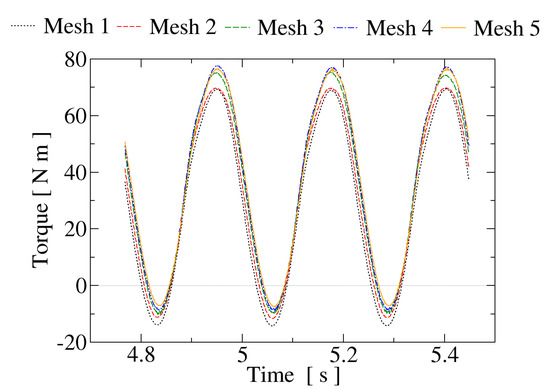
Figure 5.
Evolution of the torque in time for the different meshes (SM, TSR = 2).
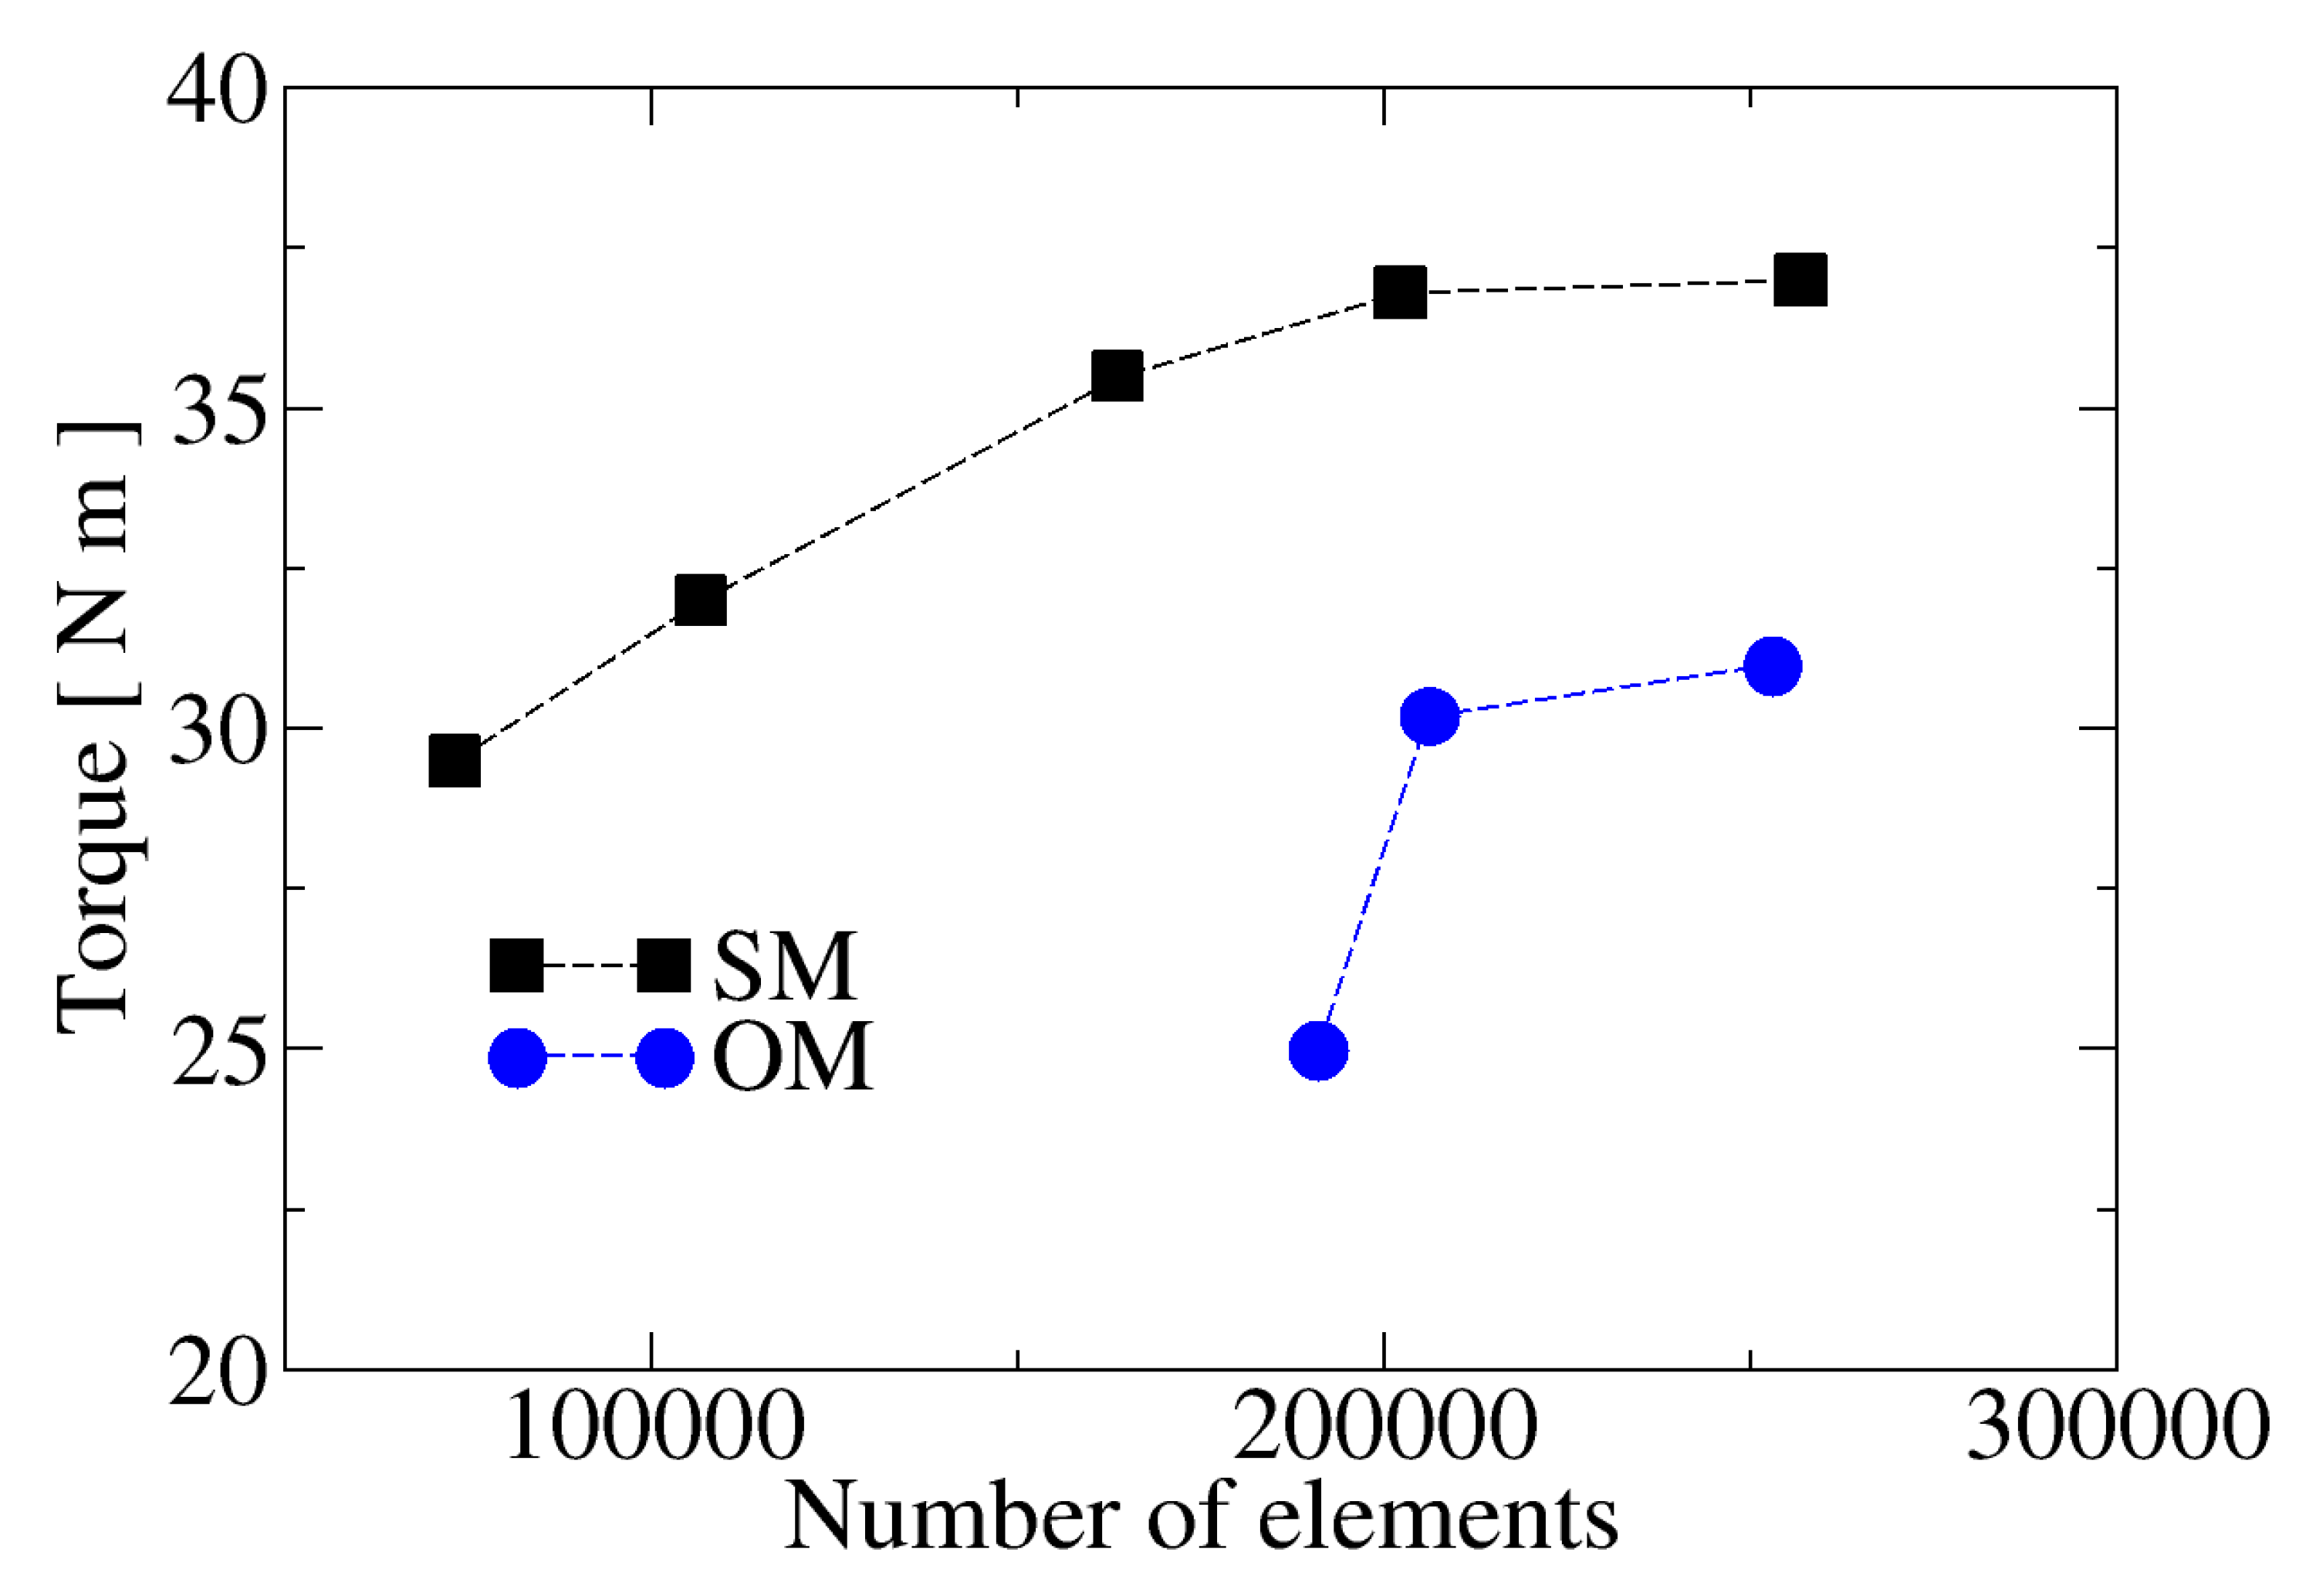
Figure 6 shows the results of the convergence analysis for both (SM and OM) techniques, which were performed for a TSR of 2. It was clear that both techniques showed an asymptotic tendency in their results with meshes higher that 200 k elements, but with a difference of approximately 15% in the predicted torque between the two techniques. It was also observed that the OM method had a faster convergence than SM. It was clear that both techniques arrived at the asymptotic region in the last two meshes, so that this faster convergence was not related to the number of meshes used in the convergence analysis, but in the capability of reaching the asymptotic region with few changes in the total number of elements. The influence of the refinement of the background mesh was also studied (not shown), but it was found that increasing the number of elements of the background mesh did not have a great impact on the predicted torque.
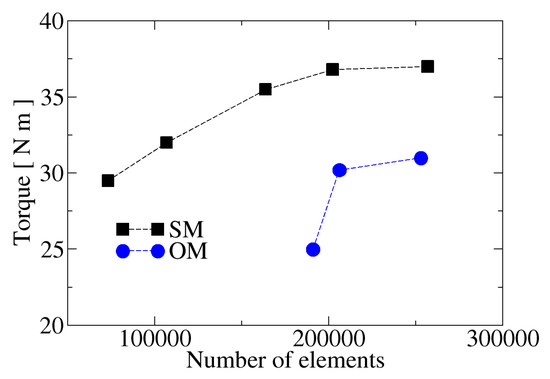
Figure 6.
Convergence results for both techniques at TSR = 2.
Table 7 shows the difference in the predicted torque between consecutive meshes used in the convergence analysis in both techniques. The criterion for selecting the appropriated mesh was based on a difference between consecutive meshes of less than 2%. Based on this criterion, Meshes M4 and M2 were selected to perform the rest of the simulations using SM and OM techniques, respectively.

Table 7.
Differences in the average torque between the meshes.
Mesh 5 (SM) and Mesh 3 (OM) were run using the same computational resource in order to establish an approximate relative computational cost. It was found that for a TSR = 2, using the same numerical setup, the CPU time of OM was approximately 10% higher than SM. No comparison was done with respect to computational resources used such as RAM and processor performance during the simulation.
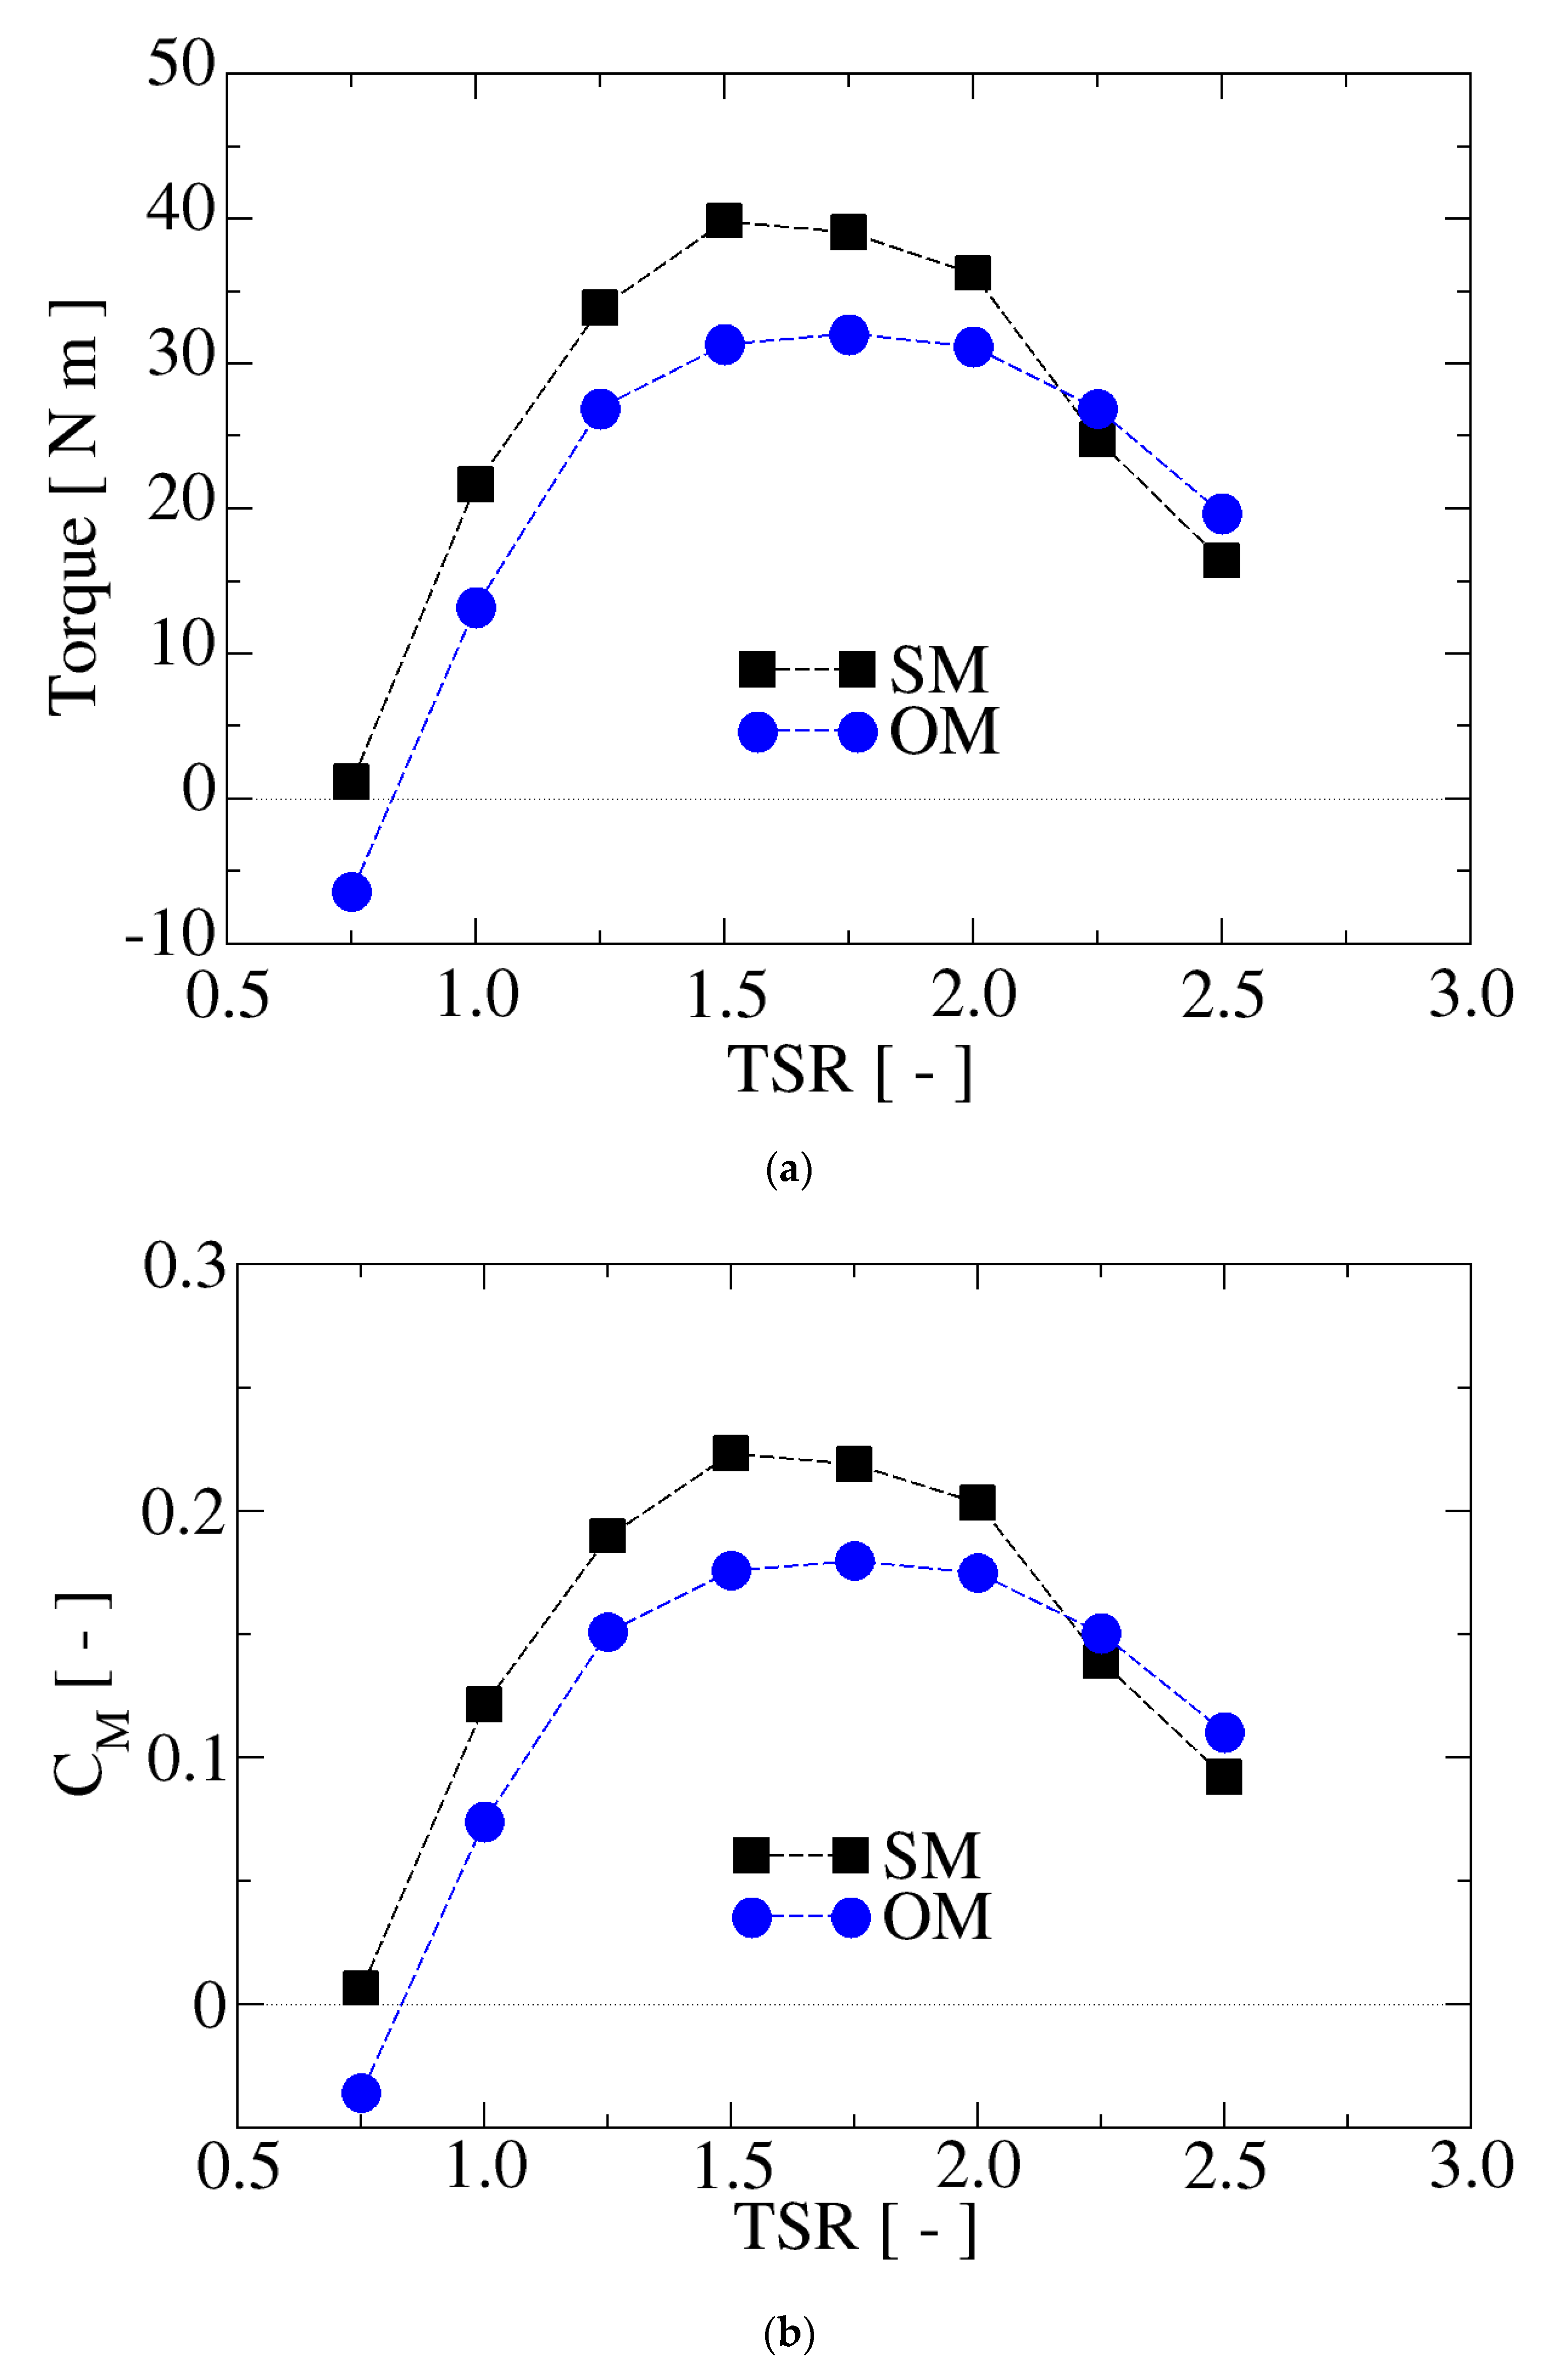
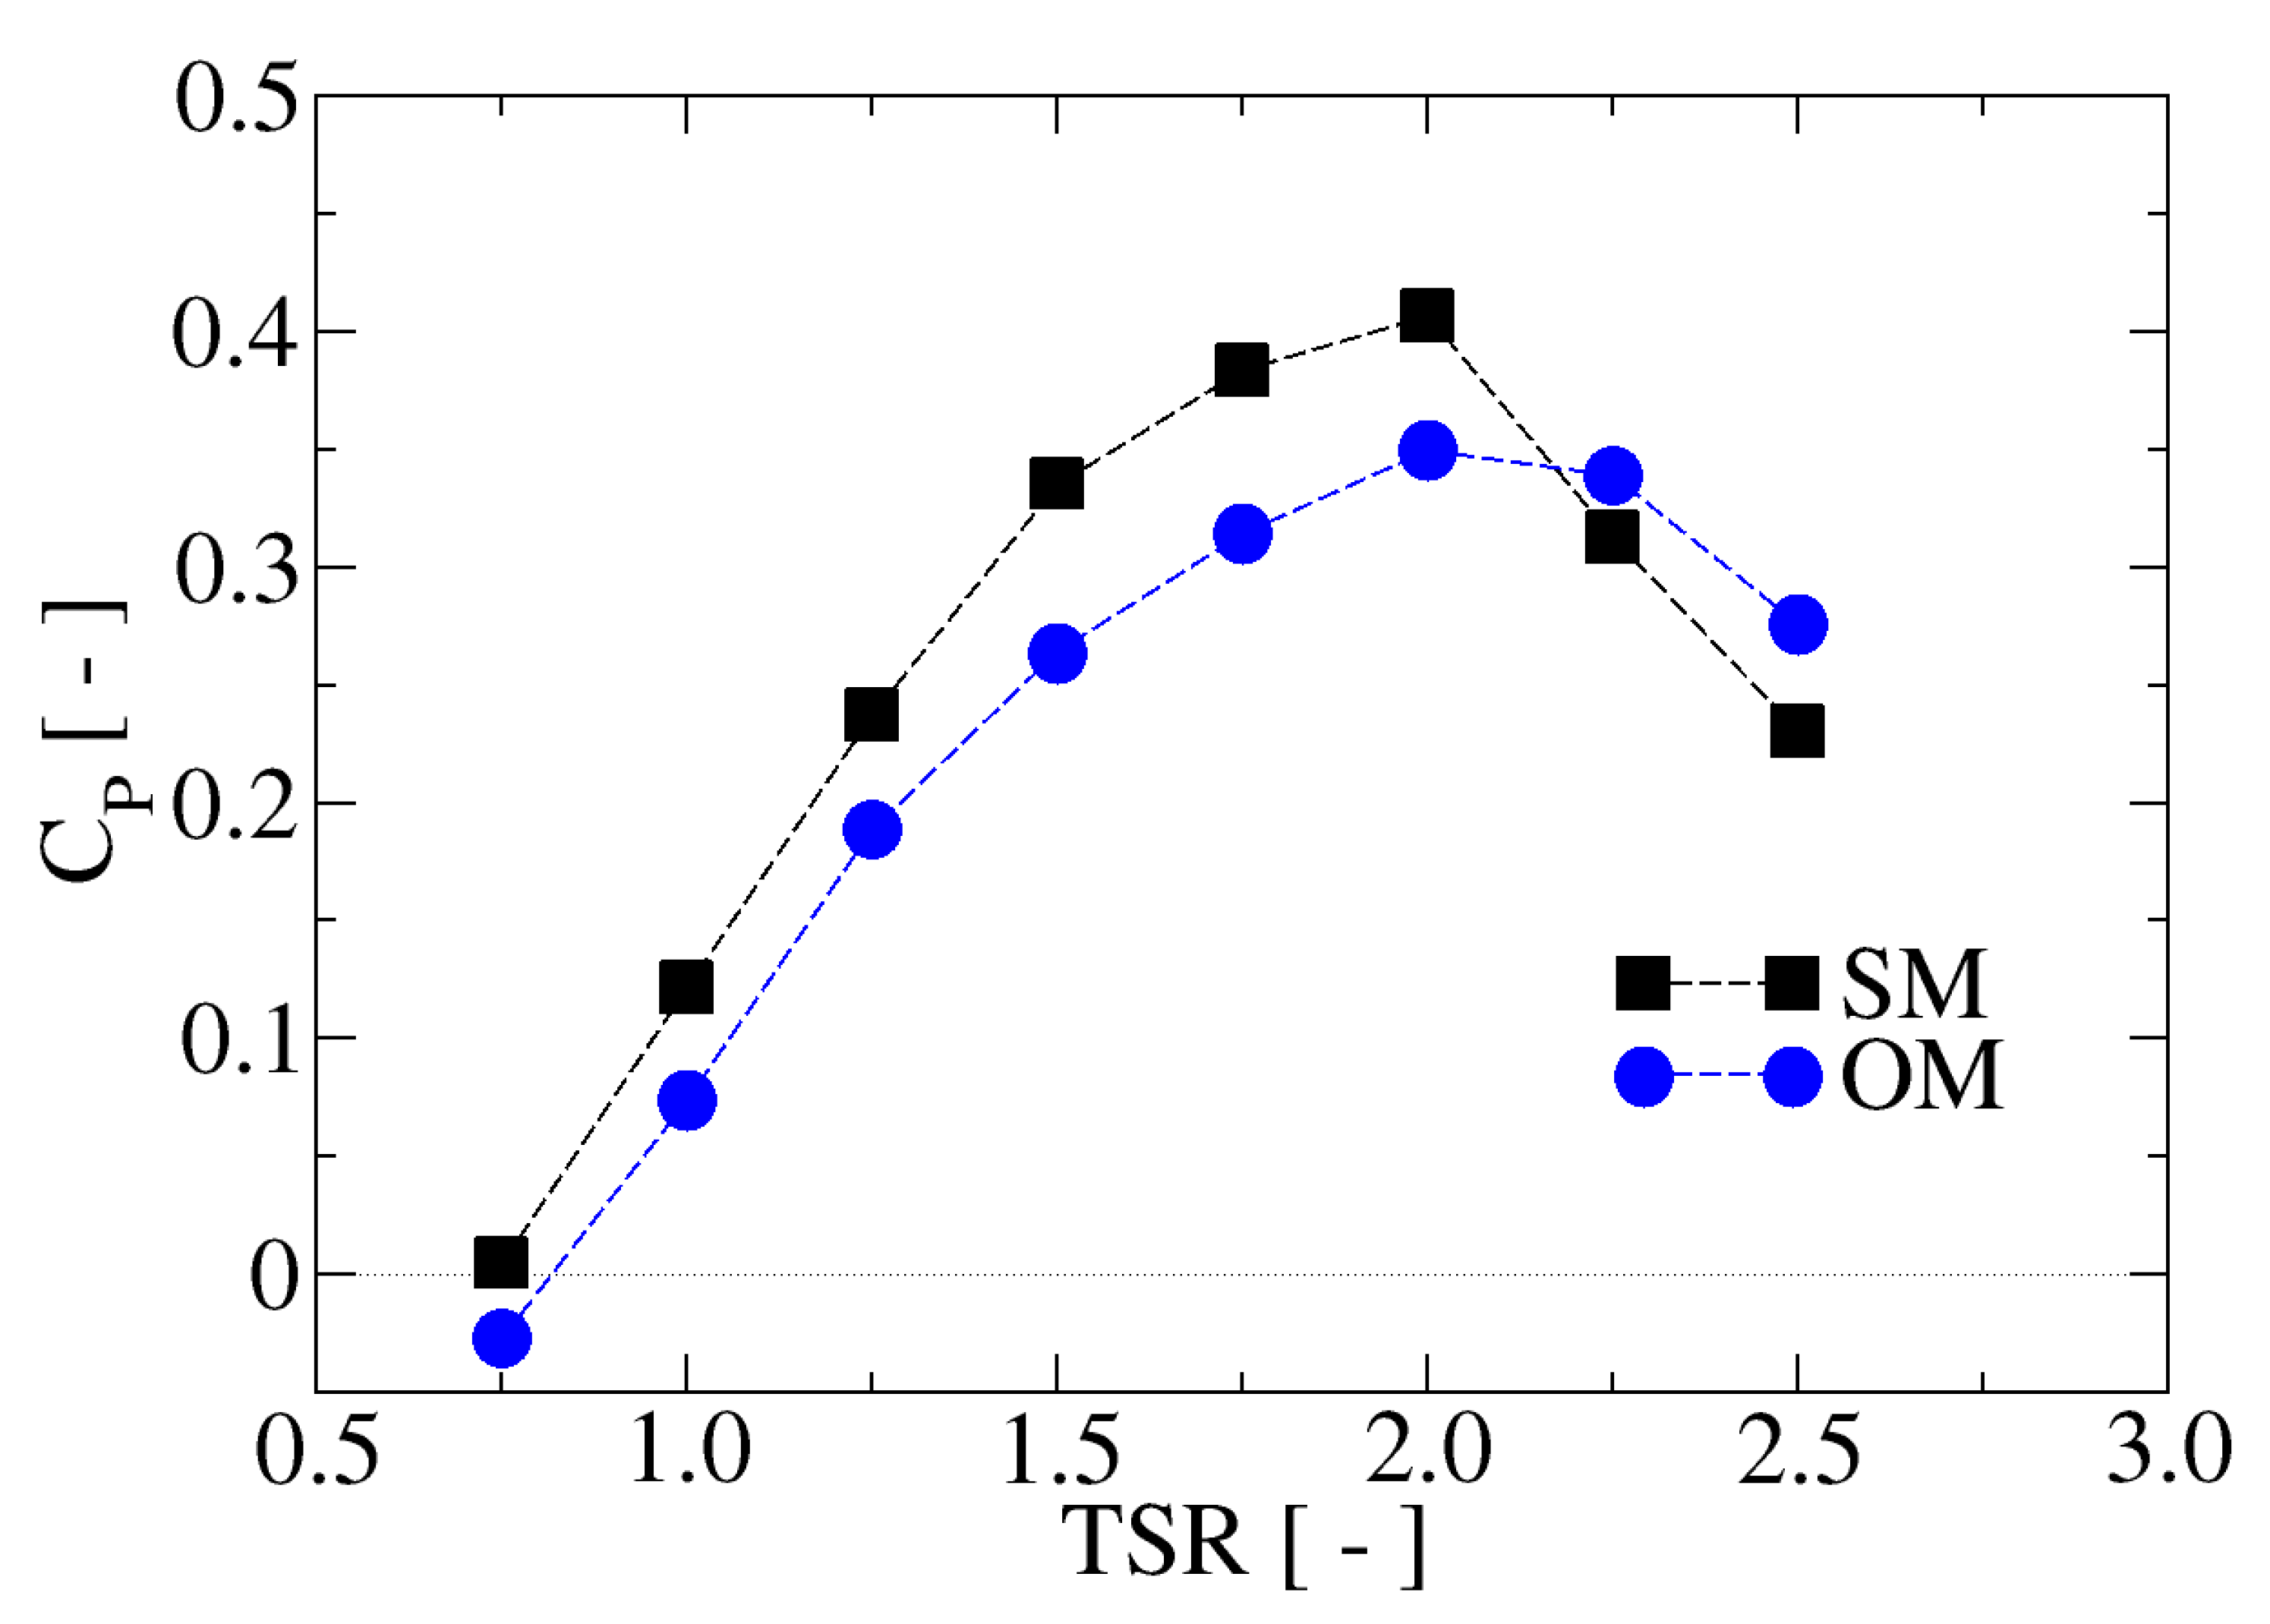
Regarding the prediction of the performance of the turbine at different TSRs, both techniques predicted comparable results, as shown in Figure 7 and Figure 8. However, the SM technique always predicted higher values of the torque and the power coefficient in comparison to OM in the range of TSR between 0.75 and 2. For TSRs higher than 2, the OM method predicted higher values for both torque and power coefficient () in comparison to SM. It was also clear that the SM technique predicted a peak in the torque at a TSR of 1.5, while for the OM method the peak occurred at a higher TSR (1.75). The highest torque predicted by SM was 39 Nm, while for OM it was approximately 32 Nm. For TSRs lower than 0.75, both methods predicted that the turbine did not generate a torque so that a starting mechanism was required.
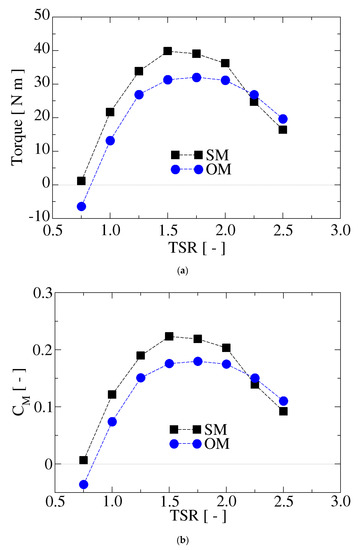
Figure 7.
Turbine performance based on the generated torque (a) Nm, (b) .
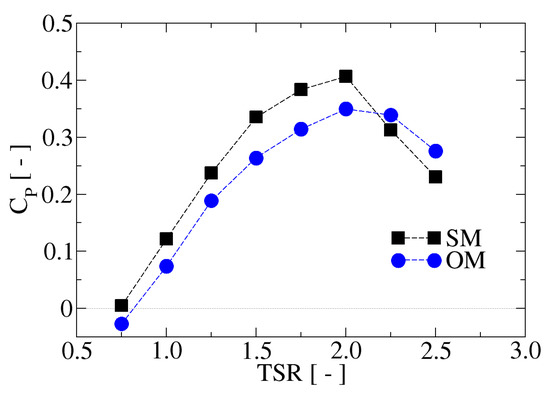
Figure 8.
Power coefficient as a function of TSR.
A very interesting result was that both methods (SM and OM) agreed in the prediction of the peak performance of the turbine in which the peak was achieved close to a TSR = 2 (see Figure 8). It was also observed that the curves predicted by both methods had very similar tendencies and shape. The maximum power coefficient predicted by both methods was close to 0.35, which is a value typically expected for small-size VATs. By performing a simple calculation, it was possible to estimate the highest power that the design turbine could provide if it was operated at a free stream velocity of 2.2 m/s (max speed according to the design calculations). The maximum power that this turbine could generate in such condition is 1040 W according to the SM method and 910 W according to the OM method; both predictions were very close to the maximum power used in the design calculations.
Unfortunately, for the present case, there were not available experimental results for the single rotor, as the turbine was installed on site with the diffuser without being tested first in an equipped laboratory. Nevertheless, the complete floating station was tested in a small dam as it was towed by a boat. It is well known that the experimental data in these kinds of on-site tests have large uncertainties, but the maximum power measured at a boat speed of 1.05 m/s was approximately 99 Watts, which corresponded to a Cp value of 0.35. This value agreed very well with the peak performance predicted by the OM technique.
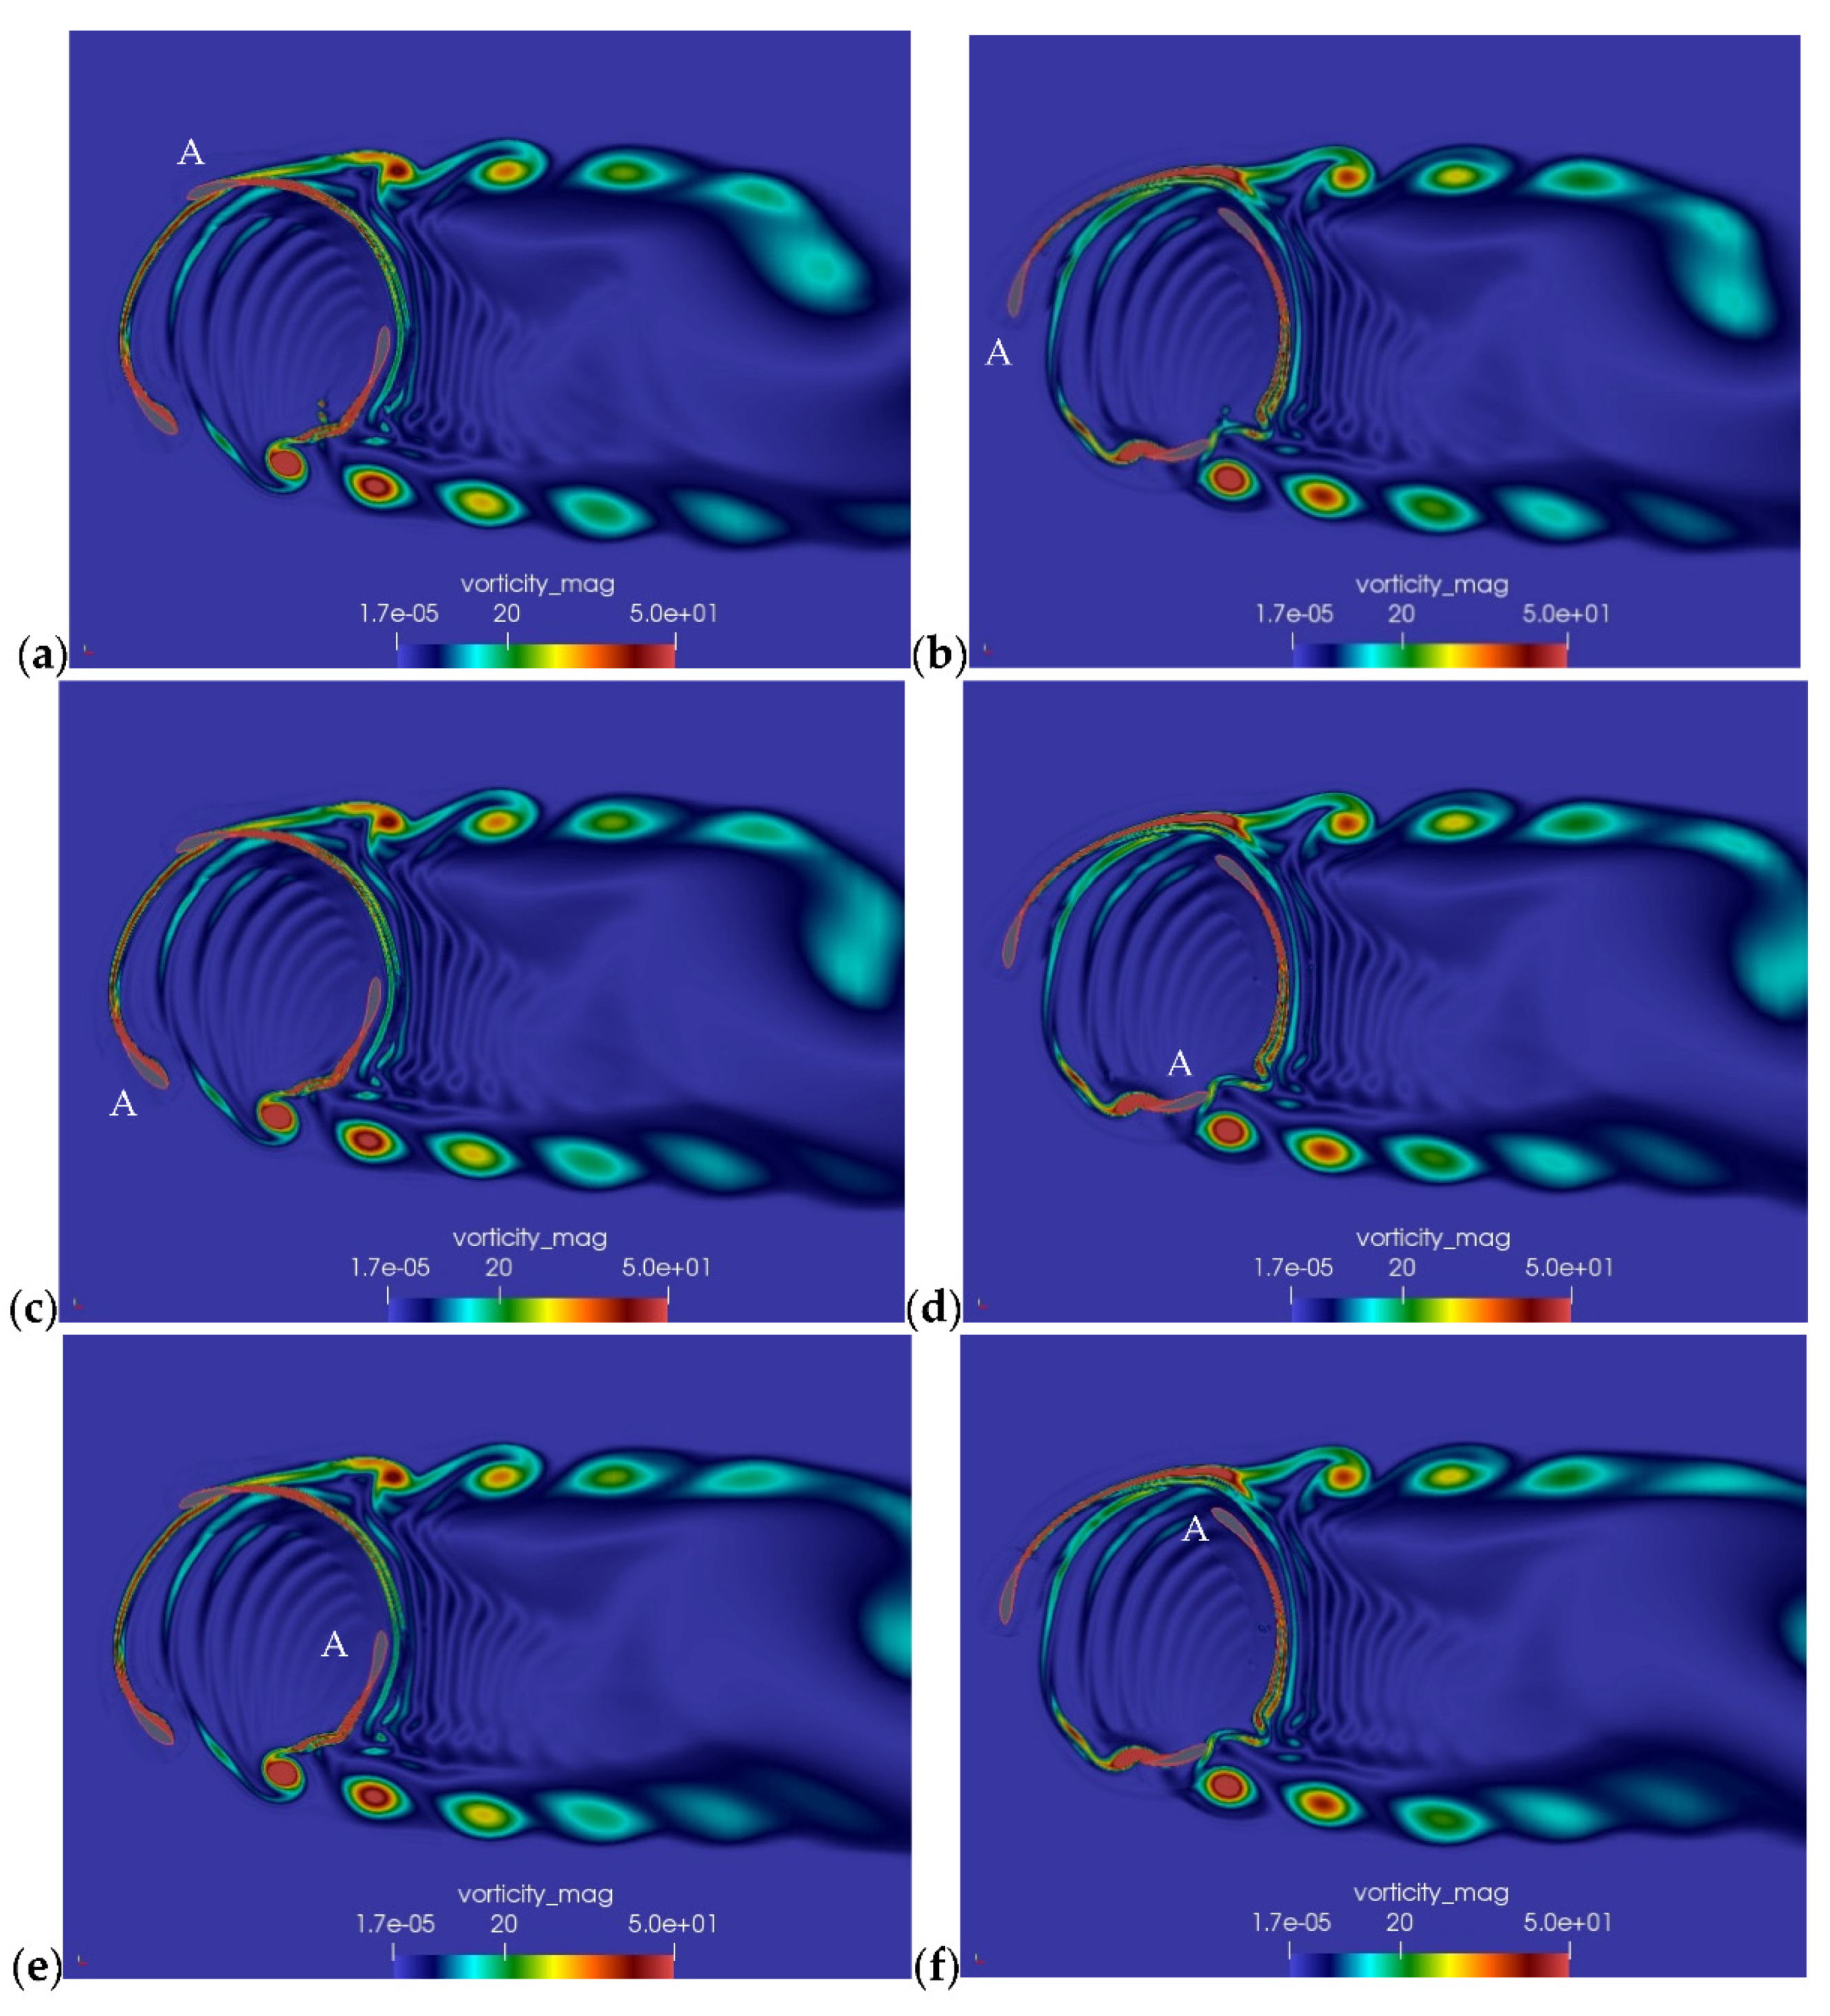
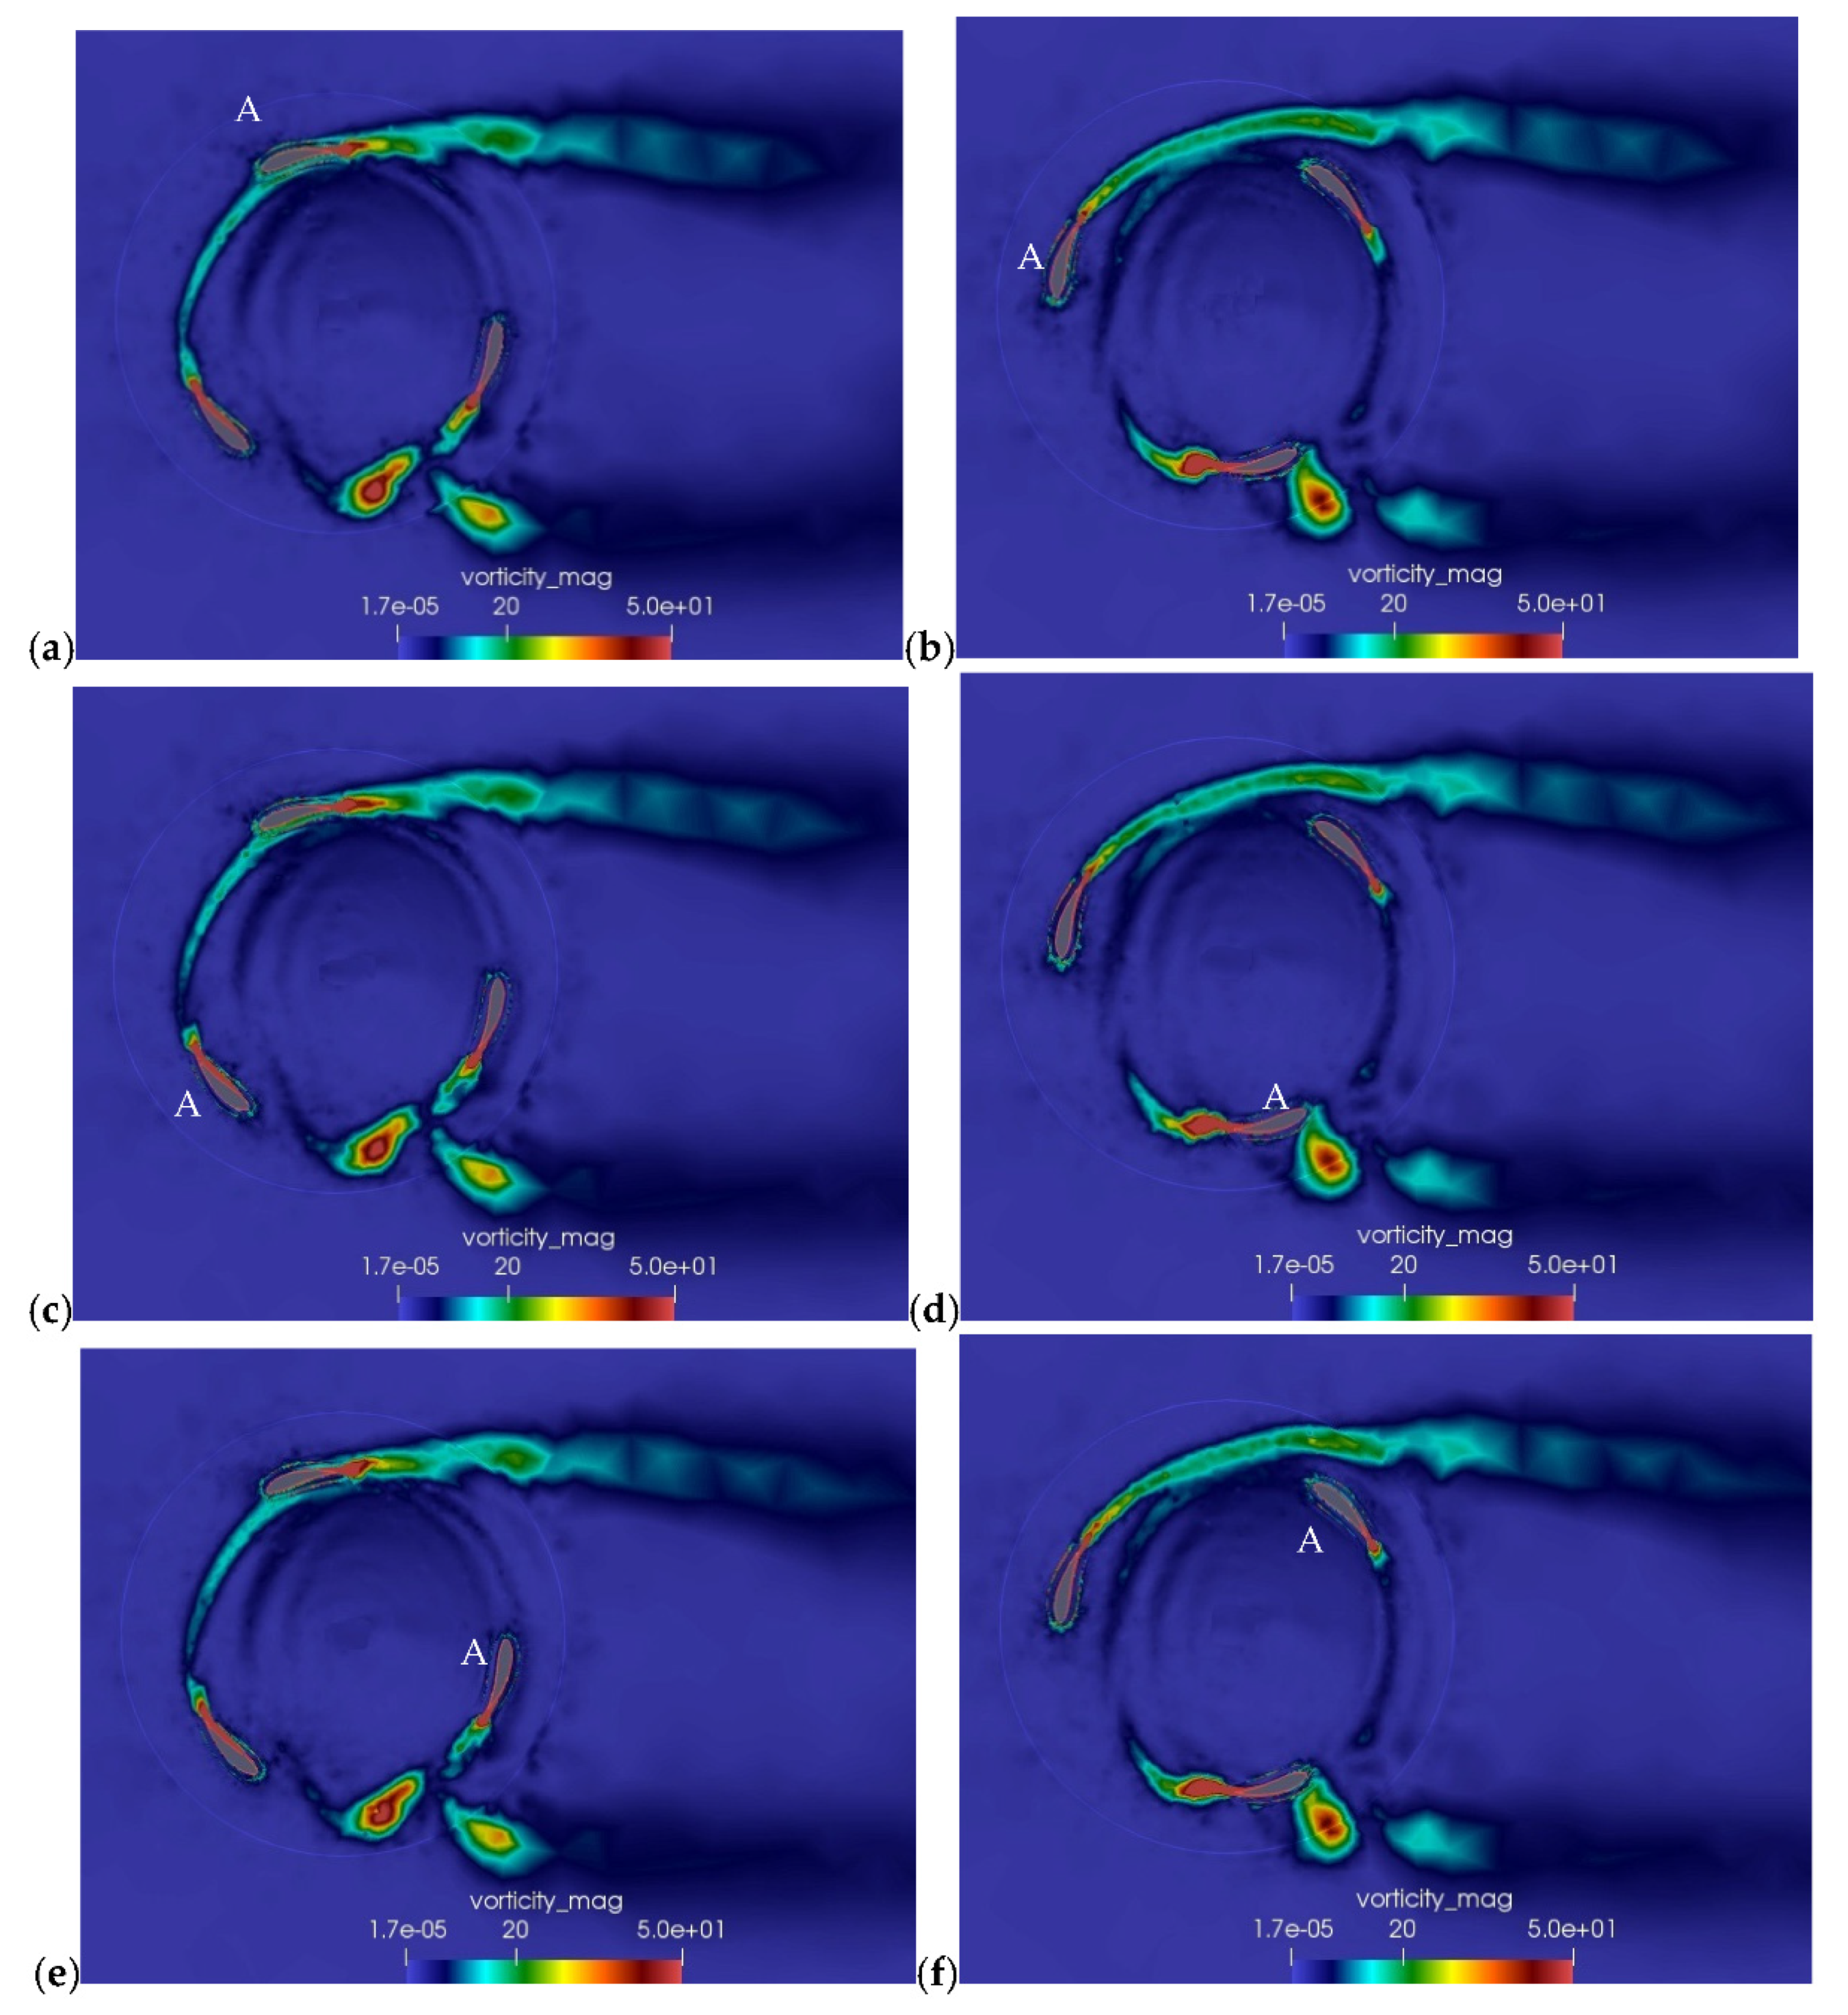
On the other hand, a qualitative comparison of the fluid flow visualization between both methods will be shown using the vorticity, velocity, and pressure fields near the turbine. Figure 9 and Figure 10 show the instantaneous vorticity field close to the turbine in the last revolution for several azimuthal angles (based on the blade marked as A) for both OM and SM techniques. At a first glance, the figures marked as (a), (c), and (e) look alike in the region close to the turbine but some differences were observed in the far wake as it was convected downstream. It is clearly shown that the resolution of the vortical structures that were generated due to the rotation of the turbine was higher in the OM method than in the SM method, even though both methods used the same number of elements. This observation is related to the advantage that the OM technique has due to the structured meshes used in the background and near-body. Both methods predicted the vortex shedding at the same azimuthal angle (between 135° and 195°) with a vortex with a very similar intensity when it separates from the blade. This shed vortex was convected downstream as it diffused to form the wake; in the SM technique, the vortex diffusion happens more rapidly than in the OM technique due to the resolution of the mesh (may be also the interface connection). A very interesting observation is that both methods predicted that the shed vortex would not strongly interact with the other blades. This phenomenon is connected to the geometry of the airfoil used in the blade. In other studies in which NACA profiles were used (see references [5,21,33,34]), this interaction was very strong, which directly affected the generated power of the turbine. Although both techniques predicted the same behavior of the vorticity, the overset mesh presented a higher resolution, details of the vortices, and unsteadiness of the flow in the near and far wake.
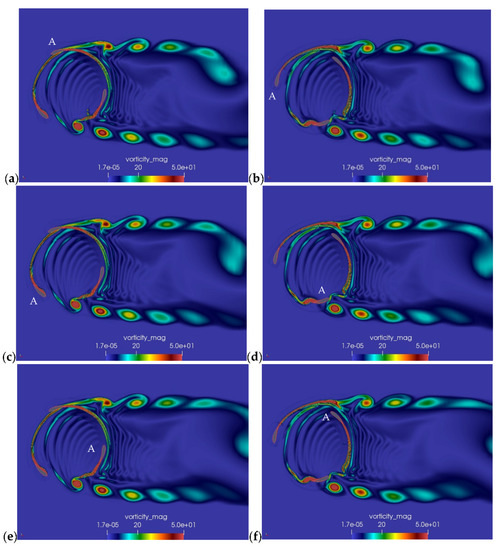
Figure 9.
Instantaneous vorticity field for OM at TSR = 2 and different azimuthal angles: (a) 15°, (b) 75°, (c) 135°, (d) 195°, (e) 255°, (f) 315°.
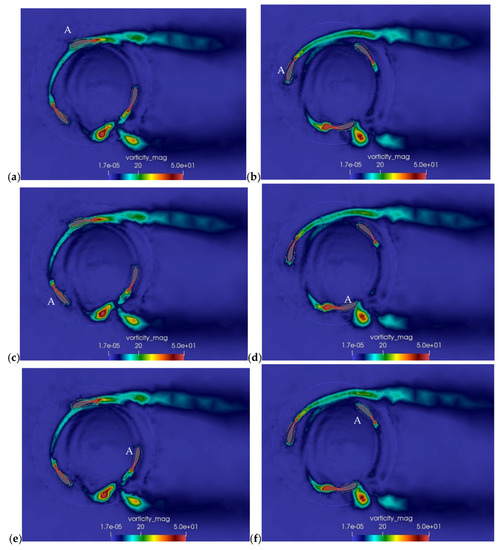
Figure 10.
Instantaneous vorticity field for SM at TSR = 2 and different azimuthal angles: (a) 15°, (b) 75°, (c) 135°, (d) 195°, (e) 255°, (f) 315°.
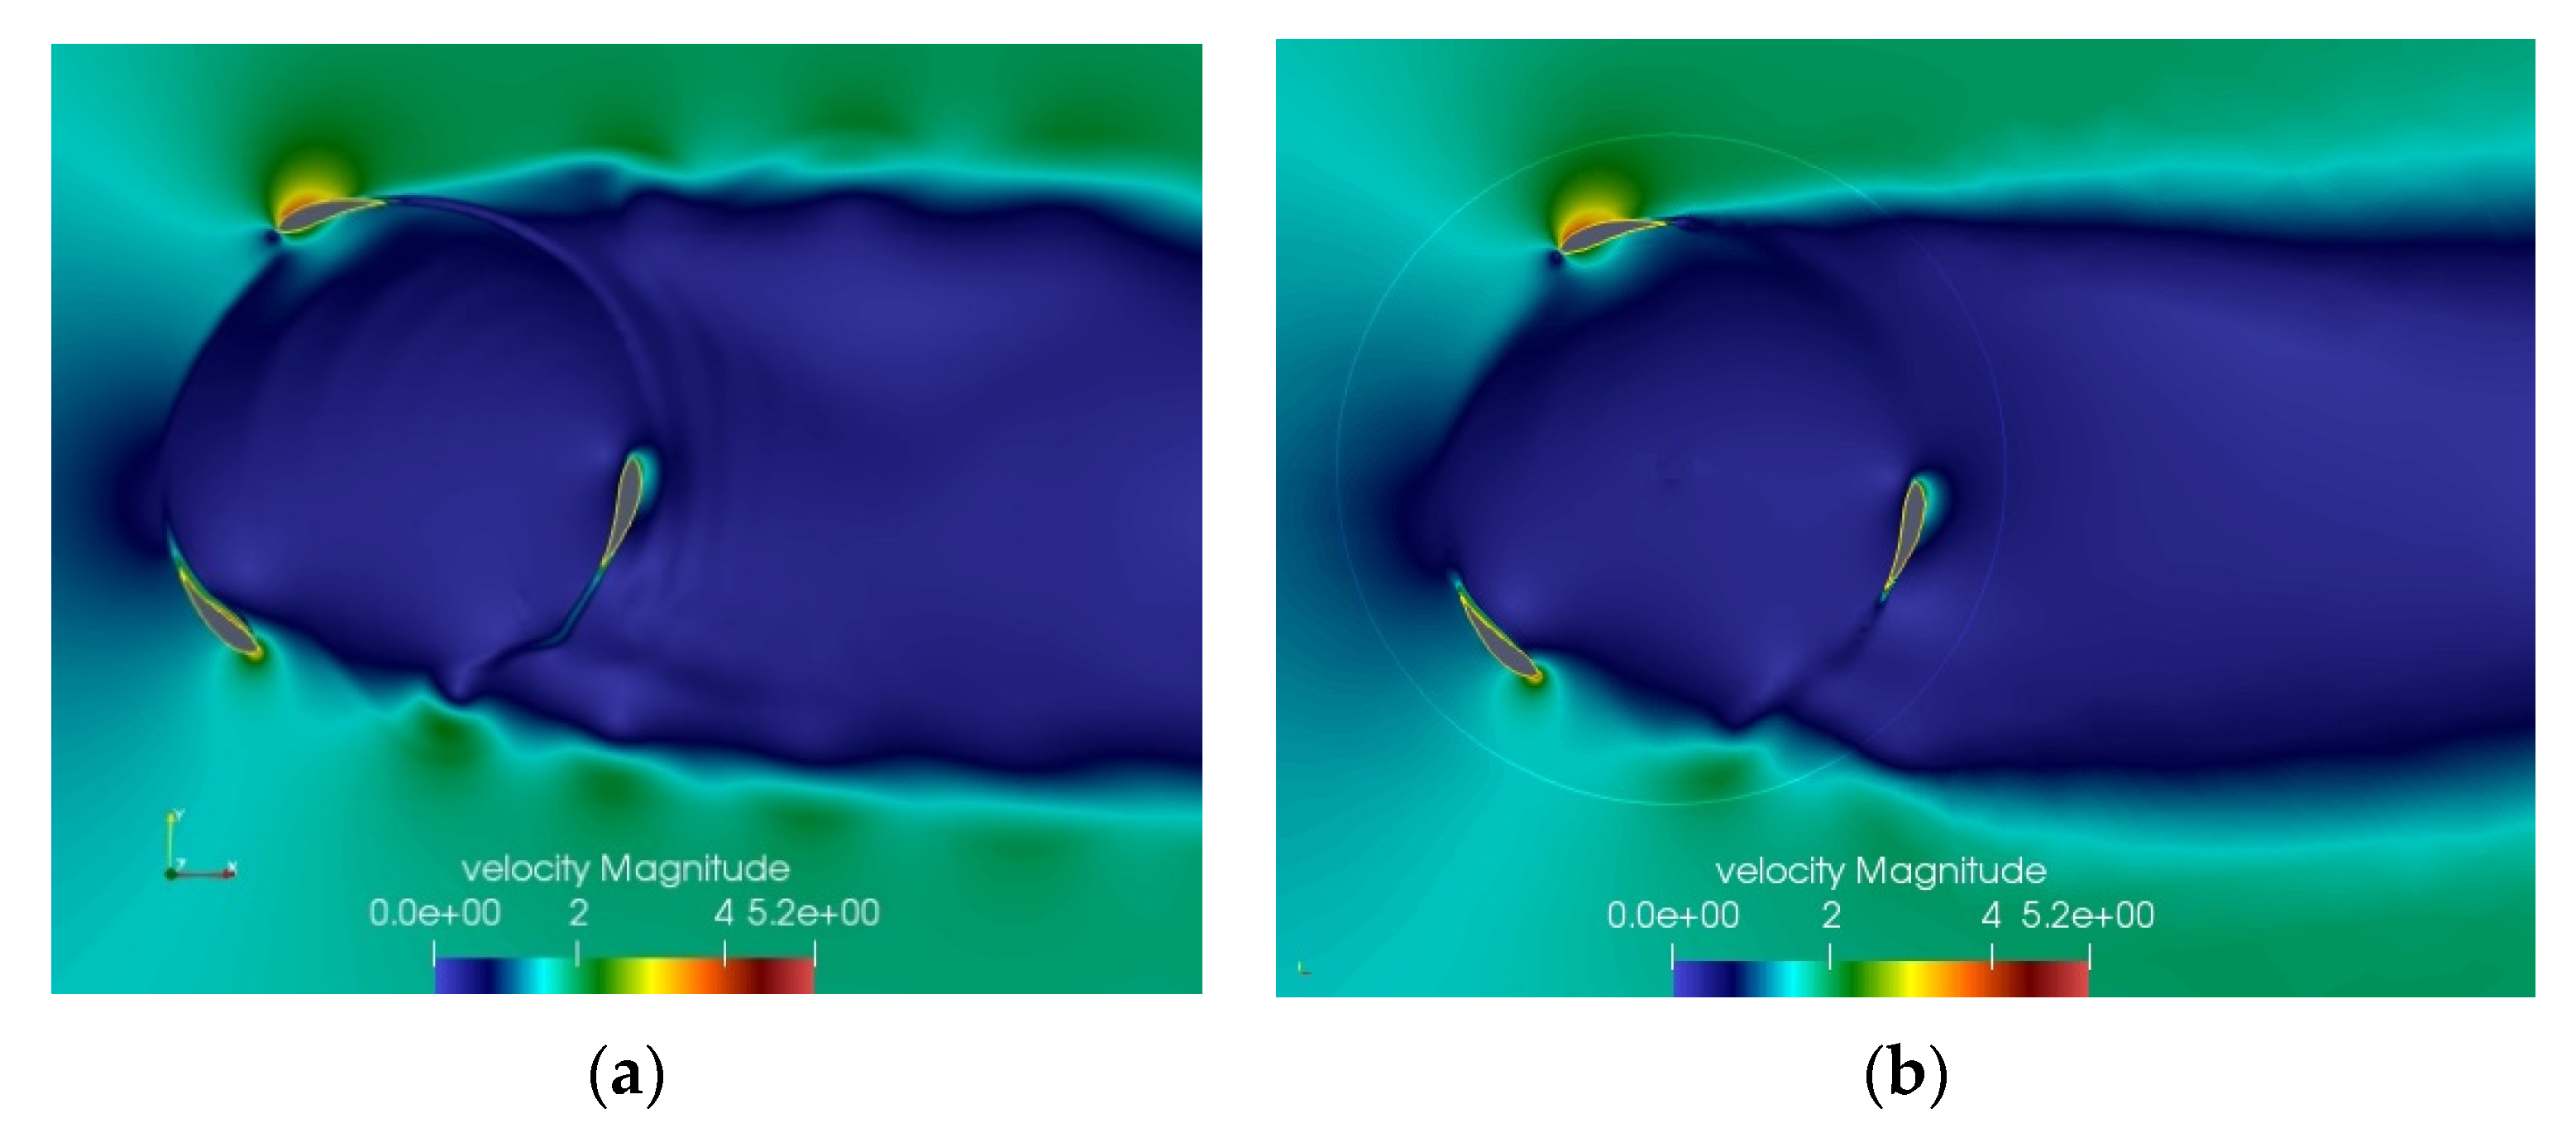
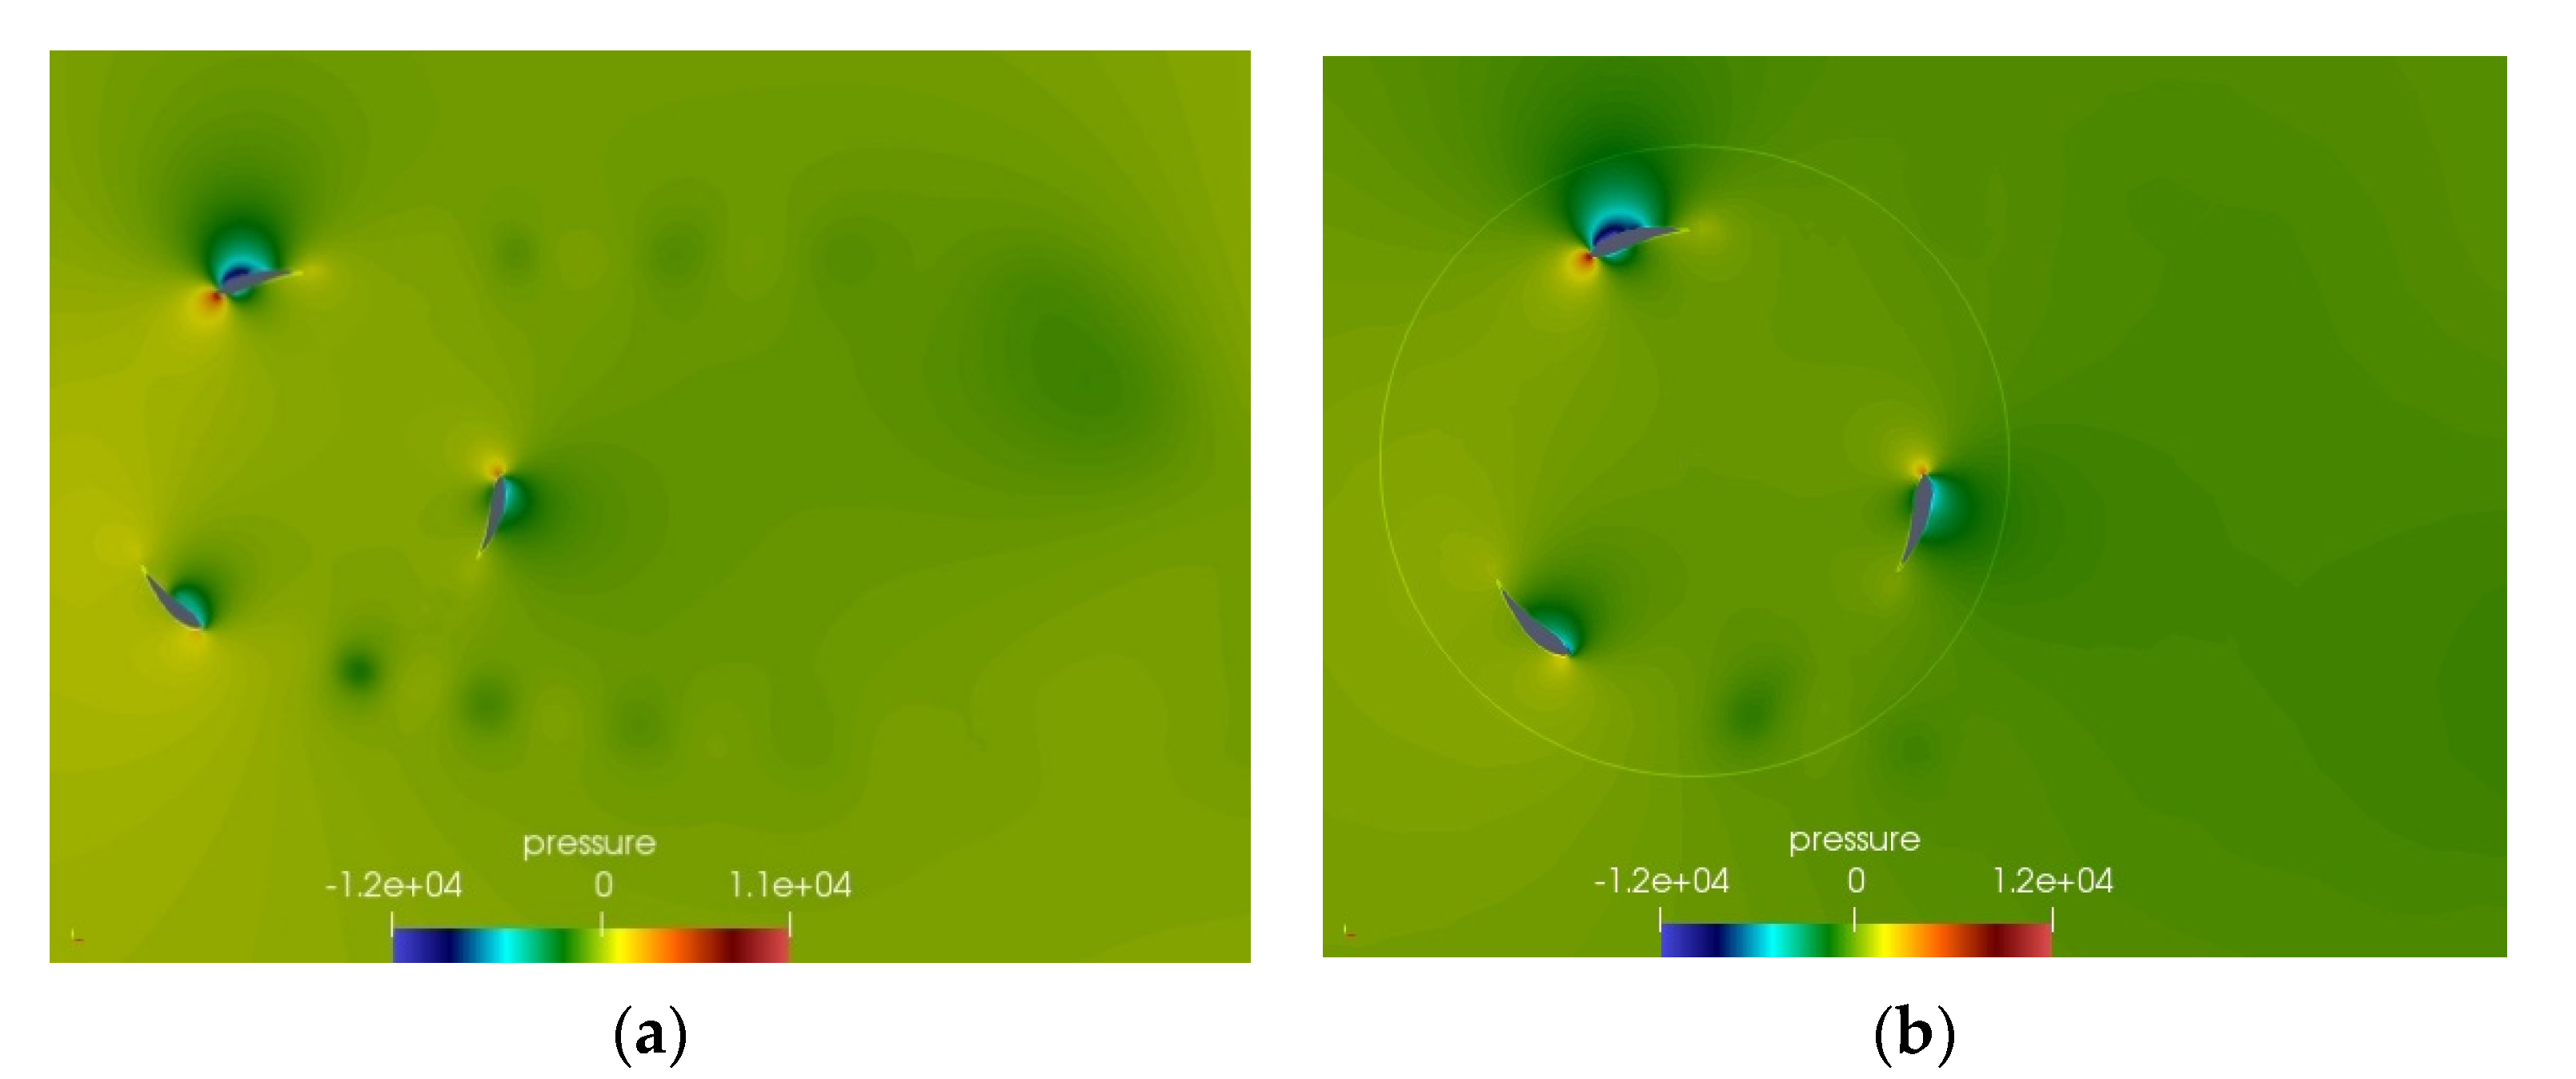
Figure 11 shows a comparison of the instantaneous velocity magnitude contour of the flow near to the turbine at an azimuthal angle of 15° for both SM and OM at TSR = 2. It was observed that close to the surface of the blades the gradients of the velocities were correctly predicted by both methods. The main differences were related to the resolution of the wake of the blades and the wake of the turbine. OM showed a better resolution of the wake of the turbine including the unsteadiness of the shear layers in the edge of the wake. This observation was completely smeared out in the case of SM. In general, the width of the wake is always larger in SM than OM; this is in agreement to the higher results in the SM technique. Similar observations can be done for the instantaneous pressure fields, which are shown in Figure 12. The distribution of pressure along the blades surface looked very similar between both models. For SM, the position of the interface between the stationary and rotating mesh seemed to have an impact on the definition of the pressure gradients. It was very clear that the definition of the low-pressure regions related to the shed vortices was better captured by the OM technique.
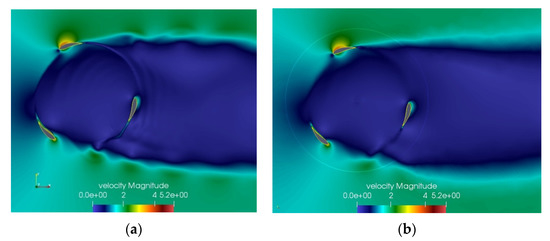
Figure 11.
Instantaneous velocity magnitude field at TSR = 2 and azimuthal angle of 15°for (a) OM and (b) SM.
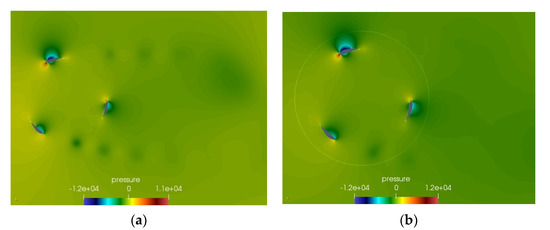
Figure 12.
Instantaneous pressure field at TSR = 2 and azimuthal angle of 15°for (a) OM and (b) SM.
5. Conclusions
A comparison of two of the most common dynamic mesh techniques used in CFD applied to the modelling of hydrokinetic turbines was presented and discussed. For this comparison, two CFD models were implemented, one using the sliding mesh technique and the other one using the overset mesh technique. For a fair comparison, both models were two-dimensional and several parameters were kept similar in both models such as computational domain size, boundary conditions, turbulence model, turbine size, blade geometries, total number of elements, and grid resolution (y+) close to the blades’ surface. The implemented model was based on a 1-kW hydrokinetic turbine design by e.Ray Europa GmBh with the purpose to be used in rivers of low to medium stream current velocities. Since little information was found in the literature regarding best practices for mesh generation and convergence analysis when using dynamic meshes, the present paper proposed a first approximation in this direction for both SM and OM techniques.
Numerical results of the convergence analysis for both (SM and OM) techniques showed an asymptotic tendency in their results with meshes higher that 200 k elements, but with a difference of approximately 15% in the predicted torque. An interesting observation was that the OM method had a faster convergence than SM. Regarding the prediction of the performance of the turbine at different TSRs, both techniques predicted comparable results. It was observed that the SM technique tended to predict higher values of the torque and the power coefficient in comparison to OM. It was also clear that the SM technique predicted a peak in the torque at a TSR of 1.5, while, for the OM method, the peak occurred at a higher TSR (1.75). Both methods also agreed in the tendency and shape of the curve, and the prediction of the peak performance of the turbine was very similar and close to a TSR = 2. The maximum power coefficient predicted by both methods was close to 0.35, which is a value typically expected for small-size VATs.
Regarding the resolution of flow dynamics’ properties such as vorticity, velocity, and pressure fields, the OM technique showed better performance than SM. The dynamics of the wake including the width of the wake and the unsteadiness were better captured with the OM technique using the same number of elements. Regarding the computational cost, it was found that, for a TSR = 2, using the same numerical setup and approximately the same number of elements, the CPU time of OM was approximately 10% higher than that of SM.
Author Contributions
Conceptualization, O.D.L.M., F.S. and S.L.; validation, F.S.; investigation, O.E.M. and K.M.E.; writing—original draft preparation, O.D.L.M.; writing—review and editing, S.L.; visualization, O.E.M.; supervision, O.D.L.M. and S.L. All authors have read and agreed to the published version of the manuscript.
Funding
This research was founded by the mechanical engineering department and the Vice-Presidency for Research & Creation at Universidad de los Andes. Experimental data was provided by e.ray Europa Gmbh.
Institutional Review Board Statement
Not applicable.
Informed Consent Statement
Not applicable.
Acknowledgments
The authors acknowledge the support of the department of mechanical engineering at Universidad de los Andes for providing the computational resources (software and hardware) for the present study. All authors acknowledge financial support provided by the Vice Presidency for Research & Creation publication fund at the Universidad de los Andes to cover for APC.
Conflicts of Interest
The authors declare no conflict of interest.
References
- Khana, M.J.; Bhuyana, G.; Iqbalb, M.T.; Quaicoe, J.E. Hydrokinetic energy conversion systems and assessment of horizontal and vertical axis turbines for river and tidal applications: A technology status review. Appl. Energy 2009, 86, 1823–1835. [Google Scholar] [CrossRef]
- Laws, N.D.; Epps, B.P. Hydrokinetic energy conversion: Technology, research, and outlook. Renew. Sustain. Energy Rev. 2016, 57, 1245–1259. [Google Scholar] [CrossRef] [Green Version]
- Ma, Y.; Hu, C.; Li, Y.; Deng, R. Research on the Hydrodynamic Performance of a Vertical Axis Current Turbine with Forced Oscillation. Energies 2018, 11, 3349. [Google Scholar] [CrossRef] [Green Version]
- Patel, V.; Eldho, T.I.; Prabhu, S.V. Performance enhancement of a Darrieus hydrokinetic turbine with the blocking of a specific flow region for optimum use of hydropower. Renew. Energy 2019, 135, 1144–1156. [Google Scholar] [CrossRef]
- Amet, E. Simulation Numerique d’une Hydrolienne à Axe Vertical de Type Darrieus. Ph.D. Thesis, Institut Polytechnique Grenoble, Grenoble, France, 2009. [Google Scholar]
- Hoerner, S.; Abbaszadeh, S.; Maître, T.; Cleynen, O.; Thévenin, D. Characteristics of the fluid–structure interaction within Darrieus water turbines with highly flexible blades. J. Fluids Struct. 2019, 88, 13–30. [Google Scholar] [CrossRef] [Green Version]
- Birjandi, A.; Bibeau, E. Frequency analysis of the power output for a vertical axis marine turbine operating in the wake. Ocean Eng. 2016, 127, 325–344. [Google Scholar] [CrossRef]
- Bachant, P.; Wosnik, M. Effects of Reynolds Number on the Energy Conversion and Near-Wake Dynamics of a High Solidity Vertical-Axis Cross-Flow Turbine. Energies 2016, 9, 73. [Google Scholar] [CrossRef] [Green Version]
- Rawlings, G. Parametric Characterization of An Experimental Vertical Axis Hydroturbine. Master’s Thesis, University of British Columbia, Vancouver, DC, Canada, 2008. [Google Scholar]
- Ouro, P.; Runge, S.; Stoesser, Q.T. Three-dimensionality of the wake recovery behind a vertical axis turbine. Renew. Energy 2019, 133, 1066–1077. [Google Scholar] [CrossRef] [Green Version]
- Akbarn, M.; Mustafa, V. A new approach for optimization of Vertical Axis Wind Turbines. J. Wind Eng. Ind. Aerodyn. 2016, 153, 34–45. [Google Scholar] [CrossRef]
- Ma, Y.; Lam, W.-H.; Cui, Y.; Zhang, T.; Jiang, J.; Sun, C.; Guo, J.; Wang, S.; Lam, S.S.; Hamill, G. Theoretical vertical-axis tidal-current-turbine wake model using axial momentum theory with CFD corrections. Appl. Ocean Res. 2018, 79, 113–122. [Google Scholar] [CrossRef] [Green Version]
- Goude, A.; Ågren, O. Simulations of a vertical axis turbine in a channel. Renew. Energy 2014, 63, 477–485. [Google Scholar] [CrossRef]
- Epps, B.; Roesler, B.; Medvitz, R.; Choo, Y.; McEntee, J. A viscous vortex lattice method for analysis of cross-flow propellers and turbines. Renew. Energy 2019, in press. [Google Scholar] [CrossRef]
- Chatelain, P.; Duponcheel, M.; Caprace, D.; Marichal, Y.; Winckelmans, G. Vortex particle-mesh simulations of vertical axis wind turbine flows: From the airfoil performance to the very far wake. Wind Energy Sci. 2017, 2, 317–328. [Google Scholar] [CrossRef] [Green Version]
- de Tavernier, D.; Ferreira, C. An extended actuator cylinder model: Actuator-in-actuator cylinder (AC-squared) model. Wind Energy 2019, 22, 1058–1070. [Google Scholar] [CrossRef]
- Mendoza, V. Aerodynamic Studies of Vertical Axis Wind Turbines using the Actuator Line Model. Ph.D. Thesis, Uppsala University, Upssala, Sweden, 2018. [Google Scholar]
- Madsen, H.; Paulsen, U.; Vitae, L. Analysis of VAWT aerodynamics and design using the Actuator Cylinder flow model. J. Phys. Conf. Ser. 2014, 555, 012065. [Google Scholar] [CrossRef] [Green Version]
- Balduzzi, F.; Bianchini, A.; Maleci, R.; Ferrara, G.; Ferrari, L. Critical issues in the CFD simulation of Darrieus wind turbines. Renew. Energy 2016, 85, 419–435. [Google Scholar] [CrossRef]
- Rezaeiha, A.; Kalkman, I.; Blocken, B. CFD simulation of a vertical axis wind turbine operating at a moderate tip speed ratio: Guidelines for minimum domain size and azimuthal increment. Renew. Energy 2017, 107, 373–385. [Google Scholar] [CrossRef] [Green Version]
- Maître, T.; Amet, E.; Pellone, C. Modeling of the flow in a Darrieus water turbine: Wall grid refinement analysis and comparison with experiments. Renew. Energy 2013, 51, 497–512. [Google Scholar] [CrossRef]
- McNaughton, J.; Afgan, I.; Apsley, D.D.; Rolfo, S.; Stallard, T.; Stansby, P.K. A simple sliding-mesh interface procedure and its application to the CFD simulation of a tidal-stream turbine. Int. J. Numer. Methods Fluids 2014, 74, 250–269. [Google Scholar] [CrossRef]
- Steger, L.J.; Dougherty, F.; Benek, J.A. A Chimera Grid Scheme. In Advances in Grid Generation; Ghia, K., Ghia, U., Eds.; American Society of Mechanical Engineers: Houston, TX, USA, 1983. [Google Scholar]
- Laín, S.; Taborda, M.A.; López, O.D. Numerical study of the effect of winglets on the performance of a straight blade Darrieus water turbine. Energies 2018, 11, 297. [Google Scholar] [CrossRef] [Green Version]
- López, O.D.; Quiñones, J.J.; Laín, S. RANS and Hybrid RANS-LES Simulations of an H-Type Darrieus Vertical Axis Water Turbine. Energies 2018, 11, 2348. [Google Scholar]
- Kozak, P. Effects of Unsteady Aerodynamics on Vertical-Axis Wind Turbine Performance. Master’s Thesis, Illinois Institute of Technology, Chicago, IL, USA, 2014. [Google Scholar]
- McLean, D. Development of the Dual-Vertical-Axis Wind Turbine with Active Blade Pitch Control. Master’s Thesis, Concordia University, Montreal, QC, Canada, 2017. [Google Scholar]
- Lei, H.; Su, J.; Bao, Y.; Chen, Y.; Han, Z.; Zhou, D. Investigation of wake characteristics for the offshore floating vertical axis wind turbines in pitch and surge motions of platforms. Energy 2019, 166, 471–489. [Google Scholar] [CrossRef]
- Kinsey, T.; Dumas, G. Impact of channel blockage on the performance of axial and cross-flow hydrokinetic turbines. Renew. Energy 2017, 103, 239–254. [Google Scholar] [CrossRef]
- Gorle, J.; Chatellier, L.; Pons, F.; Ba, M. Modulated circulation control around the blades of a vertical axis hydrokinetic turbine for flow control and improved performance. Renew. Sustain. Energy Rev. 2019, 105, 363–377. [Google Scholar] [CrossRef]
- Suarez, F. Parameter Study of a Ducted H-Darrieus Rotor in a Hydrokinetic Power Plant: Numerical Simulation. Master’s Thesis, TU Darmstadt, Darmstadt, Germany, 2015. [Google Scholar]
- Miller, M.A.; Duvvuri, S.; Kelly, W.D.; Hultmark, M. Rotor solidity effects on the performance of vertical-axis wind turbines at high Reynolds numbers. J. Phys. Conf. Ser. 2018, 1037, 052015. [Google Scholar] [CrossRef]
- López, O.; Meneses, D.; Quintero, B.; Laín, S. Computational study of transient flow around Darrieus type cross flow water turbines. J. Renew. Sustain. Energy 2016, 8, 014501. [Google Scholar] [CrossRef]
- Laín, S.; Cortés, P.; López, O.D. Numerical Simulation of the Flow around a Straight Blade Darrieus Water Turbine. Energies 2020, 13, 1137. [Google Scholar] [CrossRef] [Green Version]
Publisher’s Note: MDPI stays neutral with regard to jurisdictional claims in published maps and institutional affiliations. |
© 2021 by the authors. Licensee MDPI, Basel, Switzerland. This article is an open access article distributed under the terms and conditions of the Creative Commons Attribution (CC BY) license (https://creativecommons.org/licenses/by/4.0/).

