1. Introduction
With a sea area of 6.32 million km
2 and a coastline of 99,093 km, Indonesia is one of the world’s largest maritime countries [
1]. The fisheries sector contributes significantly to national development by creating jobs, diversifying livelihoods, supplying animal protein, and earning foreign exchange. About 6.4 million Indonesians are employed directly as a result of the seafood business, which contributes 3.1% to national GDP and 21% to agricultural GDP, earning US
$ 4.2 billion in 2012 from seafood exports and supplying 54.8% of the country’s animal protein needs [
2,
3]. Indonesia’s wealth in fisheries products does not match the country’s infrastructure for fishery support [
4,
5]. For Indonesia’s fish processing industries, the most pressing problem is a lack of high-quality infrastructures such as cold storage and filleting technologies, which makes it difficult to maintain a steady supply of raw materials.
In comparison to competitor countries, Indonesian fishery products remain low. Indonesia is regarded as the world’s second-largest producer of fishing after China and the world’s third-largest producer of aquaculture after China and India. However, Indonesia ranks only in the top 10 global exporters of fishery products. The low export value of Indonesian fishery products on the international market is to blame for this situation. As a result, advanced technologies are critical for export product competitiveness [
1].
Fishers face a significant challenge in the form of seasonal factors. During the harvest season, fish production may be abundant, but conditions may be the inverse during the dry season. Fish must be available at all times for both consumers (community) and industry [
6]. In light of recent technological advancements, marine management must become more innovative and prioritize high-quality fish. Fresh fish contains up to 80% water and short shelf life because it is perishable [
7,
8]. Protein nutrient degradation occurs in fresh fish if it is not used immediately or stored in the refrigerator. Frozen fish products should be stored at a temperature appropriate to the species, product type, and intended storage time [
9]. One method of preserving fish quality is by the use of cold storage [
10,
11]. Keeping high-quality fish impacts the stability of fish prices and the income of fishers [
12].
Due to the increasing demand for and supply of fishery and aquaculture products, the fishing industry is one of the most energy-intensive industries in the world. In the fishing business, the principal energy sources are electricity and liquid fuels. These fuels are used for various purposes, from fishing (upstream) to product packing (downstream). There is a substantial quantity of electricity used by refrigeration equipment. The electricity that is dependable and efficient is required to cool fish in cold storage [
13,
14]. This means fishery industries have to undergo an energy transition because it uses a lot of energy, especially in the cold storage sector [
15]. The implementation of renewable energy efficiency and medium and long-term energy supply strategy are two of today’s most pressing energy market issues [
16]. It is also in line with the Paris Conference of the Parties (COP) 21 agreement to limit global temperature increases to 1.5 degrees Celsius [
17]. They are increasingly relying on renewable energy due to their increased environmental consciousness and adoption of more renewable energy legislation. However, the most significant barrier to successfully implementing the Renewable Energy concept is a lack of capital to invest in the Renewable Energy project for the fisheries sector. As a result, further development of alternative microfinance instruments is required for successful implementation [
18].
Indonesia has an immense renewable energy potential. Power generation from renewable sources has been predicted to be 716 GW. Under Indonesia’s current national energy policy, the country’s energy consumption is expected to rise 23% by 2025 and 31% by 2050 [
19,
20]. However, research on the hybrid refrigeration system of solar energy and cooling system is still limited. Solar energy (or photovoltaic) is one of the most environmentally friendly, cost-effective, and abundant alternative renewable energy sources available today. Solar-powered refrigerator performance tests in various climate zones strongly support solar energy as a viable energy resource for the refrigeration system. According to experimental results, the refrigerator performed well in a variety of climates and regions, according to experimental results. Solar-powered refrigeration systems have also been investigated to determine the various parameters (for example, time of day and cooling load) influencing system performance (e.g., energy consumption and power production on solar panels). To that end, collecting and utilizing solar energy to provide a portion of power for hybrid refrigeration systems during fish storing processes on bays and estuaries may play a critical role in reducing fuel and energy consumption from the cooling system [
21].
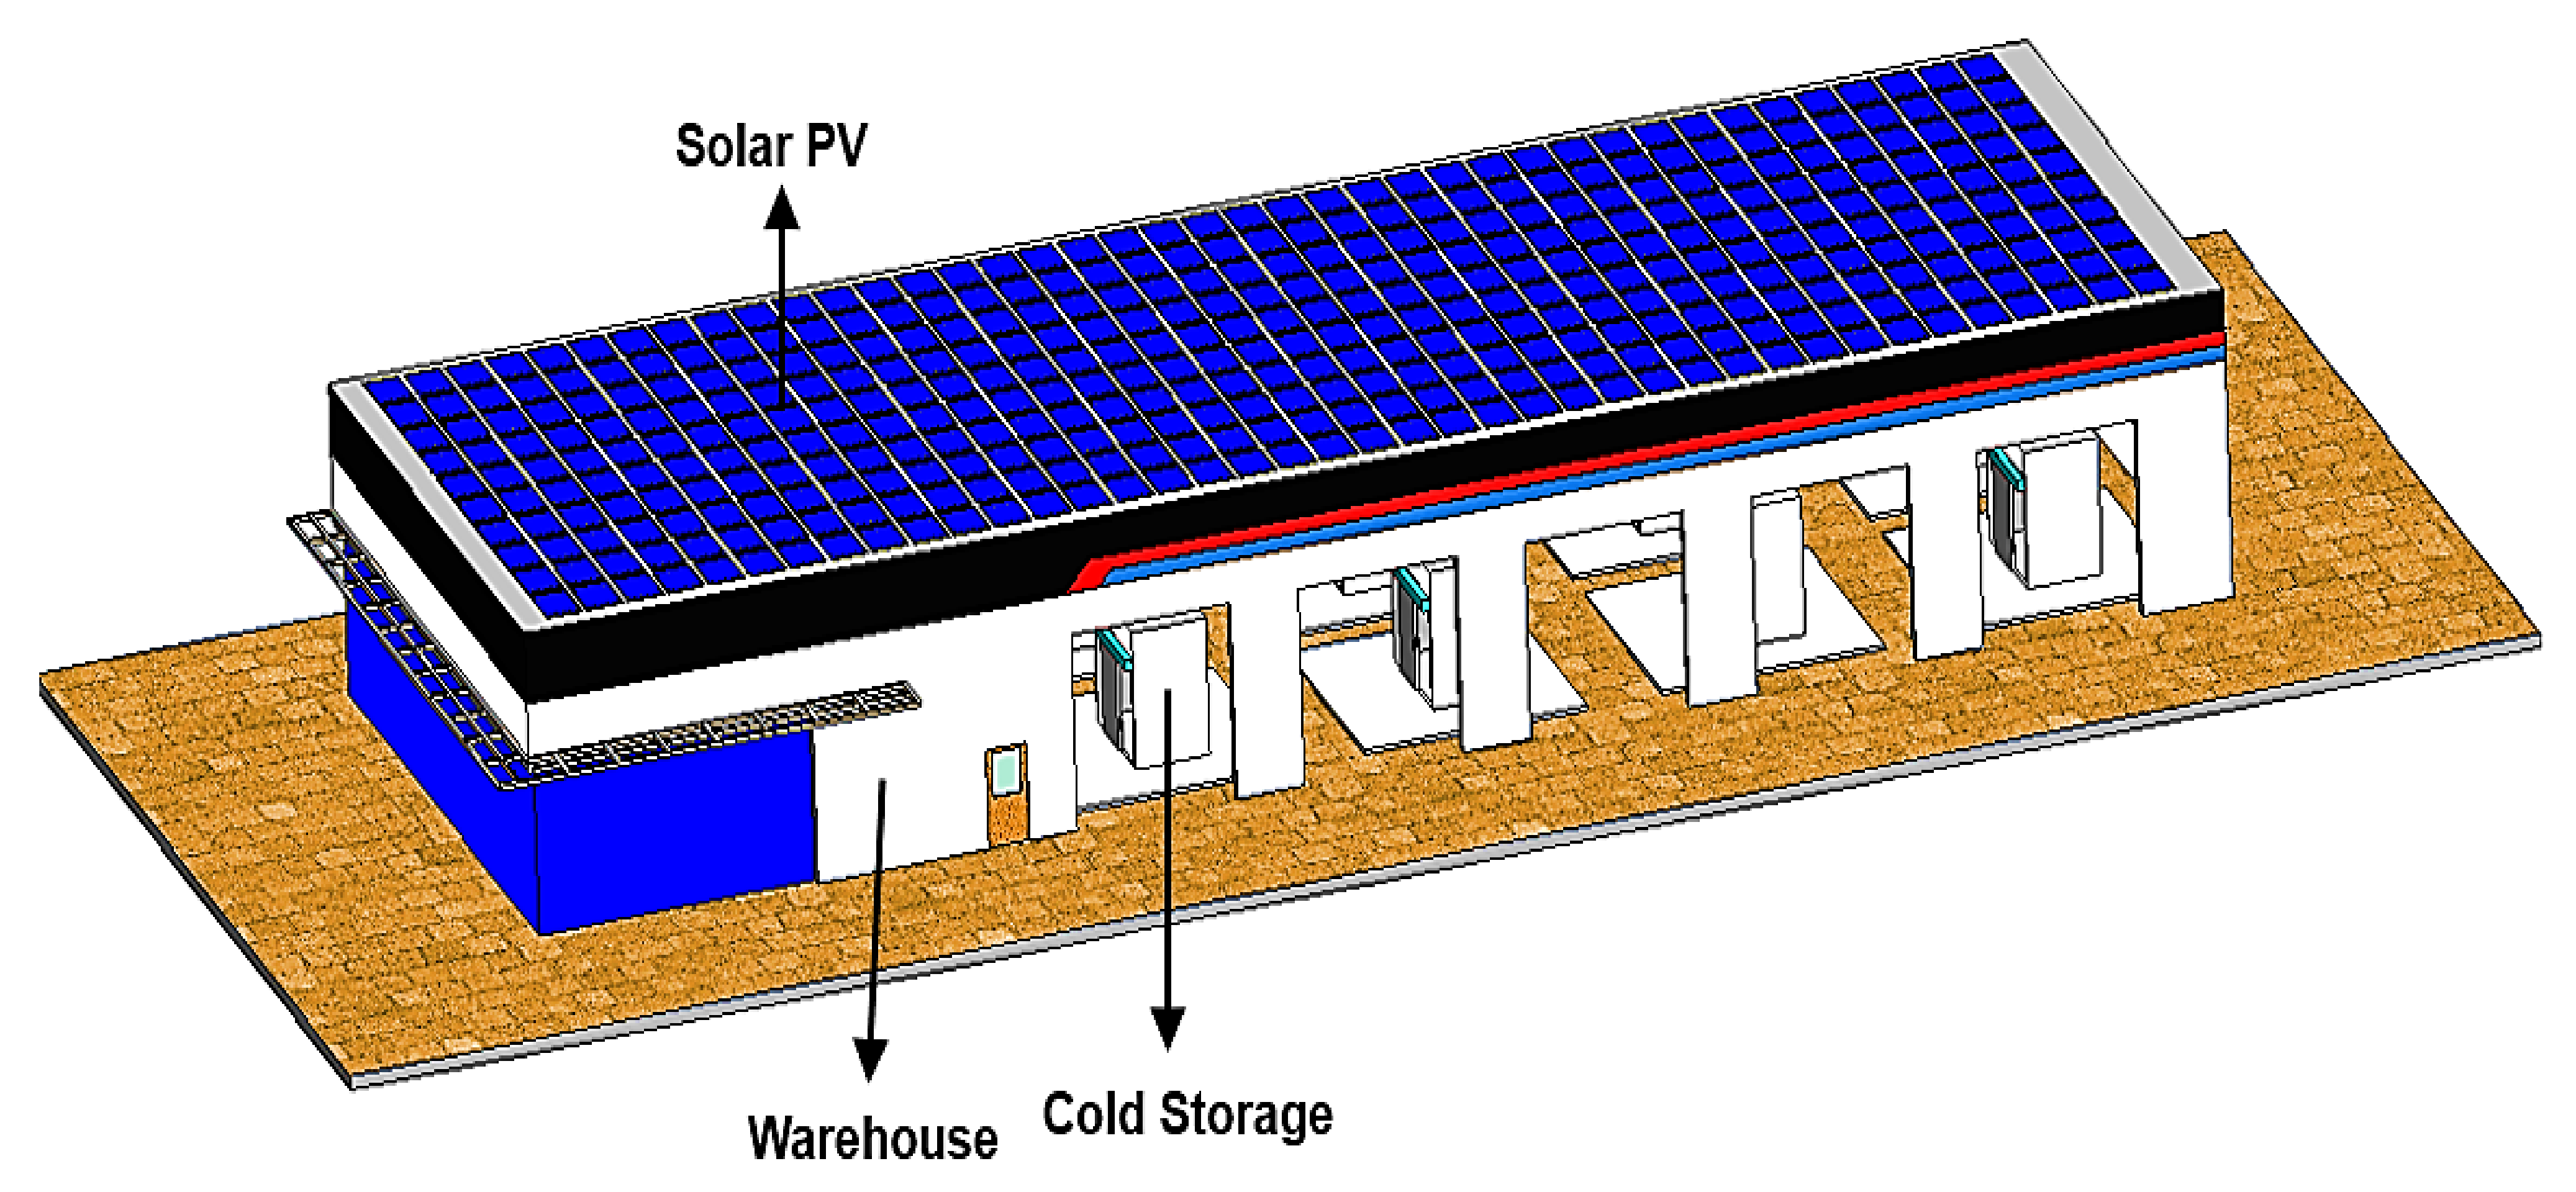
Figure 1 depicts solar panels installed on the roof of a cold storage facility.
In Indonesia, solar energy is one of the most extensively used forms of clean, renewable power. Due to a year-round steady irradiation rate, Indonesia has sufficient access to daily solar energy. Due to the country’s high daily sun irradiation, Indonesia has an estimated solar energy potential of more than 207.3 gigawatts (GW) [
22,
23]. The Minister for Energy and Mineral Resources’ Regulation No 49/2018 allows Customers of the National Utility Grid can use solar photovoltaic (PV) systems to supplement their electricity needs and export any excess power back to them. Users cannot “sell” electricity to the national utility grid when they have excess energy from the PV System under the proposed rule because they cannot “pay” its customers under the law. Additionally, owners receive credit for excess electricity, which they can use to lower their monthly electric bills. A maximum of three months will be allowed before the credit term expires [
23,
24].
With cold storage at the fish auction place, the price and quality of fish will be more promising. Then with the inclusion of cheap Renewable Energy, in this case, solar PV will reduce the operating cost of cold storage. Then the Ownership Model of Cold Storage needs to be reviewed to be a reference for investors and coastal communities to build cold storage. New regulations are required to encourage the fisheries sector by reducing regulatory restrictions on the use of PV on-grid to achieve affordable electricity prices and higher incomes for fishers. Therefore, by obtaining the optimum configuration for installing the PV system in cold storage, a reduction in cold storage operating costs is obtained so that the cold storage rental price can be cheaper. We also obtain the optimum configuration based on the simulation of regulatory scenarios using solar PV in Indonesia.
2. Materials and Methods
There are 576 fishing ports spread across all provinces in Indonesia. Fishery ports in Indonesia are divided into four categories as stated in the Regulation of the Minister of Marine Affairs and Fisheries Number: PER.08/MEN/2012. That category is: Class A fishing port, called Ocean Fishing Port (PPS); Class B fishing port, called Nusantara Fishery Port (PPN); Fishing Port class C, called Coastal Fishing Port (PPP); Fishing Port class D, called Fish Landing Base (PPI). In this research, data collection and observations were carried out at the Dadap Village fish auction, West Java. Dadap fish auction place is included in the fishing port class D with an average annual income of USD 1.9 million. Therefore, the Dadap fish auction place can represent fish auction places throughout Indonesia because Class D fishing ports are the most numerous in Indonesia, with a total of 526 fishing ports out of 576 fishing ports throughout Indonesia which are 91% [
25]. Regarding the source of solar irradiation at the Dadap Village fish auction place, it has 5.08 kWh/m
2. The average Indonesian solar irradiation is 4.8 kWh/m
2, with a typical solar irradiation duration in all regions of Indonesia for 6–8 h per day. Uniform sunshine duration because Indonesia is at the equator [
26].
The initial stage in this study is to determine the capacity of cold storage. After that, we choose cold storage equipment based on the requirements specified in the technical specifications. For the cold storage system electrical load profile to be determined, the power capacity of the equipment is required to be known. The next step is to establish energy system topologies and capacities using the solar PV regulation scenario. Then compute the LCOE for each energy system topology using the ownership model, and enter the results into the cold storage cash flow. The calculations also determine a cold storage rental price, which will be charged to fishers.
2.1. Determine Cold Storage Capacity
From 2016 to 2020,
Figure 2 depicts the trend of fishing results at the Dadap fish auction site in West Java, Indonesia.
Figure 2 depicts the monthly variation in fishing yields during a year in which the catch increased sharply beginning in March, declined sharply in June, and then increased again in September. Due to the east wind season, every June, many fishers do not go out to sea. It will have an impact on the stability of fish prices, fisher income, and fish quality. Then, a trend graph is required to obtain the trend pattern in 5 years of fish production.
Figure 3 depicts the central tendency of statistical data, which defines the mean, median, and ideal pattern [
27]. Cold storage is expected to improve the quality of fish so that fishers can sell fish at high prices. Then, cold storage is expected to overcome fluctuations in fish production at the Dadap fish auction place, where the trend of fish production will correspond to the grey line in the graph in
Figure 3. Fishers can store excess fish from March to April and sell them from June to August when low production. Cold storage capacity is calculated using average monthly fish production data from the Dadap Village Fish Auction Place in West Java. According to the data, the average monthly production from 2016 to 2020 is 182 tons. The Republic of Indonesia’s Ministry of Maritime Affairs and Fisheries, through technical guidance, offers options for the development of cold storage capacities of 100 and 200 tons. According to data from fish auction sites in Dadap Village, West Java, the cold storage will require 200 tons of capacity.
2.2. Cold Storage Specifications
Figure 4 depicts a condensing unit, which is used for cooling, freezing, and air conditioning. It is installed in refrigerated and frozen desks, boxes, beverage dispensers, and display cabinets. Condensing units are available in various designs by modifying the following components: receivers, valves, mounting, sight glass, supply cables, insulation on suction tubes, and others. They make use of the refrigerants R134a and R404A. It is manufactured in a standard version or to meet the customer’s specific needs [
29].
A refrigerant compressor, a driving motor, a condenser with a fan, and other accessories are essential components of a condensing unit. The condenser is a device that converts high-temperature, high-pressure gas refrigerant exiting the compressor to liquid refrigerant. A schematic diagram of a condensing unit is shown in
Figure 5. The compressor is the important part of cooling system’s An inlet (suction) valve feeds the gaseous refrigerant to the compressor. The refrigerant is compressed and heated by the hermetic closed compressor [
29].
The condenser cools and condenses the refrigerant from the gaseous to the liquid state. The condenser is a heat exchanger in which the working medium condenses, and a cooling substance removes superheated heat. It is constructed of Cu tubes and Al fins. The fan motors are held in place by a support grid on the condenser plenum, saving space and making handling easier. A wire is detachable from the fan motors. The liquid refrigerant is wholly separated from the gaseous refrigerant in the receiver. Coolant is only transported in liquid form from the receiver to the outlet (discharge) valve.
The increased use of refrigerants is already putting significant strain on power systems and increasing peak electricity demand, particularly in countries with high ambient temperatures. As cooling demand grows, countries will need to consider large investments in power generation equipment and electricity transmission and distribution systems [
30]. In terms of the environment, safety, and sustainability, the refrigerant selection is critical. Cost reduction is a significant driver in cold-chain industries. This can be accomplished by reducing energy consumption (and thus indirect emissions) or operating the store during lower energy tariffs (a practice known as ‘load shifting’). The design of the store and how it is used are critical aspects of reducing energy consumption. The loss of refrigerants in cold stores also contributes to direct emissions. In the current market, using environmentally friendly low global warming potential (GWP) refrigerants is a significant issue [
31]. Based on the regulation of the minister of industry number 41/2014, the use of hydrochlorofluorocarbons (HCFC) in the refrigerant sector is prohibited. This is because HCFC is a type of ozone-depleting substance. Therefore, the minimum allowed use of refrigerants is R404a because that type has zero ozone depletion potential (ODP). Although there are technologies that are more friendly to ODP, the price of these refrigerants is still high.
It can be seen in
Table 1 that a condensing unit with 18 horsepower (HP) for Cold Storage (CS) and seven horsepower (HP) for anteroom is required for 200-ton cold storage. Then, for cold storage, a polyurethane wall is required as insulation. These details also include cold storage installation services, which cost a total of
$126,357 to install. Costs for cold storage installation are gathered from an Indonesian cold storage contractor.
2.3. Cold Storage’s Electricity Load Profile
Table 2 shows that cold storage’s power consumption is made by the condensing unit and lighting, which requires total electrical energy to run cold storage with an overall capacity of 60 kW. Five compressors require electricity, which are four compressors for cold storage and 1 for anteroom. The determination of the daily load profile follows the compressor engine’s power consumption that refers to its technical specifications. In the compressor’s technical specification, two parameters affect the compressor’s power consumption: ambient temperature and evaporating temperature. We use power consumption data for ambient temperature parameters at 27 degrees Celsius in the evening until morning (5 pm–7 am) and 32 degrees Celsius in the morning until afternoon (8 am–4 pm). For evaporating temperature parameter, it is necessary to store the fish in cold storage at a temperature of-20 degrees Celsius to ensure the fish’s quality does not decrease after being caught by the fishermen [
9]. The evaporating temperature in −20 degrees Celsius is defined as cold storage’s power consumption in regular operation. Cold storage’s power consumption may not always be in regular operation, and there will be a time when power consumption increases. In this case, we assume fluctuations in cold storage’s load profile from the frequency of activities in cold storage. Fish mobilization activities in cold storage cause an increase in power consumption in cold storage due to the frequent opening and closing of cold storage doors. The activities most often occur in the morning when the fishermen have pulled over at the fish auction place. We got the same reference with other research [
14], with the same cold storage capacity and mobilization time. Then the characteristics of the region are also the same (north coast of Java). Therefore, a graph of the electrical load profile of the cold storage is obtained according to
Figure 6.
Figure 6 depicts the daily load profile under conditions of 32 degrees Celsius during the day and 27 degrees Celsius at night. The maximum load on this load profile is 52.19 kW, the minimum load is 30 kW, and the average load is 38.61 kW. Furthermore, the random load variability is 3%, allowing the cold storage peak load to reach 59.71 kW. Cold Storage uses 926.54 kWh of electricity per day on average.
2.4. Energy System Topologies Based on Regulation Assumption
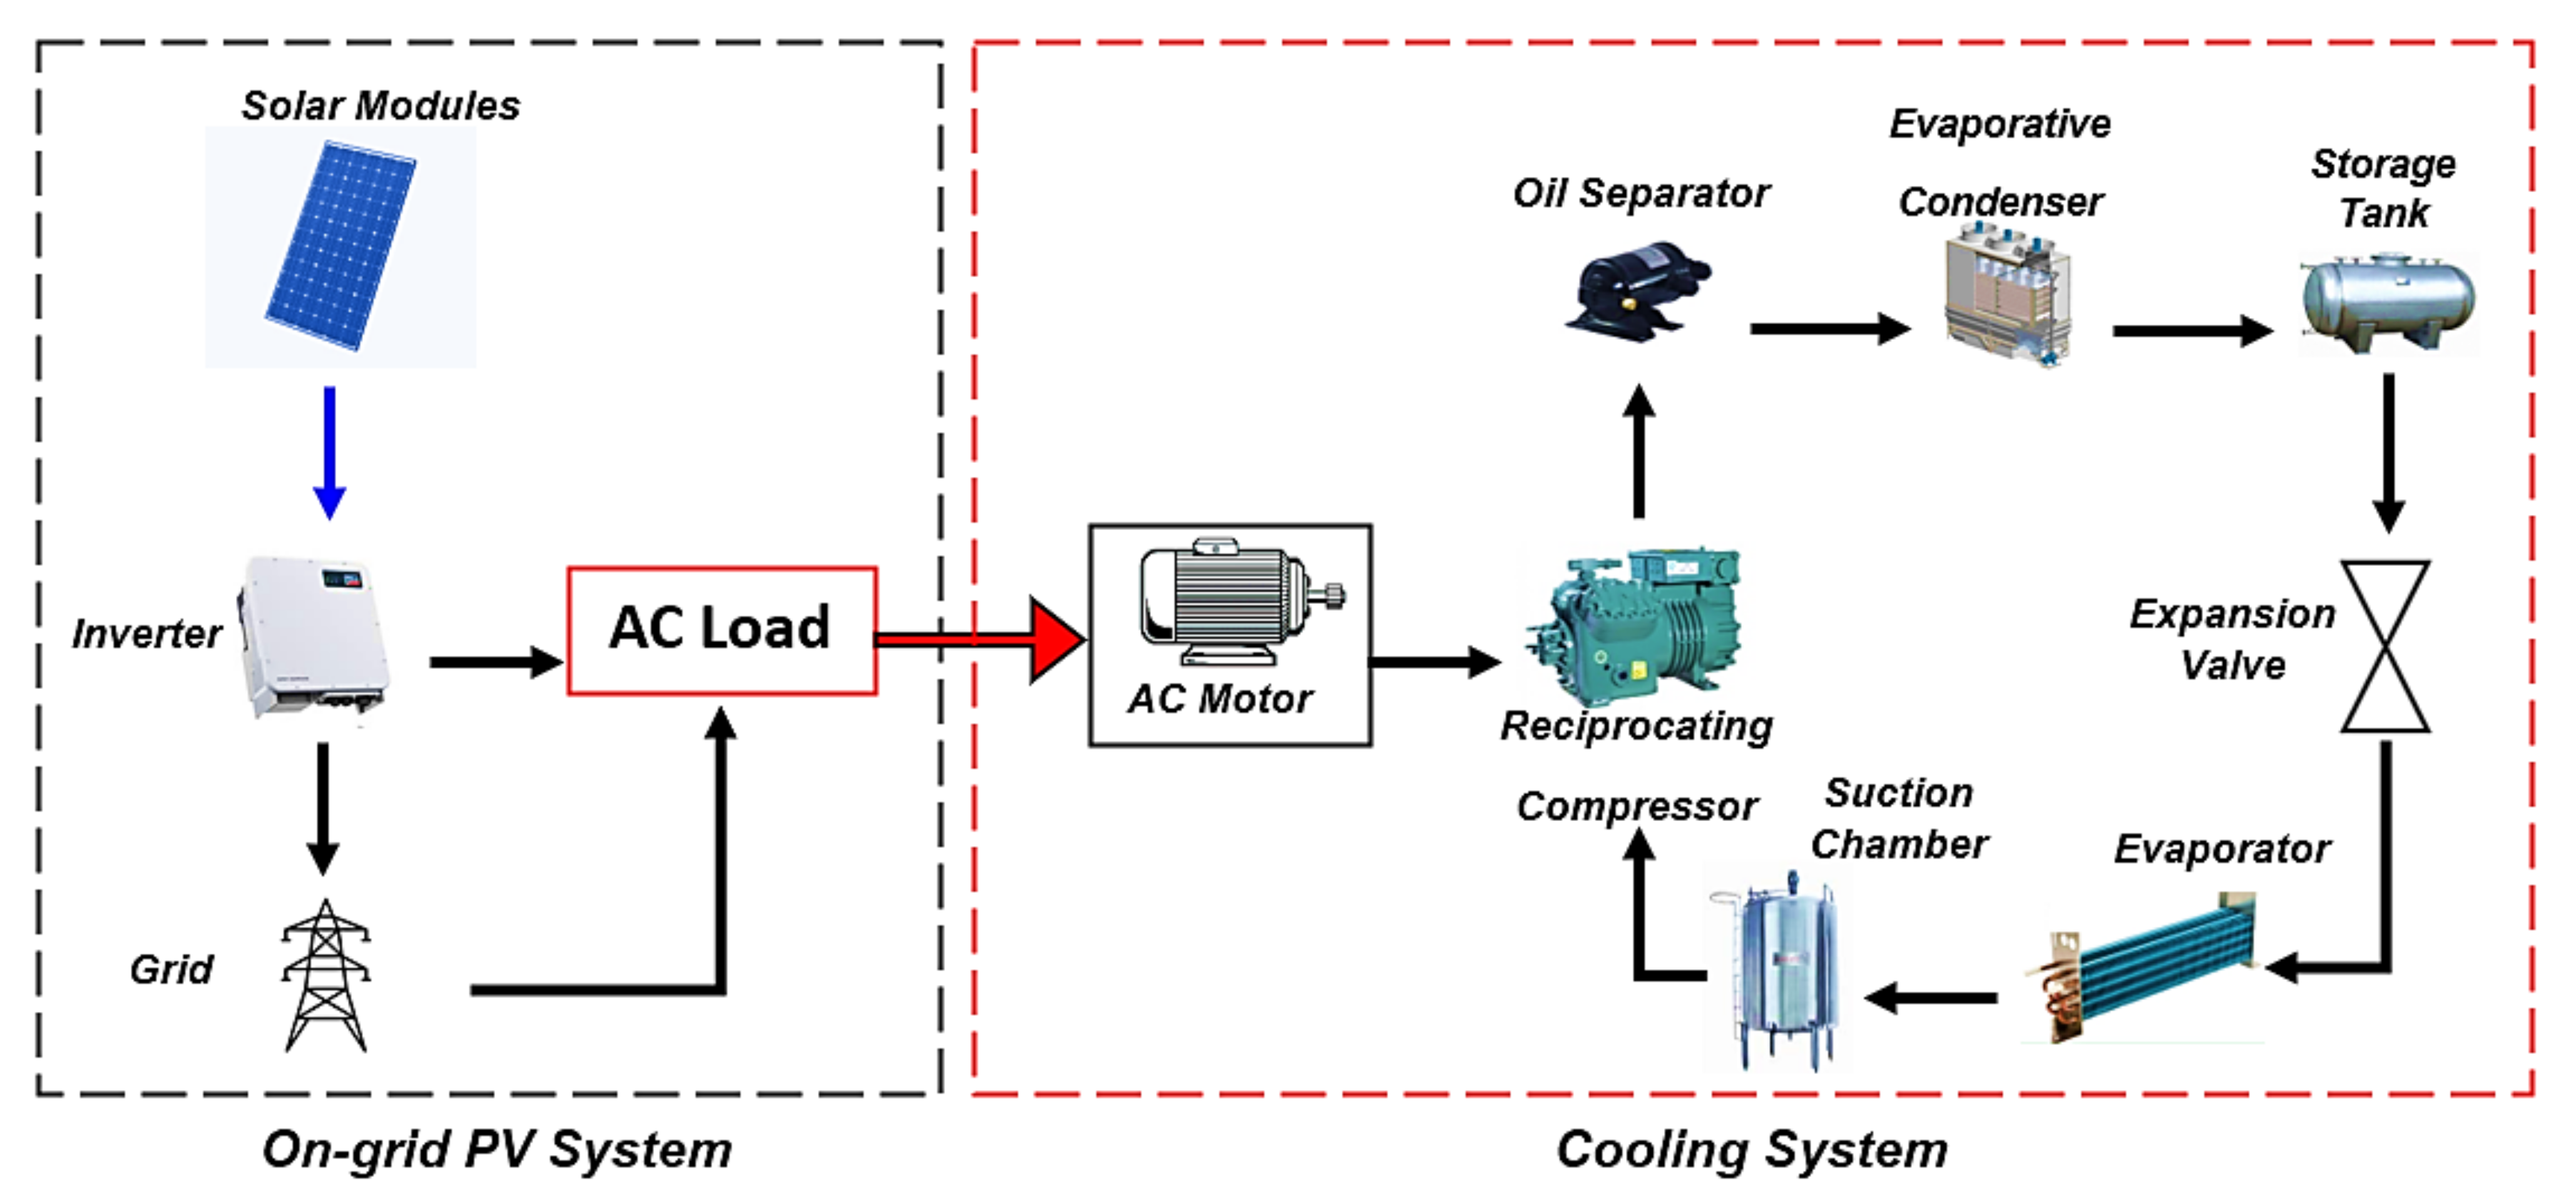
The schematic diagram in
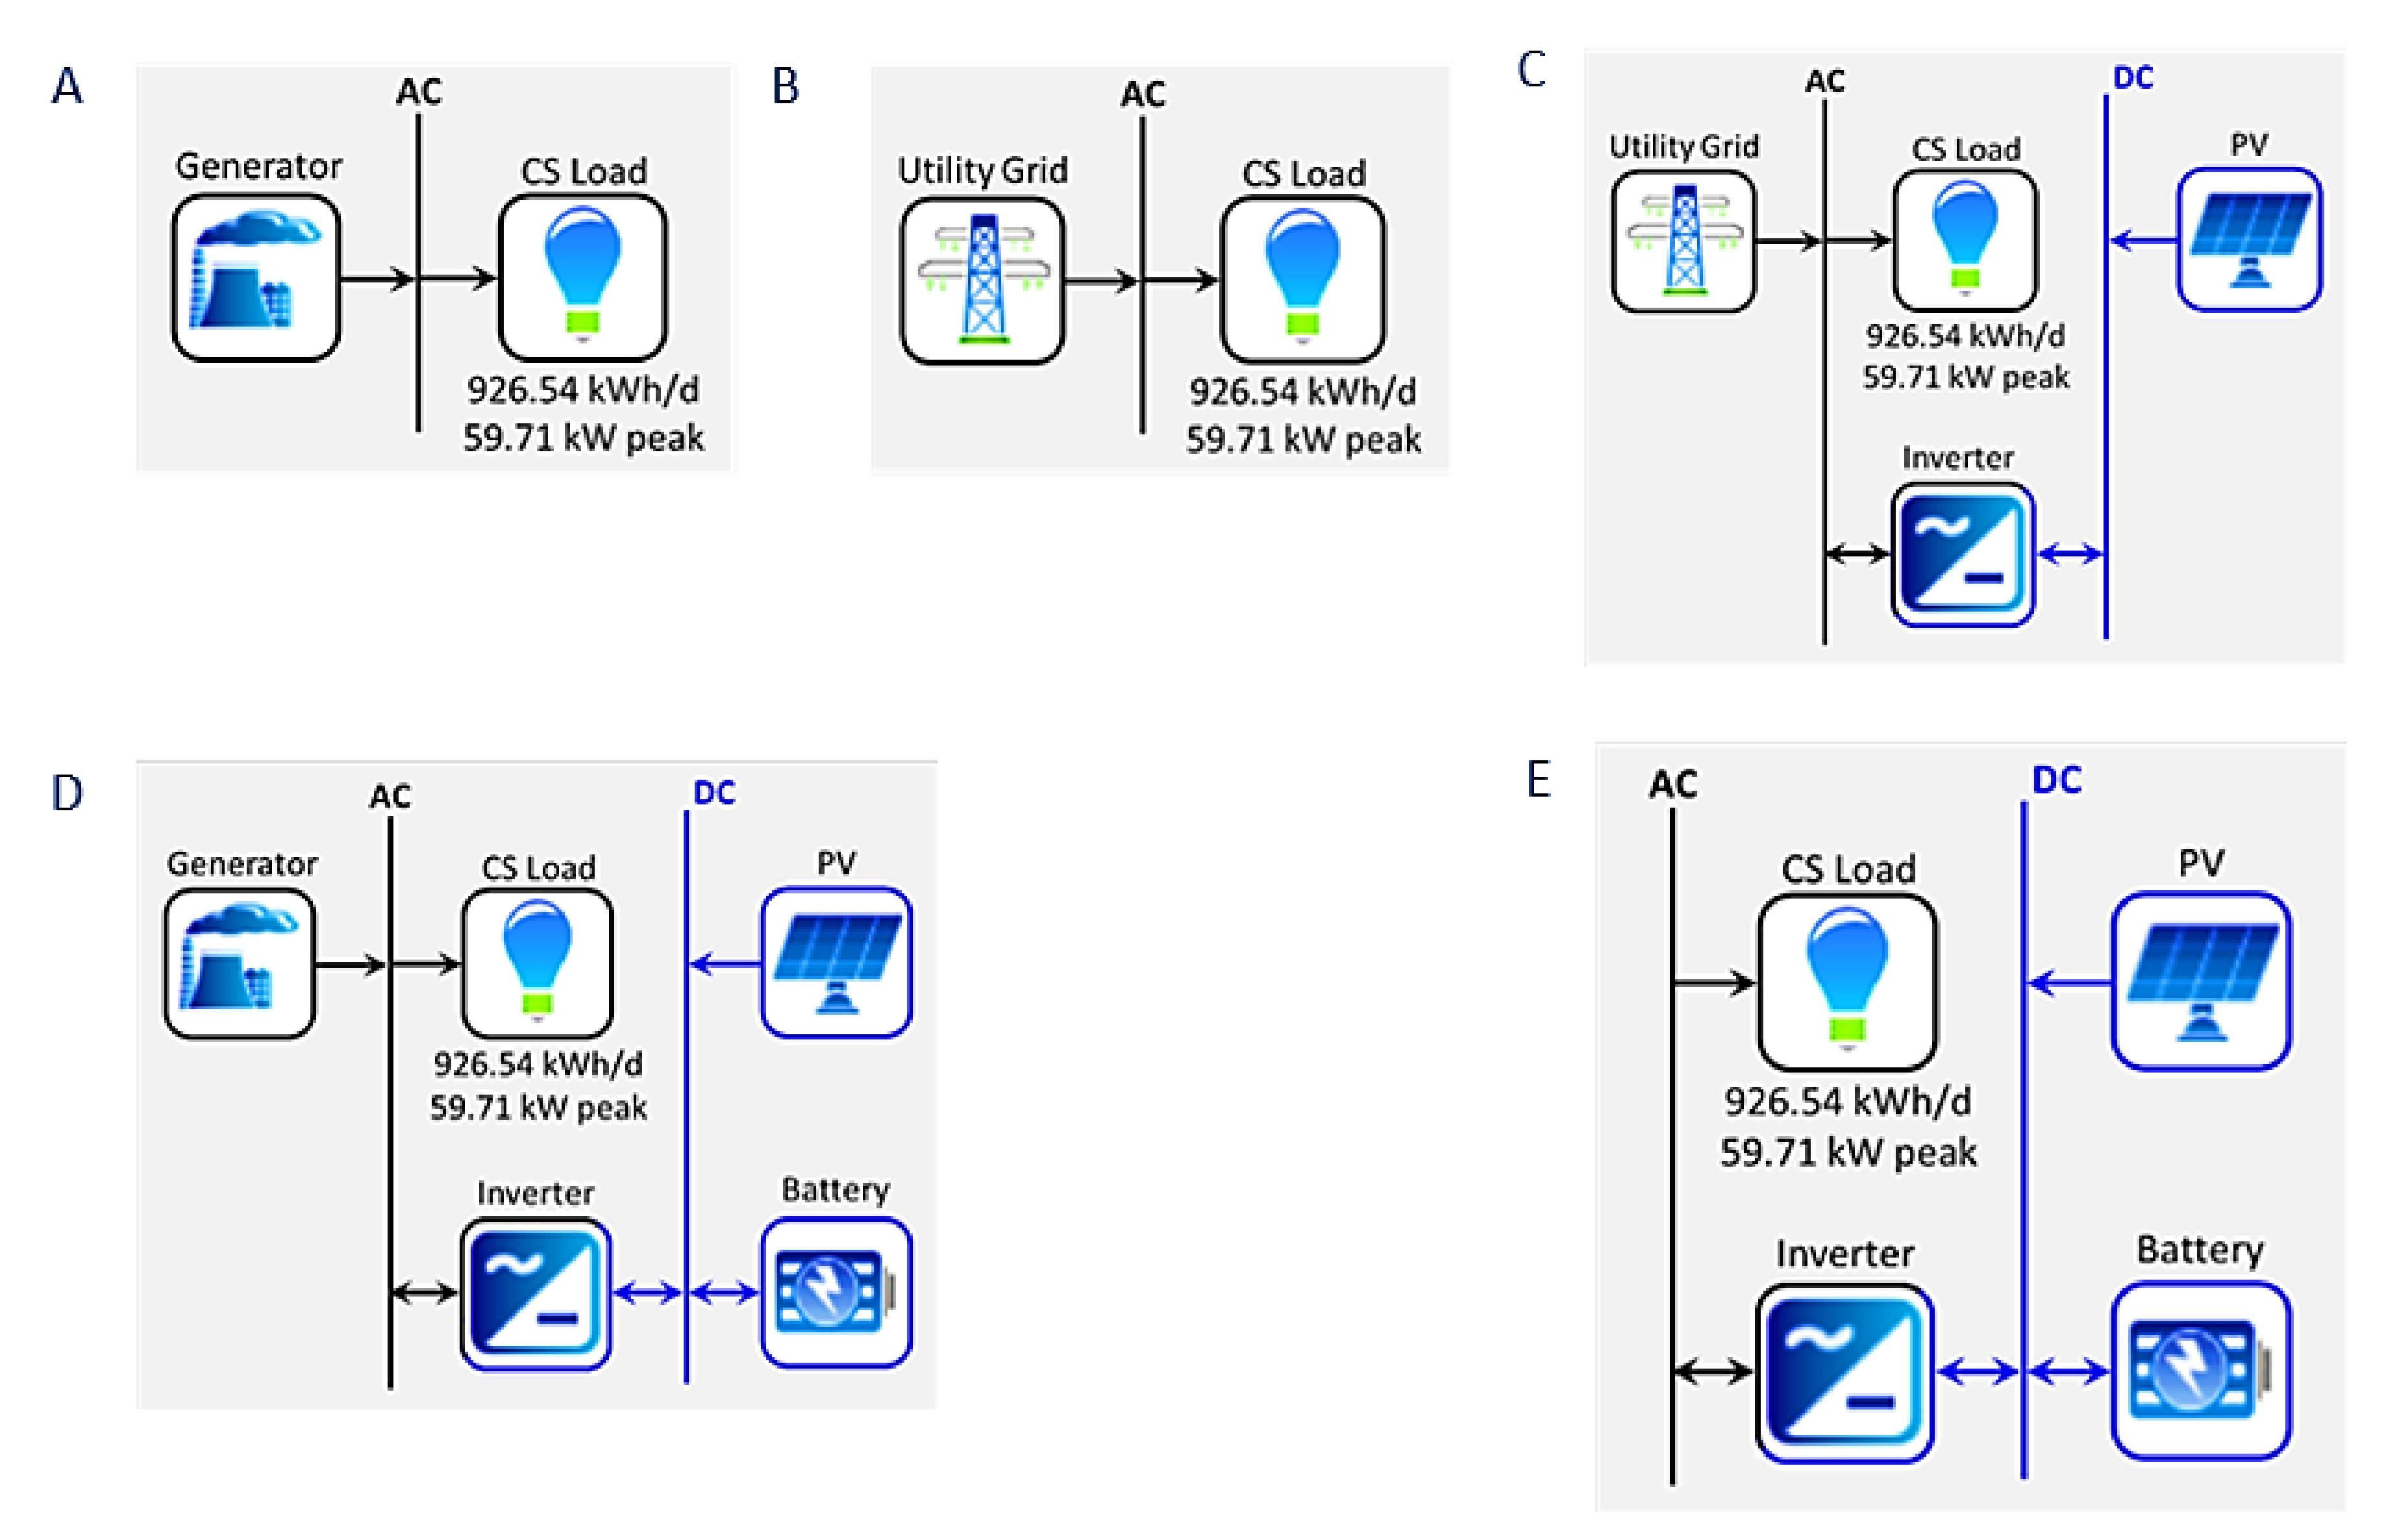
Figure 7 describes how the energy system works to operate a cold storage machine. There are five types of energy systems shown in
Figure 8: a generator; a utility grid; on-grid photovoltaics; and off-grid photovoltaics with a battery. This research uses Homer software in order to optimize the sizing of the energy system’s topology.
We employ a 70 kW generator with a lifespan of 80,000 h and a maintenance cost of
$0.098 per hour for the generator energy system scheme, according to Homer Data. According to a Generator Provider Company, the initial cost of purchasing a generator with 70 kW capacity is
$14,286. The Indonesian Government stipulated that the cost of industrial diesel fuel is
$0.72 per litter [
32].
The succeeding scheme is the Utility Grid. 200-ton cold storage capacity requires 60 kW total electricity capacity. The cold storage will subscribe electricity to a utility grid of 82.5 kVA capacity at a business rate of $0.1 per kWh based on the Minister of Energy, Mineral and Resources Republic of Indonesia. The cost to install the 82.5 kVA utility grid is $5710 according to Utility Grid Company tariff.
Installation of solar panels shall have sufficient irradiation values; the mean solar Global Horizontal Index (GHI) per day in Dadap Village, West Java, shall be 5.08 kWh/m2. Solar resources data has been obtained from the NASA Prediction of Worldwide Energy Resource (Power) Database in the last 22 years. Homer accepts solar radiation data as monthly averages or as a time series. Installation of solar panels in cold storage requires an adequate roof area. According to Technical Instruction from the Ministry of Fisheries and the Marine Republic of Indonesia, cold storage roof area of 200 tons, covering 600 m2. Canadian Solar CS6U-340M solar panel with 340 Wp per panel capacity has 2 m2 cross-section area for one panel, so cold storage’s roof can be installed 100 kWp PV capacity in total.
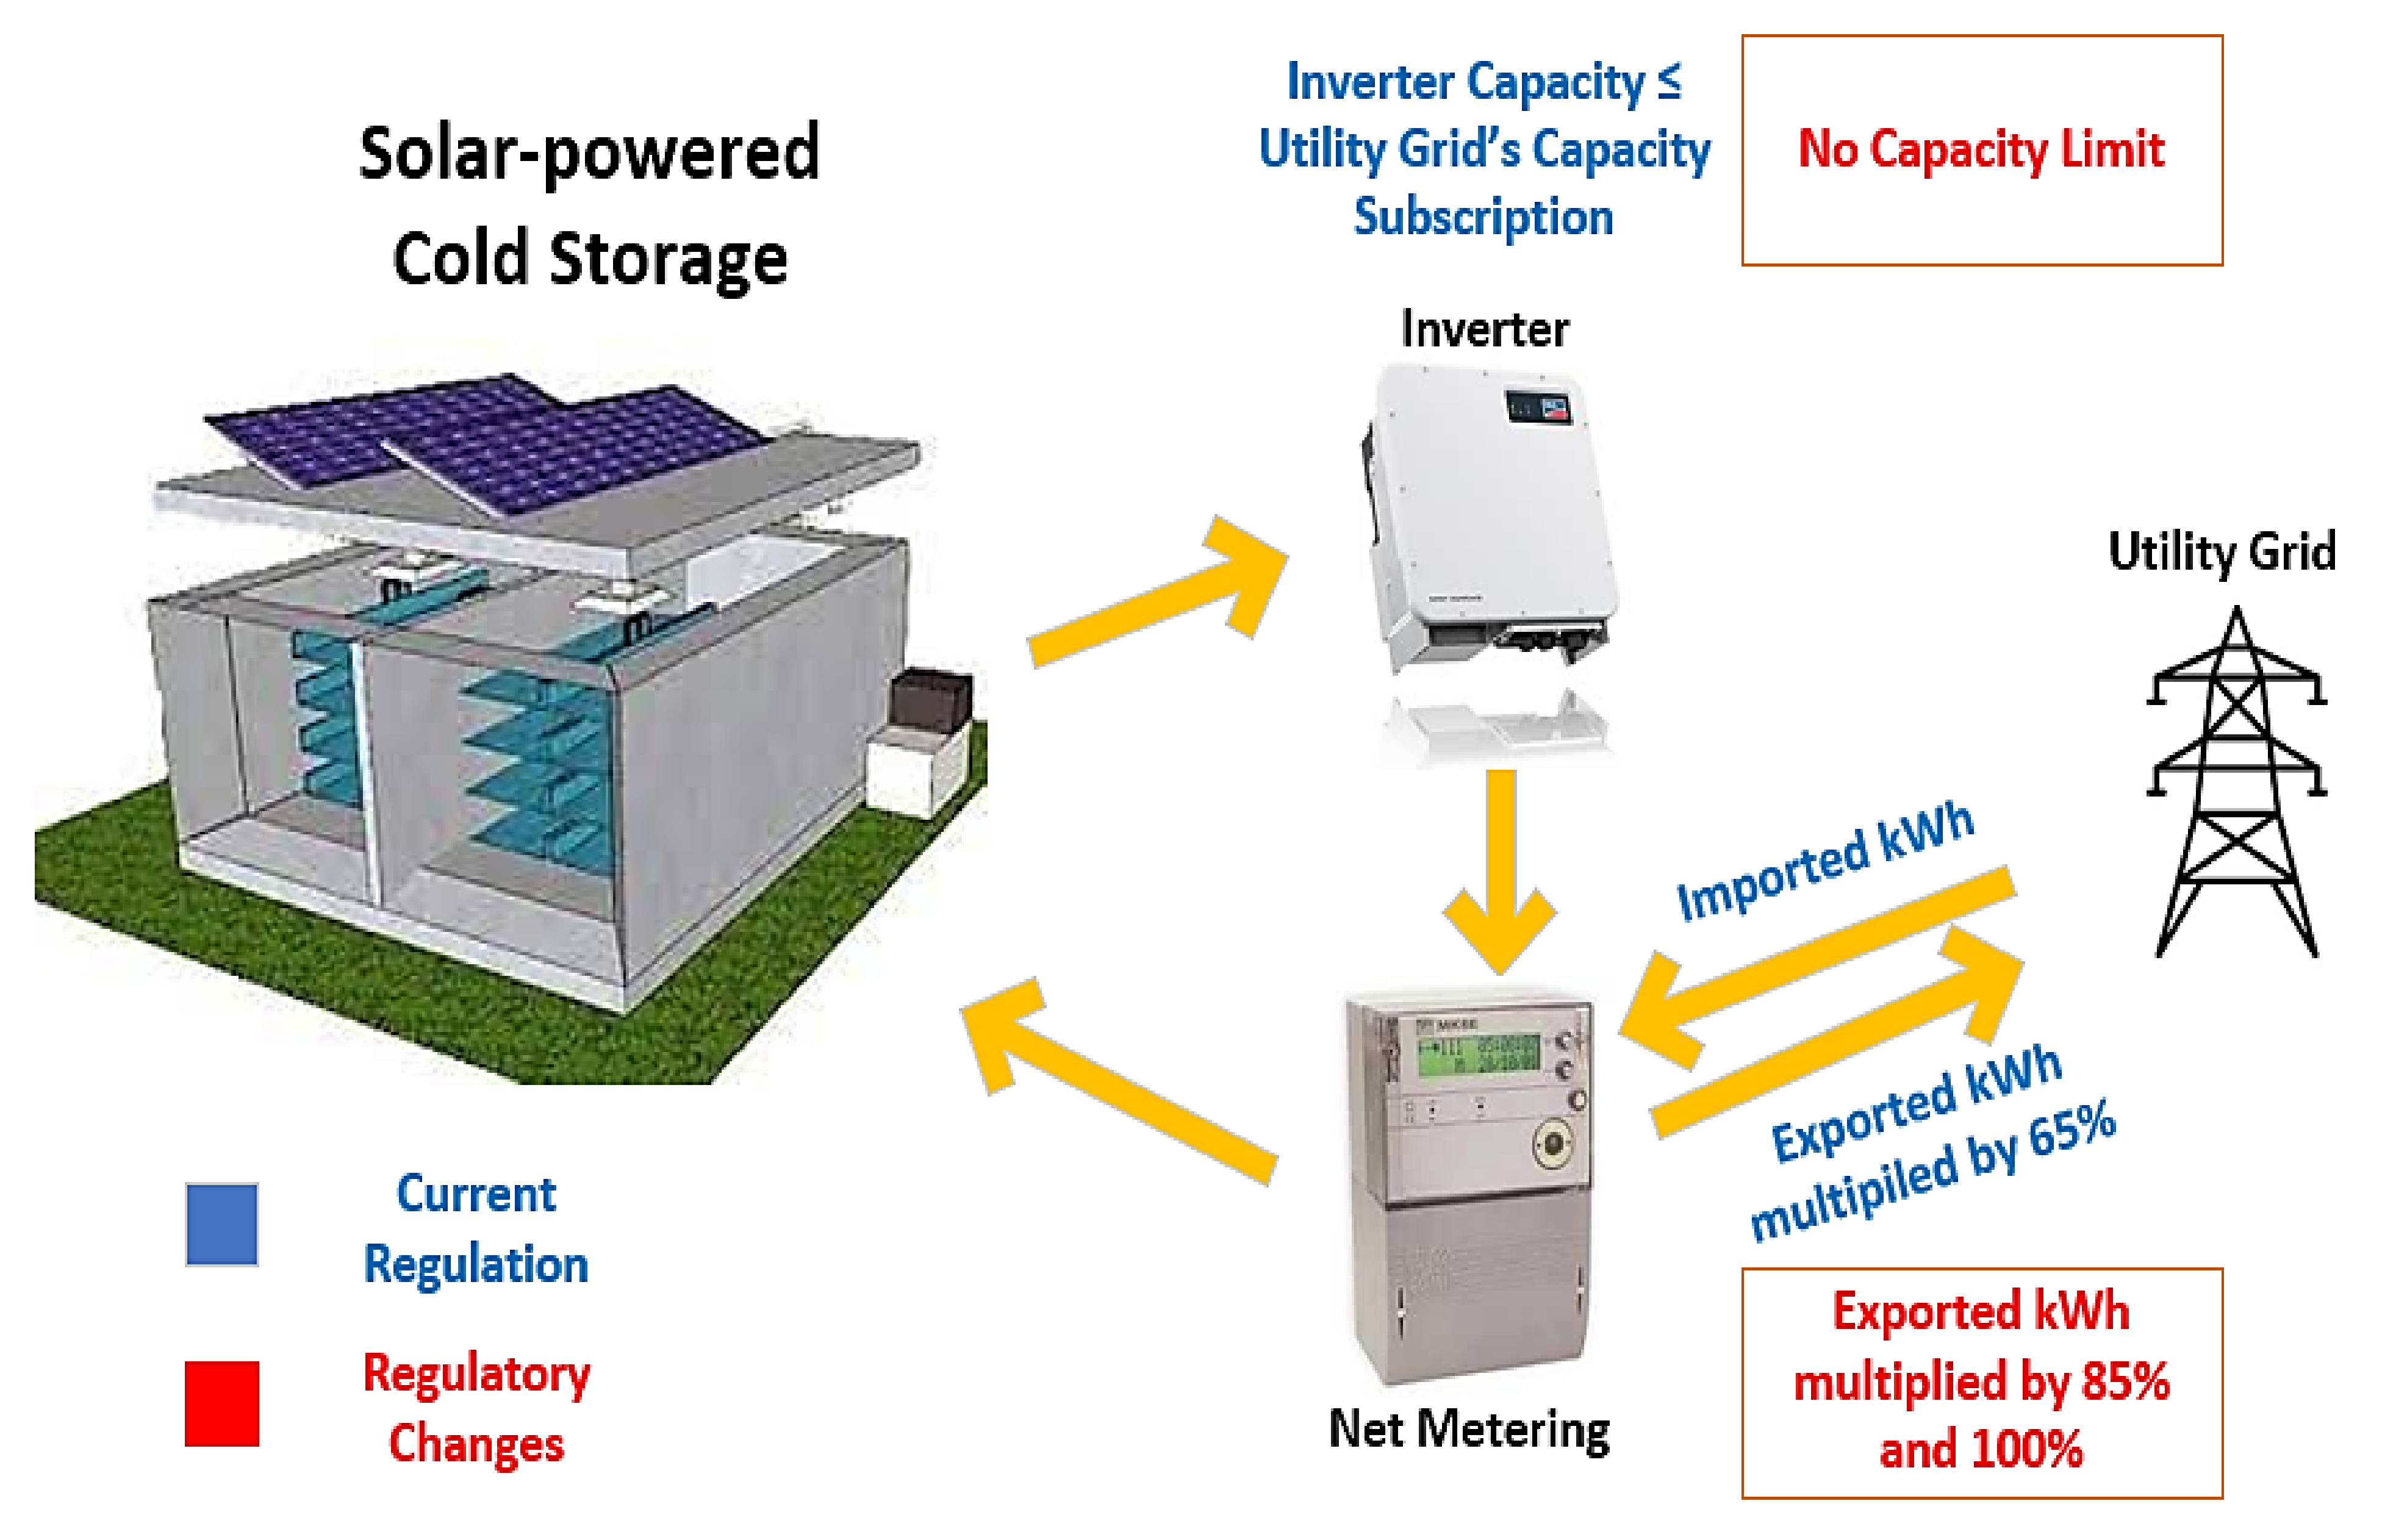
In an on-grid PV system, there is a regulation that regulates the installation of solar rooftops. According to Article 5(1) of the Regulation of the Minister of Energy and Mineral Resources No 49 of 2018, a rooftop PV system’s capacity in the households, commercials and industries should not exceed the power capacity of the utility grid. Then, exported electricity is valued at 65% for compensation. 65% for compensation means that exported electricity is calculated based on the recorded export kWh multiplied by 65%. If the export is higher than the import, the balance can be accumulated for up to 3 months before it expires. Therefore, the inverter installation of the on-grid system must have a maximum capacity of 70 kW because the cold storage subscribes 82.5 kVA/70 kW capacity to the national utility grid company. With the limitations imposed on installing a PV system, a simulation of several scenarios related to the limitations of existing regulations was carried out in this study.
Figure 9 shows the process of techno-economic analysis with energy pricing and considered regulations. There are six scenarios that we have modelled related to On-grid PV systems. The scenarios can be seen in
Table 3.
The PV Off-grid with a battery system requires a large PV module and battery capacity to meet all cold storage electricity load needs. If a small portion of the annual load is left unserved, the economic performance of a renewable energy system can be significantly improved. A solar array and battery bank, for example, that do not have to meet a large load regularly may be significantly smaller than those that must meet the load at all times. This is especially true in extreme cases where the peak load occurs after several cloudy days. If it is acceptable to have the system down for a small portion of the year, or if unnecessary loads can be shed when the battery bank is low, significant capital cost savings may be realized. The maximum annual capacity shortage constraint is used in HOMER to model this scenario. A sensitivity analysis on this variable, which is set to 0 per cent by default (in which the system must meet all of the load all of the time), shows that the optimal system type may change if a small portion of the annual load (0.5 per cent to 5 per cent) is allowed to go unserved [
33]. Therefore, the assumption of a capacity shortage in this study is only 5% per year. We use the optimization by Homer Software to determine the Off-grid PV system capacity. Homer can optimize by looking for economical energy system configurations, and it can provide sensitivity analysis results on energy systems. The consequence of installing a large PV and battery is the initial cost addition and land addition.
Following that is the PV hybrid generator scheme for the energy system, which has been simulated using optimization methods, i.e., cycle charging (CC) [
34]. The rooftop solar PV is combined with the existing 70 kW generator. This system does not require a large battery since it has the generator backed up power.
According to solar PV developer in Indonesia, solar PV and inverter installation costs are
$1143 per kW; annual maintenance is
$1114 per kW. PV degrades at 0.5% per year, while maintenance costs climb by 2% per year. The energy system uses a lead-acid battery, which costs
$250 per kWh to install and
$20 per kWh per year to maintain [
35,
36].
Table 4 displays the installed capacity of each equipment component as well as the total system investment cost for all scenarios. The PV Off-grid scenario has the highest investment cost of these scenarios because it is needed solar panels and a large battery to meet all cold storage’s energy requirements.
2.5. Levelized Cost of Electricity (LCOE)
The Levelized Cost of Electricity (
LCOE) is a critical decision tool for assessing the financial performance of power supply technologies such as Renewable Energy Sources (RES). Techno-commercial analysts primarily use it to calculate the unit cost of electricity produced over the project’s economic life [
37]. The present value of the price of electrical energy produced, taking into account the economic life of the generator and the costs incurred in construction, operation, and maintenance, as well as the cost of fuel, is defined as the
LCOE in the production of electrical energy Equation (1) [
38,
39,
40]. The effectiveness of the developed hybrid system can be analyzed by identifying the economic parameters such as levelized cost of energy (
LCOE), net present cost (NPC), system capital cost, and salvage cost [
41]. We simulate several options for electrical energy sources with Homer Pro Software to provide the optimal result based on these parameters. For more details, mathematical equations of
LCOE can be seen in
Appendix A.
- where,
= Capital Recovery Factor
-
= Total systems fixed O&M cost in ($/year)
-
= Total installed cost of the systems ($)
-
= Reference yield for specific PV system at specific site
-
= Performance Ratio
2.6. Ownership Model
Fishery cold storage has two types of ownership models: commercial and community-based.
Table 5 shows the comparisons of financial instruments from both Ownership Models. Using a community-based business model can benefit from applying for a loan from Infrastructure Funding for small companies in your area. For example, the community-based model might have a debt-to-equity ratio of 100:1, whereas the commercial model might have 70:30. Public-Private Partnership (PPP) scheme can be applied by Presidential Regulation 67 of 2005 and renewed with the ratification of Presidential Decree no. 38 of 2015 to accommodate 100% Debt Portion on community-model. The government needs to change the regulation with 100% Project Financing for power plant infrastructure below 10 MW. Other benefits include paying no business tax and only paying a local tax of 2.25 per cent for the community-based approach. This is based on the Regional Regulation of Indramayu Regency Number 5 of 2009 in Article 5 paragraph 1. According to Indonesian tax legislation, the commercial model must pay a 25 per cent tax. Leasing local land with a tax scenario for the area per m2 is essential for business purposes. A community-based community, on the other hand, does not necessitate the rental of land. It is a 15-year project with an inflation rate of 4.23% for Indonesia’s inflation rate during the last five years and a 5% discount rate. Equation (2) [
42] is used to calculate cold storage rental charges. Operational expenditure (
Opex) of cold storage is calculated to determine the cold storage rental price, consisting of electricity costs per year based on
LCOE, cold storage maintenance, worker salaries, and packaging costs. Then depreciation per year is obtained from the total investment divided by the project lifetime by considering the inflation rate above.
- where,
= Rental Price ($/Kg/Day)
-
= Operational Expenditure
-
= Depreciation
-
= Interest
-
= Percentage of Tax or Retribution
3. Results and Discussions
In this section, the LCOE results are gathered from all topologies of the energy system. The LCOE results will be the basis for calculating cold storage rental prices because electricity costs are included in the operating expenditure (Opex) component, and electricity costs are calculated based on LCOE. This study also carried scenarios of regulatory changes related to On-grid PV. Furthermore, LCOE calculations and cold storage rental prices are determined based on the learning rate of capital costs for solar modules and battery equipment in 2030. Sensitivity analysis is also conducted to see what components most influence the economic value of the energy system.
3.1. LCOE Results of Energy System
As can be seen in
Figure 10, the simulation indicates that the generator has the highest LCOE at
$0.246/kWh. As seen in
Table 6, the generator consumes a significant amount of diesel fuel, costing around
$80,787 per year. The off-grid photovoltaic system also has a high LCOE at
$0.244/kWh. The off-grid photovoltaic system has a high LCOE because the initial costs are prohibitively high, even though no fuel is consumed. In the case of a hybrid PV system, it has lower LCOE than a generator and off-grid system because it can reduce fuel consumption for diesel and lower capital expenses for PV modules and batteries than an off-grid PV system. The lowest LCOE is an on-grid PV system. PV On-grid’s LCOE is low because it can reduce electricity bills from the utility grid and can sell electricity to the utility grid if excess power generation exists.
From the current regulation of the On-grid PV system, the simulation results show that the LCOE is less optimal because the inverter capacity must be equal to the utility grid’s installed capacity (82.5 kVA/70 kW). PV users will never export energy greater than imports because the calculation is conducted per month. Thus, imported electricity (kWh) from the utility grid is always more than exported electricity (kWh). It happens because the inverter capacity in the PV system is limited. Calculation of 65% compensation for exported electricity (kWh) to the utility grid will also affect the LCOE of the on-grid PV system.
After applying the scenarios in
Table 3, PV On-grid scenarios 4–6 have lower LCOE than scenarios 1–3 because the PV modules and inverter capacity are enormous. In addition, they can produce three-fold more electricity to the grid with higher inverter capacity than scenarios 1–3. Only in scenarios 5 and 6 can be a surplus from the generation of solar PV since, in this scenario, this system’s exported electricity compensation is 85 per cent and 100 per cent. Scenario 6 has the lowest LCOE because it has a large inverter capacity, and the system’s exported electricity compensation is 100 per cent which is a 1:1 ratio between export and import electricity to grid.
3.2. Cold Storage Rental Price
The energy system’s LCOE is used in the cash flow of the entire cold storage system. The price of cold storage is determined by taking into account total operating costs, interest, and depreciation. The association between the LCOE values and the cold storage rental price for each simulated scenario is depicted in
Figure 11 and
Figure 12. The rental cost for cold storage with an on-grid photovoltaic system in scenario 6 is the lowest at 0.143 cents USD per kg per day, owing to the low operating costs of the cold storage, particularly the electricity cost, which can already be exported to the utility grid. An exciting result of the large amount of energy exported to the grid is that it can reduce operational expenditure from cold storage. This will impact lowering the rental price of cold storage because the operational expenditure of cold storage influences the cold storage rental price according to Equation (2).
For all energy system topologies shown in
Figure 13, community-based cold storage rental prices are on average 16% less high than community-based cold storage rental prices. Neither land nor income tax is required for the community model; the only tax imposed is 2.25 per cent for local government payback. Debt and equity have a significant impact on the price difference between the two structures. A community-based ownership model can be employed if there are no local cold storage investors. Furthermore, for PV On-grid scenarios 5 and 6, the cold storage rental costs fluctuate marginally between the two ownership models. Due to the community-based model’s 100:1 debt-to-equity ratio and high-interest rate, the debt-to-equity ratio differs significantly.
3.3. LCOE and Cold Storage Rental Price in 2030
The simulation results show that the cold storage rental price is influenced by the high initial investment costs and interest payments. We simulate a projected reduction in capital costs from installing PV energy systems, inverters, and batteries in 2030. The cost of installing PV solar panels will decrease significantly through 2030. Globally, the total cost of PV installation will continue to decline to USD 834 per kW in 2030, compared to the current solar PV installation cost of approximately USD 1200 per kW [
43]. The projected price of lead-acid batteries in 2030 is by projection data from [
44] of USD 125 per kWh that currently costs USD 250 per kWh of lead-acid batteries.
Figure 14 shows a decrease in LCOE with projections in 2030. A significant decline in LCOE occurs in the Off-grid PV scheme in 2030 with a 35% decrease because this scheme uses PV and batteries with large capacity. Thus, a reduction in the price of PV and batteries in 2030 will have a massive impact. The cheapest LCOE in 2030 is On-grid PV scenario 6 with an LCOE of
$0.01 per kWh that currently has an LCOE of
$0.02 per kWh, meaning a 40% reduction. With the projected decrease in investment costs of solar modules and batteries doubling by 2030, the LCOE of all scenarios of the on-grid PV energy systems could be 20% cheaper on average than today.
With the reduced value of LCOE based on the decline in PV and battery investment prices in 2030, the rental price for cold storage will be cheaper than the current rental price. In
Figure 15 for the commercial-based ownership model and
Figure 16 for the community-based ownership model, the rental price for cold storage using the On-grid PV system will be even cheaper in 2030 than cold storage using electricity from the utility grid. The investment costs of installing solar PV are much lesser, minimizing the burden of bank interest, including the case of the community-based ownership model. Other energy systems, such as hybrid PV and Off-grid PV, are still more expensive than utility grid due to the high cost of battery investment. Then there is an average reduction of 10% on cold storage rental prices from all energy system scenarios and two cold storage ownership models in 2030. By simulating the cost reduction of the energy system, LCOE prices from all scenarios are concluded more profitable using solar PV in cold storage starting in 2030.
3.4. Sensitivity Analysis in Energy System
The sensitivity analysis simulations show which parameters are very significant to the LCOE value if there is a change in the parameter value. In the simulation of sensitivity analysis in this study, the parameters of PV and battery investment costs are included. Then, battery life and fuel prices are also considered if using Hybrid and Off-grid PV energy systems. For On-grid PV, the parameters of the purchase price of electricity from a national utility grid company and the exported electricity compensation are entered. For the change parameter value, enter the 50% change in the upper-lower value. 50% change for the parameter values is meant to adjust the actual condition in Indonesia for fluctuating cost parameters. Price parameters in Indonesia are very easy to fluctuate because of the many uncertainties of the policy. In this case, the policies made by the Government of Indonesia are very trying to adapt to the actual conditions in Indonesia. For example, there is a considerable difference between subsidized and unsubsidized diesel fuel prices, where the difference can reach more than 50%. Therefore, we make a 50% difference to the parameter value in these sensitivity analysis graphs.
In
Figure 17, the spider graph of the PV Hybrid system shows that the fuel price of the generator is the most sensitive to change so that it is the most influential of the LCOE. By reducing fuel prices by 50% from current prices, LCOE in Hybrid PV energy systems can be reduced by approximately 45%. On the other hand, with the increase in fuel prices by 50%, LCOE could increase by 41%. The investment cost of PV installation also affects the LCOE value of this energy system on the grey line. LCOE will increase by 6.9% if the PV price increases by 50% and vice versa.
It can be seen in
Figure 18 that the spider graph of the Off-grid PV energy system. This graph shows that battery life and battery investment costs have an extensive influence on the LCOE value. It is because, in this scheme, the energy system uses a massive battery component. In the graph, the shorter the battery life, the LCOE value is significantly more expensive. For the battery investment cost parameter, reducing the battery investment cost by 50% can reduce the LCOE by 16%. Then with a 50% rise in battery investment cost, the LCOE will increase by 13%. Similarly, the PV investment cost also significantly affects the LCOE value because the PV capacity in the energy system has a large capacity.
The on-grid PV scheme sensitivity analysis is divided into two graphs, which are graphs for scenarios 1–3 and 4–6.
Table 3 shows that scenarios 1–3 use the same system capacity but only the difference in energy export-import tariffs, which is the exact reason for scenarios 4–6. Since these two graphs have different system capacities, these two sensitivity analysis graphs are different. In the On-grid PV system scenario 1–3, the most sensitive parameter is the electricity price from the national utility grid. In
Figure 19, there is an increase in LCOE by 40% if the national utility grid energy prices increase by 50%. Conversely, by a 50% decrease in energy prices from the utility grid, there is a decrease in LCOE of around 40%. It is because electricity consumption from the utility grid is still considerable. PV cannot sell electricity to the utility grid due to the limited capacity that has not been met for PV to sell electricity to the utility grid. In this case, it also affects the regulation limitation on the PV usage in Indonesia. However, these scenarios are the safest energy system topology because there is no significant change in parameter changes that affect the LCOE system.
Figure 20 shows the sensitivity analysis of On-grid PV scenarios 4–6. The Solar Module capital cost parameter has a significant effect on the LCOE value of the energy system. With a decrease in PV investment costs by up to 50%, it causes a negative LCOE value because of the very cheap expense of PV investment by generating large electricity to cover cold storage electricity loads and enable to sell electricity to the national utility grid.
4. Conclusions
Cold storage at the fish auction place is essential to maintain the price and quality of fish. For the fishermen with difficult access to electricity, reducing energy costs is very important to cut the cold storage operating costs. In this study, renewable energy generation, which is solar PV, can reduce the operating cost of cold storage. Based on the simulation results, On-grid PV has the cheapest LCOE compared to other energy systems schemes because there is a reduction of electricity consumption from the utility grid. Another reason is that the capital cost of an On-grid PV system is not relatively high. Therefore, it affects the rental fee for cold storage for that system that it is the lowest cold storage’s rental price compared to other energy systems schemes.
The On-grid PV scheme uses a net metering scheme which exported electricity is valued at 65% for compensation. It can affect the LCOE value of the on-grid PV system. Therefore, a simulation is by changing the regulatory assumptions, which are the change in the excess energy compensation rate percentage and eliminating inverter capacity restrictions. The result was that the On-grid PV system has a lower Levelized Cost of Electricity (LCOE) since it can generate three times more electricity and even sell energy to the utility grid with a higher inverter capacity. Then the rental price for community-based cold storage for all energy system topologies was on average 16% cheaper than the community-based cold storage rental price.
In 2030, the LCOE of all the On-grid PV systems scenarios could be 20% cheaper on average than the current LCOE. It will result in an average 10% reduction in cold storage rental prices for all energy system scenarios. Sensitivity analysis is also conducted. On-grid PV scenarios 1–3 are the safest energy system topology.
New regulations are needed to encourage the fisheries sector by reducing regulatory restrictions on the use of PV on-grid to obtain affordable electricity prices, better incomes for fishers, and accelerating Indonesia’s 23% renewable energy target by 2030.


