Article

Closed-Cell Powder Metallurgical Aluminium Foams Reinforced with 3 vol.% SiC and 3 vol.% Graphite

Institute of Materials and Machine Mechanics, Slovak Academy of Sciences, Dúbravská cesta 9, 845 13 Bratislava, Slovakia
*
Author to whom correspondence should be addressed.
Processes 2021, 9(11), 2031; https://doi.org/10.3390/pr9112031
Submission received: 14 October 2021 / Revised: 5 November 2021 / Accepted: 11 November 2021 / Published: 13 November 2021
(This article belongs to the Special Issue Foam Matrix Composites: Preparation and Application)

Abstract

:
Closed-cell aluminium foams (nominal composition: AlSi12Mg0.6Fe0.3) were prepared by the powder metallurgical route (using 0.4 wt.% TiH2 untreated powder as the foaming agent). Pure foams and foams with the addition of 3 vol.% graphite or SiC powder were prepared. The microstructure and mechanical properties of the prepared aluminium foams containing reinforcing particles were investigated at constant density and compared to those of the pure foam. Vibration measurements were performed to determine the damping properties and modulus of elasticity of the foams. Uniaxial compression tests were performed to determine the following mechanical properties: collapse stress, efficiency of energy absorption, plateau length and densification strain of the foams. All the foams behaved in a brittle manner during compression. Finally, the effect of admixed graphite and SiC powders on the properties of the investigated foam was evaluated, discussed and modelled. The addition of powders changed all investigated properties of the foams. Only the efficiency of energy absorption at constant density was almost identical.

1. Introduction

One of the attractive industrial applications of aluminium foams is the stiffening of hollow steel profiles, especially profiles produced by hydroforming technology, where partial foaming in the weakest points eliminates peak stresses and allows the use of profiles with reduced wall thickness. This leads to overall weight savings and also allows the exploitation of economical hydroforming technology in applications where this is currently not possible due to insufficiently attainable wall thickness [1]. Partial foaming of hollow components has a smaller environmental impact and is more cost effective than the welding of various stiffeners. Moreover, the foam increases the capability of the component to absorb front and/or side crash energy [2,3,4,5,6,7,8,9,10] and suppress the noise and vibration of the originally hollow structure [11].
The damping properties of foams are also interesting for hollow structural materials for various cases (e.g., gearboxes) or covers that suffer from mechanical vibrations. In this case, the foam not only acts as a stiffening core for the hollow profile but also works as a damping material for vibrations. It is well known that vibration in cellular structures is dissipated by slight plastic deformation of the thin walls separating the pores. It is also reduced by friction between the surfaces of the cracks appearing in the pore walls. It has already been observed that the loss factor of closed-cell aluminium foams is one order of magnitude higher than the loss factor of bulk aluminium. The loss factor has a maximum at aluminium foam densities of around 0.7 g·cm−3 [12]. Moreover, the damping ability of aluminium foams does not depend on resonant frequency [13,14]. It has also been observed that the additive particles within foam cell walls affect energy dissipation in aluminium foams prepared by the powder metallurgical route [13,14].
Recently, significant attention has been given to composite foams and their properties [15,16]. Campana et al. [17] investigated the feasibility of the joining of two aluminium foam cores inside a tubular profile exploiting laser foaming of a solid precursor in place. Ghani et al. [18] observed that metal foam-filled tubes can be effective in dissipating seismic energy in buildings during strong earthquakes. Rajak and Linul [19] investigated the strain rate effect on the crushing response of newly developed composite metallic foams with 10 wt.% silicon carbide (SiC) particles (size: 20–40 µm).
At the beginning of the century, possible applications of aluminium foams as permanent cores in aluminium casting to obtain lighter and stiffer casting products were carefully investigated [20]. The main problem is preparing a foam with good reproducibility of properties for the often-required complex 3D shape to be placed inside the casting mould. Despite the development of additive manufacturing, there is a renewed interest in the subject of aluminium foam permanent cores [21].
Another point of interest in using aluminium foams is the increased amount of debris at low earth orbits. Al foams can be used in the area of blast energy absorption, crashworthiness and protection against micrometeoroid and orbital debris (MMOD) particle impacts in space engineering [22].
Not only stiffness and strength but also vibration damping and energy absorption at a given density are in focus for industrial applications of foams. It is often interesting to look for other possible methods to change them significantly at a given density. One possible method is to add a small number of additives into the foam matrix [23,24,25]. This work is performed to investigate the possible optimisation of the damping properties and energy absorption of foams at a given porosity by using composite foams. Therefore, the effect of a small number of additive particles (SiC, graphite) on the damping properties, modulus of elasticity and compression behaviour of powder metallurgical route prepared closed-cell aluminium foams are the main aims of this work.

2. Materials and Methods

Aluminium foams (pure or containing 3 vol.% graphite or SiC) were prepared by the powder metallurgical route as follows. The used aluminium alloy consists of 87.3 wt.% AlSi12, 12 wt.% AlMg5 and 0.3 wt.% Fe powders (size of powders: <210 μm, nominal composition of aluminium alloy: AlSi12Mg0.6Fe0.3, supplier of powders: Mepura GmbH, Ranshofen, Austria). As the foaming agent, untreated 0.4 wt.% TiH2 powder was used (grade N, size of powder: <63 μm, supplier: Chemetall, Frankfurt am Main, Germany). It was mixed in a Turbula shaker mixer (WAB, Lauterbrunnen, Switzerland) for 30 min prior to cold isostatic pressing (CIP).
To prepare composite foams, either graphite powder (powder size: <5 μm, supplier: Ecka Granules, Velden, Germany) or SiC powder (powder size: 10 μm, supplier: Ecka Granules, Velden, Germany) was admixed into this mixture to achieve 3 vol.% in the final mixture. Powder metallurgical precursors were fabricated from the prepared mixtures by CIP and subsequent direct extrusion at 450 °C. The residual porosity of the precursor was below 0.25%.
Experimental composite foam samples were prepared from pieces of prepared PM precursors by foaming in a cylindrical steel mould with an outer geometry of ϕ 30 × 300 mm at 680 °C for different foaming times in an electric resistance furnace.
Structural damping is caused by internal friction in the material, which converts vibration energy into heat. This reduces excessive noise and vibration by instead converting them into heat to be expelled into the surrounding area. The rate of vibration dissipation in the material structure can be defined by the loss factor η. The loss factor is usually calculated from the decay of the vibration response amplitude at resonant frequency according to:
η = 0.0366 d/fn
where d is amplitude decay, and fn is resonant frequency [26].
The damping properties of foam samples were determined using the impact hammer method. Samples of various compositions and densities (ϕ = 28 mm and length of 300 mm) were excited in the longitudinal direction. The resonant frequency and amplitude decay were measured using a miniature piezoelectric accelerometer. The resonant frequency was determined with a precision ±3 Hz. The precision of the measurement of the loss factor was below 5%. Applying Equation (1), the loss factor was calculated for resonant frequencies up to the third harmonic oscillation. Furthermore, the modulus of elasticity E of the foams was calculated from the resonant frequencies fn according to:
E = ρ(2L fn/n)2
where n is the order of the resonant frequency in harmonic oscillation, ρ is the density and L = 300 mm is the length of the sample.
Compression tests were carried out using the INSTRON (Instron, Norwood, MA, USA) testing machine at a crosshead speed of 1 mm/min. For these experiments, aluminium foam samples were cut from original samples possessing a cylindrical shape with a diameter of ϕ = 28 mm and a length of 30 mm. Samples in the density range of 0.58–0.88 g·cm−3 were compression tested.
A JEOL 7600F (JEOL Ltd., Tokyo, Japan) electron microscope equipped with a Schottky thermal-emission cathode (thermal FEG–W-coated ZrO2), as well as energy and wavelength spectrometers from Oxford Instruments, was used for microstructure characterisation. Pore size, number of pores and pore size distribution within the cross-sections of foam samples were obtained and evaluated using ImageJ software. Average pore size was determined as the most probable pore observed within the structure (sum of all pore sizes divided by the sum of all squares of the pore sizes).

3. Results and Discussion

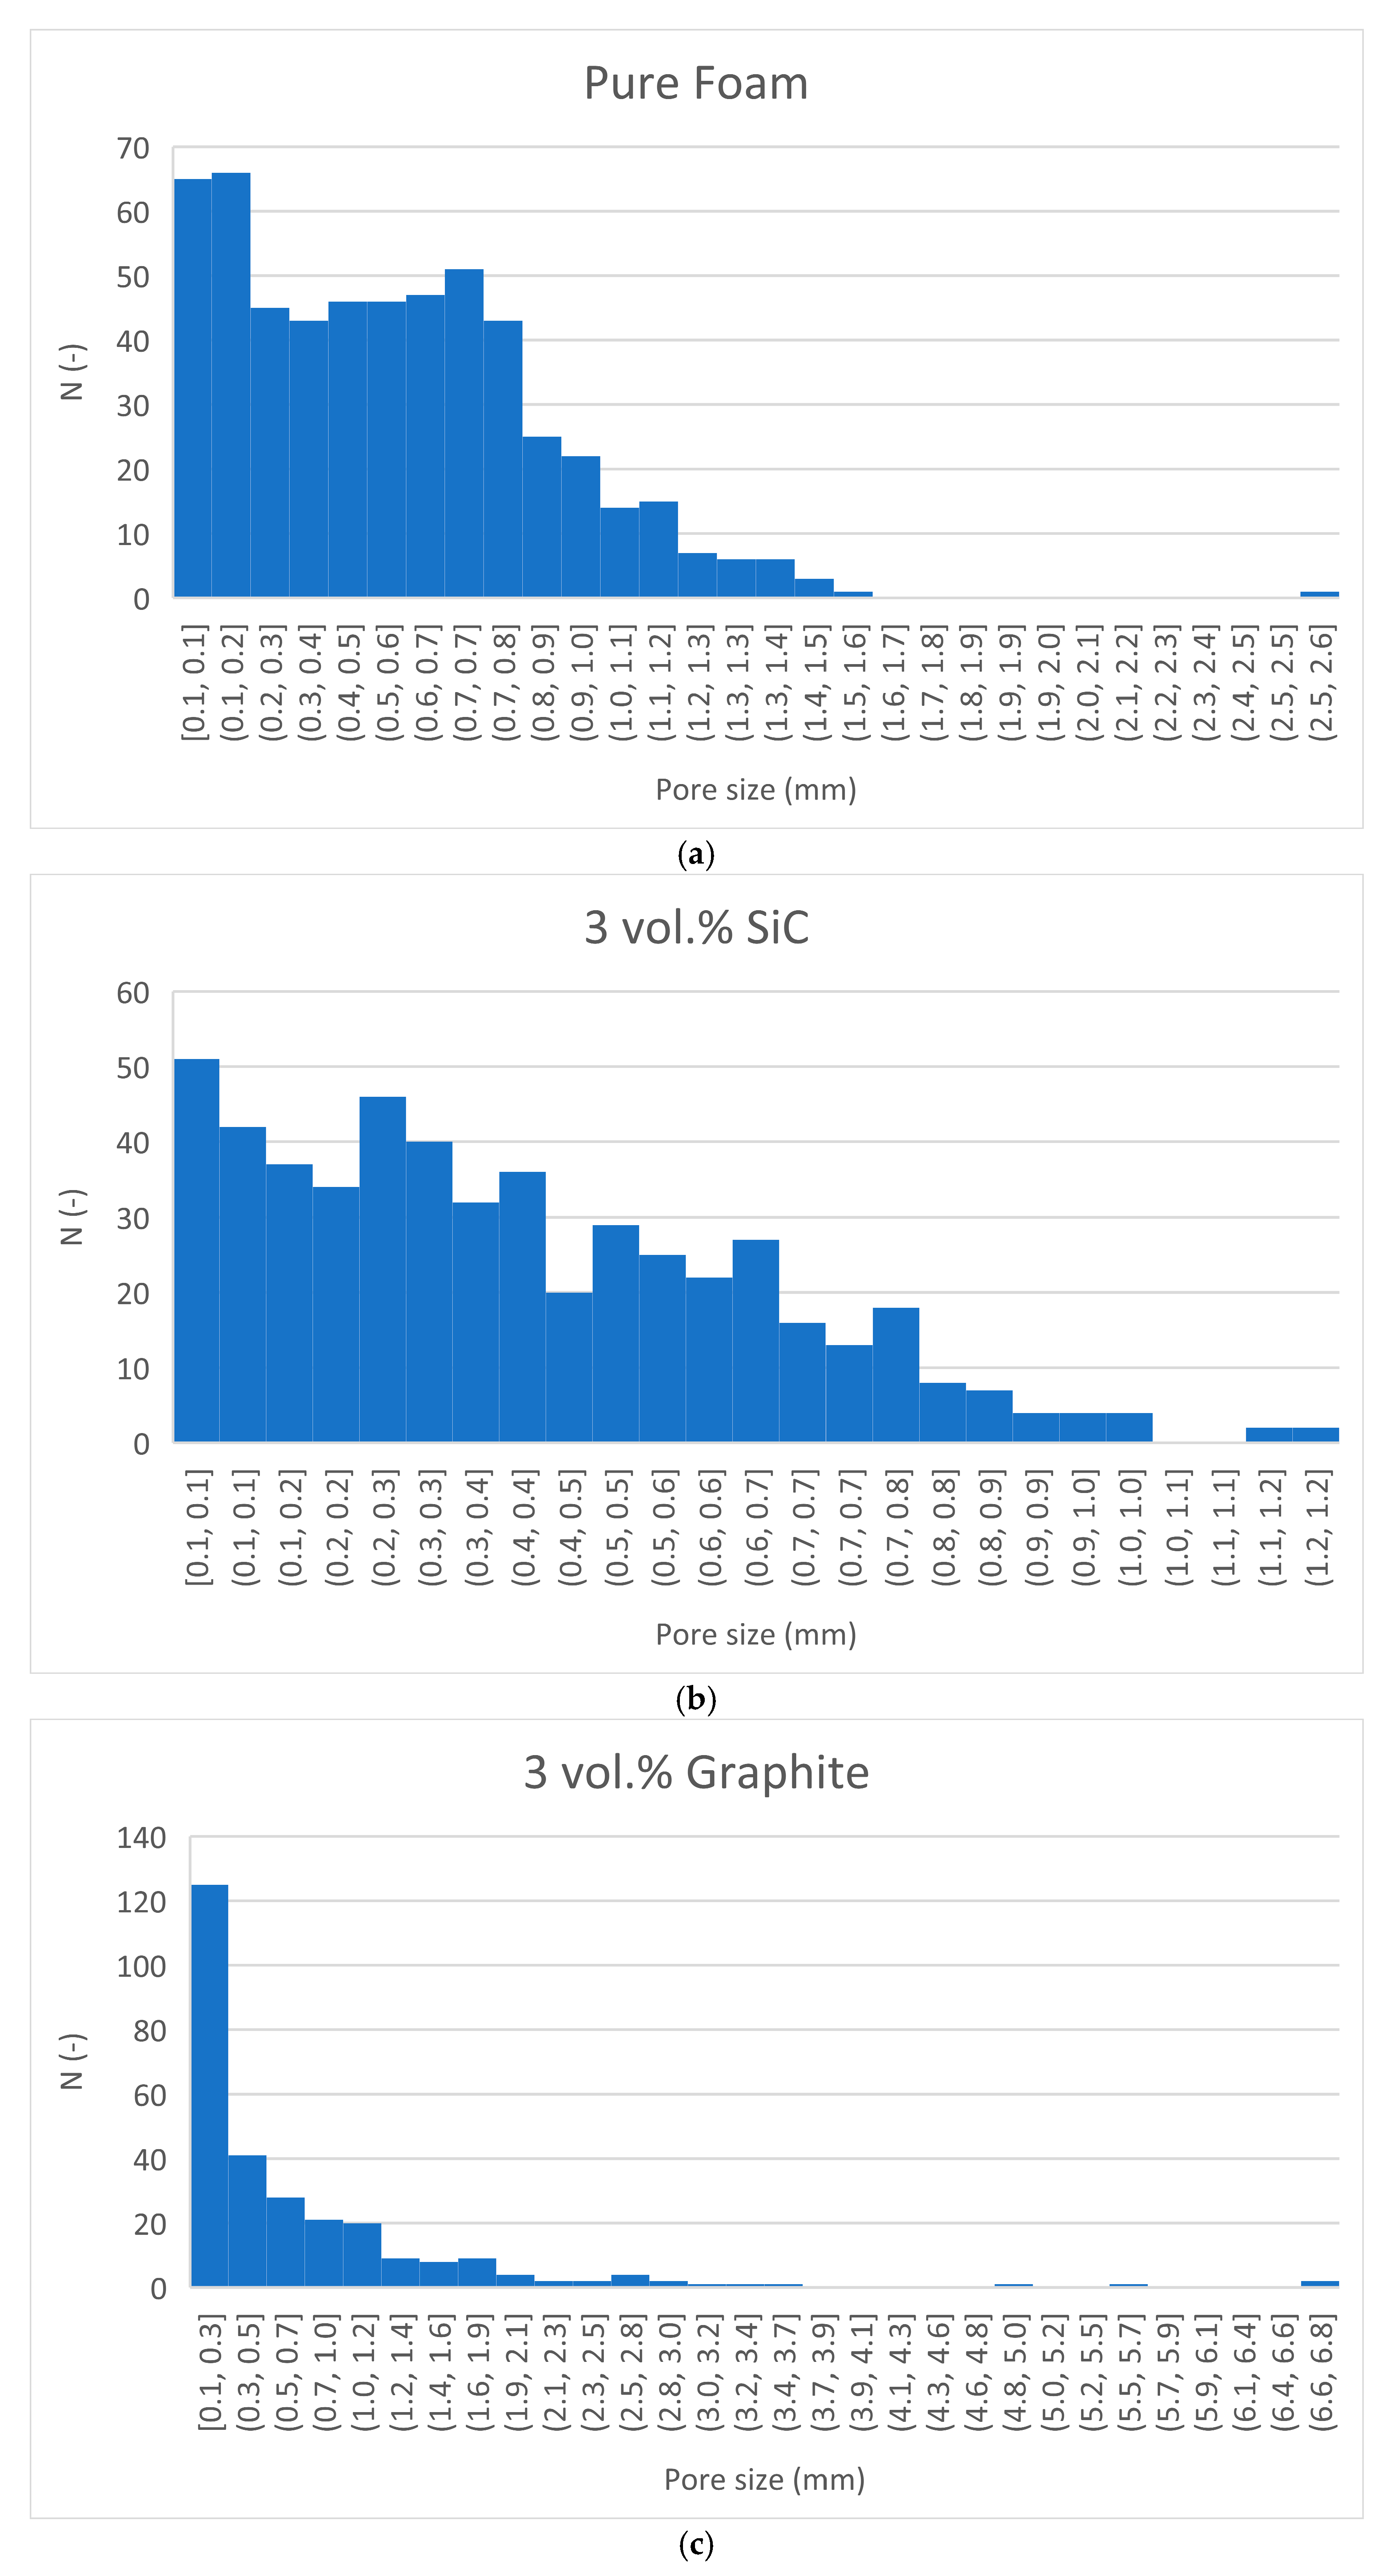
Foam samples were prepared in the density range of 0.58–0.88 g·cm−3. It was slightly more difficult to prepare foams with graphite additions with the technology used. The composite foam with 3 vol.% graphite tended to be heterogeneous (see Figure 1 and Figure 2, Table 1), with clustered large and small pores within the structure and also locally thick surface skin regions. The number of pores inside this foam is the smallest, and the largest pores were observed for this foam. The foams with 3 vol.% graphite were also prone to collapse in comparison with pure foams and composite foams reinforced with SiC during foaming.
In foams with 3 vol.% SiC, the smallest pores were observed due to the foam-stabilising effect of SiC. However, the pore distribution indicates that it is difficult to speak of a sharp average pore size for this foam in comparison with the pure foam pore size distribution (Figure 2). The number of pores is comparable to the number of pores inside the pure foam of the same density. This pore size scatter can lead to local inhomogeneities inside the foam, probably due to the low concentration of stabilising SiC particles inside the matrix alloy.
This is the result of the different wetting of reinforcements with molten aluminium alloy under normal atmosphere during foaming. Kaptay et al. [27] give contact angles for different combinations of the pure Al melt–particle–gas interface. While the contact angle of SiC is 27 degrees, the same value for graphite is 52 degrees. It is evident that SiC possesses better wettability due to the lower contact angle than graphite. Therefore, liquid foam with SiC is more stable, with smaller coalescence of pores and foam collapse than the foam with graphite.
It can be concluded that the foams prepared with graphite are more difficult to foam. Such foams are prone to collapse, and the final foam structure is more heterogeneous in comparison with pure aluminium foams and foams with SiC prepared under the same technological parameters. A small number of SiC also tends to have a slightly heterogeneous structure (large pores locally observed in comparison to pure foam) due to the low concentration of the foam-stabilising SiC powder in the matrix alloy.

3.1. Composite Foams Microstructure

It was necessary to investigate foam microstructure using scanning electron microscopy to find the additives and phases created during the foaming of composite foams.
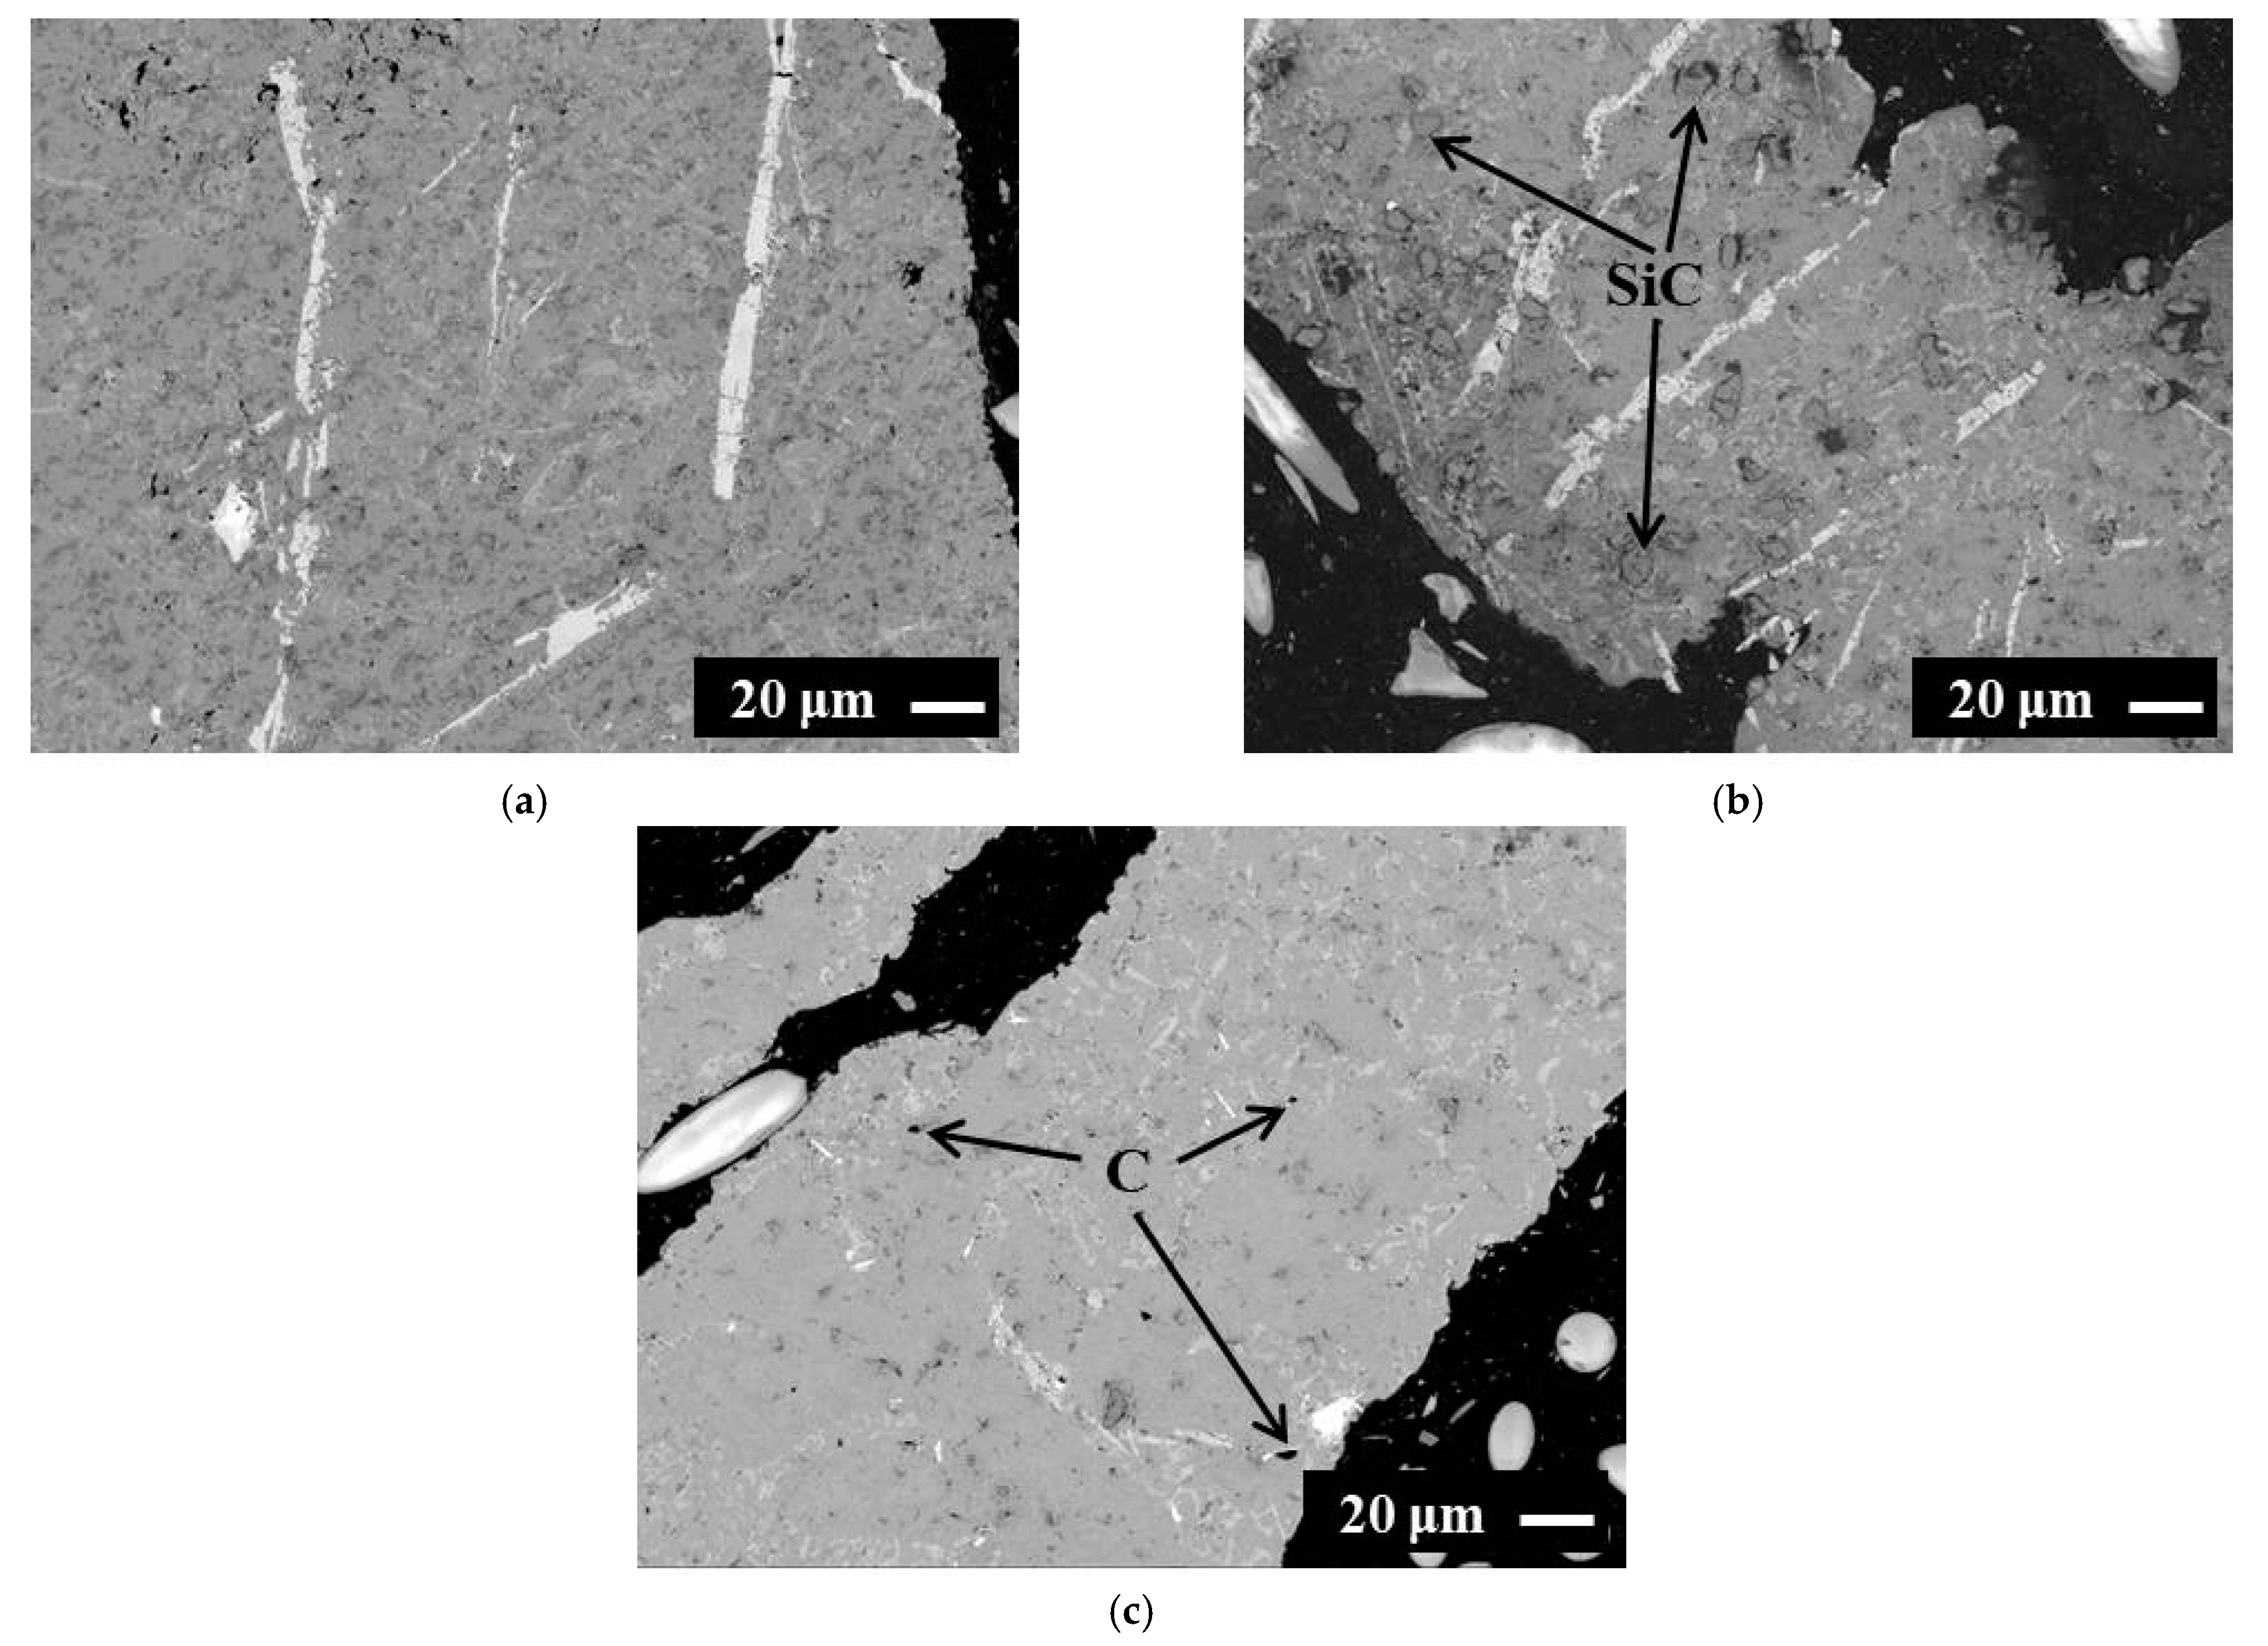
The microstructures of the investigated foams cell walls seem to be principally similar (see Figure 3). While larger SiC particles (Figure 3b) are obvious in the foam microstructure, the smaller graphite particles (Figure 3c) look more like pores within the foam cell walls. The only observed difference is the size and length of the white AlFeSi phase, which is significantly smaller and homogeneously dispersed in the cell wall structure of the foam with 3 vol.% graphite.
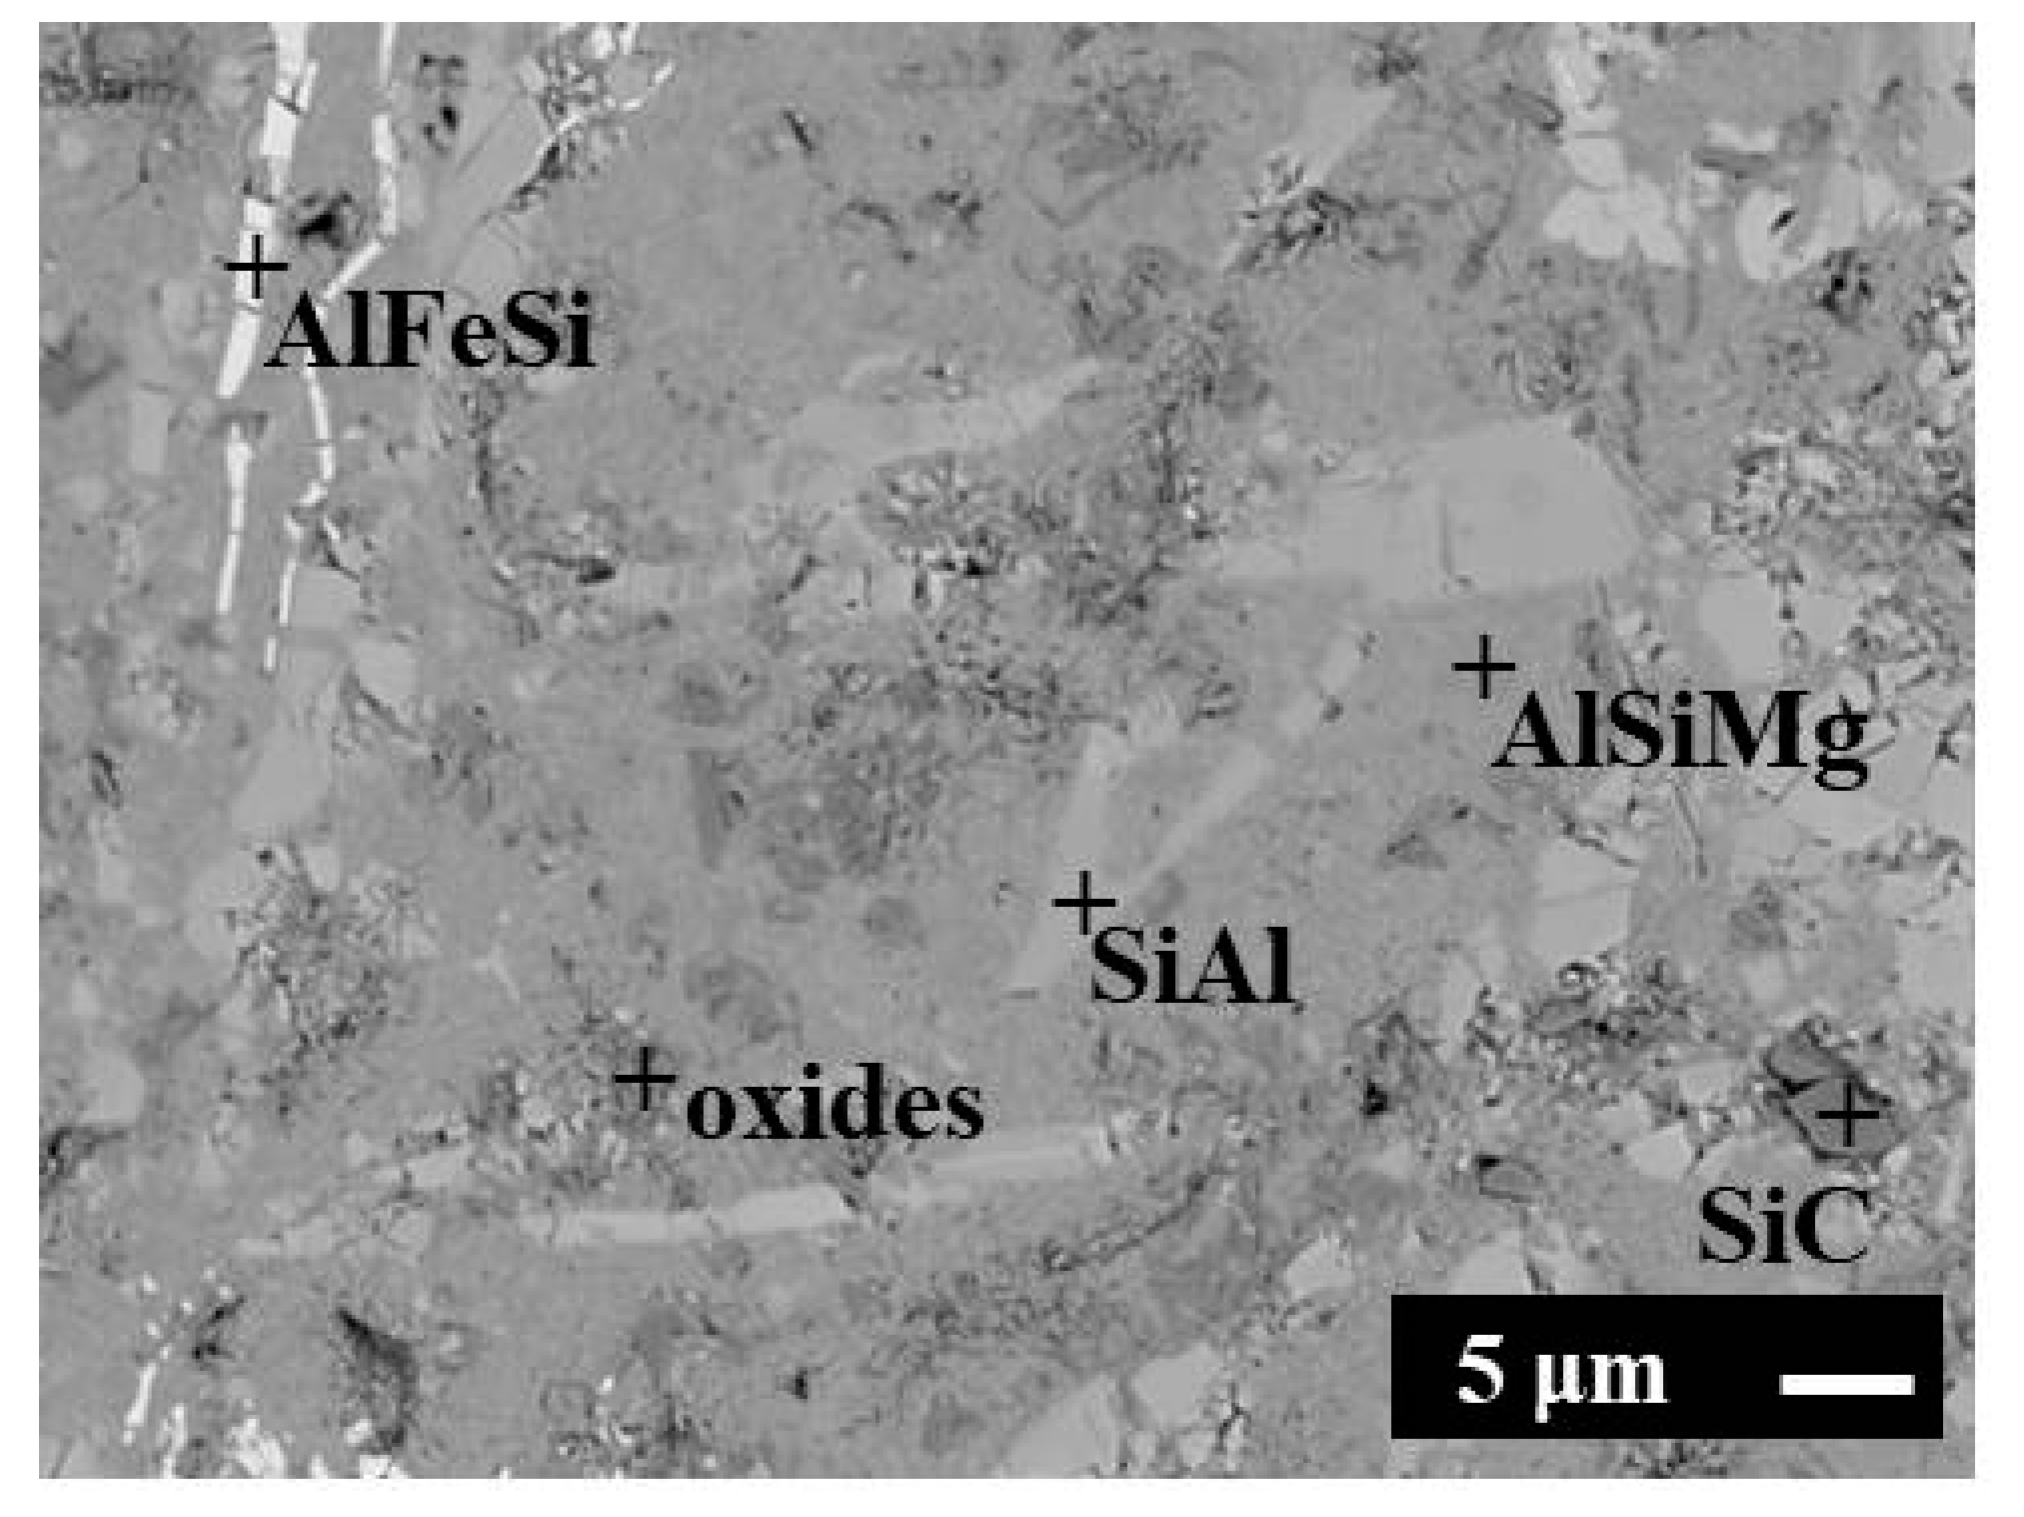
EDS analysis of foam phases shows significantly different phases depending on the presence of additives. EDS analysis of the foam without additives (Figure 4) shows a microstructure consisting of four phases: a dark AlSiMg phase (Si 1 at.% and 0.4 at.% Mg, Al balanced), a lighter SiAl phase (Al 2.2 at.%, Si balanced), a white phase AlFeSi (Fe 25 at.%, Si 14 at.% and Al balanced) and dark regions of complex oxides (composed mostly of 67 at.% Al, 25 at.% oxygen, 5 at.% Si and 3 at.% Mg). Moreover, some SiC (42 at.% Si and 58 at.% C) inclusions were observed within the microstructure as a residuum of polishing SiC paper pressed inside the foam pore during sample preparation.
A closer investigation indicates that both main phases have origins in the powder composition (AlSi12 and AlMg5). The created AlFeSi phase seems to be the most probable Al5FeSi phase. There is also the presence of complex oxides, probably based on Al2O oxide. However, it is very rarely observed at high temperatures during the heating of Al and Al2O3 under vacuum in the presence of SiO2 and C [28]. In any case, it can be concluded that the pure aluminium alloy foam prepared from the mixture of complex powders has a very complex microstructure.
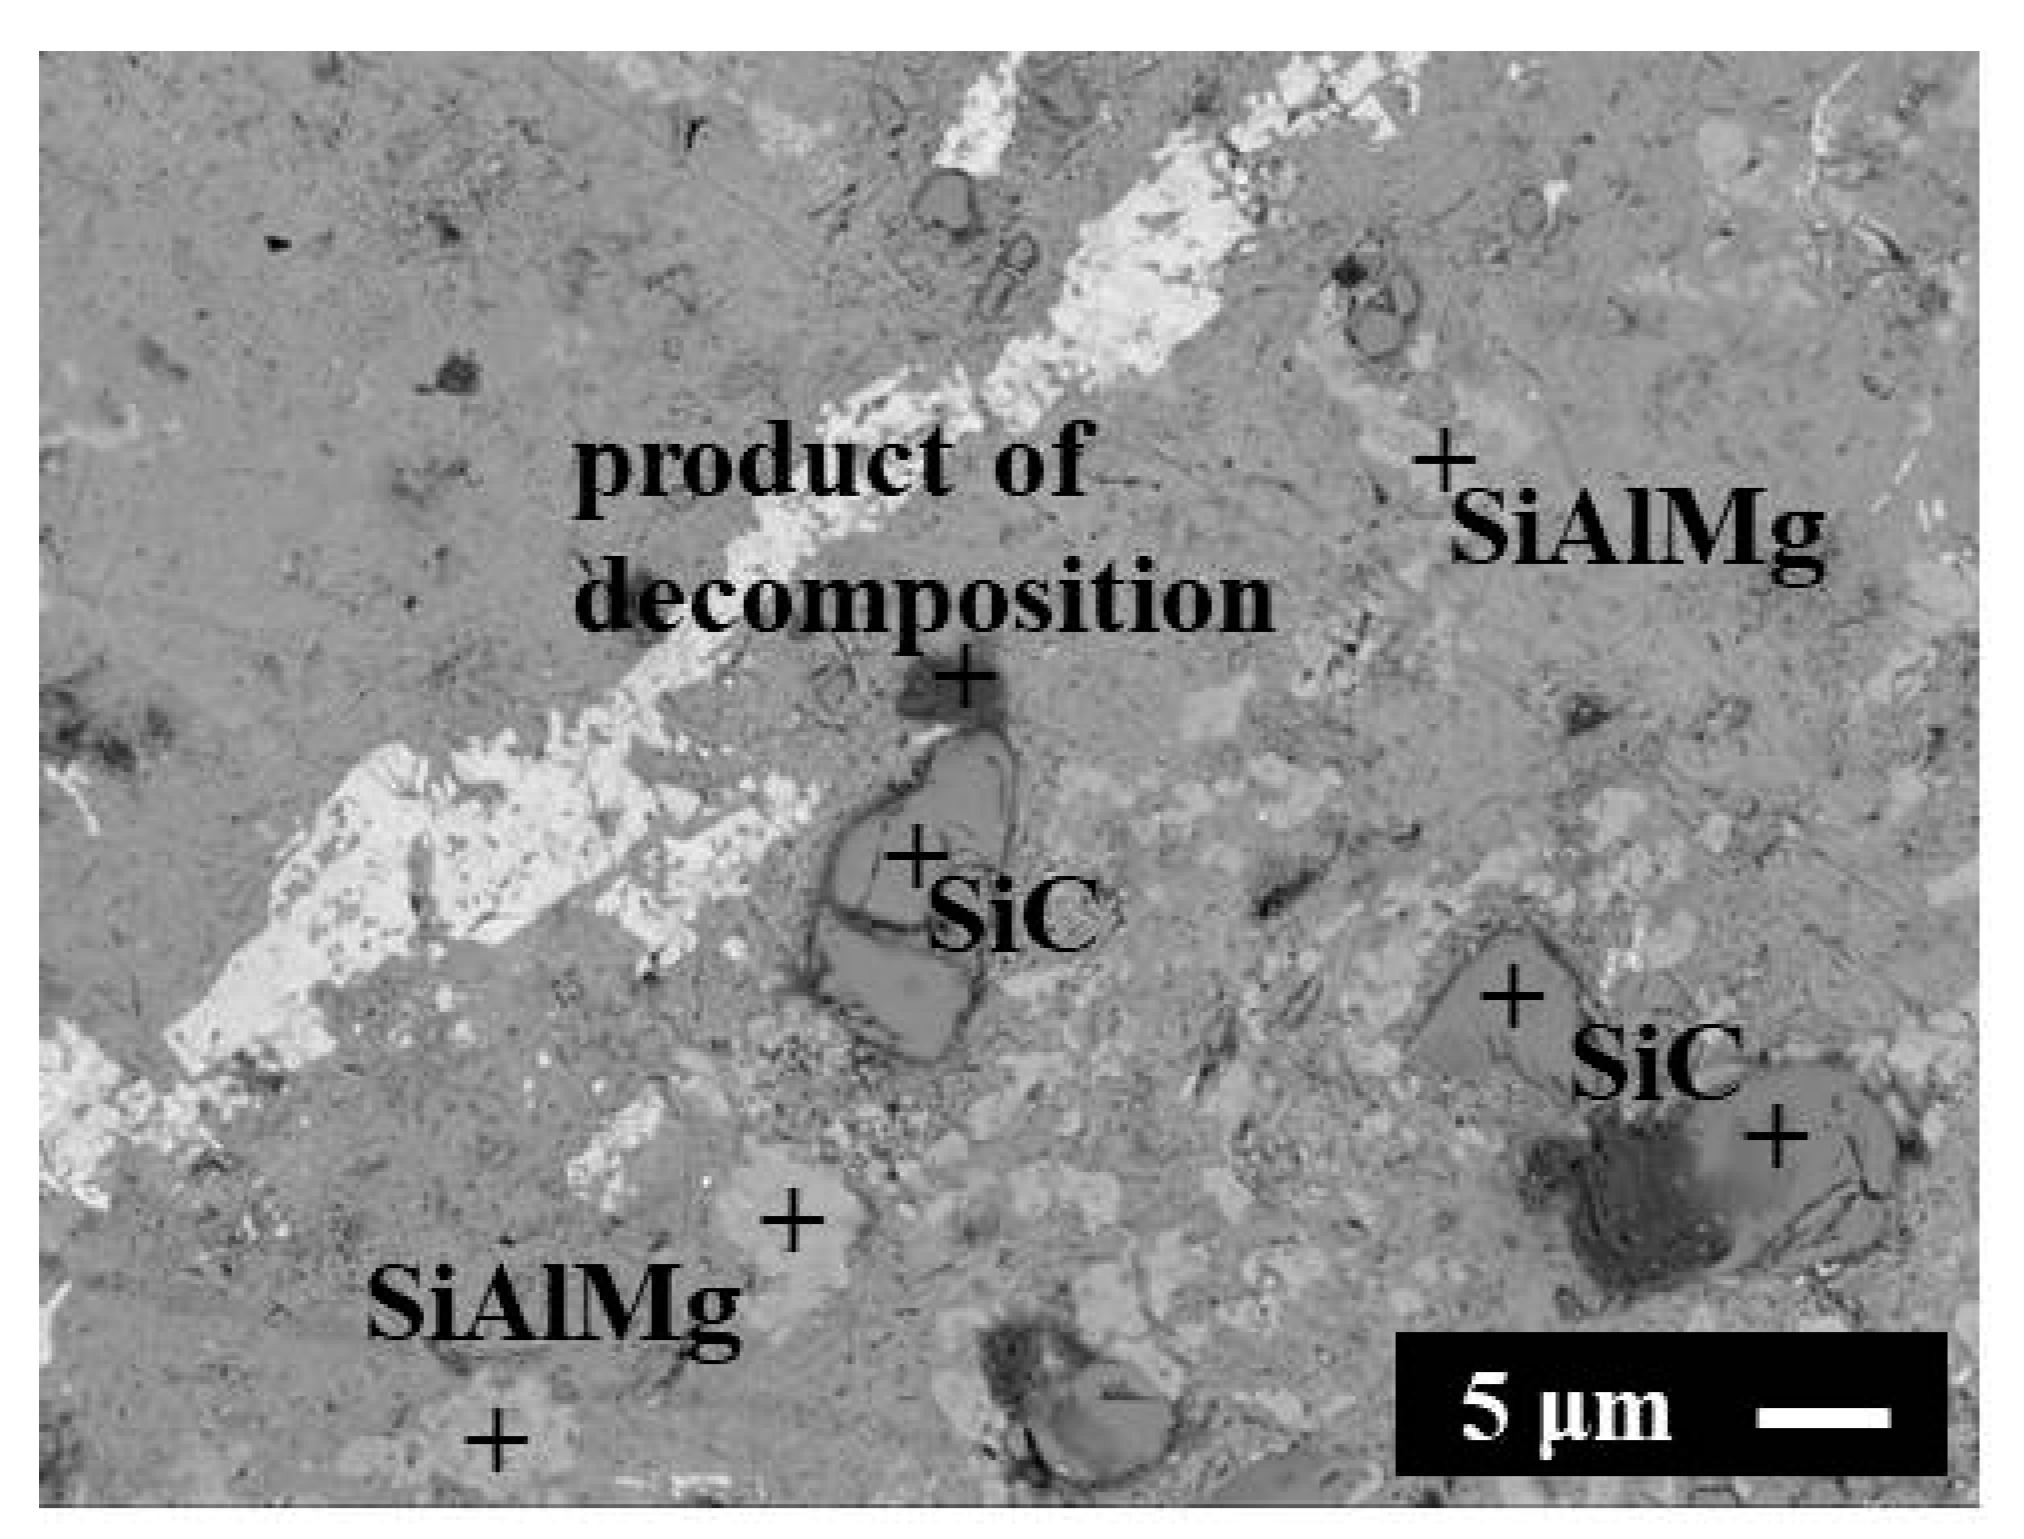
EDS analysis of the foam with 3 vol.% SiC (Figure 5) shows a microstructure consisting of five phases: a dark AlSiMg phase, a lighter SiAlMg phase (Mg 6 at.%, Al 22 at.%, Si balanced), a white phase Al5FeSi and dark regions as a product of decomposition (composed mostly of 62 at.% carbon, 25 at.% oxygen, 10 at.% Al, 2 at.% Mg and 1 at.% Si) in the vicinity of the SiC particle. Finally, large SiC particles within the foam pore walls were observed, now as a result of the admixed powder.
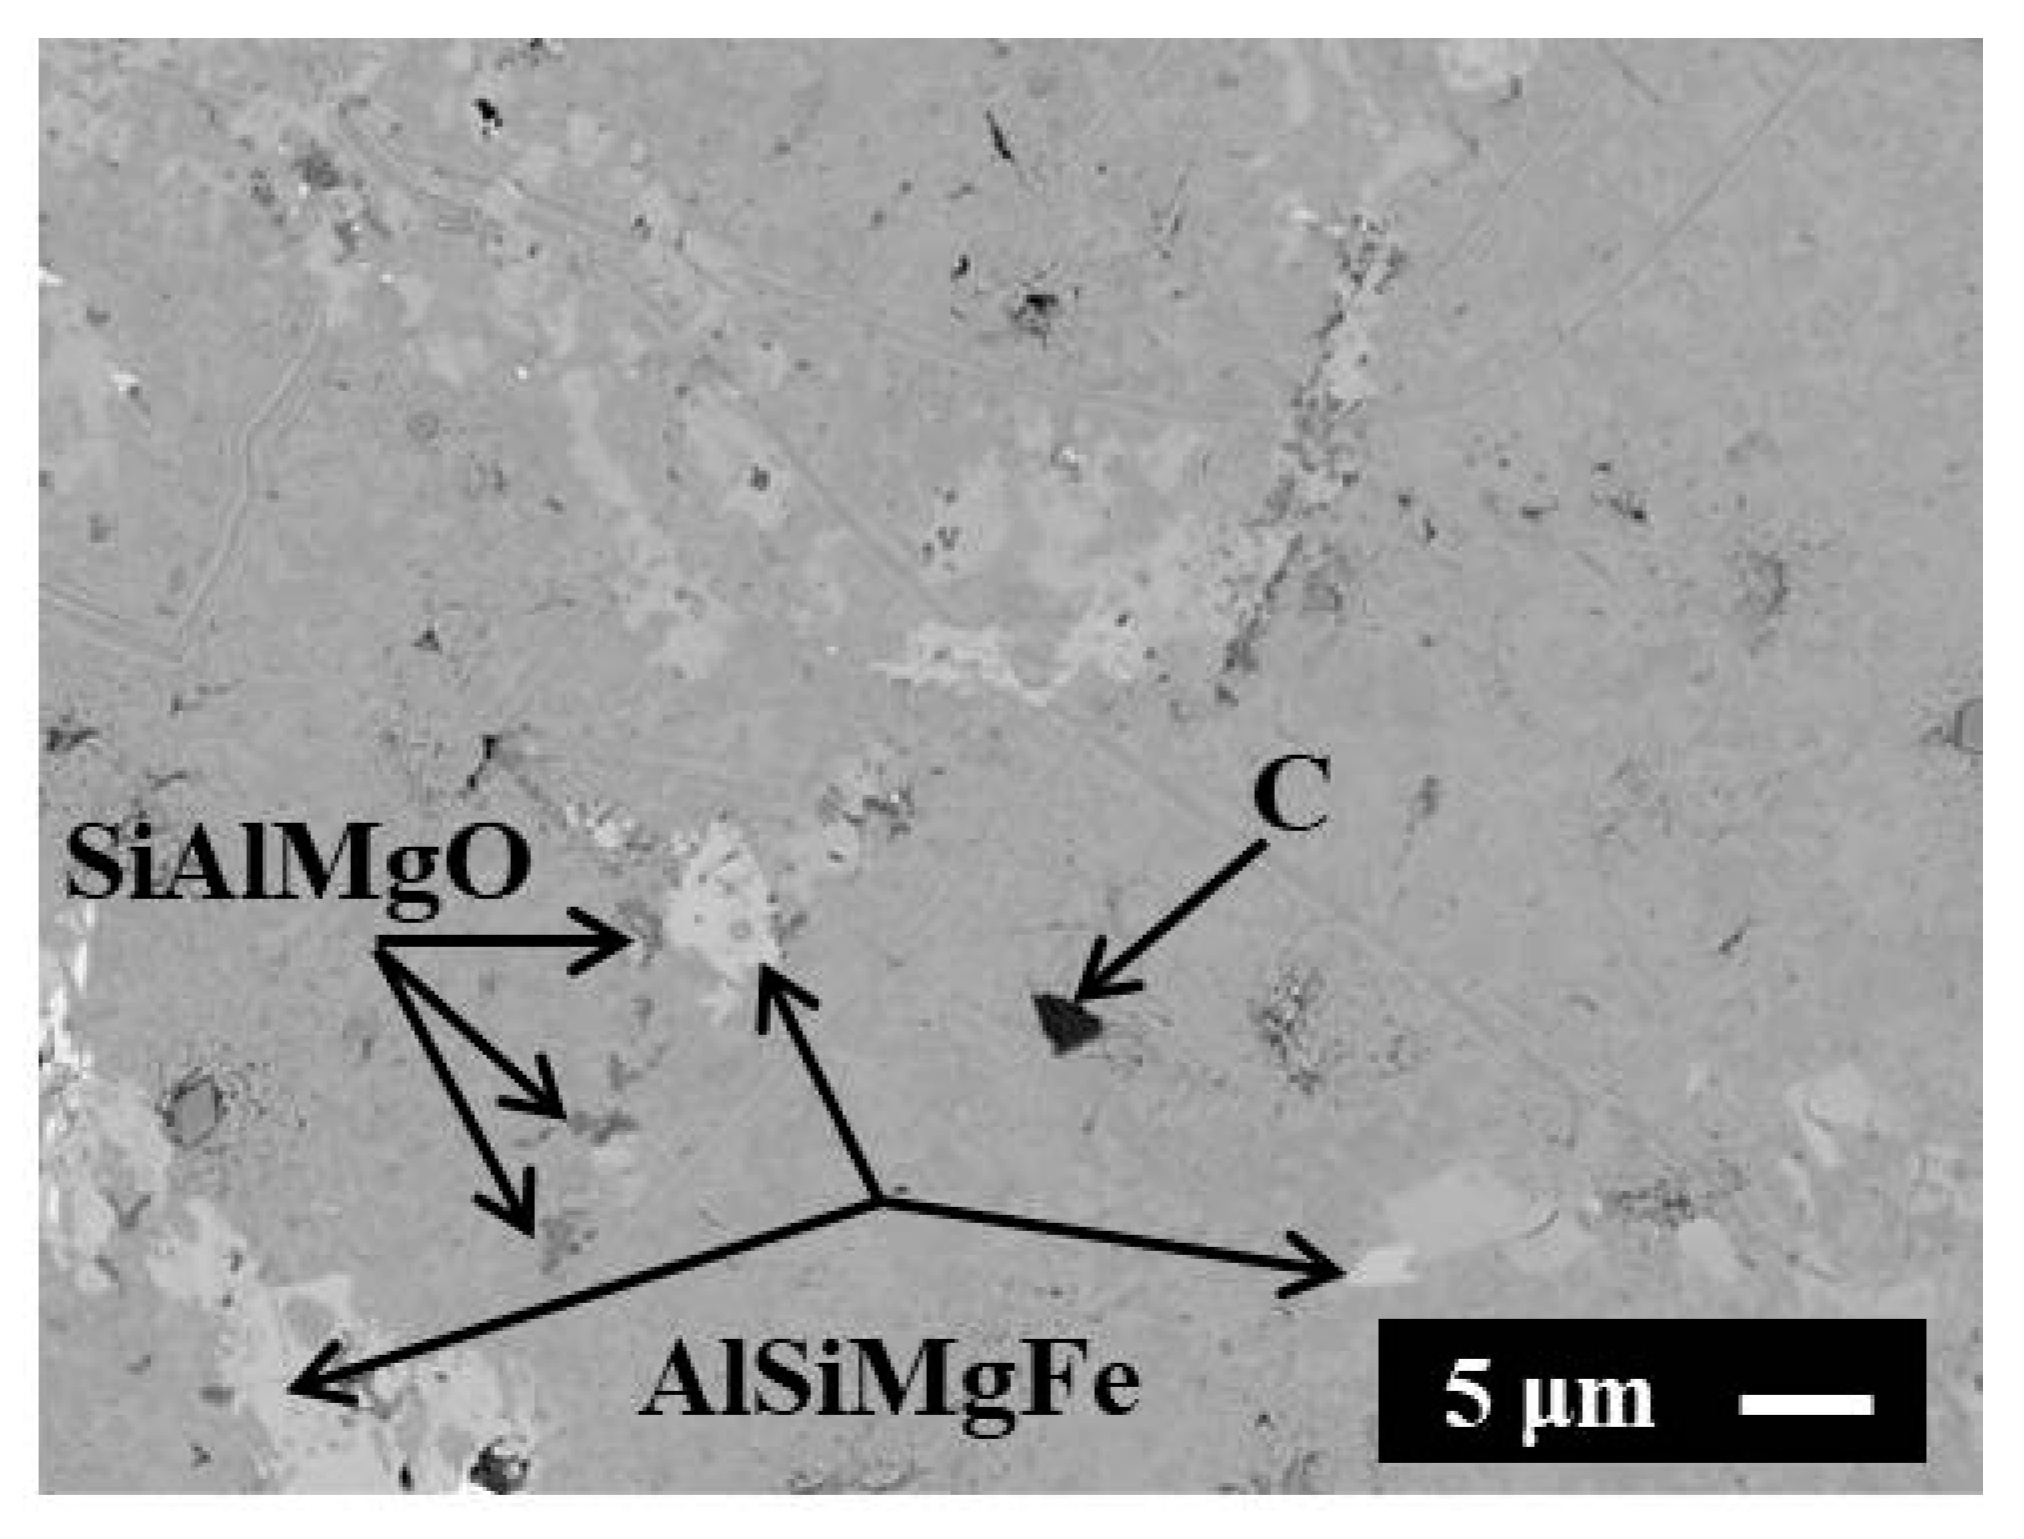
EDS analysis of the foam with 3 vol.% graphite (Figure 6) shows a microstructure consisting of five phases: a dark AlSiMg phase, a lighter SiAl phase, the white phase in this case is a complex AlSiMgFe phase (Fe 12 at.%, Si 24 at.%, Mg 18 at.% and Al balanced), dark regions of complex oxides SiAlMgO (composed mostly from 52 at.% oxygen, 25 at.% Si, 16 at.% Al and 7 at.% Mg) and finally graphite particles (denoted as C in Figure 5) within the foam pore walls. It is important to note that no significant diffusion of carbon to the aluminium matrix and aluminium to the carbon particle was observed.
Within all foams, Ti particles originating from the foaming agent can also be observed, but due to the complexity of the studied foams, SEM images without Ti particles were used in this article.
All three types of foams possess two basic phases: a dark AlSiMg phase and a lighter SiAl (or SiAlMg for SiC additives) phase. White AlFeSi phases and dark regions of complex oxides/spinels can be observed. Finally, additive particles are present in the matrix. The only significant difference is in the white Al5FeSi phase, which in the presence of carbon, changes into an AlSiMgFe phase.
The Al4C3 phase was not observed directly, but its creation on the matrix–particle interface can be expected for both types of additives in the form of a very thin layer, probably local, i.e., not continuously covering an additive.
It can be concluded that the additives influence the resulting structure of the foam and also the composition of the composite foam pore walls; therefore, it can be expected that the properties of prepared composite foams will be influenced.

3.2. Damping and Modulus of Elasticity

Structural damping is characterised by the ability of a material to convert mechanical vibrational energy into heat [13]. Generally, the graphite additive significantly decreases the resonant frequencies at a given density of composite foams in comparison with pure foam. The addition of SiC increases the resonant frequencies at a given density in comparison with pure foams. From a physical understanding of the resonant frequency, it is evident that the composite foam with graphite is softer in comparison with the composite foam with SiC at constant density than the pure foam.
At resonant frequency, the amplitude decay was measured, and from Equation (1), the loss factor η was calculated. As shown in Table 2, pure and composite aluminium foams have a loss factor η of about one order of magnitude higher than that found in fully solid aluminium and its alloys (η about 10−4). The dissipation of energy in the aluminium foam results from the friction between the neighbouring surfaces of the cracks appearing in the structure and partially due to the vibration of the thin pore walls. Higher loss factor values are therefore achieved with foams made of casting aluminium alloys exhibiting very fine porosity with thin pore walls containing a lot of cracks [11,13]. These values are further significantly affected by the addition of the particles (e.g., graphite, SiC) into the powder mixture. Table 2 indicates that the observed loss factor behaves in an opposite manner to the resonant frequencies. The loss factor decreases for SiC and increases for graphite additions in comparison with pure foams at all resonant frequencies. Due to the better wetting of SiC with molten metal and due to the observed reactions (see the product of decomposition in Figure 5) with molten aluminium, the SiC is fully incorporated into the aluminium foam matrix. On the contrary, in the case of graphite additions, additional interfaces are created due to the lower wetting with molten aluminium, thus improving the dissipation of energy (see Figure 4, Figure 5 and Figure 6).
The observed modulus of elasticity for the experimental samples given in Table 2 confirms the previous discussion. The foam with 3 vol.% SiC is stiffer at a given density than the pure foam. On the other hand, the foam with 3 vol.% graphite is softer at a given density than the pure foam and therefore than the composite foam with SiC.
The Ashby model [29] was used to predict the moduli of composite foams:
E/E0 = C × (ρ/ρ0)2
where index 0 denotes the properties of the bulk pore-free material, and C is the material constant. In particular, for foams where bending dominates the deformation behaviour, C = 1 and power-law exponent n = 2, while for foams where deformation occurs by stretching, C = 0.3 and n = 1 [30,31].
When the material constant C was set to 1, the predicted values of the modulus of elasticity were significantly overestimated. By changing the material constant C, it was possible to obtain the observed values of the modulus of elasticity. However, C values varied for pure foams with density. From all obtained material constant C values, the lowest value of 0.34 was observed for the composite foam with 3 vol.% graphite.
Similar differences were acquired for the different structures of Ti6Al4V porous trabecular structures produced by additive laser manufacturing at constant density. Benedetti et al. [32] observed that the constant C and power-law exponent change according to the type of 3D printed porous structures and density. They observed C in the range of 0.36–0.76.
Generally, the graphite additive significantly decreases the resonant frequencies at a given density of composite foams in comparison with pure foam. The addition of SiC increases the resonant frequencies at a given density in comparison with pure foams. This implies that the composite foam with graphite is softer in comparison with the composite foam with SiC at constant density.
It can be concluded that the composite aluminium foams with 3 vol.% SiC are stiffer but have worse damping properties than pure aluminium foams. Composite aluminium foams with 3 vol.% graphite are softer but with better damping properties than pure aluminium foams. Generally, the additives significantly affect the resonant frequencies at a given density of composite foams in comparison with pure foam, thus enabling their further fine tuning for the design of noise attenuation applications of aluminium foam at a required weight.

3.3. Compression Properties

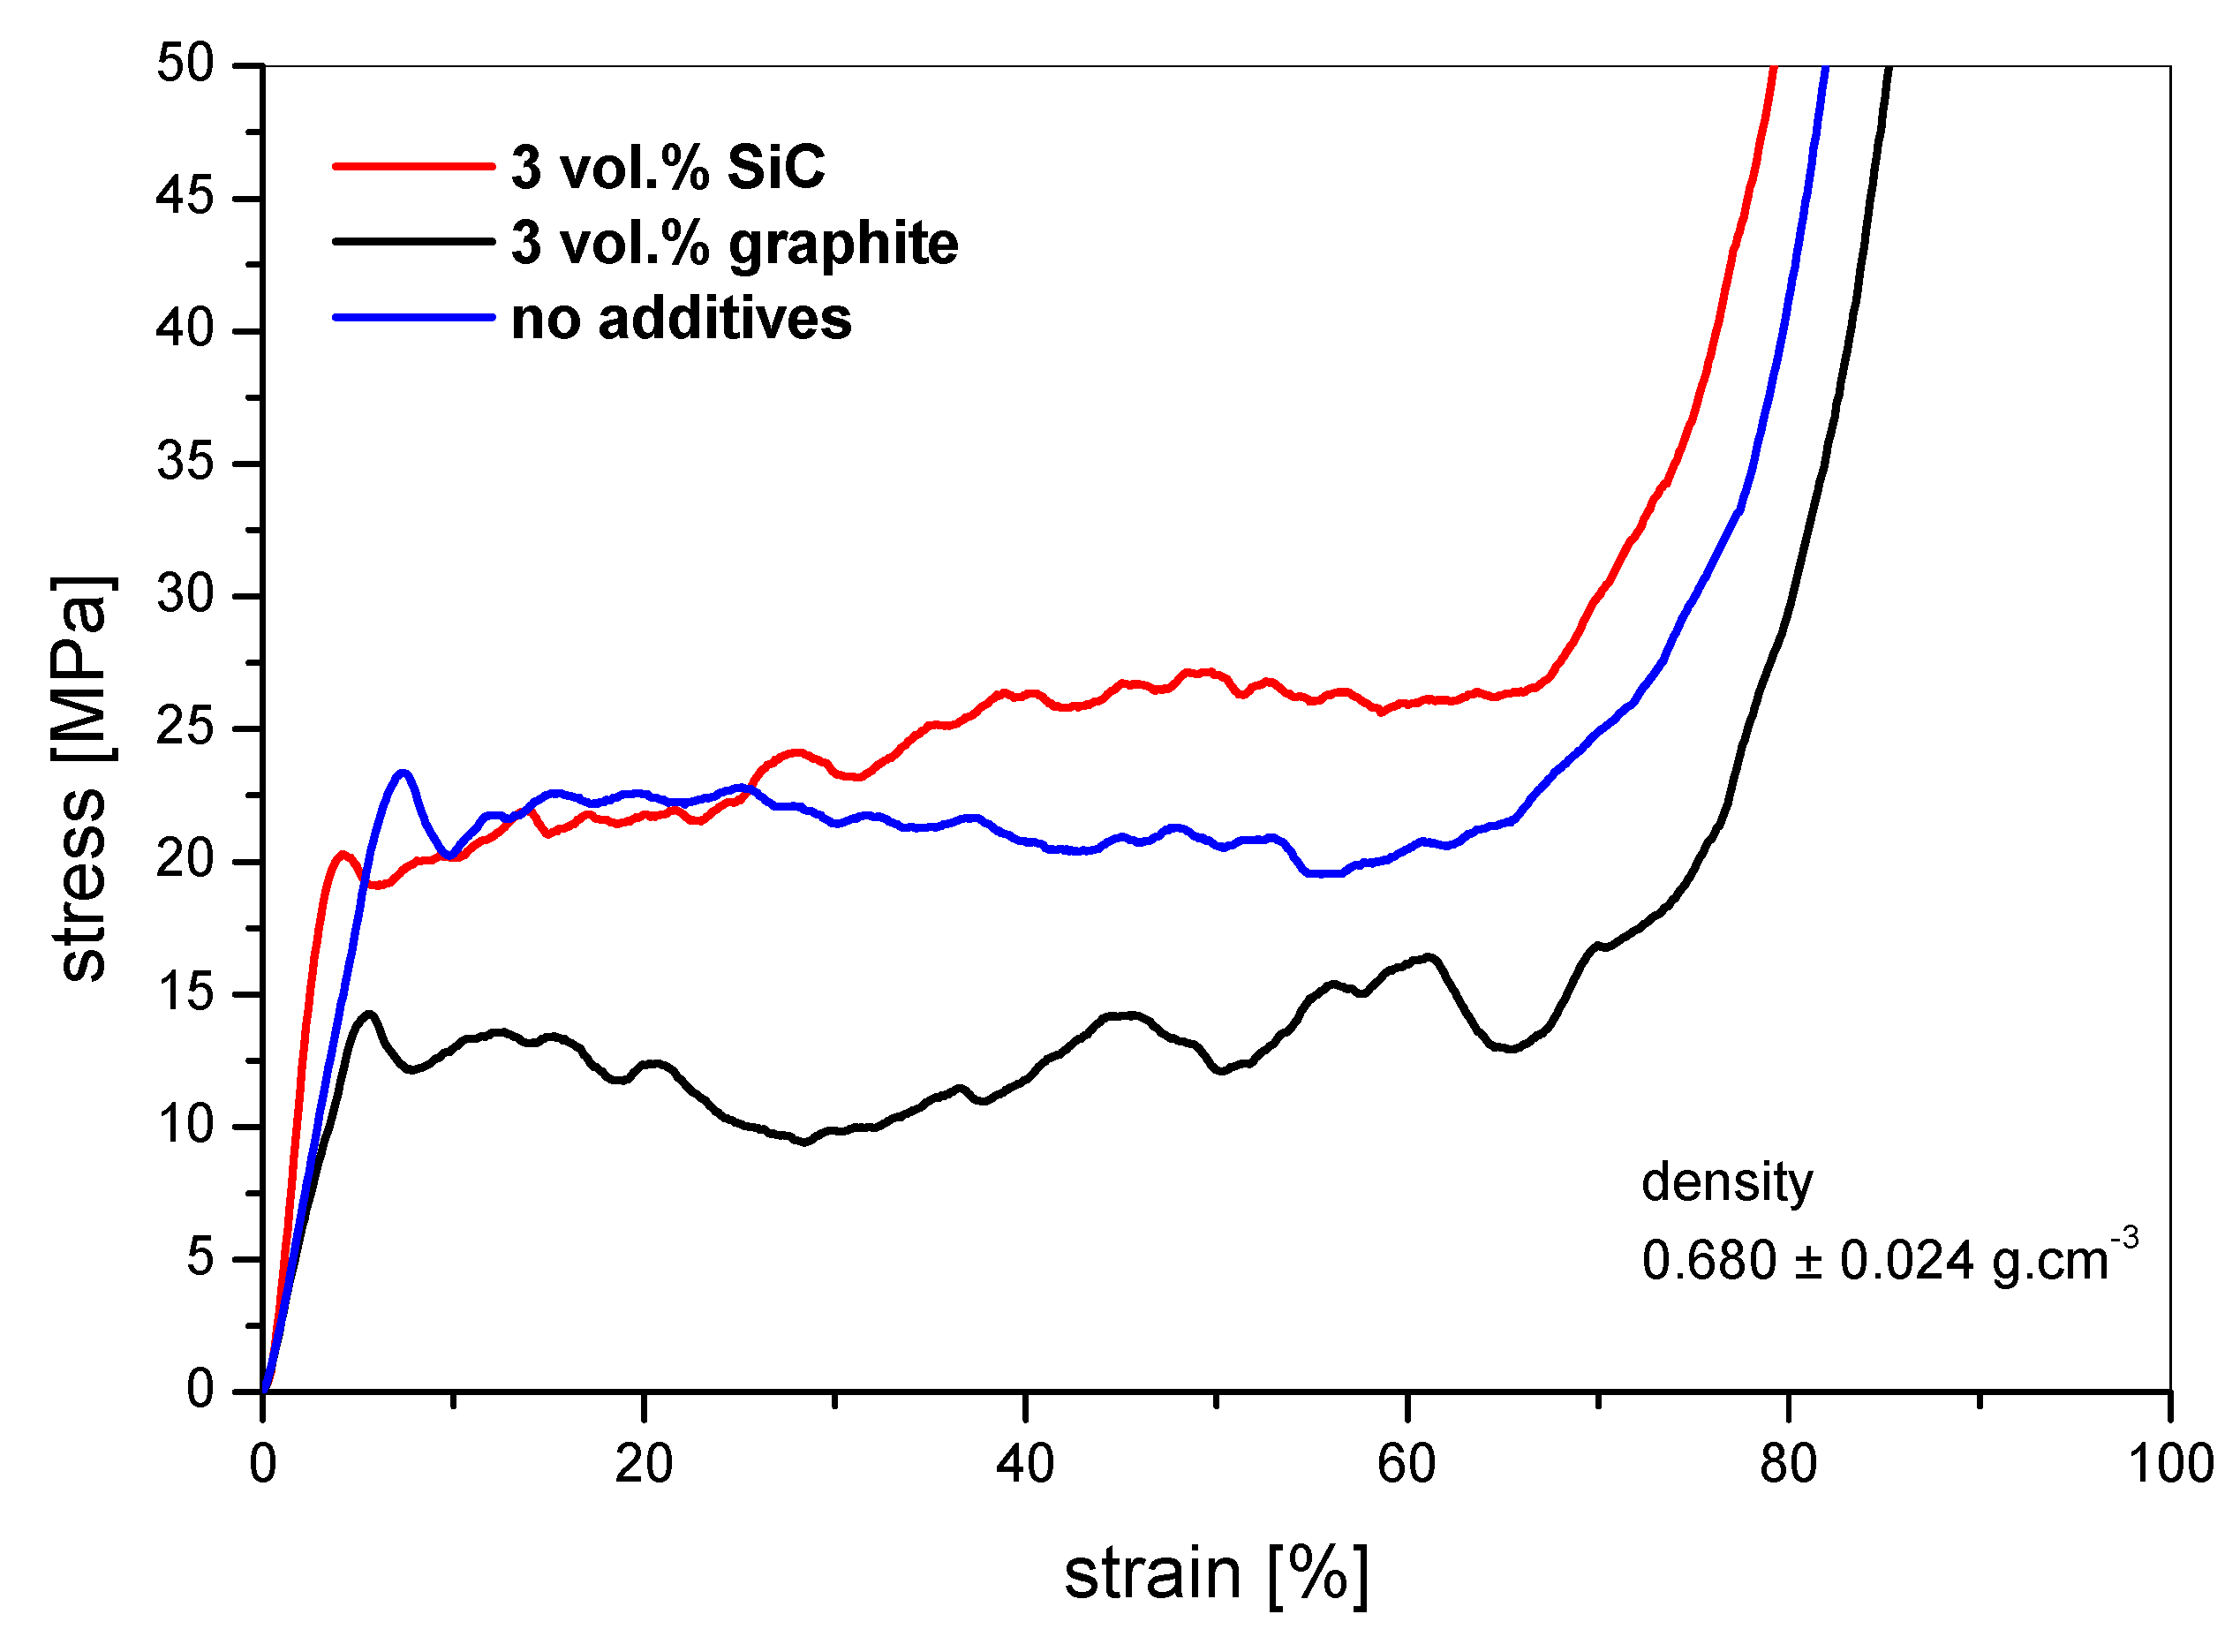
For all pure/composite foams, typical brittle behaviour under compression was observed: a short linear increase, followed by a long plateau region and finally a step densification increase in stress with increasing strain. The stress–strain curves within the plateau region are evidently serrated (see Figure 7), thus confirming the brittle behaviour of the investigated foams. The collapse stress is clearly visible (Figure 7) for all foams. At this point, the macroscopic failure of the foam occurs in the region with the lowest local density, the weakest foam layer [33]. The pure foam without additives has the highest value of collapse stress (see Table 3).
Uzun [34] prepared mixtures of AlSi12 foams reinforced with silicon carbide (SiC—0, 2, 4, 6% wt.) and carbon nanotubes (CNT—0, 0.2, 0.5, 0.8, 1% wt.) by the powder metallurgy method at 750 °C. He found agglomerated CNTs in the microstructure of the foamable precursor and SiC particles with a homogeneous distribution within the precursor. He concluded that increasing tendencies were observed in the case of Young’s modulus and average stress in composite foams depending on an increase in the number of CNT and SiC particles. However, he concluded that the effects of SiC and CNTs on the expansion behaviour of the foamable precursor material were not clear. The low concentration of SiC particles was probably responsible for the difficult evaluation of their effect on the stiffness and strength of foams, as is in the case of the currently investigated composite foams.
Li et al. [35] prepared aluminium (Al) composite foams via the shift-speed ball-milling and space-holder method. They used graphene nanosheets (GNSs) decorated with copper (Cu) nanoparticles as reinforcement. The compressive properties and energy absorption capacity of the composite foams increased at first and then decreased with the increase in the GNSs@Cu content. The GNSs@Cu addition did not change the ductile failure mode of pure Al foams. Again, in this case, the carbon phase after the agglomeration of nanotubes showed decreased mechanical properties, as in the present case.
The collapse stress of brittle porous material (σCS) can be expressed according to Gibson and Ashby [29] in the form of elastic collapse as:
σCS = E0 × C. (ρ/ρ0)2
where E0 is the modulus of elasticity of the used matrix alloy, ρ is the density of the foam, ρ0 is the density of the matrix alloy and C is the material constant.
It is evident that the collapse stress is mainly the function of matrix alloy properties, foam porosity and foam structure (distribution of material in pore faces, average pore size of foam and thickness of surface skin). All these parameters are simultaneously affected by admixed particles, and it is necessary to discuss them.
If we assume an almost constant density of foams, the next important parameter is the modulus of elasticity of the matrix alloy. For aluminium alloys, it is around 70 GPa [36]. How is it affected by the additions? In general, SiC has a modulus of elasticity of 450 [37] GP and anisotropic graphite of 100 GPa [38]. After taking into account the rule of the mixture with 3 vol.% additives, it is evident that the effect of additions on the modulus of the matrix alloy is almost negligible.
Aluminium foams usually collapse or fail via the weakest pore layer, the relative density of which is lower than the overall apparent density of the foam [33]. The position of this weakest link also depends strongly on the loading direction, the presence of surface skin on the foamed sample and also on the used cell wall material. The highest inhomogeneities were observed for the composite foam with 3 vol.% graphite. This can explain the significantly lower compression strength of this foam. In the case of the SiC composite foam, the additives stabilise the foam better, but their amount is small, only 3 vol.%; therefore, there are regions with lower and higher concentrations of them locally. Therefore, the final foam structure after foaming could be locally less dense as in the case of pure foams, thus leading again to a lower compression strength. This was confirmed by the more variable pore size distribution in Figure 2 and Table 1. After 30% strain, when the less homogeneous foam volumes are compressed, the foam with SiC is stronger than the pure foam (see Figure 7).
Guden et al. [39] prepared SiC–particulate aluminium composite foams from powder compacts with titanium hydride as the foaming agent. The composite foam Al and 10 and 20 wt.% SiCp foams showed higher compressive stresses but a more brittle behaviour as compared with aluminium foams. They also found that SiCp addition (10 wt.%) increased the expansion of the Al powder compacts, presumably by increasing the surface and bulk viscosities. This indicates that the currently used 3 vol.% SiC is not enough to significantly change the strength of composite foam.
Strain at compression strength also depends on foam composition. The highest values were observed for pure foams.
Aldoshan and Khanna [40] prepared carbon nanotube (CNT)-reinforced closed-cell aluminium foams using the liquid metallurgy route. They studied the compressive mechanical behaviour of CNT-reinforced Al foam under quasistatic and dynamic loading conditions. Mechanical properties such as peak stress, plateau stress and energy absorption increased with the increase in relative density; however, the densification strain decreased with the increase in relative density.
This situation was not observed, as in general, the densification strength increases with increasing density for composite foams. On the contrary, the length of the plateau is longer for composite foams (see Table 3), probably due to the higher inhomogeneity of the composite foam structure.
The energy absorption efficiency is calculated by the absorbed energy per unit volume of the foam divided by the energy absorbed by an ideal absorber for the given densification strain of the foam. In the case of composite foams (Figure 8), the efficiency is almost similar at constant density.
On the contrary, the composition of foams significantly affects the absorption of energy of the investigated foams at a given strain (Table 4 and Figure 9). The composite foam with graphite absorbs a smaller amount of energy per foam volume than other foam. The best characteristics are shown by the composite foam with 3 vol.% SiC.
In summary, the compression properties of composite foams are dependent on the composition and structure of foams.
Due to its large inhomogeneous structure, the composite foam with 3 vol.% graphite possesses a smaller value of compression strength and therefore smaller energy absorption per unit volume at a given strain.
The best energy per foam volume values are shown by the composite foam with 3 vol.% SiC due to local inhomogeneities as a result of the small amount of SiC within the foam.
The energy absorption efficiency at constant density is almost independent of the composition.
The length of the plateau is longer for composite foams due to the higher inhomogeneity of composite foam structures. The pure foam possesses the highest value of collapse stress, as its structure is more homogeneous.

4. Conclusions

Aluminium foams and foams containing 3 vol.% graphite or SiC were prepared by the powder metallurgical route.
It was observed that the foams prepared with graphite are more difficult to foam. Such foams are prone to collapse with a heterogeneous structure containing large and small pores in comparison with pure aluminium foams and foams with SiC prepared under the same technological conditions. A small number of SiC particles also leads to a locally inhomogeneous structure (pore size distribution scatter). This is the effect of low-concentration SiC in the matrix alloy. The liquid foam with SiC is more stable, with a smaller coalescence of pores and foam collapse than the foam with graphite.
The microstructures of the investigated foams cell walls are principally similar. EDS analysis of foam phases shows that all three types of foams possess two basic phases: a dark AlSiMg phase and a lighter SiAl (or SiAlMg for SiC additives) phase. Dark regions of complex oxides/spinels can be observed in all foams. Only a white AlFeSi phase is transformed to an AlSiMgFe phase at 3 vol.% graphite, which is significantly shorter and more homogeneously distributed in the foam cell walls than the pure foam and the foam with 3 vol.% SiC. Finally, Ti and additive particles are present in the cell wall structure: SiC particles are visible in the foam microstructure, while graphite particles look more like pores within the foam cell walls.
The Ashby model was used to predict the modulus of elasticity of composite foams. When the material constant C = 1 (bending of cell walls), the predicted values were significantly overestimated. The variation of C led to measured values of the modulus of elasticity, but C values for pure foams varied with density. The lowest C value was observed for the composite foam with 3 vol.% graphite C = 0.34, indicating predominant stretching of the cell walls during deformation.
It can be concluded that foams with 3 vol.% SiC are stiffer but have worse damping properties than pure foams. Composite aluminium foams with 3 vol.% graphite are softer but with better damping properties than pure foams. Generally, additives significantly affect the resonant frequencies at a given density of composite foams in comparison with pure foams, thus enabling their further fine tuning for the design of noise attenuation applications of aluminium foam at a required density.
Typical brittle behaviour of the stress–strain curves under compression was observed for all foams. The collapse stress was clearly visible. The highest value of collapse stress was shown by the pure foam without additives. The stress–strain curves within the plateau region are strongly serrated due to the brittle behaviour of the foams.
Due to its large inhomogeneous structure, the composite foam with 3 vol.% graphite possesses a smaller value of compression strength and therefore smaller energy absorption per unit volume at a given strain.
The best energy absorption per foam volume values are shown by the composite foam with 3 vol.% SiC due to local inhomogeneities as a result of the small amount of SiC within the foam.
The energy absorption efficiency at constant density is almost independent of the composition. The length of the plateau is longer for composite foams, probably also due to the higher inhomogeneity of the composite foam structures.
These results provide a good basis for the design of damping applications of foams, shifting the resonant frequencies of the foam envelopes of motors, pumps, castings and increasing damping at a required stiffness, strength and good energy absorption in the case of any sudden incident for space structures.

Author Contributions

Conceptualisation, J.K. and F.S.; methodology, F.S.; investigation, J.K. and N.M.; microscopy, M.N.; writing, J.K. and M.N.; project administration, J.J.; funding acquisition, J.J. All authors have read and agreed to the published version of the manuscript.

Funding

This research was funded by Slovak Research and Development Agency under the contract APVV-17-0580 (Project: Research of roofing with the integrated function of the heat exchanger, acronym: RoofFoam).

Acknowledgments

The authors thank retired colleague P. Minár and deceased colleague P. Tobolka for the support with the samples and experiments.

Conflicts of Interest

The authors declare no conflict of interest.

References

  1. Simančík, F.; Rajner, W.; Laag, R. Alulight—Aluminum foam for lightweight construction. SAE Tech. Pap. 2000. 2000-01-0337. [Google Scholar] [CrossRef]
  2. Linul, E.; Pietras, D.; Sadowski, T.; Marşavina, L.; Rajak, D.P.; Kováčik, J. Crashworthiness performance of lightweight Composite Metallic Foams at high temperatures. Compos. Part A 2021, 149, 106516. [Google Scholar] [CrossRef]
  3. Movahedi, N.; Linul, E. Radial crushing response of ex-situ foam-filled tubes at elevated temperatures. Compos. Struct. 2021, 277, 114634. [Google Scholar] [CrossRef]
  4. Khezrzadeh, O.; Mirzaee, O.; Emadoddin, E.; Linul, E. Anisotropic Compressive Behavior of Metallic Foams under Extreme Temperature Conditions. Materials 2020, 13, 2329. [Google Scholar] [CrossRef]
  5. Das, S.; Rajak, D.K.; Khanna, S.; Mondal, D.P. Energy Absorption Behavior of Al-SiC-Graphene Composite Foam under a High Strain Rate. Materials 2020, 13, 783. [Google Scholar] [CrossRef] [Green Version]
  6. Yu, Y.; Cao, Z.; Wang, J.; Tu, G.; Mu, Y. Compressive Behavior of Al-TiB2 Composite Foams Fabricated under Increased Pressure. Materials 2021, 14, 5112. [Google Scholar] [CrossRef] [PubMed]
  7. Liu, H.; Pan, W.; Si, F.; Huang, K.; Liu, Y.; Liu, J. Enhanced Compressive Property of Al Composite Foams at Elevated Temperatures via Plasma Electrolytic Oxidation. Metals 2018, 8, 118. [Google Scholar] [CrossRef] [Green Version]
  8. Epasto, G.; Distefano, F.; Mozafari, H.; Linul, E.; Crupi, V. Nondestructive Evaluation of Aluminium Foam Panels Subjected to Impact Loading. Appl. Sci. 2021, 11, 1148. [Google Scholar] [CrossRef]
  9. Linul, E.; Khezrzadeh, O. Axial crashworthiness performance of foam-based composite structures under extreme temperature conditions. Compos. Struct. 2021, 271, 114156. [Google Scholar] [CrossRef]
  10. Kaczyński, P.; Ptak, M.; Gawdzińska, K. Energy absorption of cast metal and composite foams tested in extremely low and high-temperatures. Mater. Des. 2020, 196, 109114. [Google Scholar] [CrossRef]
  11. Jiejun, W.; Chenggong, L.; Dianbin, W.; Manchang, G. Damping and sound absorption properties of particle reinforced Al matrix composite foams. Compos. Sci. Technol. 2003, 63, 569–574. [Google Scholar] [CrossRef]
  12. Mepura. Data Sheets; Mepura GmbH.: Ranshofen, Austria, 1995. [Google Scholar]
  13. Kováčik, J.; Tobolka, P.; Simančík, F. Noise attenuation using aluminium foams. In Metal. Foams and Porous Metal. Structures; Banhart, J., Ashby, M.F., Fleck, N.A., Eds.; Verlag MIT Publishing: Bremen, Germany, 1999; pp. 405–408. [Google Scholar]
  14. Degischer, H.P.; Kriszt, B. Handbook of Cellular Metals, Production, Processing, Applications, 1st ed.; Degischer, H.P., Kriszt, B., Eds.; Wiley-VCH: Weinheim, Germany, 2002; pp. 215–241. [Google Scholar]
  15. Parveez, B.; Jamal, N.A.; Maleque, A.; Yusof, F.; Jamadon, N.H.; Adzila, S. Review on advances in porous Al composites and the possible way forward. J. Mater. Res. Technol. 2021, 14, 2017–2038. [Google Scholar] [CrossRef]
  16. Matli, P.R.; Sheng, J.G.Y.; Parande, G.; Manakari, V.; Chua, B.W.; Wong, S.C.K.; Gupta, M. A Novel Method of Light Weighting Aluminium Using Magnesium Syntactic Composite Core. Crystals 2020, 10, 917. [Google Scholar] [CrossRef]
  17. Campana, G.; Ascari, A.; Fortunato, A. Laser foaming for joining aluminum foam cores inside a hollow profile. Opt. Laser Technol. 2013, 48, 331–336. [Google Scholar] [CrossRef]
  18. Ghiani, C.; Linul, E.; Porcu, M.C.; Marsavina, L.; Movahedi, N.; Aymerich, F. Metal Foam-Filled Tubes as Plastic Dissipaters in Earthquake-Resistant Steel Buildings. 2018 IOP Conf. Ser. Mater. Sci. Eng. 2018, 416, 012051. [Google Scholar] [CrossRef]
  19. Rajak, D.K.; Linul, E. Crushing response of Composite Metallic Foams: Density and High Strain Rate effects. J. Alloy. Compd. 2021, 871, 159614. [Google Scholar] [CrossRef]
  20. Bauer, B.; Kralj, S.; Busic, M. Production and application of metal foams in casting technology. Teh. Vjesn. 2013, 20, 1095–1102. [Google Scholar]
  21. Ubertalli, G.; Ferraris, S. Al-Based Metal Foams (AMF) as Permanent Cores in Casting: State-of-the-Art and Future Perspectives. Metals 2020, 10, 1592. [Google Scholar] [CrossRef]
  22. Nammi, S.K.; Edwards, G.; Shirvani, H. Effect of cell-size on the energy absorption features of closed-cell aluminium foams. Acta Astronaut. 2016, 128, 243–250. [Google Scholar] [CrossRef]
  23. Maiorano, L.P.; Molina, J.M. Guiding heat in active thermal management: One-pot incorporation of interfacial nano-engineered aluminium/diamond composites into aluminium foams. Compos. Part A 2020, 133, 105859. [Google Scholar] [CrossRef]
  24. Sunar, T.; Cetin, M. Manufacturing of B4C particle reinforced A360 aluminium cellular composite materials by the integration of stir casting and space holder methods. J. Compos. Mater. 2021, 55, 3763–3773. [Google Scholar] [CrossRef]
  25. Gopinathan, A.; Jerz, J.; Kováčik, J.; Dvorák, T. Investigation of the Relationship between Morphology and Thermal Conductivity of Powder Metallurgically Prepared Aluminium Foams. Materials 2021, 14, 3623. [Google Scholar] [CrossRef]
  26. Bruel & Kjaer. Mechanical Vibration and Shock Measurements, 2nd ed.; K. Larsen & Son: Soborg, Denmark, 1980. [Google Scholar]
  27. Kaptay, G.; Bader, E.; Bolyan, L. Interfacial Forces and Energies Relevant to Production of Metal Matrix Composites. Mater. Sci. Forum 2000, 329–330, 151–156. [Google Scholar] [CrossRef]
  28. Hoch, M.; Johnston, H.L. Formation, Stability and Crystal Structure of the Solid Aluminum Suboxides: Al2O and AlO1. J. Am. Chem. Soc. 1954, 76, 2560–2561. [Google Scholar] [CrossRef]
  29. Gibson, L.; Ashby, M. Cellular Solids: Structure and Properties, 2nd ed.; Cambridge University Press: Cambridge, UK, 1997. [Google Scholar] [CrossRef]
  30. Deshpande, V.S.; Ashby, M.F.; Fleck, N.A. Foam topology: Bending versus stretching dominated architectures. Acta Mater. 2001, 49, 1035–1040. [Google Scholar] [CrossRef]
  31. Wang, A.J.; McDowell, D.L. In-Plane Stiffness and Yield Strength of Periodic Metal Honeycombs. J. Eng. Mater. Technol. 2004, 126, 137–156. [Google Scholar] [CrossRef]
  32. Benedetti, M.; Klarin, J.; Johansson, F.; Fontanari, V.; Luchin, V.; Zappini, G.; Molinari, A. Study of the Compression Behaviour of Ti6Al4V Trabecular Structures Produced by Additive Laser Manufacturing. Materials 2019, 12, 1471. [Google Scholar] [CrossRef] [PubMed] [Green Version]
  33. Simančík, F. Reproducibility of aluminium foam properties. In Metal. Foams and Porous Metal. Structures; Banhart, J., Ashby, M.F., Fleck, N.A., Eds.; Verlag MIT Publishing: Bremen, Germany, 1999; p. 235. [Google Scholar]
  34. Uzun, A. Production of aluminium foams reinforced with silicon carbide and carbon nanotubes prepared by powder metallurgy method. Compos. Part B 2019, 172, 206–217. [Google Scholar] [CrossRef]
  35. Li, W.T.; Yang, X.D.; He, C.N.; Sha, J.W.; Shi, C.S.; Li, J.J.; Zhao, N.Q. Compressive responses and strengthening mechanisms of aluminum composite foams reinforced with graphene nanosheets. Carbon 2019, 153, 396–406. [Google Scholar] [CrossRef]
  36. Kováčik, J.; Jerz, J.; Mináriková, N.; Marsavina, L.; Linul, E. Scaling of compression strength in disordered solids: Metallic foam. Frat. Integrità Strutt. 2016, 10, 55–62. [Google Scholar] [CrossRef] [Green Version]
  37. Krizik, P.; Balog, M.; Matko, I.; Svec, P.; Cavojsky, M.; Simancik, F. The effect of a particle–matrix interface on the Young’s modulus of Al–SiC composites. J. Compos. Mater. 2016, 50, 99–108. [Google Scholar] [CrossRef]
  38. Mazloum, A.; Kováčik, J.; Emmer, Š.; Sevostianov, I. Copper–graphite composites: Thermal expansion, thermal and electrical conductivities, and cross-property connections. J. Mater. Sci. 2016, 51, 7977–7990. [Google Scholar] [CrossRef]
  39. Guden, M.; Yüksel, S. SiC-particulate aluminum composite foams produced from powder compacts: Foaming and compression behavior. J. Mater. Sci. 2006, 41, 4075–4084. [Google Scholar] [CrossRef] [Green Version]
  40. Aldoshan, A.; Khanna, S. Effect of relative density on the dynamic compressive behavior of carbon nanotube reinforced aluminum foam. Mater. Sci. Eng. A 2017, 689, 17–24. [Google Scholar] [CrossRef]
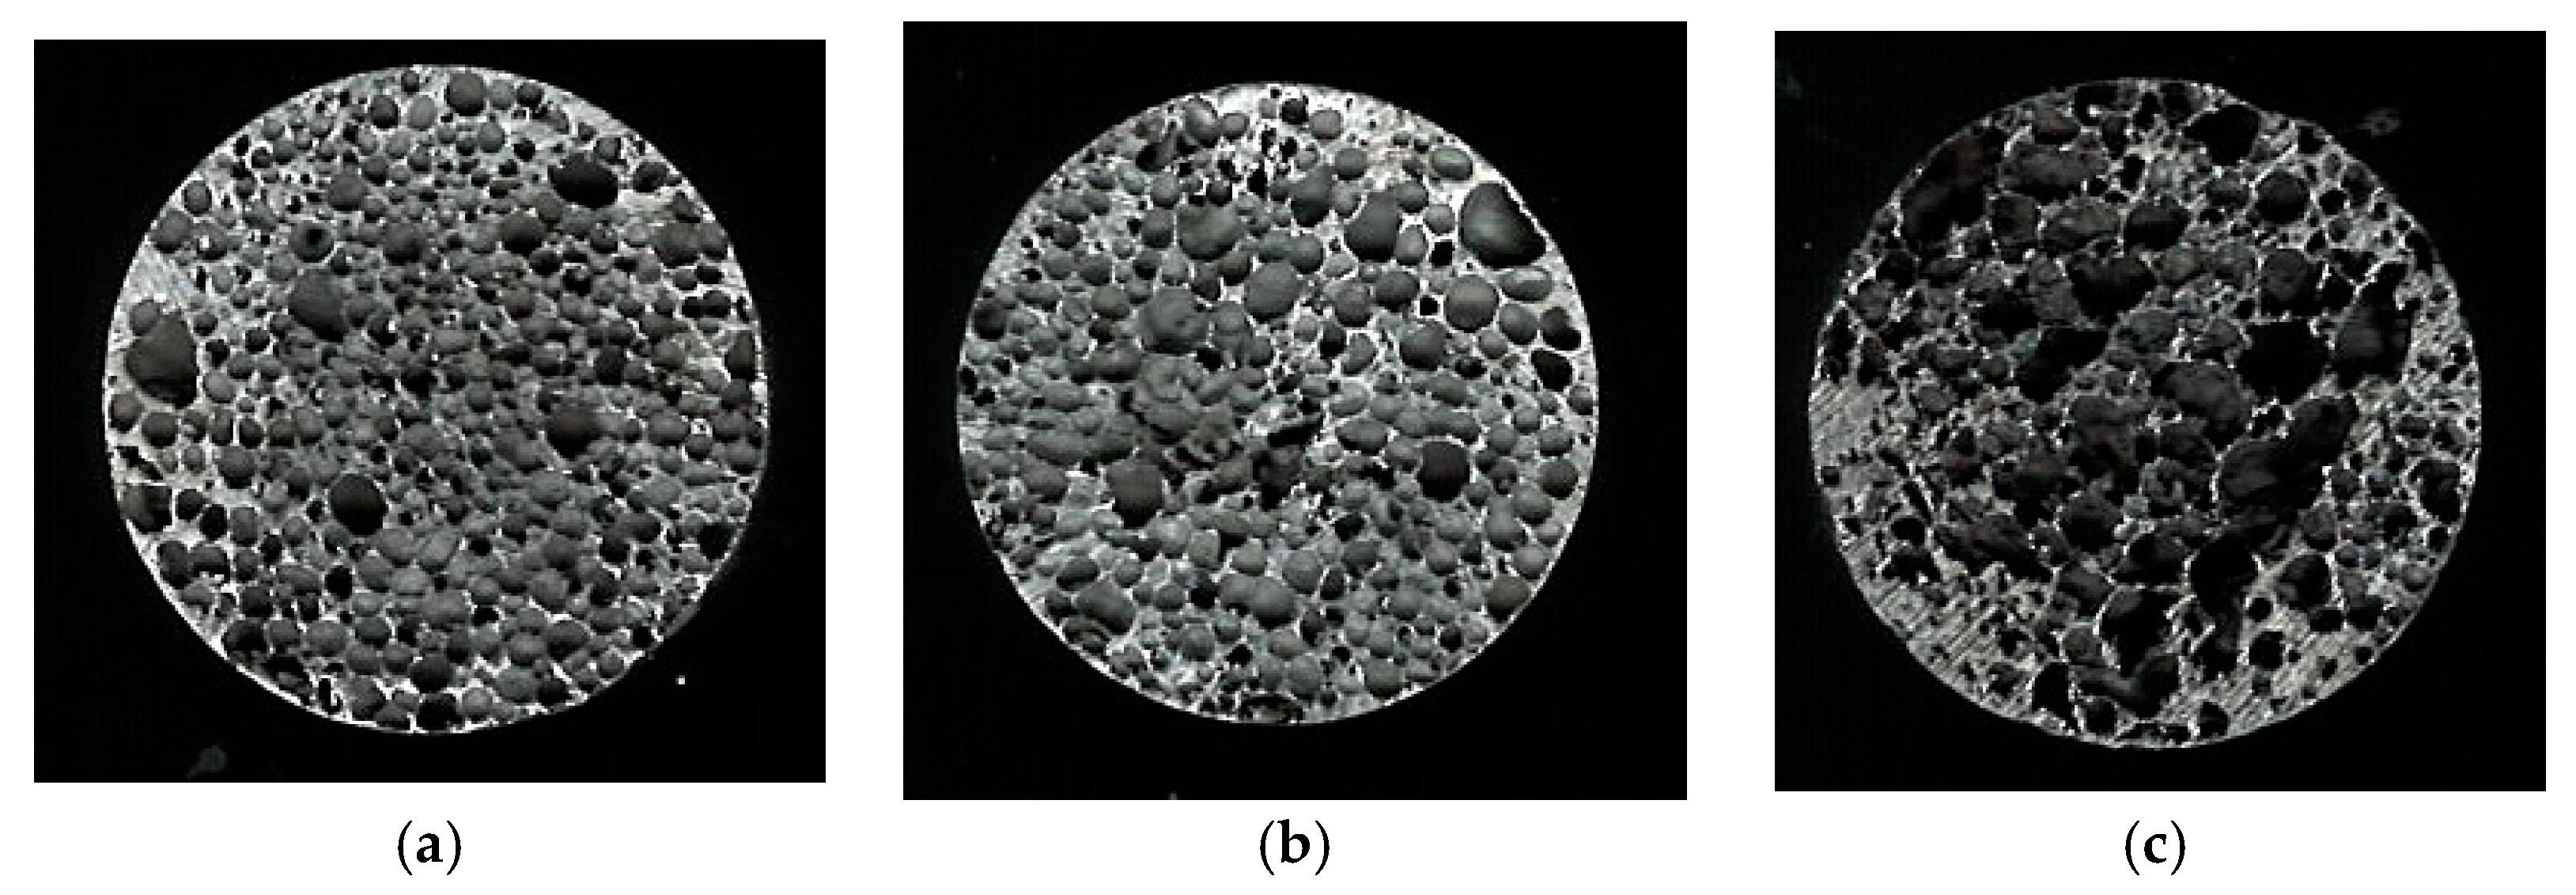
Figure 1. Cross-sections of prepared foams after cutting and prior compression tests. Diameter of all samples is 28 mm. From left to right: Pure foam (a), foam with 3 vol.% SiC (b) and foam with 3 vol.% graphite (c). Density: 0.65–0.69 g·cm−3.
Processes 09 02031 g001
Figure 2. Pore size distributions in foam cross-sections depicted in Figure 1. Pure foam (a), foam with 3 vol.% SiC (b) and foam with 3 vol.% graphite (c). Density: 0.65–0.69 g·cm−3.
Processes 09 02031 g002
Figure 3. Microstructure of AlSi12Mg0.6Fe0.3Ti0.4 aluminium foams cell walls: (a) without, (b) with 3 vol.% SiC and (c) with 3 vol.% graphite (SEM).
Processes 09 02031 g003
Figure 4. Various phases within microstructure of AlSi12Mg0.6Fe0.3Ti0.4 aluminium foam (EDS SEM).
Processes 09 02031 g004
Figure 5. Various phases within microstructure of AlSi12Mg0.6Fe0.3Ti0.4 aluminium foam with 3 vol.% SiC (SEM).
Processes 09 02031 g005
Figure 6. Various phases within microstructure of AlSi12Mg0.6Fe0.3Ti0.4 aluminium foam with 3 vol.% graphite (SEM).
Processes 09 02031 g006
Figure 7. Stress–strain curves of PM aluminium foams with additives. Density: 0.680 ± 0.024 g·cm−3.
Processes 09 02031 g007
Figure 8. Energy absorption efficiency of PM aluminium foams with additives. Density: 0.680 ± 0.024 g·cm−3.
Processes 09 02031 g008
Figure 9. Absorbed energy per unit volume as a function of strain of PM aluminium foams with additives. Density: 0.680 ± 0.024 g·cm−3.
Processes 09 02031 g009
Table 1. Measured geometric properties of composite foams structures in Figure 1. Average pore size is determined as the most probable pore size observed within the structure.
FoamDensityAverage DiameterNumber of PoresAverage Pore Size
Type(g·cm−3)(mm)(-)(mm)
No additives0.520.53 ± 0.355511.03
3 vol.% SiC0.590.39 ± 0.245180.69
3 vol.% graphite0.640.69 ± 0.922814.22
Table 2. Measured modulus of elasticity and average loss factor of the composite aluminium foams. The results of the Ashby model 1 are given for comparison, with C = 1 and C as variables.
FoamDensityResonant Frequency (Hz)ηEEAshby
(C = 1)
C
Type(g·cm−3)f1f2f3(-)(GPa)(GPa)(-)
No additives0.52822236845450.0023 ± 0.00071.26 ± 0.235.550.56
No additives0.761065267648230.0038 ± 0.00143.10 ± 0.182.600.49
3 vol.% SiC0.591002276551320.0017 ± 0.00042.15 ± 0.323.840.56
3 vol.% graphite0.64767222541430.0034 ± 0.00201.36 ± 0.174.030.34
1 For the model, the following values were used: bulk modulus of Al alloy of 70 Gpa, SiC of 450 GP and anisotropic graphite of 100 Gpa with a bulk density of 2.7 g·cm−3, 3.21 g·cm−3 and 2.2 g·cm−3, respectively. The rule of mixture was used to take into account the volume fraction of additives of 0.03.
Table 3. Aluminium foam samples compression test results: density of foam, collapse stress (σCS), strain at CS, length of plateau and densification stress (DS).
FoamDensityσcsStrain@CSLength of PlateauσDs
Type(g·cm−3)(MPa)(%)(GPa)(MPa)
Pure0.65223.347.2360.3823.28
3 vol.% SiC0.69420.274.1663.5227.18
3 vol.% graphite0.69414.265.6163.6916.29
Pure0.55816.905.2063.8921.09
3 vol.% SiC0.75417.953.6967.1625.39
3 vol.% SiC0.78522.394.4467.1936.82
3 vol.% SiC0.81826.435.3760.7426.46
3 vol.% graphite0.82321.594.4269.0629.36
3 vol.% graphite0.88427.555.4965.7627.63
Table 4. Aluminium foam samples energy absorption characteristics for compression test: density of foam, amount of absorbed energy per unit volume at 25%, 50% and 75% deformation.
FoamDensityEA@25% StrainEA@50% StrainEA@75% Strain
Type(g·cm−3)(MJ·m−3)(MJ·m−3)(MJ·m−3)
Pure0.6524.8310.1415.71
3 vol.% SiC0.6944.8311.1518.12
3 vol.% graphite0.6942.875.769.53
Pure0.5583.737.7412.63
3 vol.% SiC0.7543.899.1315.28
3 vol.% SiC0.7855.9413.8922.79
3 vol.% SiC0.8185.7911.2717.16
3 vol.% graphite0.8235.3210.7316.74
3 vol.% graphite0.8845.048.0612.71
Publisher’s Note: MDPI stays neutral with regard to jurisdictional claims in published maps and institutional affiliations.