Article

Measuring the Flow Functions of Pharmaceutical Powders Using the Brookfield Powder Flow Tester and Freeman FT4

by
Mark Christopher Leaper
Department of Chemical Engineering, Loughborough University, Loughborough LE11 3TU, UK
Processes 2021, 9(11), 2032; https://doi.org/10.3390/pr9112032
Submission received: 18 October 2021 / Revised: 10 November 2021 / Accepted: 11 November 2021 / Published: 13 November 2021

Abstract

:
This study examined the feasibility of combining data from different powder flow testers to determine the flow function characteristics of pharmaceutical powders. The Brookfield PFT and Freeman FT4 can measure flow function over different scales of consolidation load but were found to be most complementary with CRM limestone powder and lactose. The brittle behaviour of Easytab particles at higher loads made obtaining repeatable results with the FT4 challenging. By using the method of Wang et al., where the flow function coefficient ffc is plotted against the dimensionless cohesion C* (measured cohesion Ta divided by the initial compaction I), a plot was formed which could be used to predict the behaviour of other systems, which compared well with previous studies.

1. Introduction

Measuring the flow characteristics of powders in a meaningful way is a significant challenge in comparison to characterising other materials, but is essential if processes and products are to be optimised without the generation of waste or excessive use of energy. The first method for doing this was the Jenike shear cell [1], which measured the movement of pre-consolidated planes of powder over each other whilst experiencing a normal load to construct a series of yield loci; these could then be used to plot the flow function, which allowed the design of a suitable hopper and a quantitative comparison of samples compacted under different conditions. Variations of this test included time consolidation, where the powder was loaded for a significant amount of time prior to the test, and wall friction, where the movement of the powder across different surfaces was also measured to provide data on silo design. Obtaining good data from this tester requires an experienced and skilled operator, and variation between operators is still likely. In order to improve on this design, devices that are easier to operate under repetitive conditions have been developed. The next generation of powder flow analysers include rotational shear cells and uniaxial and multi-axial compression testers; these have been compared and contrasted by Schwedes et al. [2].
Recently there has been a change of emphasis regarding the use of the data, moving from silo design to powder product design for uses in applications such as pharmaceuticals, food, and personal care, with the test samples often having higher value and smaller mass. An extreme example is the production of freeze-dried materials in vials, where the small samples and required integrity only permit analysis using tumbling motion [3]. Another example is the testing of how washing powder can be caked by extreme humidity, either through the unaxial compression of a compact exposed to high relative humidity [4,5,6,7] or by investigating the strength of the surface crust formed [8,9].
This study compared and contrasted two recent additions to the range of powder testers, the Freeman FT4 and the Brookfield Powder Flow tester. The use of both of these devices has already been demonstrated in a variety of applications [8,9,10,11,12,13,14]. The three main areas of investigation that have used a Freeman FT4 tester are
  • the comparison between the dynamic flow and static flow of powders [10,14].
  • the caking of powders when the relative humidity is high or cycled [8,9].
  • how changes in a mixture formulation affect the flow properties of the resulting powder [9,11].
Leturia et al. [14] compared the FT4 results against the Hausner ratio, Jenike shear cell, and fluidization tests for metal oxides, carbon black, PVC, and some mixtures of these materials and found that reliable and quick results could be obtained. Powder crusting of polymers and food powders was also examined by Brockbank et al. [8], who made use of the blade to analyse the strength of a layer of caking caused by the uneven distribution of moisture in powder stored at high relative humidities; this study was then adapted for assessing the resistance of washing powder formulations to caking by varying the ration of sodium carbonate to sodium sulfate by Leaper et al. [9]. The flow properties of mixtures of mannitol and sodium carbonate were also examined using the FT4 by Leaper et al. [11], showing that the flow properties could be improved by adding sodium carbonate.
As a relatively new addition, the literature on the use of the Brookfirld PFT is confined to assessing reliability and repeatability, with Berry et al. [11] demonstrating performance in a round-robin test and Garg [12] investigating the properties of pharmaceutical materials. It has been used to independently verify other studies using small-scale tumbling motion [3].
Because these testers have already been shown to operate over different ranges of powder loading, the present study also examined how they can be combined to give a wider range of flow function. Using CRM limestone, they were also compared with the shear test data obtained by Akers [15] at Loughborough University. A comparison was also made with other common powders used in food and pharmaceuticals.

2. Basic Theory Based on Jenike Shear Cell Tests

If an unsupported plug of powder (Figure 1a) experiences a normal compressive force FN, at a certain value it will collapse along a shear plane and experience a shear force Sf, with the relationship being defined in Equation (1):
S f = μ ( F N + T a )
The relationship is influenced by the internal friction of the powder μ and the cohesive force Ta, which is maintained by interparticle forces; this would be zero in a free-flowing powder.
The yield loci of coulomb powders are shown in Figure 1b, with an increasingly cohesive powder having a larger intersect. Figure 2 shows how the yield locus can be obtained using a Jenike shear cell. For a consolidating force FN1, a yield locus can be constructed from the shear strength of a powder under a normal force up to a value of M. Two Mohr circles, one of which touches both the origin and the locus, and the other touching point M, can be used to define the forces F and G; these can be converted to loads σC and σ1, which are the unconfined yield stress (UYC) and major principal stress (MPS), respectively. The effective angle of internal friction ϕ can also be obtained, although the non-linear nature of a real yield locus modifies its definition compared to the coulomb powder. The UYC is an indication of a powder sample’s ability to support its own weight, and high values indicate cohesive behaviour.
Typically, this experiment is repeated with at least four values of FN1, and a plot of σC against σ1 for each condition will generate a flow function plot. When this is linearised, the gradient is known as the flow function coefficient, ffc. A steep gradient for this indicates cohesive behaviour, whereas free flowing materials will have a low value of ffc. An important issue is whether a fresh sample is used for each of these tests or the same sample is used, which is addressed by the Brookfield powder flow tester.

3. Methods and Materials

3.1. Freeman FT4 Powder Tester

The FT4 was developed by Freeman [10] to examine powder flow both quantitatively and comparatively, using a rotating blade combined with compression, aeration, a shear cell, or the blade alone. The blade facility alone examines the dynamic flow properties of the powder, which are relevant in applications such as tablet and filling machines.
The blade is also used to homogenise the bulk density of the test powder prior to testing; this aspect has been exploited to measure the strength of the caked crust that develops when the powder is exposed to the cycling of temperature and relative humidity [8,9].
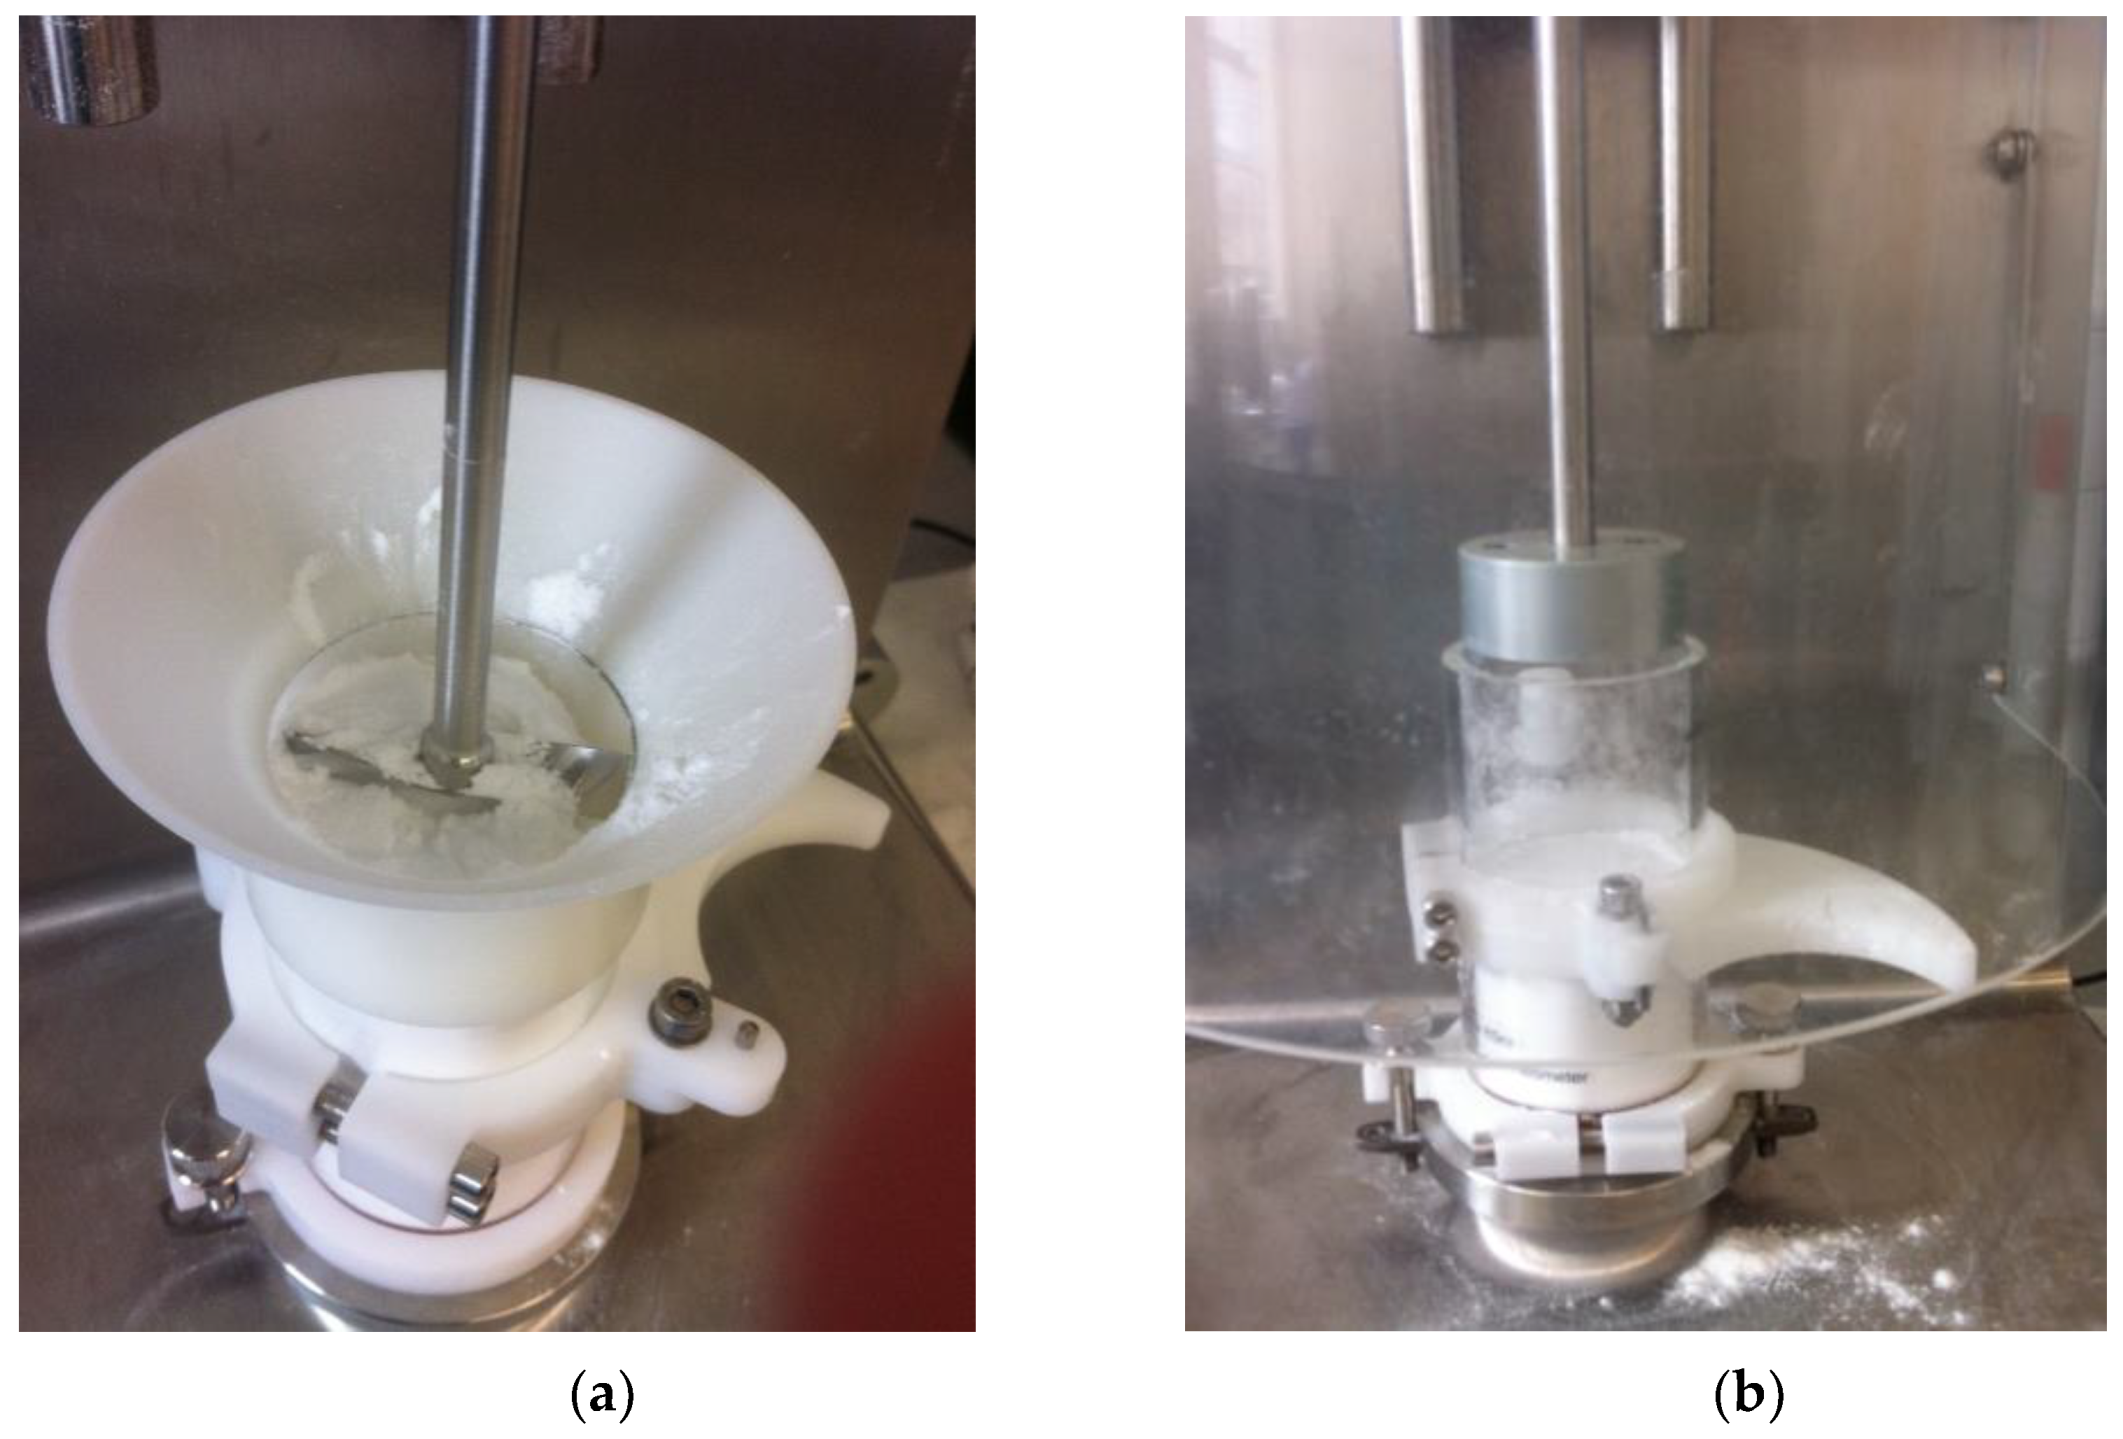
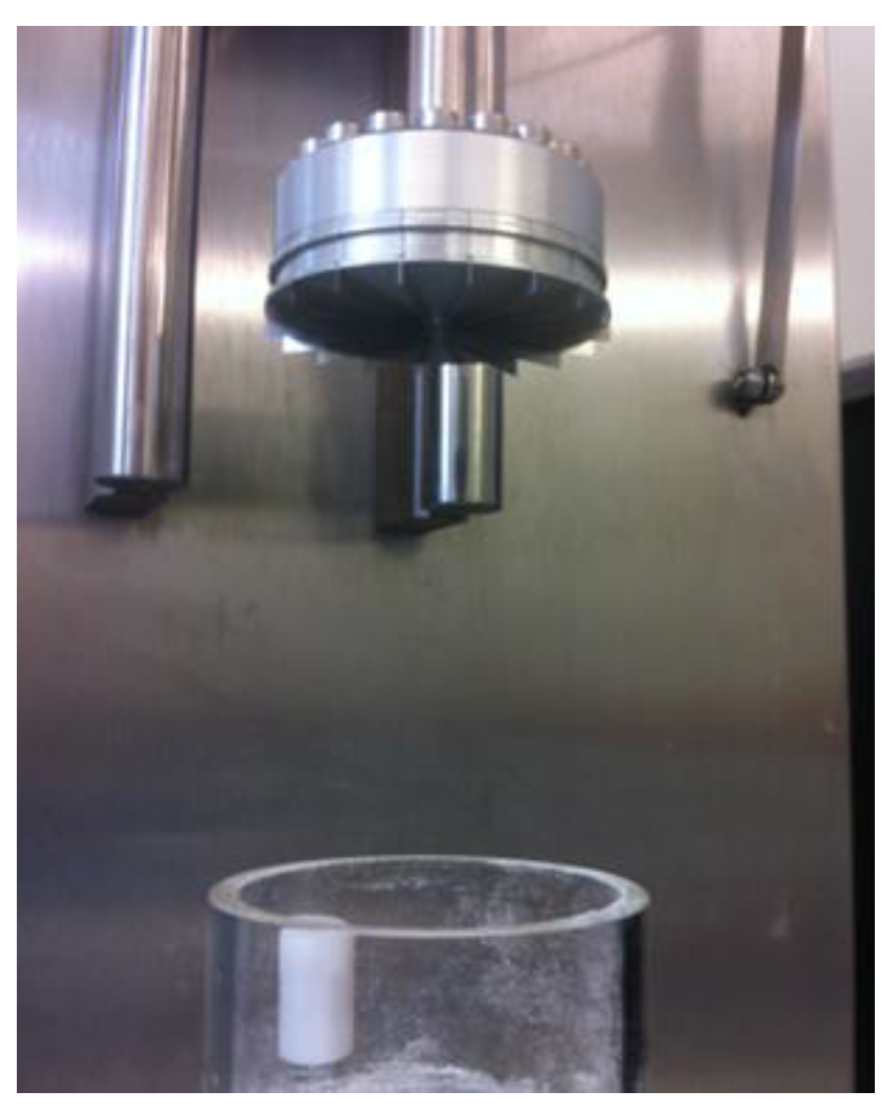
Each sample in the compaction test was first pre-conditioned with a single upwards and downwards cycle using the blade from the dynamic tester, as shown in Figure 3a and described in previous studies [9,10]; this ensured that the overall bulk density profile of the powder was as close to constant as possible. A vented piston was then used to compact the powder as shown in Figure 3b. The load was progressively increased in small increments up to compaction load, and the percentage change in powder volume was recorded at each new load. The diameter of the compacted system was 48 mm. This test was performed with initial compaction loads (I) of 3, 6, 9, and 15 kPa. The cell was then split, and the vented piston was replaced by the rotational shear cell shown in Figure 4; it works on the principle that the vaned section causes the top layer of pre-consolidated powder to shear, whilst the bottom layer remains stationary; this enables a Mohr circle to be obtained for the consolidating stress, providing values for the principle consolidating stress and unconfined yield stress. This measurement provides values of σ1, σC, ϕ, and Ta at each of the compaction values, allowing a flow function to be plotted manually or by further data processing.

3.2. Brookfield Powder Flow Tester

The Brookfield tester shown in Figure 5a,b focuses on a narrower range of tests–the shear cell and wall friction test–and is consequently cheaper. The design is a refined version of the rotating shear cell designed by Walker [12]; like the FT4, it can be operated with very little training, and is not operator dependent. This tester has been shown to be effective at low consolidation stresses and produces a flow function from one test, unlike the FT4, where the unconfined yield stress and major principal stress have to be obtained for each consolidating stress. The test method follows the procedure described in previous work [11,12] and provides a full flow function plot from a single sample with five data points. The standard volume trough measures the flow function at values below 3 kPa. Again, this measurement provides values of σ1, σC, ϕ, and Ta at each of the compaction values.

3.3. Test Materials

The test materials are shown in Table 1. Figure 6a–e show Scanning Electron Micrographs (SEM) of CRM limestone, calcium diphosphate, lactose, maltodextrin, and JRS Easytab, compared with a 50 μm scale to illustrate the differences in particle size and morphology. Figure 7 and b show the limestone and dicalcium phosphate, respectively, at a higher magnification compared with a 5 μm scale. These two figures show the challenges of measuring a representative particle size distribution, with irregular particle shapes and ordered mixing and agglomeration. Physical methods to obtain a particle size distribution such as sieving or dispersion with laser diffraction would separate agglomerates and change the powders to multi-modal systems that are not necessarily representative of the systems examined.
The SEM for maltodextrin and Easytab in Figure 6 are of particular interest with regards to compaction, as many of the particles are hollow and/or porous, suggesting the potential for breakage at high loads; these characteristic make them particularly suitable for tablet formation.

4. Results and Discussion

4.1. Measuring the Flow Function of CRM Limestone and Comparison with Akers

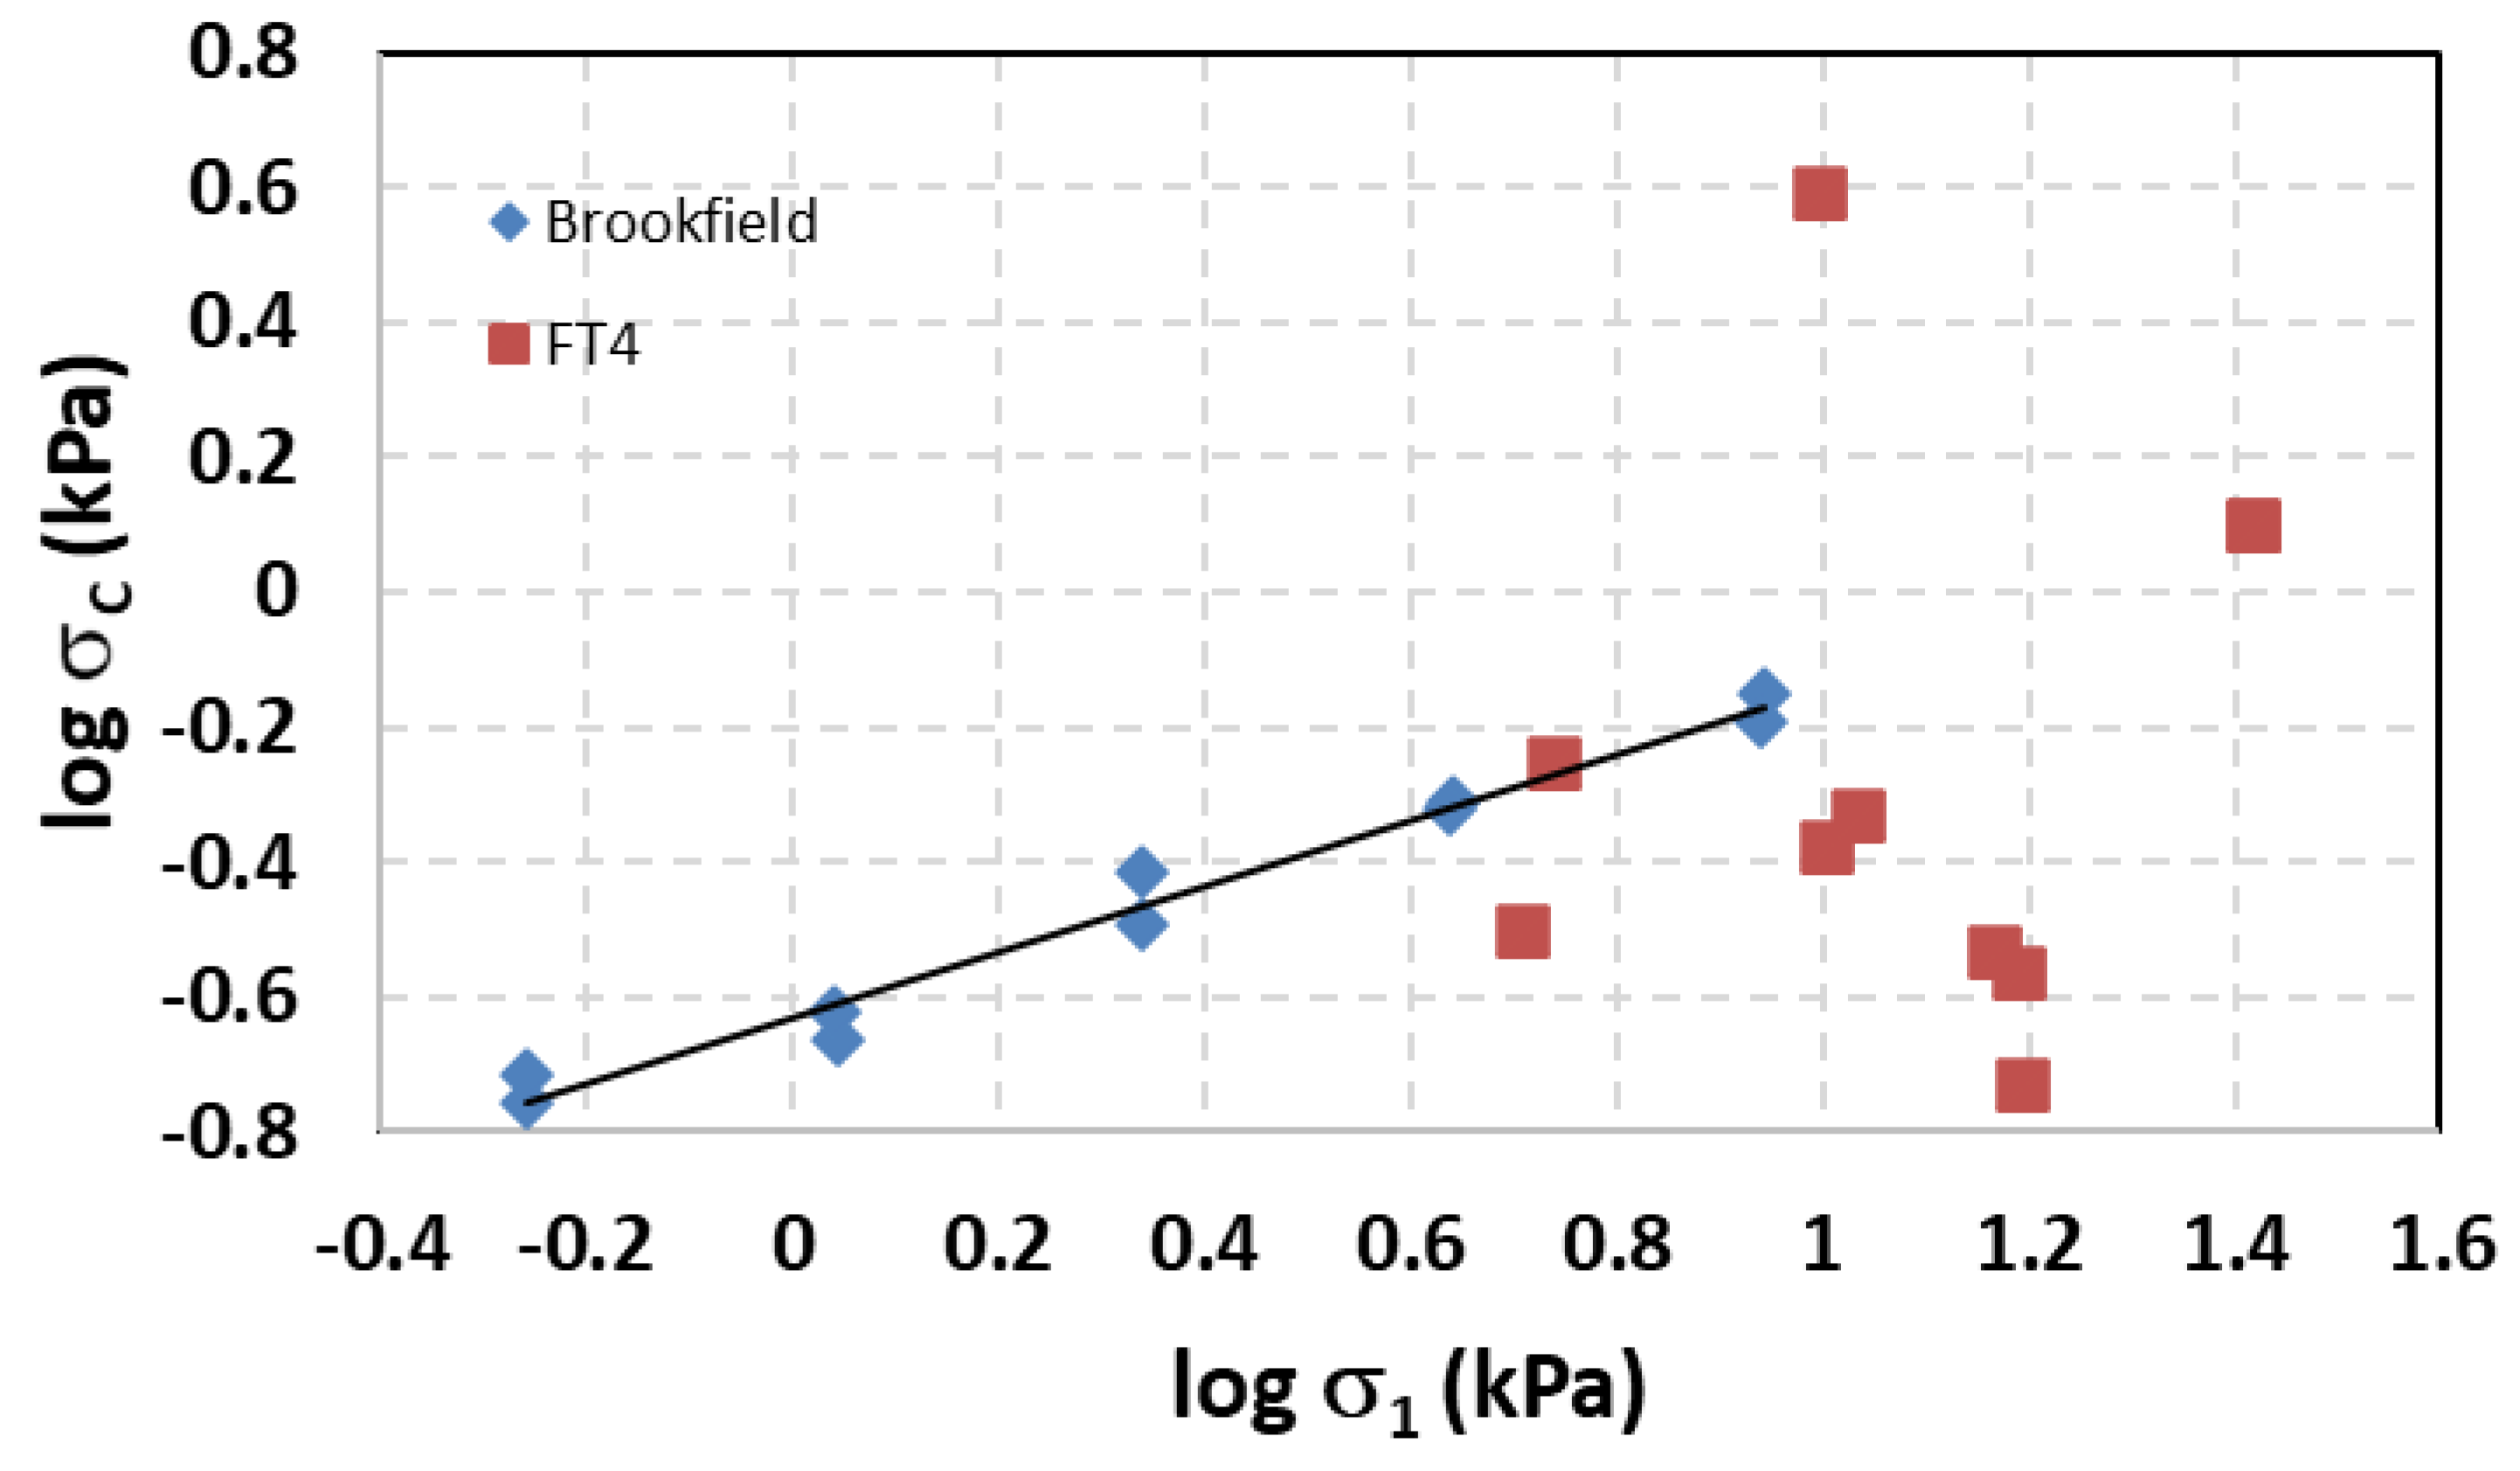
Figure 8 compares the flow functions of CRM limestone measured by the Brookfield Powder Flow Tester and Freeman FT4 with an additional set of data from Akers [15]; this is considered in the European standard for shear cell testing.
Figure 8 shows how the data from Brookfield PFT and Freeman FT4 combine to provide a broader test range, and how the Brookfield data extrapolates the flow function from the shear cell data into conditions where initial consolidating load is below 3 kPa. All data are presented as a logarithmic plot to identify load ranges where the failure mechanisms change and to ensure better data analysis. The plot shows that the effect of the test equipment on the compaction mechanism is not significant; the gradients of the logarithmic plots are all between 0.6 and 0.7.

4.2. Measuring the Flow Functions of Common Pharmaceutical Excipients

Having compared the testers using a reference powder, the Brookfield PFT and the Freeman FT4 were used to obtain the flow functions of calcium phosphate, lactose, maltodextrin, and Easytab with the data shown in Figure 9, Figure 10, Figure 11 and Figure 12 respectively. The ranges of initial compaction for the Brookfield PFT and Freeman FT4 are 0.3 to 5 kPa and 3 to 15 kPa, respectively.
Using the logarithmic plots of Figure 9, Figure 10, Figure 11 and Figure 12, the relationship between the unconfined yield stress, σC, and the major principal stress, σ1, is shown in Table 2, along with the regression coefficient.
As the two tests were done over different scales of compaction load, it is likely that there will be variation in the flow function, as the mechanisms by which the powders compact will change, which are as follows:
(i)
Particle re-arrangement, where gaps between particles are reduced, air leaves the structure, and particles orientate themselves to minimize voidage and maximise bulk density. This usually happens in the initial stages of compaction.
(ii)
Plastic deformation, where the energy of compression is dissipated by particle surfaces softening and deforming irreversibly at contact points. This may lead to bonds being formed.
(iii)
Particle breakage, where the energy of compression causes particles to break and reduce in bulk density as in (i). This is prevalent when particles are hollow.
It is rare that a single mechanism acts in isolation, and particle hardness, elasticity, and strength, influenced by temperature, relative humidity, and crystallinity, all contribute to the extent to which each mechanism is involved in the compression process. This can be complicated further if the powder is a mixture, which is the case with Easytab.
CRM limestone and lactose showed a similar flow function between the Brookfield PFT and Freeman FT4; this suggests that the mechanisms for compaction change little over the wide range of consolidating stress for these materials. It is likely that particle re-arrangement is a dominant mechanism, as the particle size is so small; these predictable characteristics have made this the material of choice for standardized tests. By contrast, maltodextrin, which is shown in Figure 6d to have particles with a wide range of shapes and internal structure, changed behaviour when subjected to larger compaction stress, with random particle breakage dominating over the ranges measured by the FT4. The SEM in Figure 6d also showed considerable agglomeration, which suggests that higher inter-particle forces are contributing to the higher gradient of the flow function plot.
Easytab showed free-flowing characteristics (indicated by the low gradient of the flow function equation), as well as compacting through particle breakage, making it challenging to analyse. This was particularly obvious at higher compaction loads, making the data scatter. It is likely that the smooth lower surface of the tester is allowing a “slip-stick” motion that could be reduced with a rougher surface.
Calcium phosphate showed a less pronounced change, with the relationship following a square root at higher loads, suggesting plastic deformation at contact points. This more predictable behaviour was also duplicated by lactose, also suggesting a single mechanism of compaction.

4.3. Normalisation of Data Using the Method of Wang et al.

Wang et al. [16] normalised a large data set of flow functions from a wide range of materials by plotting the flow function coefficient ffc against the dimensionless cohesion C*, which is the cohesion of the powder τ1 (expressed as a load) divided by the initial compaction, I:
C * = τ 1 I
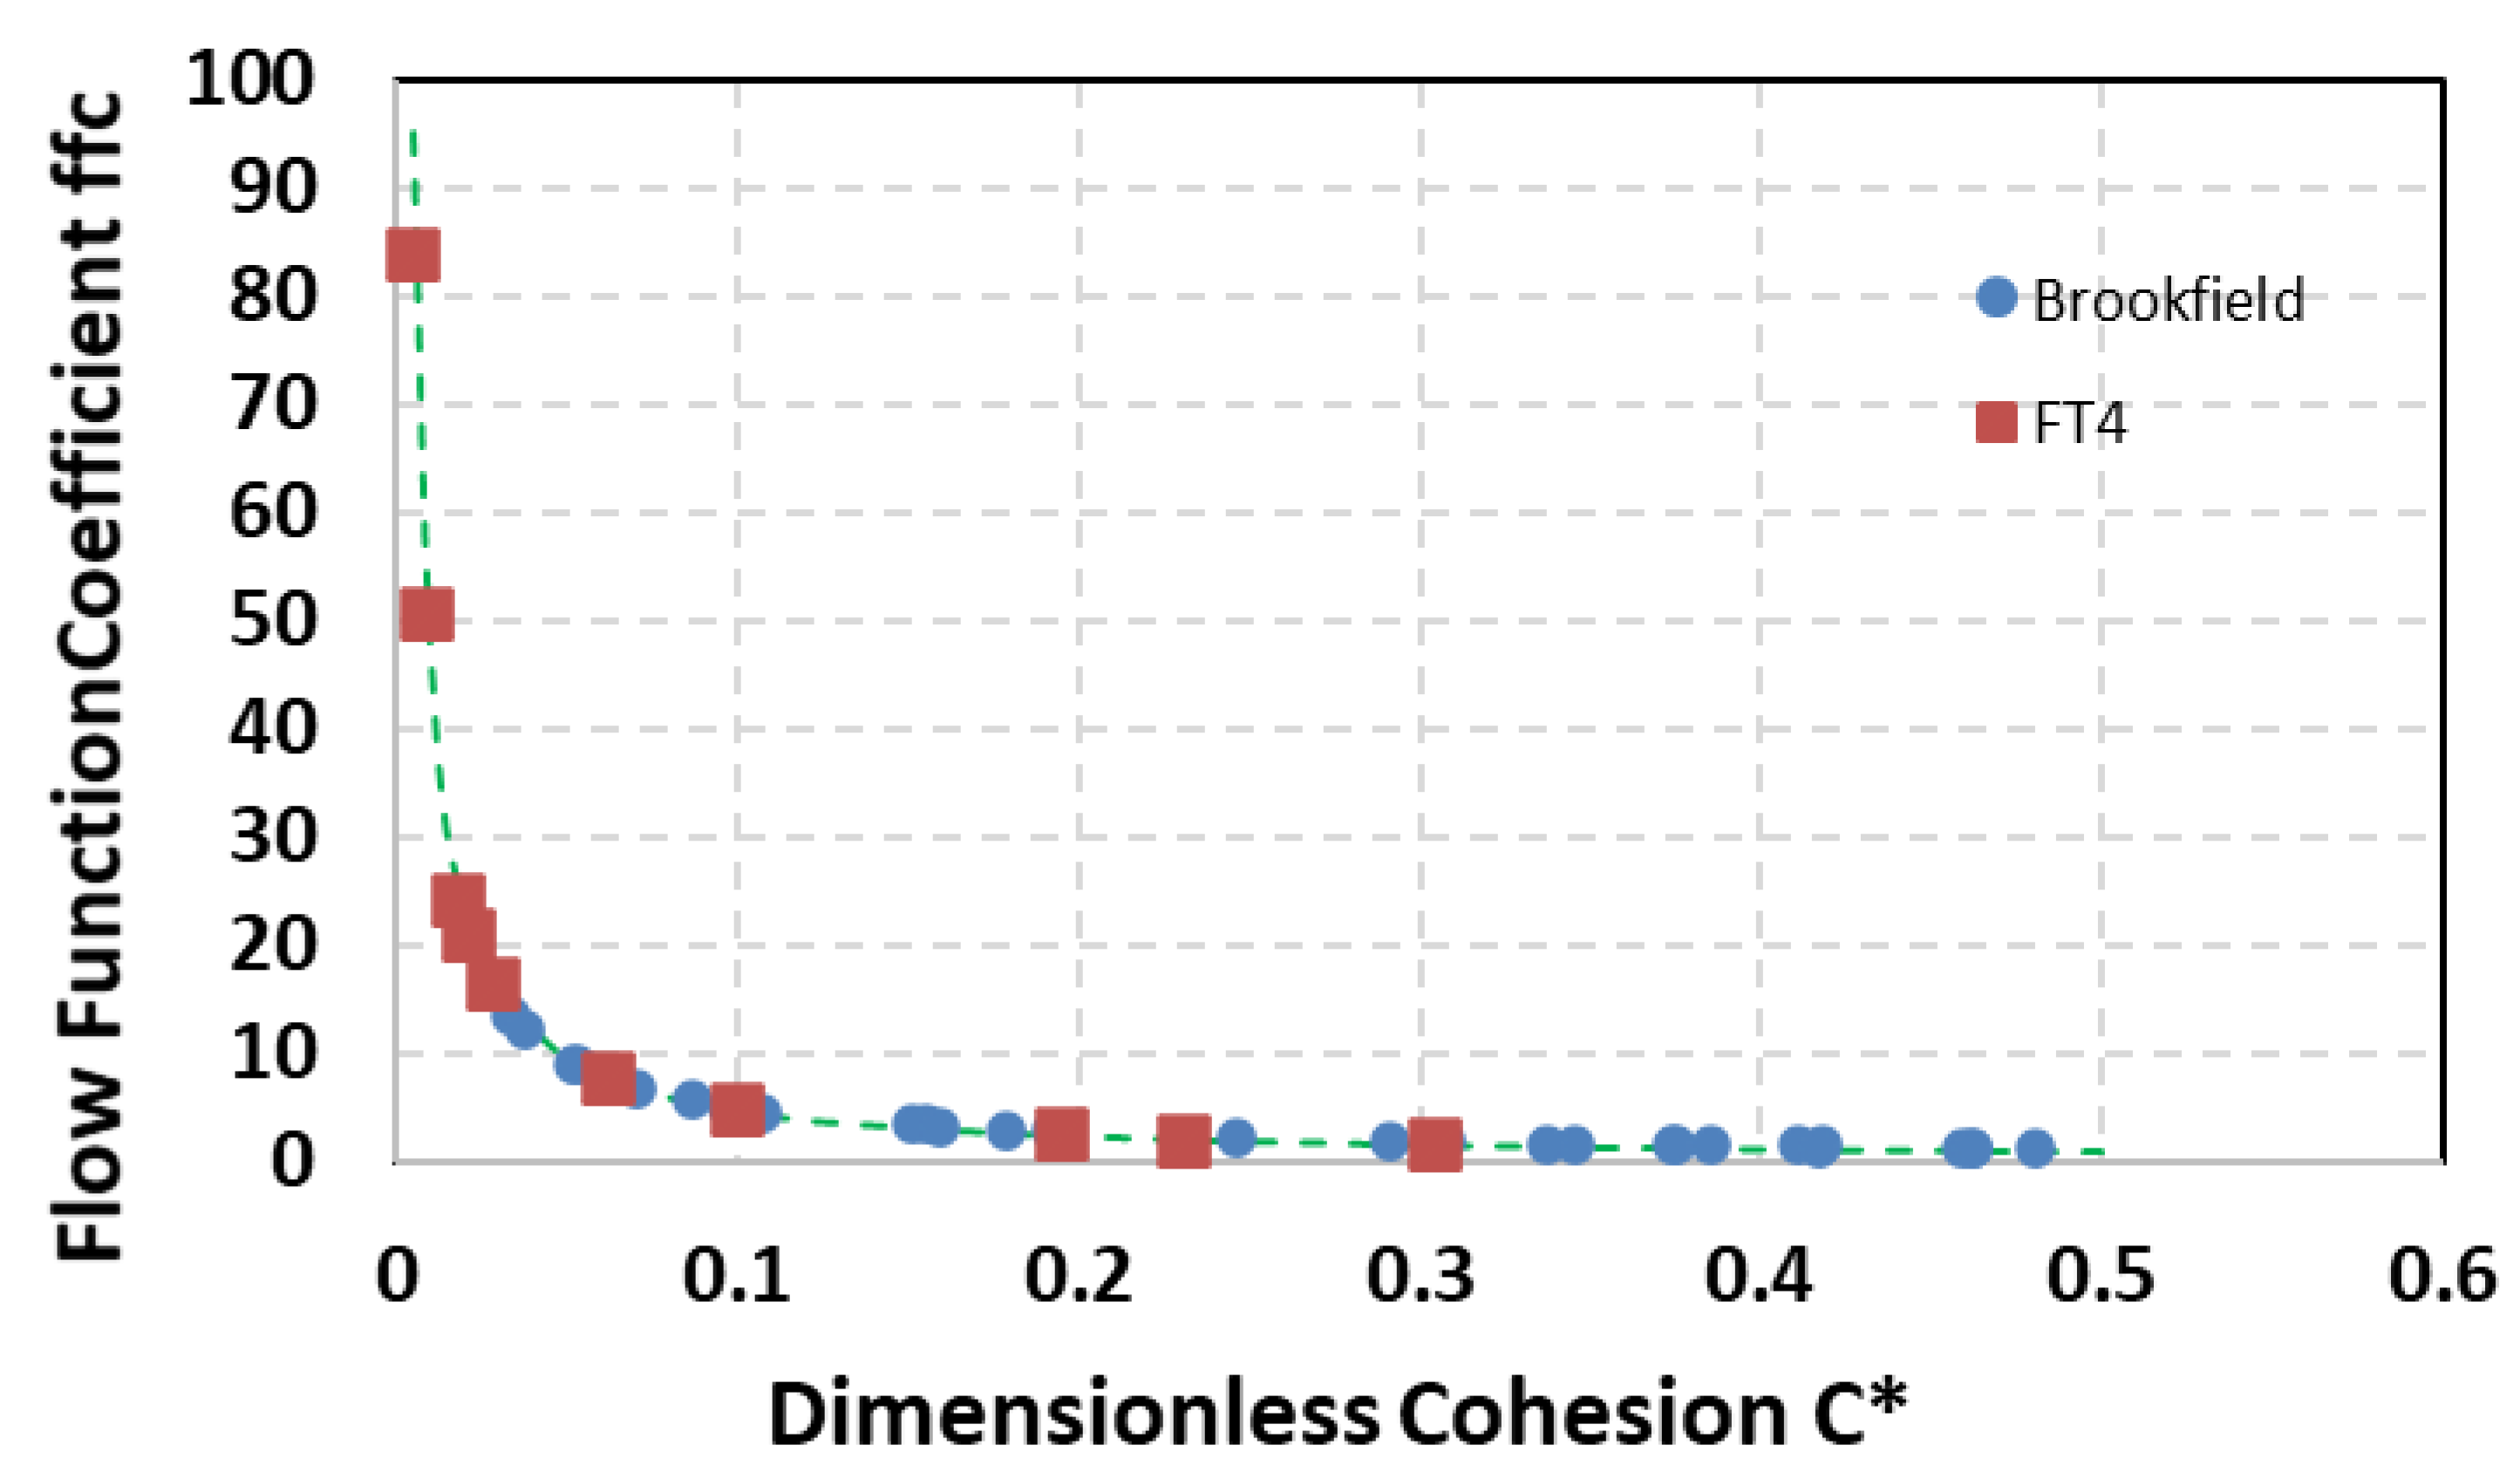
τ1 is measured by both testers and is used in the calculation. Data from a single tester using a variety of materials forms a single plot. It can also be used to compare the data from different testers. The data from the previous section was processed using this method to produce Figure 13:
Both the data from the Brookfield PFT and Freeman FT4 superimpose onto a single plot. Wang et al. [16] found that this plot could be represented by:
f f c = E C *
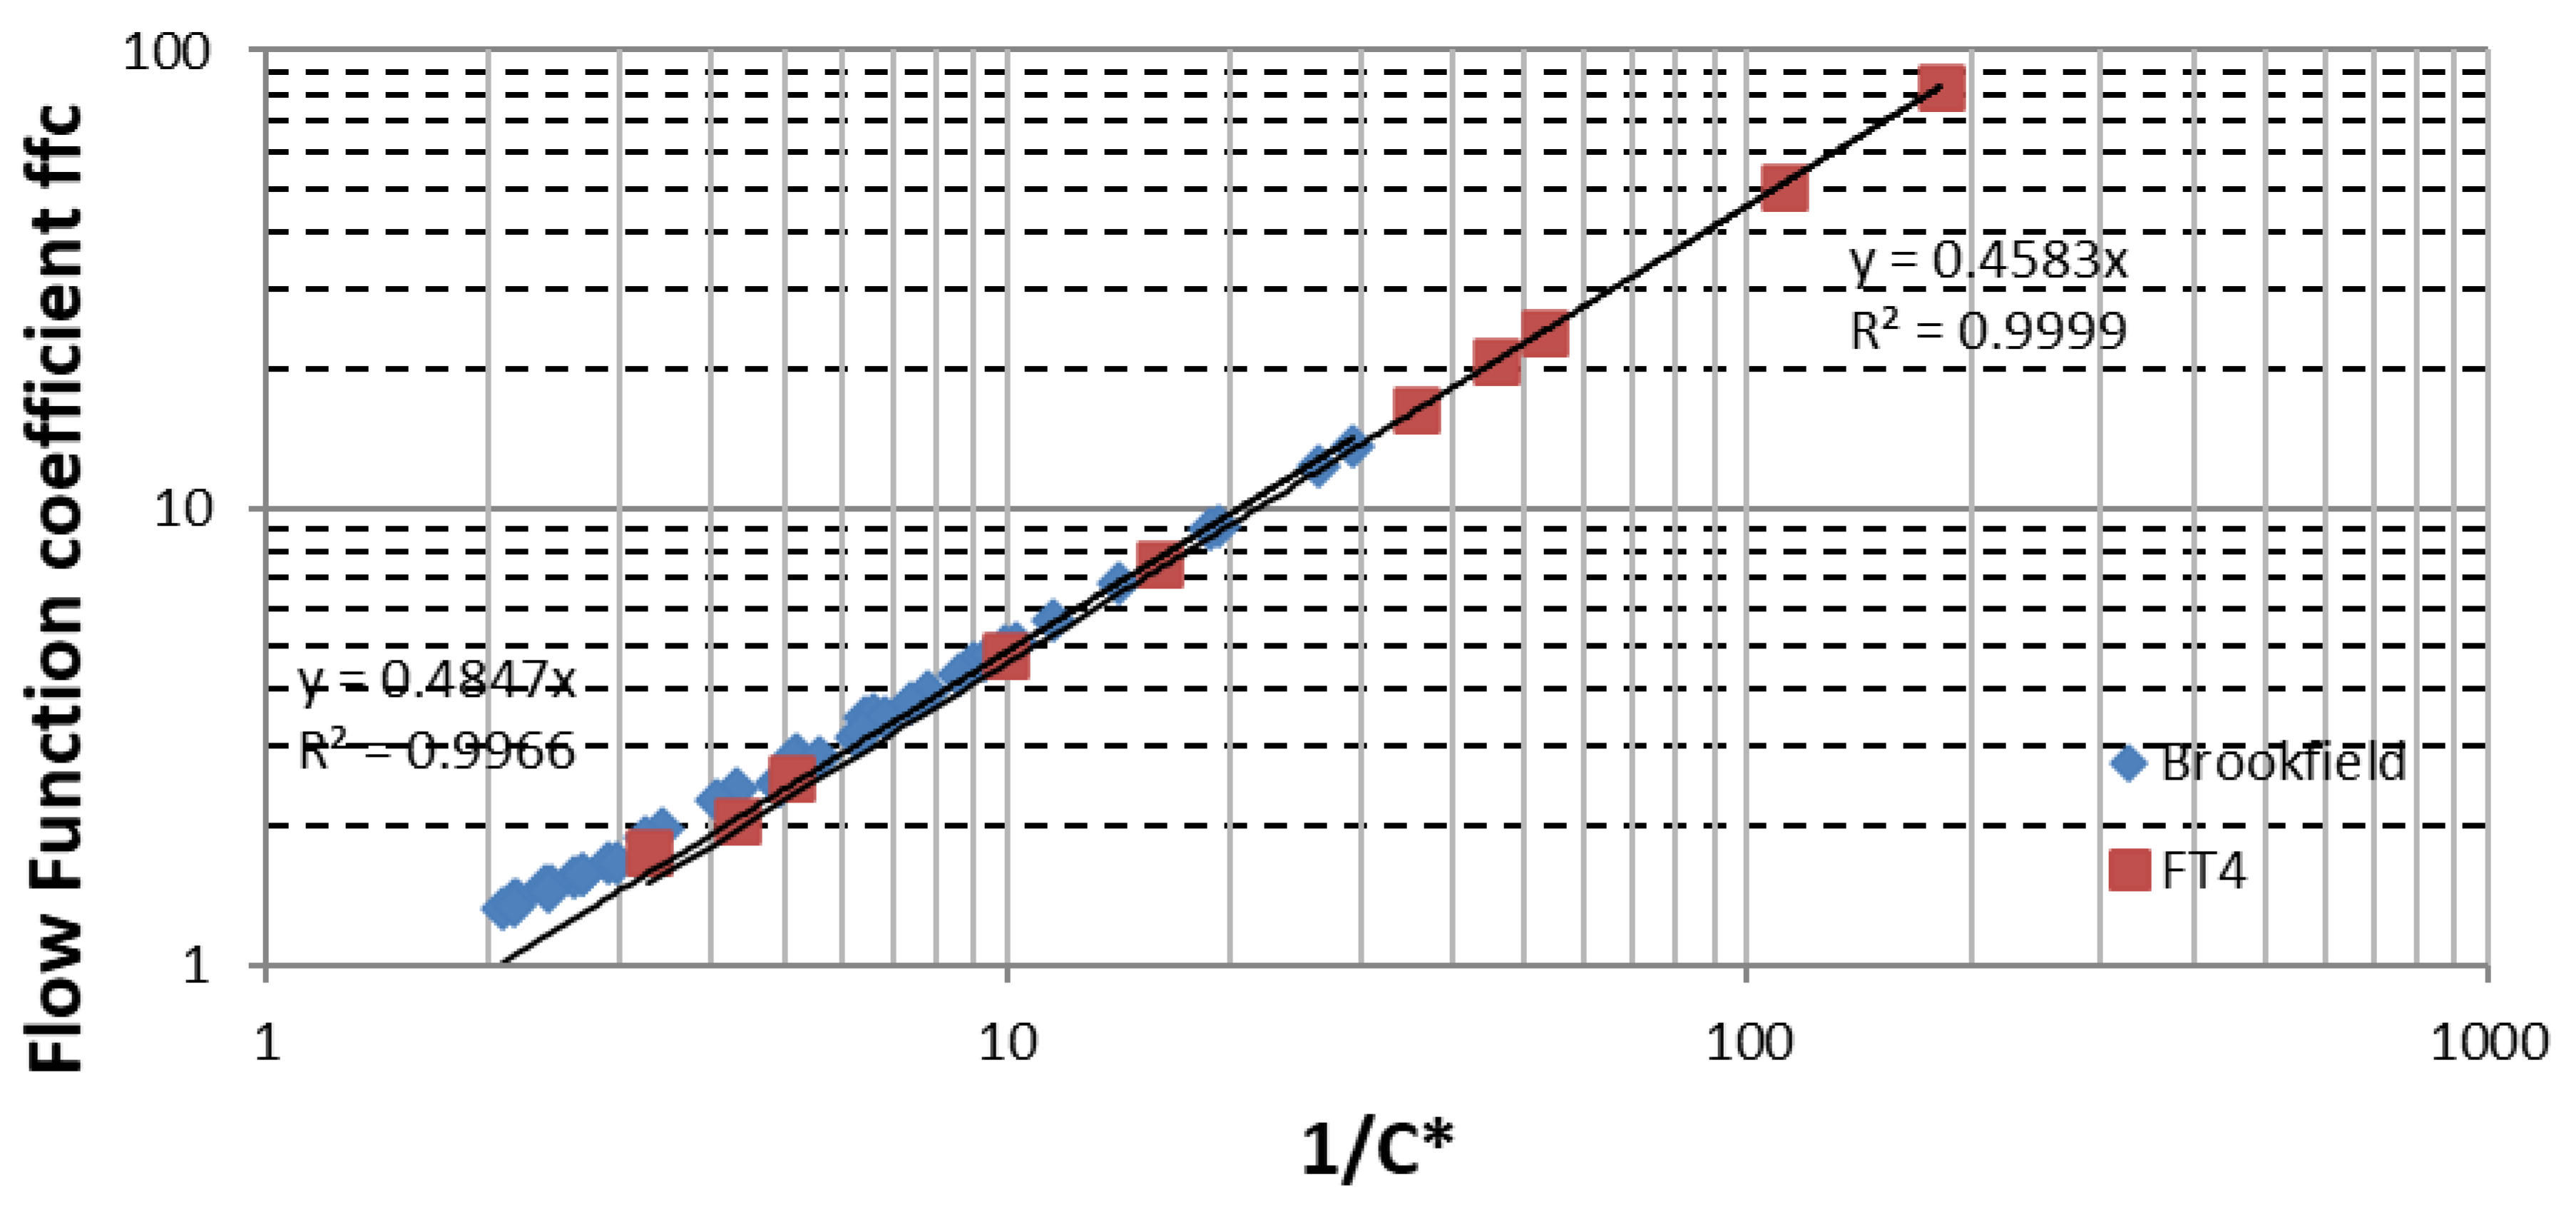
where E is a constant, which was found to be 0.447 for a Schulze shear cell and 0.485 for the FT4. E is independent of the initial consolidation stress. By plotting ffc against 1/C*, E was obtained for the two devices in this study, as shown in Figure 14:
Figure 14 shows that E is 0.485 for the Brookfield PFT and 0.458 for the FT4, showing that combining the data of these two devices is a viable approach. These values compare well to the values of E of 0.447 for a Schulze Cell and 0.485 for the FT4 obtained by Wang et al. [16].

5. Conclusions

The Brookfield and FT4 measured the flow function of powders over different compaction loads. Powders where the compaction mechanisms were unchanged over these ranges could be analysed using both machines, which included lactose and CRM limestone, which also compared well with previous work using a shear cell [15]. Lower loads were required for friable particles that are hollow, porous, and acicular, making the Brookfield PFT more suitable for these. This study clearly shows the importance of imaging the particles prior to testing to explain any deviations in repeatability. Where cohesion can be quantified, using the method of Wang et al. [16] can make a more efficient use of the data and predict systems not measured. This would be important where rapid predictions of particle behaviour are required.

Funding

The research received no external funding.

Institutional Review Board Statement

Not applicable.

Informed Consent Statement

Not applicable.

Data Availability Statement

Not applicable.

Conflicts of Interest

The author declares no conflict of interest.

References

  1. Jenike, A.W. Gravity Flow of Bulk Solids; Utah University Engineering Experiment Station 123; University of Utah: Salt Lake City, UT, USA, 1962. [Google Scholar]
  2. Schwedes, J. Review on testers for measuring flow properties of bulk solids. Granul. Matter 2003, 5, 1–43. [Google Scholar] [CrossRef]
  3. Jaggi, V.; Leaper, M.C.; Ingham, A.J. Measuring the flow properties of small powder samples using an avalanche tester. Dry. Technol. 2016, 34, 723–728. [Google Scholar] [CrossRef] [Green Version]
  4. Calvert, G.; Curcic, N.; Redhead, C.; Ahmadian, H.; Owen, C.; Beckett, D.; Ghadiri, M. A new environmental bulk powder caking tester. Powder Technol. 2013, 249, 323–329. [Google Scholar] [CrossRef]
  5. Röck, M.; Ostendorf, M.; Schwedes, J. Development of a uniaxial caking tester. Chem. Eng. Technol. 2006, 29, 679–685. [Google Scholar] [CrossRef]
  6. Thakur, S.C.; Ahmadian, H.; Sun, J.; Ooi, J.Y. An experimental and numerical study of packing, compression and caking behaviour of detergent powders. Particuology 2014, 12, 2–12. [Google Scholar] [CrossRef]
  7. Leaper, M.C.; Leach, V.; Taylor, P.M.; Prime, D.C. A comparison of compacting and caking behaviour of carbonate-based washing powders. Dry. Technol. 2013, 31, 769–774. [Google Scholar] [CrossRef]
  8. Brockbank, K.; Armstrong, B.; Chandorkar, Y.; Freeman, T. Understanding powder caking as a consequence of a range of mechanisms by means of powder rheometry. Part. Sci. Technol. 2015, 33, 102–108. [Google Scholar] [CrossRef]
  9. Leaper, M.C.; Fisk, E.; Browne, R. Feasibility study to investigate caking in washing powder formulations using a Freeman FT4 powder rheometer. Part. Sci. Technol. 2018, 37, 1009–1014. [Google Scholar] [CrossRef] [Green Version]
  10. Freeman, R. Measuring the flow properties of consolidated, conditioned and aerated powders—A comparative study using a powder rheometer and a rotational shear cell. Powder Technol. 2007, 174, 25–33. [Google Scholar] [CrossRef]
  11. Leaper, M.C.; Ali, K.; Ingham, A.J. Comparing the dynamic flow properties and compaction properties of pharmaceutical powder mixtures. Chem. Eng. Technol. 2018, 41, 102–107. [Google Scholar] [CrossRef] [Green Version]
  12. Berry, R.J.; Bradley, M.S.A.; MacGregor, R.G. Brookfield powder flow tester—Results of round robin tests with CRM-116 limestone powder. Proc. IMechE Part E J. Process Mech. Eng. 2015, 229, 215–230. [Google Scholar] [CrossRef] [Green Version]
  13. Garg, V.; Mallick, S.S.; Garcia-Trinanes, P.; Berry, R.J. An investigation into the flowability of fine powders used in pharmaceutical industries. Powder Technol. 2018, 336, 375–382. [Google Scholar] [CrossRef]
  14. Leturia, M.; Benali, M.; Lagarde, S.; Ronga, I.; Saleh, K. Characterization of flow properties of cohesive powders: A comparative study of traditional and new testing methods. Powder Technol. 2014, 253, 406–423. [Google Scholar] [CrossRef]
  15. Akers, R.J. The Certification of a Limestone Powder for Jenike Shear Cell Testing (CRM116); Commission of the European Communities: Luxembourg, 1992; ISBN 92-826-3498-1. [Google Scholar]
  16. Wang, Y.; Koynov, S.; Glasser, B.J.; Muzzio, F.J. A method to analyze shear cell data of powders measured under different initial consolidation stresses. Powder Technol. 2016, 294, 105–112. [Google Scholar] [CrossRef] [Green Version]
Figure 1. (a) Failure of a coulomb powder. (b) Yield loci of coulomb powders.
Processes 09 02032 g001
Figure 2. A typical yield locus obtained using a Jenike shear cell.
Processes 09 02032 g002
Figure 3. Experimental configurations for (a) preconditioning a powder and (b) compaction using the FT4 [9,10].
Processes 09 02032 g003
Figure 4. FT4 shear cell.
Processes 09 02032 g004
Figure 5. Brookfield PFT. (a) Instrument and (b) standard volume shear cell troughs, lid, and filling accessories (Berry et al., 2014).
Processes 09 02032 g005
Figure 6. Scanning electron micrographs (SEM) of (a) CRM limestone, (b) calcium phosphate, (c) lactose, (d) maltodextrin, and (e) JRS Easytab, compared with a 50 μm scale.
Processes 09 02032 g006
Figure 7. (a) CRM limestone and (b) calcium phosphate at higher magnification compared with a 5 μm scale.
Processes 09 02032 g007
Figure 8. Comparing the flow functions of CRM limestone measured using the Brookfield PFT and Freeman FT4 with data from Akers [15].
Processes 09 02032 g008
Figure 9. Flow function of calcium phosphate.
Processes 09 02032 g009
Figure 10. Flow function of lactose.
Processes 09 02032 g010
Figure 11. Flow function of maltodextrin.
Processes 09 02032 g011
Figure 12. Flow function of Easytab.
Processes 09 02032 g012
Figure 13. Normalising all flow function data using the method of Wang et al. [16].
Processes 09 02032 g013
Figure 14. Plot of ffc vs. 1/C* to find the equipment constant E for the Brookfield PFT and Freeman FT4.
Processes 09 02032 g014
Table 1. Summary of the test materials used in this study.
PowderSource
CRM limestoneBCR-116, Sigma-Aldrich, Buchs, Switzerland
Calcium diphosphateAcros, Geel, Belgium
LactoseAdams Food Ingredients, Leek, UK
MaltodextrinParoxite Ltd., Macclesfield, UK. Maltrin M100
EasytabJRS Pharma, Rosenburg, Germany.
Table 2. Comparison of the flow functions obtained by the PFT and FT4 for the test materials.
Brookfield PFTFreeman FT4
CRM limestone σ C = 1.28 σ 1 0.69 R2 = 0.9992 σ C = 0.75 σ 1 0.62 R2 = 0.9762
Calcium phosphate σ C = 0.72 σ 1 0.92 R2 = 0.9996 σ C = 1.63 σ 1 0.52 R2 = 0.9253
Lactose σ C = 0.56 σ 1 0.7 R2 = 0.9983 σ c = 0.73 σ 1 0.64 R2 = 0.9842
Maltodextrin σ C = 4.73 σ 1 1.24 R2 = 0.9630 σ C = 7.49 σ 1 0.75 R2 = 0.7046
Easytab σ C = 0.23 σ 1 0.49 R2 = 0.9790 σ C = 0.26 σ 1 0.3 R2 = 0.0341
Publisher’s Note: MDPI stays neutral with regard to jurisdictional claims in published maps and institutional affiliations.