Article

Predictive Analysis of Municipal Solid Waste Generation Using an Optimized Neural Network Model

by
Nehal Elshaboury
1,
Eslam Mohammed Abdelkader
2,
Abobakr Al-Sakkaf
3,4,* and
Ghasan Alfalah
5
1
Construction and Project Management Research Institute, Housing and Building National Research Centre, Giza 12311, Egypt
2
Structural Engineering Department, Faculty of Engineering, Cairo University, Giza 12613, Egypt
3
Department of Buildings, Civil and Environmental Engineering, Concordia University, Montreal, QC H3G 1M8, Canada
4
Department of Architecture & Environmental Planning, College of Engineering & Petroleum, Hadhramout University, Mukalla 50512, Yemen
5
Department of Architecture and Building Science, College of Architecture and Planning, King Saud University, Riyadh 11421, Saudi Arabia
*
Author to whom correspondence should be addressed.
Processes 2021, 9(11), 2045; https://doi.org/10.3390/pr9112045
Submission received: 25 September 2021 / Revised: 23 October 2021 / Accepted: 12 November 2021 / Published: 15 November 2021

Abstract

:
Developing successful municipal waste management planning strategies is crucial for implementing sustainable development. The research proposed the application of an optimized artificial neural network (ANN) to forecast quantities of waste in Poland. The neural network coupled with particle swarm optimization (PSO) algorithm is compared to the conventional neural network using five assessment metrics. The metrics are coefficient of efficiency (CE), Pearson correlation coefficient (R), Willmott’s index of agreement (WI), root mean squared error (RMSE), and mean bias error (MBE). Selected explanatory factors are incorporated in the developed models to reflect the influence of economic, demographic, and social aspects on the rate of waste generation. These factors are population, employment to population ratio, revenue per capita, number of entities by type of business activity, and number of entities enlisted in REGON per 10,000 population. According to the findings, the ANN–PSO model (CE = 0.92, R = 0.96, WI = 0.98, RMSE = 11,342.74, and MBE = 6548.55) significantly outperforms the traditional ANN model (CE = 0.11, R = 0.68, WI = 0.78, RMSE = 38,571.68, and MBE = 30,652.04). The significant level of the reported outputs is evaluated using the Wilcoxon–Mann–Whitney U-test, with a significance level of 0.05. The p-values of the pairings (ANN, observed) and (ANN, ANN–PSO) are all less than 0.05, suggesting that the models are statistically different. On the other hand, the P-value of (ANN–PSO, observed) is more than 0.05, suggesting that the difference between the models is statistically insignificant. Therefore, the proposed ANN–PSO model proves its efficiency at estimating municipal solid waste quantities and may be regarded as a cost-efficient method of developing integrated waste management systems.

1. Introduction

Municipal solid waste (MSW) has emerged as a new challenge to the United Nations’ global sustainability strategy [1,2,3]. MSW is defined as garbage generated in houses or other sources that contains no hazardous chemicals [4]. The MSW accumulation problem has been worrying both local and international policymakers and stakeholders, posing serious health and environmental problems [5]. Nearly 2.01 billion tonnes of MSW are generated annually all over the world, with a projected increase of 3.40 billion tonnes by 2050 [6]. Most of the countries in the Middle East/North Africa (MENA) region are known for high MSW generation, with waste output exceeding 2 kg per capita per day on average [7]. In 2019, the European Union (EU) generated a total of 502 kg of MSW per capita. Concerning the per capita MSW generation, Denmark and Luxembourg produced the highest rates of 844 and 791 kg per inhabitant, whilst Romania produced the lowest rate of 280 kg per inhabitant in the EU [8]. The annual household waste output in Polish cities is reported to range between 238 and 315 kg per inhabitant [9]. According to the Central Statistical Office, the amount of waste increased from 10,040,108 Mg/year to 12,752,778.17 Mg/year between 2010 and 2019 [10]. This implies that the amount of waste produced in Poland is steadily increasing. The volumes of wastes are predicted to continue to rise owing to expanding urbanization, rising standard of living, and changing social behavior and habits. This issue is becoming of great importance in Poland, not only because of the growing amount but also because of the lack of an effective waste management system and the associated negative environmental impact of wastes [11].
An accurate prediction of the MSW generation rate is critical for sustainable and efficient MSW management [1,12,13,14]. Forecasting is a decision-making method that captures the trend of historical and current information to be used for future projections [15,16]. It has been used by many stakeholders such as academics, policymakers, government organizations, and municipalities to develop sustainable and effective MSW management [17,18,19]. Geographic location, seasonal fluctuations, increased industrialization and urbanization, economic conditions, existing regulations, recovery and reuse restrictions, waste management infrastructure (collection, recycling facilities, incinerators, or landfill), site procedures, growing population, people habits, and lifestyle are all variables that influence the quantity of generated wastes [20,21,22]. The availability of solid historical data will aid in anticipating the generated quantity of MSW in the future and implementing the circular economy to reuse waste materials [23,24,25]. This will aid in avoiding the exploitation of limited natural resources, creating more jobs, enhancing the national economy, and minimizing negative environmental repercussions [2].
As a result, building a reliable MSW forecasting model is crucial to anticipate the generated quantity of MSW, which can be used for developing waste management infrastructures and optimizing waste management frameworks [26,27]. Examples of the forecasting techniques are artificial intelligence methods, time series analysis, material flow analysis, and statistical analysis [26,28]. Artificial intelligent techniques have been popular in implementing waste management models. Meza et al. [29] examined three artificial intelligence-based models for forecasting the generation rate of urban solid waste in the city of Bogota, Colombia. A viable decision-making approach was investigated in this study to plan and develop technologies for waste collection, transportation, and final disposal in cities. The decision tree was the first applied machine learning algorithm to model data separation constraints based on learning decision rules on the input features. The second approach used was a support vector machine (SVM) that could deal with highly variable data and a limited amount of training data. Finally, a recurrent neural network model was used whose architectural design made it possible to investigate temporal connections among the same. This research took into account the population, socioeconomic stratification, quantity of solid waste generated during a set period of time, and distribution of solid waste generated per zone in the city. According to the findings, SVM was the best forecasting model with the best local trend of the points and reliability in the recorded values.
Soni et al. [28] compared different artificial intelligence models, such as the adaptive neuro-fuzzy inference system (ANFIS), artificial neural network (ANN) as well as the ANFIS and ANN coupled with discrete wavelet theory (DWT) and genetic algorithm (GA) to assess their capacity to estimate the amount of generated waste in the city of New Delhi, India. For each model, the root mean square error (RMSE), coefficient of determination (R2), and index of agreement (WI) values were computed to compare the models. The hybrid ANN–GA model was proved to be the most accurate among the six models because it yielded the lowest RMSE (95.7) and the highest R2 (0.87) and WI (0.864) values. Dissanayaka and Vasanthapriyan [30] developed a prediction model for forecasting future MSW generation in Sri Lanka using nonlinear, linear, and machine learning approaches. The correlation among the relevant factors was evaluated using principal component analysis and Pearson correlation. The employed machine learning models included ANN, random forest, and regression analysis. The correlation coefficients of R2 = 0.6973, R2 = 0.9608, and R2 = 0.9923 were reported for linear regression, random forest, and ANN, respectively. Therefore, ANN outperformed linear regression and random forest models in terms of accuracy.
Kulisz and Kujawska [9] applied neural network modeling to forecast MSW in Poland. The MSW was divided into five categories: glass, biodegradable, paper and cardboard, plastics and metals, and miscellaneous waste. Selected explanatory factors were incorporated in the suggested models to reflect the influence of economic, demographic, and social aspects on the quantity of generated wastes. Different neural network models were applied by changing the number of hidden neurons from 2 to 10. The prediction accuracy of the developed models was measured using the Pearson correlation coefficient (R) and mean squared error (MSE). The ANN model with six hidden neurons showed good prediction accuracy by yielding a high R-value (i.e., 0.914) for categorized wastes. Using the statistical data from 2013 to 2019, the model projected a 2% rise in future waste output in 2024. The findings affirmed the suitability of the ANN model as a cost-efficient method for developing integrated waste management systems. Oguz-Ekim [31] modeled the MSW generation rate in Turkey using support vector regression (SVR), backpropagation neural network (BPNN), and general regression neural network. It can be concluded that SVR and BPNN techniques can be used to predict MSW generation, with BPNN marginally outperforming SVR. The developed models could be generalized in other countries across the world.
Daoud et al. [32] studied the rising problem of solid waste in the MENA area, with an emphasis on construction and demolition waste in Egypt. The study analyzed the most recent official reports, technical studies, and research papers on the subject. The key barriers to effective and efficient solid waste management systems, as well as recommendations for improvement, were compiled in this study. Policymakers, local and national governments, construction industry practitioners, and academics dealing with the challenges of solid wastes in the MENA area were likely to benefit from the findings of this study. ElSaid and Aghezzaf [33] performed a system analysis of MSW management in Cairo, Egypt. To describe an underlying model of the MSW management system, a restricted non-linear mathematical model was developed for six waste material flows (glass, cardboard and paper, metals, plastics, organic material, and others). Combinations of five treatment options were incorporated in the developed model, which included landfilling, incineration, anaerobic digestion, composting, and mechanical biological treatment. The model determined the capability of treatment techniques, as well as feasible best design solutions and recommendations. The environmental and economic effects of alternative scenarios were studied and analyzed. The gap between the current status quo and the proposed improved methods for diverting waste from landfills and reducing carbon dioxide emissions was elaborated in this study.
Ayeleru et al. [34] used ANN and SVM techniques to estimate MSW generated in the City of Johannesburg, South Africa. Furthermore, a projection was developed up to 2050 based on the gathered historical data. The research findings confirmed the effectiveness of machine learning approaches for MSW forecasting. The ANN model with 10 neurons outperformed other models, yielding an R2 value of 0.999, whereas the linear model performed best in the SVM models, with an R2 value of 0.986. Based on the ANN10 model, the total quantity of MSW in the City of Johannesburg was expected to reach 1.95 × 10⁶ tonnes in 2050, with an average yearly waste of 1.78 × 10⁶ tonnes. Coskuner et al. [35] used a multi-layer perceptron ANN to forecast the yearly generated rates of commercial, household, and construction and demolition wastes in Bahrain. The prediction models incorporated several explanatory variables to account for the impact of economic, social, geographic, demographical, and touristic aspects on waste generation rates. To assess the efficacy of the generated models, the MSE and R2 performance metrics were employed. According to the findings, the ANN model was associated with high R2 and low MSE values, indicating good prediction accuracy. This demonstrated the capability of the proposed ANN model at predicting waste generation rates from a variety of sources and that it could be used to construct integrated MSW management systems.
In summary, the ANN models could be applied for modeling MSW quantities given limited data. The flexibility of neural network tools is a feature that allows for the consideration of a variety of additional factors, including economic, demographic, geographic, social, technological, legislative, and administrative, all of which may play a role in determining the final quantity of municipal wastes. Despite the excellent ability of standalone ANN models, their training algorithms may trap in local optimums or may be slow to convergence. Optimization algorithms are regarded as viable alternatives to standard training algorithms because they avoid trapping in local optimums [36,37]. However, limited research was undertaken to examine the performance of hybrid ANN models to forecast MSW generation quantities. Furthermore, it is necessary to assess the performances of pure and hybrid ANN models using numerous evaluation indices. In this regard, this research involves training and evaluating the performance of conventional and hybrid ANN models in predicting MSW quantities. Because of its high prediction accuracy and consistency over time, the ANN is coupled with the particle swarm optimization (PSO) algorithm in this research study. The capacity to estimate MSW at a city level allows local waste management organizations and government agencies to develop robust waste management strategies. In addition, the developed prediction model may be incorporated into legal laws and systems to reduce municipal waste generation rates, improve the efficiency of waste energy recovery, and improve adherence to sustainable development principles.
The major contributions of this research could be summarized as follows:
  • Incorporating the influence of economic, demographic, and social aspects on the quantity of generated wastes.
  • Estimating the waste quantities using traditional and hybrid neural network models and comparing their performances using several evaluation metrics.
  • Enhancing the performance metrics of the developed prediction models in the literature.

2. Materials and Methods

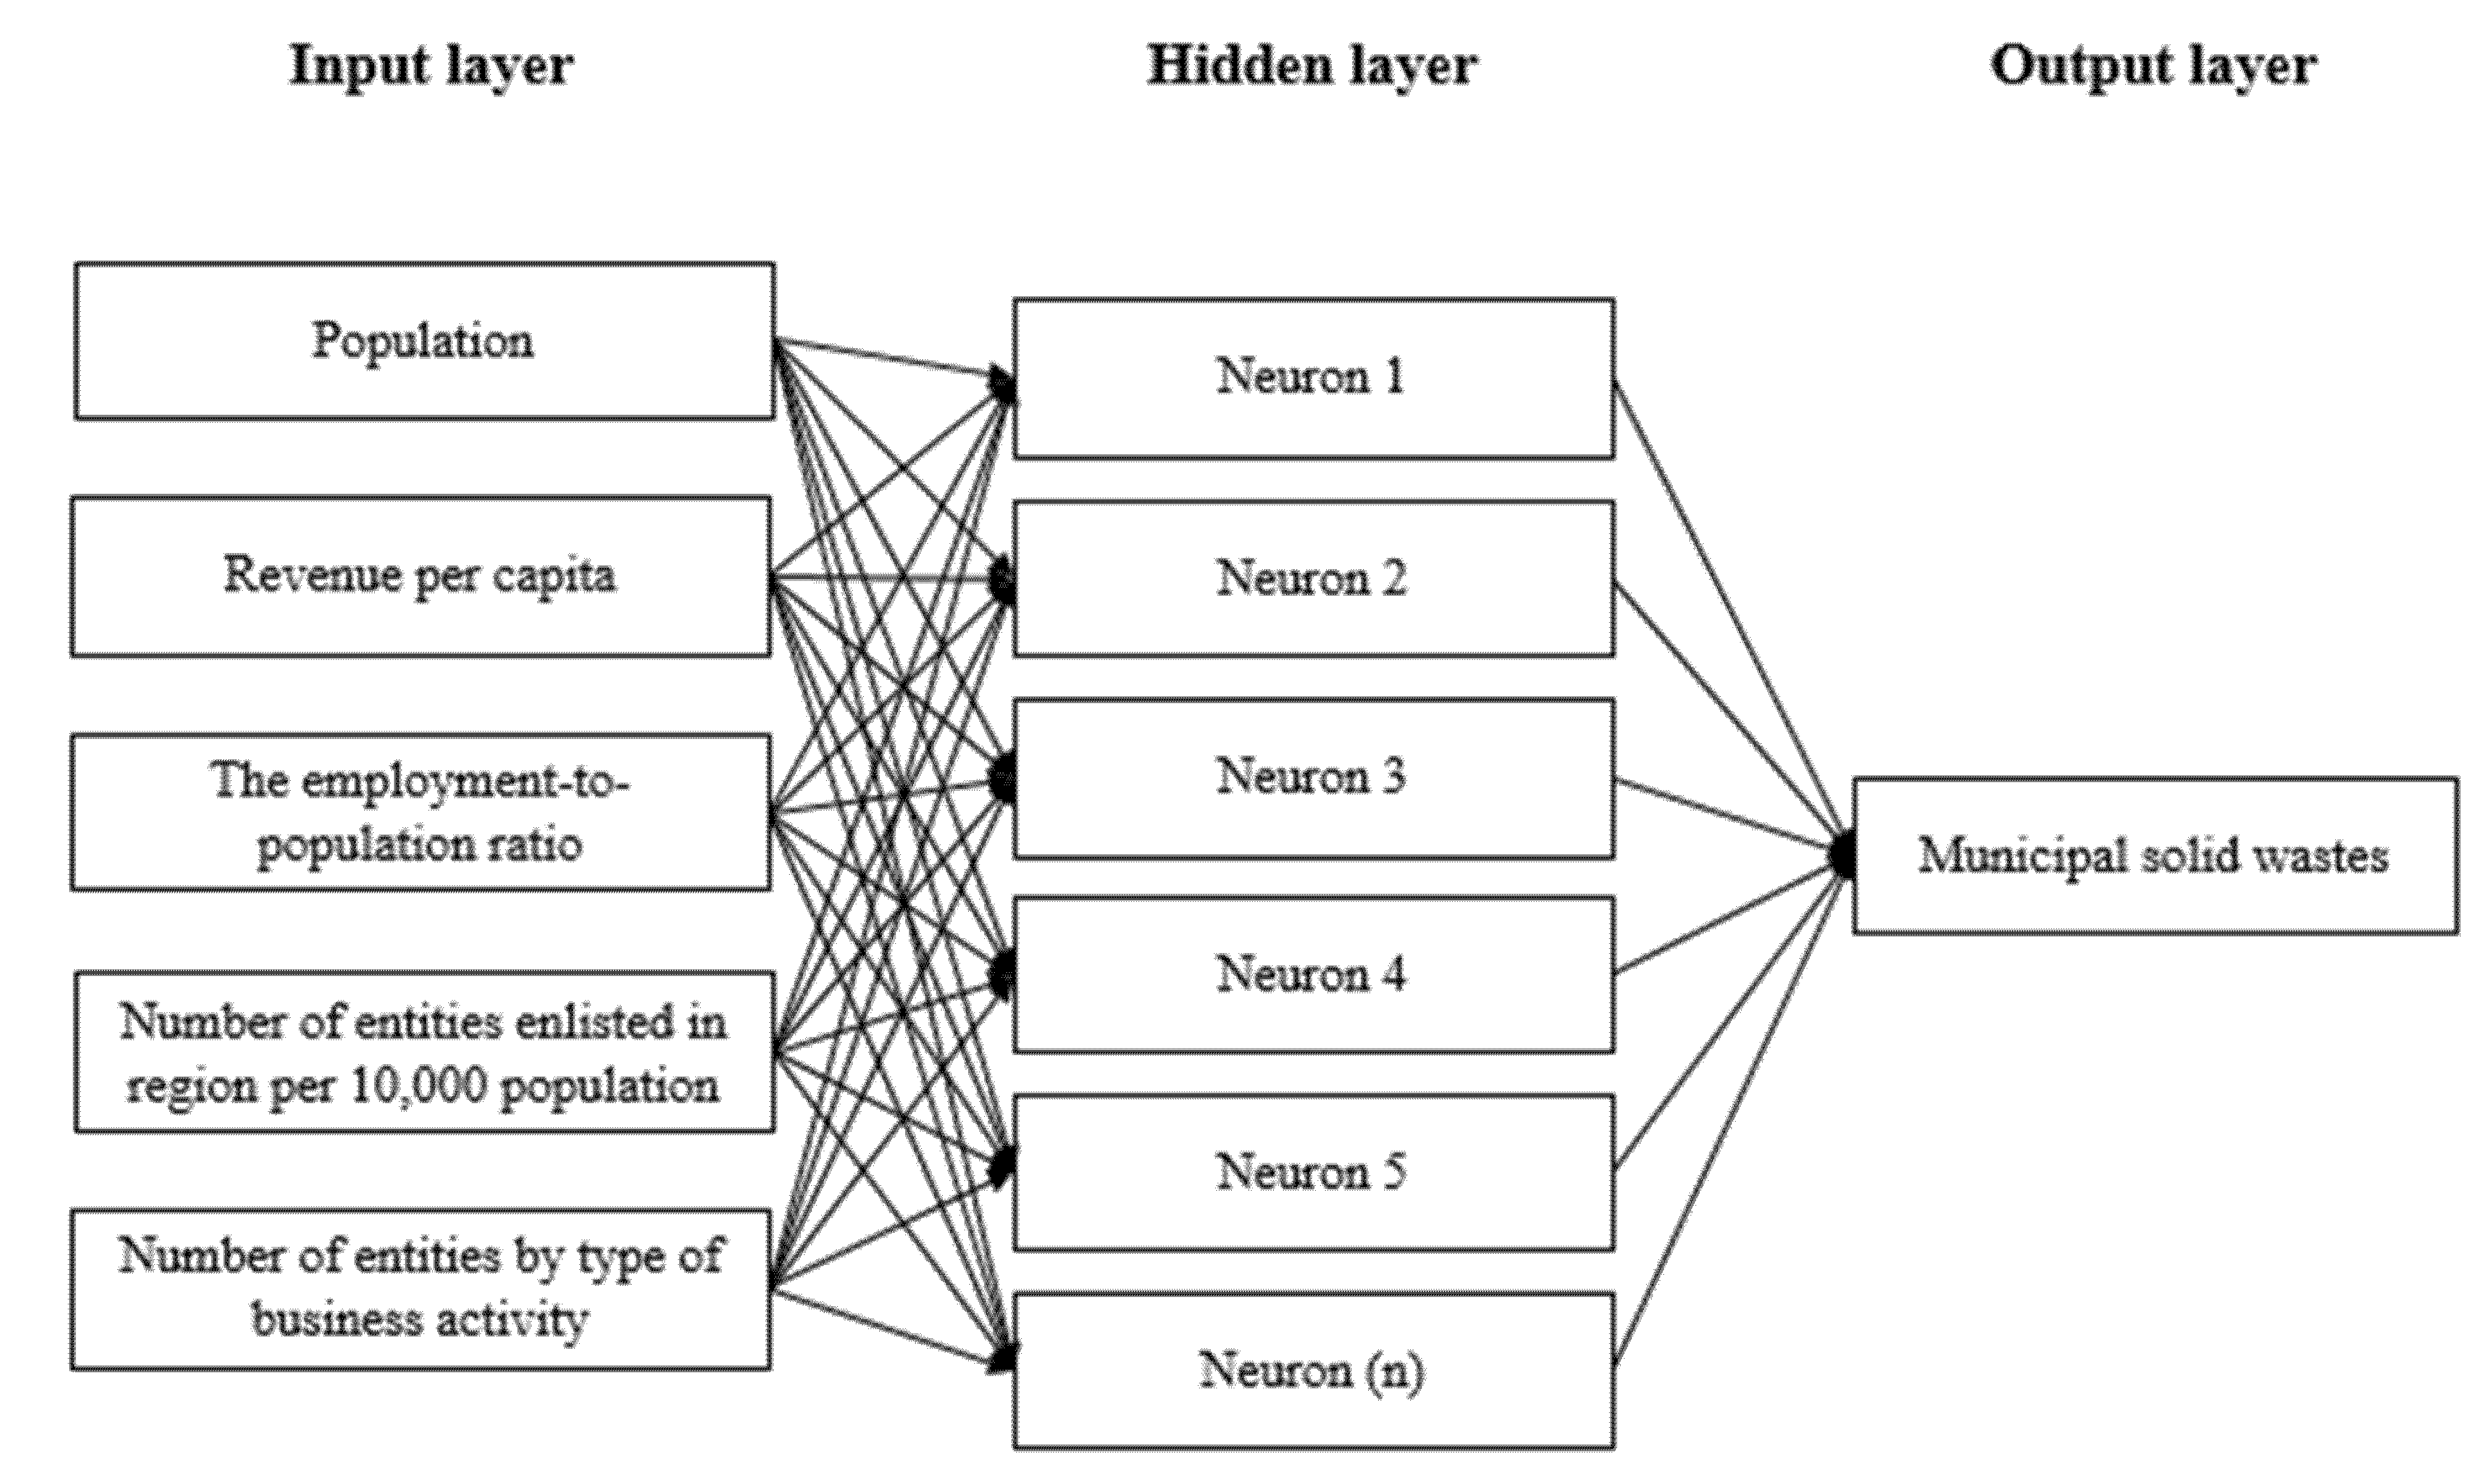
2.1. Feed-Forward Artificial Neural Network

ANN is a machine learning algorithm that is inspired by the human brain’s anatomy [38]. This network is used to capture the non-linear relationship between the input and output factors. It has been widely applied in waste management problems such as the type or quantity of waste produced and its relationship to socioeconomic variables [39,40]. It has gained increasing popularity because of its unique benefits over other approaches, such as the clear network architecture, high-performance quality, and simple implementation [41,42,43]. Figure 1 depicts the structure of the neural network. It comprises input, hidden, and output layers. Data are supplied into the network through the input layer, and it is then processed utilizing hidden layers to get and report the desired output in the output layer. The number of neurons in the input layer is developed based on the number of input variables while the number of different outcomes determines the number of neurons in the output layer [44]. The weights and biases are assigned to channels linking neurons in subsequent layers. The activation state of the neuron is then determined by passing this value through an activation function. The data are propagated forward through activated neurons in the different layers until the result is delivered in the last layer. The network is trained by comparing the anticipated output to the actual result. The weights are then adjusted based on the computed prediction error in the back-propagation process. The forward and backward propagation procedures are repeated iteratively until the network can correctly predict the output [45].

2.2. Particle Swarm Optimization Algorithm

One of the most well-known evolutionary algorithms is PSO that has been widely employed in a wide range of scientific and industrial applications [46]. The flowchart of the PSO algorithm is illustrated in Figure 2. This algorithm is based on how a school of fish or flock of birds navigates and moves. It finds a global optimum solution by populating the search space with particles where each particle has three vectors that store the present position, the moving direction, and the optimal location in the entire swarm. The ideal local position of a particle, as well as the experience of its neighbors, influence its migration. The global best position in the solution space is updated as nearby particles discover better places in the search space. This acts as a guide to assist the swarm in determining the optimal solution. Finally, the optimum solution is determined by the current best particle position in the swarm [47].

2.3. Neural Network Optimized Using Particle Swarm Optimization Algorithm

In this study, a neural network is used to forecast the MSW quantities in the different Polish cities. Optimization algorithms allow neural networks to avoid overfitting and local minima during training [48,49]. The PSO algorithm is utilized in this study to train the ANN model to figure out what the best weights and biases are. This algorithm is considered one of the most popular and effective ANN training methods [37,50]. Figure 3 depicts the flowchart of the improved ANN model. The optimization algorithm establishes the weights and calculates the fitness function to train the network. The network fitness is interpreted in this study by calculating the error as shown in Equations (1) and (2). When the global best solution, which is associated with the least error function, is found, the optimization process ends.
M S E ( a , p ) = i ( a i p i ) 2 n
N M S E ( a , p ) = M S E ( a , p ) / M S E ( a , 0 ) = a p 2 2 / a 2 2
where N M S E represents the normalized mean squared error, n represents the total number of data points, and a i and p i represent the actual and predicted values, respectively.

2.4. Performance Assessment Metrics

The performance of the conventional and optimized neural network models is compared using five performance assessment criteria; coefficient of efficiency (Equation (3)), Pearson correlation coefficient (Equation (4)), Willmott’s index of agreement (Equation (5)), root mean squared error (Equation (6)), and mean bias error (Equation (7)). These metrics are used for assessing the robustness of the relationship between modeled and observed data. It should be noted that higher values of the first three metrics, as well as lower values of the last two metrics, imply that the anticipated and actual values are in excellent agreement, and vice versa [51,52,53].
C E = 1 [ i = 1 n ( p i a i ) 2 i = 1 n ( a i a ¯ ) 2 ]  
R = i = 1 n ( a i a ¯ ) ( p i p ¯ ) i = 1 n ( a i a ¯ ) 2 i = 1 n ( p i p ¯ ) 2  
W I = 1 [ i = 1 n ( a i p i ) 2 i = 1 n ( | p i a ¯ | + | a i a ¯ | ) 2 ]  
R M S E = 1 n i = 1 n ( a i p i ) 2  
M B E = 1 n i = 1 n | p i a i |  
where p ¯ and a ¯ represent the average predicted and actual values.

3. Model Development

The flowchart of the proposed model is illustrated in Figure 4. The main objective of this research study is to forecast the MSW quantities in Polish cities based on socio-economic factors. For this purpose, the neural network models have been developed and their prediction performance is evaluated using five assessment metrics. Furthermore, the significance level of the outcomes delivered by the conventional and trained neural network models is determined using the Wilcoxon–Mann–Whitney U-test. Finally, the best forecasting model is suggested based on the reported results and findings.

4. Case Study

The data used in this research is acquired from a previous research study in Poland [9]. The waste generation characteristics of many cities with varying social and economic aspects in 2019 are provided in Table 1. The input factors comprise population (capita), revenue per capita, employment to population ratio (%), number of entities enlisted in the official national register of business entities (REGON) per 10,000 population, and number of entities by type of business activity while the output factor refers to the total MSW quantities. MSW volume is found to be positively and substantially correlated with population and income level in research studies [54]. This can be attributed to the fact that rapid population growth increases the amount of waste generated. Moreover, individuals in the affluent class consume more than those in the lower-income class, leading to an increased rate of waste generation for the former [55]. The unemployment rate impacts the population’s purchasing power, which could have a direct impact on waste disposal levels [56]. Finally, the number of entities and type of business activity (e.g., construction, industrial) in each entity impact the quantity and composition of generated waste [4].
The distribution of MSW quantities and waste per capita (total MSW quantities divided by population) in Polish cities is visualized in Figure 5. It is worth noting that Warszawa city is the most densely populated city (i.e., 1,790,658 persons) and it generates the highest quantities of wastes (i.e., 129,111.64 Mg). On the contrary, Oles’nica city has the lowest population density of 1839 persons and it is associated with the lowest quantities of wastes (i.e., 167.35 Mg). Meanwhile, Lublin city is characterized by the highest waste per capita of 2.61 Mg/person. Table 2 depicts the statistical data on MSW, which illustrates that the wastes do not follow the normal distribution and are rather right-skewed due to their positive skewness value.
Figure 6 shows the correlation between all of the factors used to forecast municipal wastes. Variables having correlation coefficients between 0.5 and 0.7 can be classified as moderately correlated. This is true for the following pairs: revenue per capita and wastes, and number of entities enlisted in REGON per 10,000 population and wastes. In addition, variables with correlation coefficients of 0.7 to 0.9 have a strong correlation. This is true for the variables of population and revenue per capita, population and number of entities enlisted in REGON per 10,000 population, population and total wastes, revenue per capita and number of entities enlisted in REGON per 10,000 population, revenue per capita and number of entities by type of business activity, number of entities enlisted in REGON per 10,000 population and number of entities by type of business activity, and number of entities by type of business activity and total wastes. Furthermore, the population and employment to population ratio, revenue per capita and employment to population ratio, employment to population ratio and number of entities enlisted in REGON per 10,000 population, employment to population ratio and number of entities by type of business activity, and employment to population ratio and waste quantities variables have an inversely proportionate relationship. Finally, the population is correlated to the largest extent with the number of entities by type of business activity.

5. Results

The ANN parameters have to be specified such that the number of hidden neurons is estimated to be 10. The same number of hidden neurons is assumed for the ANN–PSO model in order to provide a fair evaluation of the models. For PSO, the maximum number of iterations and population size are assumed to be 200 and 50, respectively. Furthermore, the inertia weight, inertia weight damping ratio, personal learning coefficient, and global learning coefficient are determined to be 1, 0.99, 2, and 2, respectively. Finally, the MATLAB R2019a software is used to develop the neural network models.
Figure 7 shows a comparison between anticipated and actual MSW quantities in Poland. As shown in Table 3, there are five different metrics used to evaluate the performance of neural network models, namely CE, R, WI, RMSE, and MBE. The greatest CE, R, and WI are indicative of a model’s best performance. In addition, the best models are associated with the least values of RMSE and MBE values. The CE values of ANN and ANN–PSO models are 0.11 and 0.92, respectively. ANN and ANN–PSO models have R values of 0.68 and 0.96, respectively. ANN–PSO performs better in terms of WI, similar to CE and R findings. For example, ANN and ANN–PSO models have WI values of 0.78 and 0.98, respectively. With respect to the error metrics, ANN–PSO is associated with RMSE of 11,342.74 and MBE of 6548.55, significantly lower than that of the ANN model (RMSE = 38,571.68 and MBE = 30,652.04). This demonstrates that the ANN model trained using the PSO algorithm outperforms the traditional ANN model. As a result, the ANN–PSO model may be recognized as a reliable model for forecasting MSW quantities in Poland based on social and economic aspects.
The significant level of the neural network models’ output is evaluated using the Wilcoxon–Mann–Whitney U-test, with a significance level of 0.05. The test validates the null hypothesis, which asserts that the two rankings are equal. The alternative hypothesis, on the other hand, indicates that the two models are ranked differently. The null hypothesis is rejected in favor of the alternative hypothesis if the p-value is less than the significance level. The null hypothesis is accepted if the p-value is larger than the degree of significance. The p-value of (ANN–PSO, observed) is more than 0.05, suggesting that the difference between the models is statistically insignificant (i.e., null hypothesis is true). The p-values of the pairings (ANN, observed) and (ANN, ANN–PSO) are all less than 0.05, suggesting that the models are statistically different (i.e., null hypothesis is false).
The outcomes of the proposed ANN–PSO model are compared to the results reported in the literature, as summarized in Table 4. For the goal of making short-term weekly predictions, Noori et al. [39] used ANN and principal component regression to estimate MSW output in Tehran. The ANN had R and average absolute relative error (AARE) values of 0.837 and 0.044, respectively. These metrics were considered better than that of the principal component regression (R = 0.445 and AARE = 0.066). Furthermore, Kulisz and Kujawska [9] forecasted the MSW (glass, biodegradable, plastics and metals, paper and cardboard, and other waste) generation rate in Poland by developing an ANN model. The model accounted for the influence of economic, demographic, and social parameters on waste generation quantities. The model exhibited high prediction accuracy by acquiring a high R-value (R = 0.914) and low MSE value.
Ali Abdoli et al. [57] employed ANN for the long-term prediction of solid waste generation in Mashhad city, Iran. Population size, household income, and maximum temperature were determined to be important determinants in solid waste output. The ANN model outperformed the multivariate regression model, with mean absolute percentage error (MAPE), MSE, and R values of 0.046, 0.26, and 0.86, respectively. Adeleke [58] employed ANN to estimate the physical waste streams in the city of Johannesburg based on meteorological factors. The input factors comprised humidity, wind speed, and maximum/minimum temperature. For forecasting organic, paper, plastics, and textile waste, optimal topologies acquired R-values of 0.916, 0.862, 0.834, and 0.826, respectively. In this study, the ANN–PSO model is associated with CE, R, WI, RMSE, and MBE metrics of 0.92, 0.96, 0.98, 11,342.74, and 6548.55, respectively. Therefore, the proposed model improves the performance metrics reported in the literature.

6. Conclusions

An accurate prediction of the municipal solid waste (MSW) generation rate is critical for sustainable and efficient MSW management. Neural network models have been recently used and proved their efficiency for modeling MSW quantities. Though previous work on waste generation prediction had been undertaken, this is the first time the optimized artificial neural network (ANN) model using particle swarm optimization (PSO) had been applied. This research applied an ANN model coupled with the PSO algorithm and conventional ANN to forecast MSW quantities in Polish cities. The performance of the models was compared using five assessment metrics, namely, coefficient of efficiency (CE), Pearson correlation coefficient (R), Willmott’s index of agreement (WI), root mean squared error (RMSE), and mean bias error (MBE). To represent the effect of economic, demographic, and social factors on the rate of waste generation, selected explanatory factors were integrated into the developed models. Population, employment-to-population ratio, revenue per capita, number of entities by type of commercial activity, and number of businesses enlisted in REGON per 10,000 people were the considered criteria.
The ANN–PSO model (CE = 0.92, R = 0.96, WI = 0.98, RMSE = 11,342.74, and MBE = 6548.55) surpassed the standard ANN model (CE = 0.11, R = 0.68, WI = 0.78, RMSE = 38,571.68, and MBE = 30,652.04), according to the findings. The Wilcoxon–Mann–Whitney U-test was used to determine the significance level of the reported outputs, with a significance level of 0.05. The p-values for (ANN, observed) and (ANN, ANN–PSO) were all less than 0.05, indicating that the models were statistically distinct. On the contrary, the p-value of (ANN–PSO, observed) was more than 0.05, indicating that the difference between the models was statistically negligible. As a result, the suggested ANN–PSO model had demonstrated its efficacy in estimating MSW volumes. Furthermore, it could successfully offer the foundation for the development of modern waste management systems when used in the evaluation and forecasting of waste management demands.
As for the model limitations, each city is characterized by a different model that is dependent on its associated collected data. In addition, there needed to be records for the accumulated quantities of MSW in each city. Using statistical data in different cities, the given approach may be generalized to any city across the world. However, depending on the uniqueness of the studied country, adjusting this approach may demand matching influencing parameters. This research could be extended in the future by examining the performance of different optimization algorithms to train ANN for simulating MSW quantities. In addition, the proposed model could be further improved by applying dimensionality-reduction methods such as Principle Component Analysis (PCA) to select the most important input factors in the dataset.

Author Contributions

Conceptualization, N.E. and E.M.A.; methodology, N.E. and E.M.A.; formal analysis N.E., E.M.A., A.A.-S. and G.A.; data curation, N.E., E.M.A., A.A.-S. and G.A.; Investigation, N.E., E.M.A., A.A.-S. and G.A.; Resources, N.E., E.M.A., A.A.-S. and G.A.; writing—original draft preparation, N.E., E.M.A., A.A.-S. and G.A.; writing—review and editing, N.E., E.M.A., A.A.-S. and G.A. All authors have read and agreed to the published version of the manuscript.

Funding

This research received no external funding.

Institutional Review Board Statement

Not applicable.

Informed Consent Statement

Informed consent was obtained from all subjects involved in the study.

Data Availability Statement

Some or all data, models, or code that support the findings of this study are available from the corresponding author upon reasonable request.

Conflicts of Interest

The authors declare no conflict of interest.

Abbreviations

AAREAverage absolute relative error
ANFISAdaptive neuro-fuzzy inference system
ANNArtificial neural network
BPNNBackpropagation neural network
CECoefficient of efficiency
DWTDiscrete wavelet theory
EUEuropean Union
GAGenetic algorithm
MAPEMean absolute percentage error
MBEMean bias error
MENAMiddle East/North Africa
MSEMean squared error
MSWMunicipal solid waste
PCAPrinciple component analysis
PSOParticle swarm optimization
RPearson correlation coefficient
R2Coefficient of determination
RMSERoot mean squared error
SVMSupport vector machine
SVRSupport vector regression
WIWillmott’s index of agreement

References

  1. Ngoc, U.N.; Schnitzer, H. Sustainable solutions for solid waste management in Southeast Asian countries. J. Waste Manag. 2009, 29, 1982–1995. [Google Scholar] [CrossRef] [PubMed]
  2. Ayeleru, O.O.; Okonta, F.N.; Ntuli, F. Municipal solid waste generation and characterization in the City of Johannesburg: A pathway for the implementation of zero waste. J. Waste Manag. 2018, 79, 87–97. [Google Scholar] [CrossRef] [PubMed]
  3. Madaleno, M. Environmental pollution, waste generation and human health. Biomed. J. Sci. Tech. Res. 2018, 10, 3180–3193. [Google Scholar] [CrossRef]
  4. National Waste Management, Act of 14 December 2012 on Waste. Available online: http://isap.sejm.gov.pl/isap.nsf/DocDetails.xsp?id=WDU20130000021 (accessed on 21 September 2021).
  5. Estay-Ossandon, C.; Mena-Nieto, A.; Harsch, N. Using a fuzzy TOPSIS-based scenario analysis to improve municipal solid waste planning and forecasting: A case study of Canary archipelago (1999–2030). J. Clean. Prod. 2018, 176, 1198–1212. [Google Scholar] [CrossRef]
  6. Kaza, S.; Yao, L.; Bhada-Tata, P.; Van Woerden, F. What a Waste 2.0: A Global Snapshot of Solid Waste Management to 2050; World Bank Publications: Washington, DC, USA, 2018. [Google Scholar]
  7. Zafar, S. Waste Management Challenges in Middle East. 2016. Available online: https://www.bioenergyconsult.com/waste-management-middle-east/ (accessed on 27 June 2018).
  8. Statista Research Department. Total Volume of Waste Produced Per Capita in the European Union 2019, by Country. 2021. Available online: https://www.statista.com/statistics/789638/production-waste-tons-by-inhabitant-union-european/ (accessed on 21 September 2021).
  9. Kulisz, M.; Kujawska, J. Prediction of municipal waste generation in Poland using neural network modeling. Sustainability 2020, 12, 10088. [Google Scholar] [CrossRef]
  10. Basic Data of Statistical Surveys of Public Statistics in Poland. Available online: https://stat.gov.pl/publikacje/publikacje-a-z/ (accessed on 21 October 2021).
  11. Grodzińska-Jurczak, M. Management of industrial and municipal solid wastes in Poland. Resour. Conserv. Recycl. 2001, 32, 85–103. [Google Scholar] [CrossRef]
  12. Giusti, L. A review of waste management practices and their impact on human health. J. Waste Manag. 2009, 29, 2227–2239. [Google Scholar] [CrossRef] [PubMed]
  13. Ghinea, C.; Drăgoi, E.N.; Comăniţă, E.D.; Gavrilescu, M.; Câmpean, T.; Curteanu, S.; Gavrilescu, M. Forecasting municipal solid waste generation using prognostic tools and regression analysis. J. Environ. Manag. 2016, 182, 80–93. [Google Scholar] [CrossRef]
  14. Vu, H.L.; Ng, K.T.W.; Bolingbroke, D. Time-lagged effects of weekly climatic and socio-economic factors on ANN municipal yard waste prediction models. J. Waste Manag. 2019, 84, 129–140. [Google Scholar] [CrossRef]
  15. Armstrong, J.S.; Green, K.C. Forecasting methods and principles: Evidence-based checklists. J. Glob. Sch. Mark. Sci. 2018, 28, 103–159. [Google Scholar] [CrossRef]
  16. De Baets, S.; Harvey, N. Using judgment to select and adjust forecasts from statistical models. Eur. J. Oper. Res. 2020, 284, 882–895. [Google Scholar] [CrossRef]
  17. Purcell, M.; Magette, W.L. Characterization of Household and Commercial BMW Generation According to Socio-Economic and Other Factors for the Dublin Region. In Proceedings of the International Conference on Solid Waste Technology and Management, Philadelphia, PA, USA, 18–21 March 2007. [Google Scholar]
  18. Intharathirat, R.; Salam, P.A.; Kumar, S.; Untong, A. Forecasting of municipal solid waste quantity in a developing country using multivariate grey models. J. Waste Manag. 2015, 39, 3–14. [Google Scholar] [CrossRef]
  19. Kontokosta, C.E.; Hong, B.; Johnson, N.E.; Starobin, D. Using machine learning and small area estimation to predict building-level municipal solid waste generation in cities. Comput. Environ. Urban Syst. 2018, 70, 151–162. [Google Scholar] [CrossRef]
  20. Buenrostro, O.; Bocco, G.; Vence, J. Forecasting generation of urban solid waste in developing countries—A case study in Mexico. J. Air Waste Manag. Assoc. 2001, 51, 86–93. [Google Scholar] [CrossRef] [Green Version]
  21. Roy, S.; Rafizul, I.M.; Didarul, M.; Asma, U.H.; Shohel, M.R.; Hasibul, M.H. Prediction of municipal solid waste generation of khulna city using artificial neural network: A case study. Int. J. Eng. Res. 2013, 1, 13–18. [Google Scholar]
  22. Singh, D.; Satija, A. Prediction of municipal solid waste generation for optimum planning and management with artificial neural network—Case study: Faridabad City in Haryana State (India). Int. J. Syst. Assur. Eng. Manag. 2018, 9, 91–97. [Google Scholar] [CrossRef]
  23. Edjabou, M.E.; Jensen, M.B.; Götze, R.; Pivnenko, K.; Petersen, C.; Scheutz, C.; Astrup, T.F. Municipal solid waste composition: Sampling methodology, statistical analyses, and case study evaluation. J. Waste Manag. 2015, 36, 12–23. [Google Scholar] [CrossRef] [PubMed] [Green Version]
  24. Edjabou, M.E.; Martín-Fernández, J.A.; Scheutz, C.; Astrup, T.F. Statistical analysis of solid waste composition data: Arithmetic mean, standard deviation and correlation coefficients. J. Waste Manag. 2017, 69, 13–23. [Google Scholar] [CrossRef] [PubMed] [Green Version]
  25. Ma, S.; Fildes, R. Forecasting third-party mobile payments with implications for customer flow prediction. Int. J. Forecast. 2020, 36, 739–760. [Google Scholar] [CrossRef]
  26. Abbasi, M.; El Hanandeh, A. Forecasting municipal solid waste generation using artificial intelligence modelling approaches. J. Waste Manag. 2016, 56, 13–22. [Google Scholar] [CrossRef] [PubMed]
  27. Kolekar, K.A.; Hazra, T.; Chakrabarty, S.N. A review on prediction of municipal solid waste generation models. Procedia Environ. Sci. 2016, 35, 238–244. [Google Scholar] [CrossRef]
  28. Soni, U.; Roy, A.; Verma, A.; Jain, V. Forecasting municipal solid waste generation using artificial intelligence models—A case study in India. SN Appl. Sci. 2019, 1, 162. [Google Scholar] [CrossRef] [Green Version]
  29. Meza, J.K.S.; Yepes, D.O.; Rodrigo-Ilarri, J.; Cassiraga, E. Predictive analysis of urban waste generation for the city of Bogotá, Colombia, through the implementation of decision trees-based machine learning, support vector machines and artificial neural networks. Heliyon 2019, 5, e02810. [Google Scholar] [CrossRef]
  30. Dissanayaka, D.M.S.H.; Vasanthapriyan, S. Forecast Municipal Solid Waste Generation in Sri Lanka. In Proceedings of the 2019 International Conference on Advancements in Computing (ICAC), Malabe, Sri Lanka, 5–7 December 2019. [Google Scholar]
  31. Oguz-Ekim, P. Machine learning approaches for municipal solid waste generation forecasting. Environ. Eng. Sci. 2021, 38, 489–499. [Google Scholar] [CrossRef]
  32. Daoud, A.O.; Othman, A.A.E.; Robinson, H.; Bayyati, A. An investigation into solid waste problem in the Egyptian construction industry: A mini-review. Waste Manag. Res. 2020, 38, 371–382. [Google Scholar] [CrossRef]
  33. ElSaid, S.; Aghezzaf, E.H. Alternative strategies towards a sustainable municipal solid waste management system: A case study in Cairo. Waste Manag. Res. 2020, 38, 995–1006. [Google Scholar] [CrossRef] [PubMed]
  34. Ayeleru, O.O.; Fajimi, L.I.; Oboirien, B.O.; Olubambi, P.A. Forecasting municipal solid waste quantity using artificial neural network and supported vector machine techniques: A case study of Johannesburg, South Africa. J. Clean. Prod. 2021, 289, 125671. [Google Scholar] [CrossRef]
  35. Coskuner, G.; Jassim, M.S.; Zontul, M.; Karateke, S. Application of artificial intelligence neural network modeling to predict the generation of domestic, commercial and construction wastes. Waste Manag. Res. 2021, 39, 499–507. [Google Scholar] [CrossRef] [PubMed]
  36. Sayyahi, F.; Farzin, S.; Karami, H. Forecasting daily and monthly reference evapotranspiration in the Aidoghmoush basin using multilayer perceptron coupled with water wave optimization. Complexity 2021, 2021, 6683759. [Google Scholar] [CrossRef]
  37. Kaminski, M. Neural Network Training Using Particle Swarm Optimization—A Case Study. In Proceedings of the 24th International Conference on Methods and Models in Automation and Robotics (MMAR), Miedzyzdroje, Poland, 26–29 August 2019. [Google Scholar]
  38. Nwadiugwu, M.C. Neural networks, artificial intelligence and the computational brain. arXiv 2020, arXiv:2101.08635. [Google Scholar]
  39. Noori, R.; Abdoli, M.A.; Ghazizade, M.J.; Samieifard, R. Comparison of neural network and principal component-regression analysis to predict the solid waste generation in Tehran. Iran. J. Public Health 2009, 38, 74–84. [Google Scholar]
  40. Batinić, B.; Vukmirović, S.; Vujić, G.; Stanisavljević, N.; Ubavin, D.; Vukmirović, G. Using ANN model to determine future waste characteristics in order to achieve specific waste management targets-case study of Serbia. J. Sci. Ind. Res. 2011, 70, 513–518. [Google Scholar]
  41. Yamin, H.Y.; Shahidehpour, S.M.; Li, Z. Adaptive short-term electricity price forecasting using artificial neural networks in the restructured power markets. Int. J. Electr. Power Energy Syst. 2004, 26, 571–581. [Google Scholar] [CrossRef]
  42. Ozcan, H.K.; Ucan, O.N.; Sahin, U.; Borat, M.; Bayat, C. Artificial neural network modeling of methane emissions at Istanbul Kemerburgaz-Odayeri landfill site. J. Sci. Ind. Res. 2006, 65, 128–134. [Google Scholar]
  43. Jalali, G.Z.M.; Nouri, R.E. Prediction of municipal solid waste generation by use of artificial neural network: A case study of Mashhad. Int. J. Environ. Res. 2008, 2, 13–22. [Google Scholar]
  44. Raj, P.; Evangeline, P. The Digital Twin Paradigm for Smarter Systems and Environments: The Industry Use Cases; Academic Press: London, UK, 2020. [Google Scholar]
  45. Abdelaziz, A.Y.; Aleem, S.H.E.A.; Yadav, A. Artificial Intelligence Applications in Electrical Transmission and Distribution Systems Protection; CRC Press: Boca Raton, FL, USA, 2021. [Google Scholar]
  46. Fan, S.K.S.; Jen, C.H. An enhanced partial search to particle swarm optimization for unconstrained optimization. Mathematics 2019, 7, 357. [Google Scholar] [CrossRef] [Green Version]
  47. Eberhart, R.; Kennedy, J. A New Optimizer Using Particle Swarm Theory. In Proceedings of the Sixth International Symposium on Micro Machine and Human Science (MHS’95), Nagoya, Japan, 4–6 October 1995. [Google Scholar]
  48. Ojha, V.K.; Abraham, A.; Snášel, V. Metaheuristic design of feedforward neural networks: A review of two decades of research. Eng. Appl. Artif. Intell. 2017, 60, 97–116. [Google Scholar] [CrossRef] [Green Version]
  49. Abusnaina, A.A.; Ahmad, S.; Jarrar, R.; Mafarja, M. Training Neural Networks Using Salp Swarm Algorithm For Pattern Classification. In Proceedings of the 2nd International Conference on Future Networks and Distributed Systems (ICFNDS’18), Amman, Jordan, 26–27 June 2018; Association for Computing Machinery (ACM): New York, NY, USA, 2018. [Google Scholar]
  50. Garro, B.A.; Vázquez, R.A. Designing artificial neural networks using particle swarm optimization algorithms. Comput. Intell. Neurosci. 2015, 2015, 369298. [Google Scholar] [CrossRef] [PubMed]
  51. Cheng, K.S.; Lien, Y.T.; Wu, Y.C.; Su, Y.F. On the criteria of model performance evaluation for real-time flood forecasting. Stoch. Environ. Res. Risk Assess. 2017, 31, 1123–1146. [Google Scholar] [CrossRef] [Green Version]
  52. Pereira, H.R.; Meschiatti, M.C.; Pires, R.C.D.M.; Blain, G.C. On the performance of three indices of agreement: An easy-to-use r-code for calculating the Willmott indices. Bragantia 2018, 77, 394–403. [Google Scholar] [CrossRef] [Green Version]
  53. Schober, P.; Boer, C.; Schwarte, L.A. Correlation coefficients: Appropriate use and interpretation. Anesth. Analg. 2018, 126, 1763–1768. [Google Scholar] [CrossRef] [PubMed]
  54. Liu, J.; Li, Q.; Gu, W.; Wang, C. The impact of consumption patterns on the generation of municipal solid waste in China: Evidences from provincial data. Int. J. Environ. Res. Public Health 2019, 16, 1717. [Google Scholar] [CrossRef] [Green Version]
  55. Tahir, M.; Hussain, T.; Behaylu, A. Scenerio of present and future of solid waste generation in India: A case study of Delhi mega city. J. Environ. Earth Sci. 2015, 5, 83–91. [Google Scholar]
  56. Khajevand, N.; Tehrani, R. Impact of population change and unemployment rate on Philadelphia’s waste disposal. J. Waste Manag. 2019, 100, 278–286. [Google Scholar] [CrossRef] [PubMed]
  57. Ali Abdoli, M.; Falah Nezhad, M.; Salehi Sede, R.; Behboudian, S. Longterm forecasting of solid waste generation by the artificial neural networks. Environ. Prog. Sustain. Energy 2012, 31, 628–636. [Google Scholar] [CrossRef]
  58. Adeleke, O.; Akinlabi, S.A.; Jen, T.C.; Dunmade, I. Application of artificial neural networks for predicting the physical composition of municipal solid waste: An assessment of the impact of seasonal variation. Waste Manag. Res. 2021, 39, 1058–1068. [Google Scholar] [CrossRef]
Figure 1. Structure of a neural network.
Processes 09 02045 g001
Figure 2. Flowchart of PSO algorithm.
Processes 09 02045 g002
Figure 3. Flowchart of ANN model coupled with PSO algorithm.
Processes 09 02045 g003
Figure 4. Components of the proposed framework.
Processes 09 02045 g004
Figure 5. Distribution of municipal wastes in Polish cities.
Processes 09 02045 g005
Figure 6. Correlation between input and output parameters for MSW prediction.
Processes 09 02045 g006
Figure 7. Time series plot of the actual and predicted MSW.
Processes 09 02045 g007
Table 1. Description of the dataset.
CitiesPopulation (Capita)Revenue per CapitaThe Employment-to-Population Ratio (%)Number of Entities Enlisted in REGON per 10,000 PopulationNumber of Entities by Type of Business ActivityTotal Waste (Mg)
Białystok297,5547295.3260.31212650747,808.27
Gdańsk470,9077738.9458169614,91172,380.3
Głubczyce12,5214449.9159.5120113811641.96
Jastrowie86334906.2859.1902208465
Katowice292,7747437.2758.61655718636,130.85
Kraków779,1157630.0259.1188622,85489,286.4
Krotoszyn28,8044691.946011147312948.04
Legnica99,3506310.3558.91393251110,115.84
Lublin33,7846941.8558.61359754688,045
Łódż679,9416600.8456.4138417,303104,336.69
Małomice34584864.3762.485692173.33
Oles’nica18395821.0958.41164890167.35
Olsztynek75145004.6462.1954132352.33
Poznań534,8137766.5158.1215818,36580,565.32
Rzeszów196,2087533.1460.11496434026,543.42
Slupsk90,6816855.0558140522037670.48
Staszów14,6494622.9259.89696571073.06
Suwałki69,7587502.3362101613993833.76
Szczecin401,9076563.258.3172114,42842,518.5
Toruń201,4476385.79591313460618,329.87
Warszawa1,790,65810,154.8857.3254860,948129,111.64
Wrocław642,8697681.4658.6190919,714111,090.3
Zakopane27,0106325.615822807853319.14
Zamość63,4377538.259.8119011936516.2
Zielona Góra141,2227644.0458.31552419713,440.96
Table 2. Statistical parameters of input and output parameters for MSW prediction.
Statistical ParametersPopulationRevenue per CapitaThe Employment-to-Population RatioNumber of Entities Enlisted in REGON per 10,000 PopulationNumber of Entities by Type of Business ActivityTotal MSW (Mg)
Median99,350.06855.158.91384.04197.013,441.0
Standard deviation395,943.51352.41.4443.513,022.041,816.4
Mean275,634.16650.659.11453.38603.535,914.6
Min 1839.04449.956.4856.092.0167.4
Max1,790,658.010,154.962.42548.060,948.0129,111.6
Skewness 2.60.20.80.83.01.0
Kurtosis 8.40.40.60.210.8−0.5
Table 3. Assessment performance metrics of the neural network models.
Performance MeasureNeural Network Model
ANNANN–PSO
CE0.110.92
R0.680.96
WI0.780.98
RMSE38,571.6811,342.74
MBE30,652.046548.55
Table 4. Comparison of the outcomes of this research against the results reported in the literature.
Application AreaCase StudyPerformance MetricsReferences
Predicting MSW (glass, biodegradable, plastics and metals, paper and cardboard, and other waste) generation amounts using ANNDifferent polish citiesR = 0.914[9]
Estimating weekly MSW output using ANNTehranR = 0.837 and AARE = 0.044[39]
Long-term prediction of solid waste generation using ANNMashhad, IranR = 0.86, MSE = 0.26, and MAPE = 0.046[57]
Forecasting organic, paper, plastics, and textile waste using ANNJohannesburg, South AfricaR-values = 0.916,0.862, 0.834, and 0.826 for waste categories[58]
Forecasting MSW generation quantities using ANN–PSODifferent polish citiesCE = 0.92, R = 0.96, WI = 0.98, RMSE = 11,342.74, and MBE = 6548.55Our research study
Publisher’s Note: MDPI stays neutral with regard to jurisdictional claims in published maps and institutional affiliations.

