Article

Biodesulfurization of Dibenzothiophene and Its Alkylated Derivatives in a Two-Phase Bubble Column Bioreactor by Resting Cells of Rhodococcus erythropolis IGTS8

by
George Prasoulas
1,†,
Konstantinos Dimos
1,†,
Panayiotis Glekas
2,
Styliani Kalantzi
1,
Stamatis Sarris
3,
Chrysovalantis Templis
3,
Konstantinos Vavitsas
2,
Dimitris G. Hatzinikolaou
2,
Nikolaos Papayannakos
3,
Dimitris Kekos
1 and
Diomi Mamma
1,*
1
Biotechnology Laboratory, School of Chemical Engineering, National Technical University of Athens, 9 Iroon Polytechniou Str, Zografou Campus, 15780 Athens, Greece
2
Enzyme and Microbial Biotechnology Unit, Department of Biology, National and Kapodistrian University of Athens, Panepistimioupolis, 15784 Athens, Greece
3
Chemical Process Engineering Laboratory, School of Chemical Engineering, National Technical University of Athens, 9 Iroon Polytechniou Str, Zografou Campus, 15780 Athens, Greece
*
Author to whom correspondence should be addressed.
These authors contributed equally to this paper.
Processes 2021, 9(11), 2064; https://doi.org/10.3390/pr9112064
Submission received: 21 October 2021 / Revised: 9 November 2021 / Accepted: 16 November 2021 / Published: 18 November 2021
(This article belongs to the Section Biological Processes and Systems)

Abstract

:
Biodesulfurization (BDS) is considered a complementary technology to the traditional hydrodesulfurization treatment for the removal of recalcitrant sulfur compounds from petroleum products. BDS was investigated in a bubble column bioreactor using two-phase media. The effects of various process parameters, such as biocatalyst age and concentration, organic fraction percentage (OFP), and type of sulfur compound—namely, dibenzothiophene (DBT), 4-methyldibenzothiophene (4-MDBT), 4,6-dimethyldibenzothiophene (4,6-DMDBT), and 4,6-diethyldibenzothiophene (4,6-DEDBT)—were evaluated, using resting cells of Rhodococcus erythropolis IGTS8. Cells derived from the beginning of the exponential growth phase of the bacterium exhibited the highest biodesulfurization efficiency and rate. The biocatalyst performed better in an OFP of 50% v/v. The extent of DBT desulfurization was dependent on cell concentration, with the desulfurization rate reaching its maximum at intermediate cell concentrations. A new semi-empirical model for the biphasic BDS was developed, based on the overall Michaelis-Menten kinetics and taking into consideration the deactivation of the biocatalyst over time, as well as the underlying mass transfer phenomena. The model fitted experimental data on DBT consumption and 2-hydroxibyphenyl (2-HBP) accumulation in the organic phase for various initial DBT concentrations and different organosulfur compounds. For constant OFP and biocatalyst concentration, the most important parameter that affects BDS efficiency seems to be biocatalyst deactivation, while the phenomenon is controlled by the affinities of biodesulfurizing enzymes for the different organosulfur compounds. Thus, desulfurization efficiency decreased with increasing initial DBT concentration, and in inverse proportion to increases in the carbon number of alkyl substituent groups.

Graphical Abstract

1. Introduction

Sulfur is the third most abundant heteroatom in crude oil, in which sulfur contents vary from 0.05% to 10% (w/w). Sulfur-containing heterocyclic compounds are among the most chemically recalcitrant sulfur compounds in oil products, and are potential environmental pollutants, since upon combustion they are transformed into sulfur oxides (SOxs)—the principal cause of acid rain [1]. Environmental regulations concerning the sulfur content of motor fuels have become increasingly stringent in an effort to reduce SOx emissions. Since 2012, the EU has taken firm action to reduce the sulfur content of marine fuels via the Sulphur Directive [2].
Currently, the conventional technology used in oil refineries for reducing the sulfur content in petroleum products is hydrodesulfurization (HDS). HDS is based on the passage of hydrogen through the petroleum fractions at elevated pressures and temperatures, over catalytic beds. Deep (ultradeep) HDS, which refers to process conditions that aim for sulfur levels below 15 ppm in diesel fuels, is an energy-intensive process with high operational and capital costs, which also reduces the calorific value of the final product [3].
Biodesulfurization (BDS) is a process that involves the use of specific microorganisms capable of using the sulfur in thiophene and other heterocyclic sulfur compounds as the sole sulfur source. BDS has been proposed, alongside HDS, as a treatment for petroleum products to achieve ultralow sulfur levels and avoid the drawbacks of deep HDS [4,5].
Several bacterial genera—such as Rhodococcus, Ralstonia, Staphylococcus, Bacillus, Mycobacterium, Sphingomonas, Pseudomonas, and Gordonia—can utilize the sulfur in dibenzothiophene (DBT) via the so called 4S pathway, and transform it to the sulfur-free compound 2-hydroxibyphenyl (2-HBP). The 4S pathway does not affect the carbon skeleton of the organosulfur compound (OSC); therefore, the quality (calorific value) of the fuel is preserved [4]. The 4S pathway, which leads to C-S bond cleavage, is typically illustrated for DBT, but is valid for several OSCs (Figure 1).
Briefly, the first two steps involve the conversion of DBT to DBT sulfoxide (DBTO), and then to DBT sulfone (DBTO2). Both steps are catalyzed by the synchronous action of a DBT-monooxygenase (DszC) and an NADH-flavin mononucleotide oxidoreductase (DszD) supplying the FMNH2 needed. DBT-sulfone is then converted to 2-hydroxybiphenyl-2-sulfinic acid (HBPS) by the synchronous action of a DBT-sulfone monooxygenase (DszA) and DszD. Finally, 2-hydroxybiphenyl sulfinate desulfinase (DszB) converts HBP-sulfinate to 2-HBP and sulfite [6].
Strains from the aforementioned bacterial genera have been used in BDS processes, employing growing or resting cells (whole cells), in both aqueous and biphasic systems [7,8,9,10,11,12,13,14,15,16,17,18,19,20]. According to Mohabeli and Ball [1], the utilization of active resting cells with the ability to desulfurize a wide range of organic sulfur compounds, placed in a biphasic system, is the preferable configuration in order to make a BDS process competitive with deep HDS. Resting cells, in general, can offer greater desulfurization efficiency. The effect of oxygen mass transfer is also recognized as a key aspect in the development of an efficient BDS process, since the 4S pathway is highly sensitive to the availability of oxygen [21,22,23]. Thus, the choice of the reactor that will be used in a BDS process is of great importance. The role of the bioreactor is to facilitate the mass transfer of OSCs and oxygen [24]. Stirred-tank bioreactors [13,25] and airlift bioreactors [24,26] have been proposed for BDS processes. A stirred-tank bioreactor is a configuration that can ensure efficient oxygen mass transfer, but high agitation speed can exert a shear stress on microorganisms, affecting their capability [27]. On the other hand, bubble column reactors, which are not mechanically agitated, have been used as multiphase reactors in the chemical, biochemical, and petrochemical industries. A bubble column reactor consists of a simple column with a gas distributor at the bottom. Bubble flow causes the mixing of the medium. The main advantages of a bubble column bioreactor are the simplicity of construction and the excellent heat and mass transfer characteristics [28]. The main difference between a bubble column and an airlift reactor is that liquid circulation is achieved in the airlift in addition to that caused by the bubble flow [29]. Furthermore, according to the analysis of Humbrid et al. [30], bubble column reactor systems can reduce the overall costs of oxygen delivery by 10–20% relative to stirred tanks.
The present study was undertaken to evaluate a BDS process in a two-phase bubble column bioreactor. This type of bioreactor, to the best of our knowledge, has not been used in biodesulfurization of OSCs compared to stirred-tank bioreactors and airlift bioreactors. As a biodesulfurization biocatalyst in our system, we employed resting cells of the bacterium Rhodococcus erythropolis IGTS8—a model biodesulfurization bacterium with high activity and selectivity in removing sulfur from OSCs found in crude oil. BDS of DBT, as well as of other OSCs with different degrees of alkylation (Figure 2), alone or in mixture with DBT, was studied. Furthermore, important parameters in any BDS process—such as the age of the biocatalyst, OFP, and resting cell concentration—were also investigated. The overall study resulted in the development of a semi-empirical model for biphasic BDS combining mass transfer, biocatalyst deactivation, and enzyme kinetics.

2. Materials and Methods

2.1. Microorganism

Rhodococcus erythropolis IGTS8 (ATCC 53968) was purchased from the American Type Culture Collection and maintained in glycerol at −85 °C.

2.2. Materials

Dibenzothiophene (DBT) (≥99%), 2-hydroxybiphenyl (2-HBP) (99%), 4-methyldibenzothiophene (4-MDBT) (96%), 4,6-dimethyldibenzothiophene (4,6-DMDBT) (97%), and 4,6-diethyldibenzothiophene (4,6-DEDBT) (97%) were purchased from Sigma-Aldrich (Merck KGaA, Darmstadt, Germany), while n-dodecane (99%) was purchased from Thermo Fisher Scientific (Waltham, MA, USA). The chemical structures of the OSCs used in the present study are presented in Figure 2. All other chemicals were of analytical grade and commercially available.

2.3. Biocatalyst Production

The composition of the basal salt medium (BSM) used was as follows (g/L): NaH2PO4·H2O, 4; K2HPO4, 4; NH4Cl, 2; MgCl2·6H2O, 0.25; CaCl2·2H2O, 0.001; FeCl3·6H2O, 0.001; glycerol, 20. The pH of the medium was adjusted to 7.0. DMSO was added following sterilization at 1.3 mM [10].
Frozen cultures were transferred to BSM–agar plates. Plates were incubated at 30 °C for 48 h. The inoculum was prepared by transferring a loop of cells to 50 mL of the BSM in a 250 mL Erlenmeyer flask. Incubation was conducted in an orbital shaker operating at 250 rpm and 30 °C.
Inoculum cultures, following 36–44 h of incubation, were used to seed 2 L Erlenmeyer flasks containing the BSM, at an initial concentration of 0.1 g DCW/L (working volume of 400 mL). Growth was allowed to proceed in an orbital shaker operating at 250 rpm and 30 °C, and was monitored at 8 h intervals via OD600 and cells’ desulfurization activity (see below). Cells were harvested when the biodesulfurization activity of the cells was 20 ± 2 Units/mg DCW, centrifuged at 8000 rpm (15,900× g) for 15 min, washed twice with BSM, and used in biodesulfurization experiments in the biphasic system.
The same procedure concerning inoculum built-up was employed for the growth of R. erythropolis IGTS8 in a 20 L bioreactor (MBR-Switzerland). The operational conditions were 1 vvm of aeration, 250 rpm blade-stirrer speed, and 30 °C temperature. Initial pH was adjusted to 7.0, but was not controlled during the process.
Cells’ desulfurization activity (CDA) was determined as follows: Cells harvested from different growth stages were washed and resuspended in 50 mM HEPES buffer (pH = 7.0) at a determined concentration (usually between 0.5 and 2 g DCW/L). Then, 150 μL of cell suspension was mixed in an Eppendorf tube, along with 150 μL of 2 mM DBT in the same buffer. The tube was incubated at 1000 rpm and 30 °C in a thermoshaker. Following 1 h of incubation, 300 μL of acetonitrile was added, and the tubes were centrifuged to remove the cells. The supernatant was assayed for 2-HBP determination via HPLC. CDA was expressed as Units per mg DCW, with 1 U corresponding to the release of 1 nmol 2-HBP per h under the above-described conditions.

2.4. Bubble-Column-Type Bioreactor System for Biphasic Desulfurization

The 4S pathway is highly sensitive to the availability of oxygen [22,23,25]. In order to ensure sufficient oxygen supply to the reaction mixture, a custom-made two-phase bubble column bioreactor system was used for the desulfurization experiments using resting cells (Figure 3). The system consisted of glass cylinders (25 cm height × 3 cm diameter), each equipped with a bottom sparger in order to provide sufficient oxygen supply and ensure proper mixing between the two phases. Air flow rate was controlled by a gas flow meter. Cylinders were placed in a water bath for temperature control during biodesulfurization.

2.5. Resting Cells’ Biodesulfurization Reactions

Harvested cells were resuspended in 50 mM HEPES buffer (pH = 7.0) in order to obtain the desired cell concentration, with no addition of the carbon source. In general, the biphasic media consisted of the aforementioned aqueous phase (containing the cells) and n-dodecane (organic phase) to represent the hydrocarbons present in petroleum [15]. OSCs were dissolved in the organic phase at the appropriate concentrations. Reaction mixtures were placed in the bubble column bioreactors as described above. The air flow was set at 4 L/h (approximately 0.7 vvm), and temperature at 30 °C. The selection of air flow was based on preliminary experiments, in order to ensure maximum oxygen availability and complete mixing among the two phases for the specific dimensions of the system (data not shown).
The standard biodesulfurization reaction conditions were as follows: total volume of the biphasic medium 100 mL, organic phase n-dodecane, organic fraction phase (OFP) (expressed as the organic phase to total volume percentage) 50% (v/v), 3 mM concentration of DBT and other OSCs in the organic phase, resting cells concentration of 10 g DCW/L in the aqueous phase, air flow of 4 L/h (approximately 0.7 vvm), and temperature of 30 °C.
Different parameters affecting the biodesulfurization capability of resting cells were consecutively studied—namely, OFP (50% to 90%, v/v), cell concentration (5 to 12.5 g DCW/L in the aqueous phase), the biocatalyst’s “age” (representing the growth phase of the microorganism), DBT concentration (1–4.3 mM, corresponding to 32–137.6 ppm of S in the organic phase), desulfurization of different OSCs—namely, 4-MDBT, 4,6-DMDBT, and 4,6-DEDBT—and desulfurization of mixtures of BDT and 4,6-DMDBT (total concentration of both compounds of 5 mM, corresponding to 160 ppm of S in the organic phase).
Samples were withdrawn at different time intervals and subjected to centrifugation (15,900× g for 15 min) in order to remove the cells. The organic phase was collected and the concentration of the OSCs was determined as described below. Each experimental condition was conducted in triplicate.

2.6. Analytical Methods

Biomass concentration was determined as optical density at 600 nm (OD600), and these values were converted to grams of dry cell weight per liter (g DCW/L) using the appropriate calibration curve. High-performance liquid chromatography (HPLC) was used to quantify DBT, 2-HBP, 4-MDBT, 4,6-DMDBT, and 4,6-DEDBT in the n-dodecane phase. The analysis was performed on an Agilent HPLC instrument, equipped with a C18 reversed-phase column (Nucleosil, 5 μm, 250 mm × 4.6 mm) and a UV detector. The mobile phase was acetonitrile:water (80:20) at a flow rate of 1.0 mL/min. Peaks were monitored at 260 nm.

2.7. Evaluation of Biodesulfurization Process

The desulfurization efficiency for DBT and other OSCs was expressed as follows [10]:
Y BDS ( % ) = ( C OSC , 0 C OSC , t C OSC , 0 ) · 100
where Y BDS (%) is the desulfurization efficiency, COSC,0 (mM) is the initial OSC concentration, and COSC,t (mM) is the concentration at time t.
The maximum percentage of desulfurization of the cells for the DBT reaction was calculated according to the following equation [17,31]:
X BDS ( % ) = C 2 HBP , max C DBT , 0 · 100
where X BDS ( % ) , is the maximum percentage of desulfurization, CDBT,0 is the initial concentration of DBT (mM), and C2−HBP,max (mM) is the maximum amount of 2-HBP produced.
The desulfurizing capability index (DDBT) has been used for evaluating the performance of biocatalysts in resting cell assays, with regard to DBT desulfurization yield, biomass concentration (Cx), and also the time (t) needed to reach a particular desulfurization rate, according to the following equation [18]:
D DBT ( % · g   DCW L · h ) = X BDS · C X t
where D DBT ( % · g   DCW L · h ) is the desulfurizing capability index, X BDS ( % ) is the maximum percentage of desulfurization, Cx (g DCW/L) is the biomass concentration, and t (h) is the time needed to reach the maximum percentage of desulfurization.
The specific desulfurization rate was expressed as the amount of OSCs (mmol) consumed per kilogram of dry cells (DCW) per hour (mmol OSC/kg DCW/h).

3. Results and Discussion

3.1. Effect of the Biocatalyst’s Age on DBT Biodesulfurization

The age of resting cells is an important parameter affecting the BDS process. R. erythropolis IGTS8 was grown in a 20 L bioreactor using dimethyl sulfoxide (DMSO) as a sulfur source and glycerol as a carbon source (as described in the Materials and Methods) in order to acquire the cells for the subsequent step of BDS with resting cells. DMSO has frequently been used as a sulfur source for the growth of biodesulfurizing microorganisms [9,10]. Especially for R. erythropolis IGTS8, DMSO has been reported as a sulfur substrate that does not repress the expression of desulfurization enzymes [1].
Figure 4 depicts the evolution of cell mass concentration during the growth of R. erythropolis ITGS8, as well as the cells’ desulfurization activity (CDA) at different growth phases. Cells exhibited maximum CDA at the beginning of the exponential phase (at 38 h of growth, when the activity was around 20 Units/mg DCW), and decreased as growth proceeded (Figure 4). As a result, growth of the bacterium was not able to reach the stationary phase.
The major reason for the variation in CDA is probably the variation in the expression of the Dsz enzymes involved in the 4S pathway with the age of the cells, e.g., the activities of different enzymes (Dsz A, Dsz B and Dsz C) in the cytoplasm reach their peaks at different stages of growth [32]. Calzada et al. [31], using Pseudomonas putida CECT 5279 (with the ability to desulfurize OSCs through the 4S pathway), reported that maximum in vivo activities of monooxygenase enzymes (DszA and DszC) were obtained during the late exponential growth phase, while the desulfinase enzyme DszB presented a maximum activity during the early exponential growth phase.
Cells harvested from four timepoints of growth (25, 38, 46, and 54 h) were used for the experiments in the two-phase system. The initial DBT concentration in the organic phase was set at 3 mM, cell mass concentration was set at 10 g DCW/L, and the OFP was set at 50% (v/v) in all cases. Figure 5 depicts the results of the experiment expressed as YBDS, XBDS, and DDBT, as well as specific BDT removal rate and 2-HBP production rate. The desulfurization performance of the resting cells in the two-phase system was almost proportional to CDA (Figure 5).
For the specific conditions applied, approximately 87% of DBT was removed by the cells at 36 h of age, while the corresponding value for 2-HPB production was found to be 67%. This non-stoichiometric relationship between the consumption of DBT and the production of 2-HBP was attributed to the accumulation of 2-HBP and other 4S pathway intermediates (up to a certain threshold) inside and on the surface of the cells. For instance, Alves et al. [33] reported that upon BDS by growing cells of Gordonia alkanivorans 1B, the maximum extracellular concentration of 2-HBP was ~120 μM, which was only 27% of the consumed DBT (450 μM). In a batch BDS of DBT, by the bacterial consortium AK6, approximately 90% DBT removal was recorded, but only 11% of the utilized DBT was recovered as 2-HBP [34].
In accordance with the above results, the desulfurizing capability index (DDBT = 29.5 % g/L·h), specific DBT removal rate (11 mmol/kg DCW/h), and specific 2-HBP production rate (8.6 mmol 2-HBP/kg DCW/h) exhibited their maximal values at the same biocatalyst age (36 h) (Figure 5). A decrease of approximately 20% in all parameters tested was observed when using cells of 54 h of age.
Differences in the desulfurization capabilities of resting cells of different ages have been reported. Guman et al. [14] reported that Sphingomonas subarctica T7b cells harvested in the middle of the log phase showed the highest desulfurization rate, while Kayser et al. [35] showed that the best desulfurization activity of Mycobacterium phlei GTIS10 was obtained from cells of mid-to-late log phase. Furthermore, Calzada et al. [31], in their study, combined P. putida CECT 5279 cells of different ages (i.e., cells from the early exponential growth phase with cells from the late exponential growth phase), used those cells in a BDS process, and reported a significant improvement in the DBT elimination rate. According to Li et al. [36], maintaining higher activities of DszC and DszB in the desulfurization system can effectively improve the desulfurization efficiency.

3.2. Effect of Phase Ratio on the Desulfurization of DBT

The phase ratio affects the bioavailability of OSCs at the interface between the aqueous and organic phases, and is therefore one of the main factors affecting the rate and extent of desulfurization [37,38]. In the present study, the organic fraction phase (OFP) (expressed as organic solvent volume percentage) ranged from 50 to 90% (v/v). The concentration of the cells in the aqueous phase at 50% (v/v) OFP was 10 g DCW/L, and was adjusted for the higher OFPs in order to maintain the same amount of biomass under all conditions. Almost complete desulfurization of 3 mM DBT (YBDS = 94%) in the organic phase was achieved at 50% v/v of OFP, while at 90% (v/v) the corresponding value was found to be 47%. It is obvious from Figure 6 that increasing OFP resulted in an almost linear decrease in both desulfurization efficiency (YBDS, %) and DBT removal rate. The maximum specific DBT removal rate (13.2 mmol DBT/kg DCW/h) was achieved at an OFP of 60% (v/v). Increasing the OFP up to 80% (v/v) did not affect the specific rate. A decline of approximately 18% was found at the highest OFP (Figure 6).
The water/oil volume ratio is among the most important technical bottlenecks in an industrial setting; the higher the organic phase concentration, the lower the costs associated with the subsequent separation of the aqueous phase from the desired product, along with water handling and disposal [1,39].
In a biphasic system with resting cells, interphase mass transfer is a major limiting factor influencing the efficiency of biodesulfurization. Many authors have reported a reduction in biodesulfurization yield with an increase in OFP, and this could be attributed to the reduction in the interfacial area at high OFPs [39]. In addition, this reduction could hinder the exploitation of the total amount of biomass in the aqueous phase, since some cells are not able to be in contact with the organic phase due to the saturation of the interface area. Furthermore, at high OFPs, mass transfer limitation of O2 might also occur due to the high concentration of cells suspended in the aqueous phase [8,40]. A similar pattern of decrease in BDS efficiency at high OFPs has been reported in processes using resting cells of Rhodococcus sp. P32C1 [7], Staphylococcus sp. [8], Pseudomonas delafieldii R-8 [9], Pseudomonas putida CECT5279 [11], Bacillus cereus HN [12], Sphingomonas subarctica T7b [14], Gordonia sp. JDZX13 [16], and Paenibacillus glucanolyticus HN4 [41].
It should be noted though that in the above studies OFPs lower than 50% (v/v) were also studied, in several cases the optimal OFP was determined in the range of 10% (v/v) to approximately 25% (v/v) [9,11,12,14,16].
On the other hand, Maghsoudi et al. [7], during BDS with resting cells of Rhodococcus sp. P32C1, reported that at an initial DBT concentration of 1 mM, the specific production rate of 2-HBP as well as DBT desulfurization was higher at an OFP of 75% (v/v). R. erythropolis ATCC 4277 resting cells exhibited the highest specific DBT degradation rate at an OFP of 80 % (v/v) [15], while maximum desulfurization rate by Staphylococcus sp. resting cells was observed at an OFP of 66% (v/v) [8]. Finally, Nassar et al. [41], using Paenibacillus glucanolyticus HN4—a facultative anaerobe—reported that maximum desulfurization efficiency (0.05% wt, DBT in model oil) was achieved at an OFP of 50% (v/v).

3.3. Effect of Cell Concentration on DBT Desulfurization at Constant OFP

In order to further clarify the effect of cell density in the aqueous phase, the concentration of the cells in the aqueous phase was adjusted from 5 to 12.5 g DCW/L at a constant OFP of 50% (v/v). The initial DBT concentration in the n-dodecane phase was set at 3 mM.
As expected, increasing the cell mass concentration at constant OFP had a positive effect on YBDS as well as on DBT removal rate. Almost-complete desulfurization of DBT in the organic phase was observed at the highest cell concentration used (12.5 g DCW/L). The specific DBT degradation rate, however, showed a maximum at 7.5 g DCW/L (14 mmol/kg DCW/h), and decreased with further increase in cell concentration (Figure 7).
At the highest cell concentration (12.5 g DCW/L), the specific desulfurization rate was almost 10 mmol/kg DCW/L. These results indicate that for the specific desulfurization setup, mass transfer limitations became significant from a cell concentration as low as 7.5 g DCW/L.
Several researchers have studied the effect of initial resting cell concentration on the biodesulfurization of DBT in biphasic systems, using cell mass concentrations up to 120 g DCW/L. A comparison study was performed by Caro et al. [11] using R. erythropolis IGTS8 and P. putida CECT 5279 cells in a BDS process of a model oil (DBT/n-hexadecane, OFP 50%, v/v), using cell concentrations in the range of 2–32 g DCW/L. The conversion yield with P. putida CECT 5279 progressively increased, reaching 41.4% at 24 g DCW/L, and then became stable, while R. erythropolis IGTS8 exhibited a maximum conversion yield of 80% at 8 g DCW/L. Maghsoudi et al. [7] studied the effect of the initial biomass concentration (20–120 g DCW/L) of the Rhodococcus sp. strain P32C1 at an OFP of 50% (v/v), and reported that the maximum conversion of DBT to 2-HBP (26%) was observed at the highest cell density applied. The effect of the initial biomass concentration (20–80 g DCW/L) of P. delafieldii R-8 resting cells in a biphasic system (DBT/n-dodecane, OFP 50%, v/v) was studied by Luo et al. [9], and the results showed that the DBT desulfurization rate was decreased with increasing cell concentration. A similar trend was reported by Gunam et al. [14] during the biodesulfurization of DBT by resting cells of S. subarctica T7b, as well as by Arabian et al. [12], using cells of B. cereus HN.
This behavior at high cell concentrations could be attributed to the fact that not all cells can contact well with the organic phase to react with DBT [40]. Furthermore, one problem associated with the use of high initial biomass concentrations is the difficulty in separation after the BDS process [21]. The existence of an optimal value for biocatalyst loading is obvious from the above studies, but seems to be related to the experimental conditions applied (microorganism, OFP, mixing and aeration conditions, etc.).

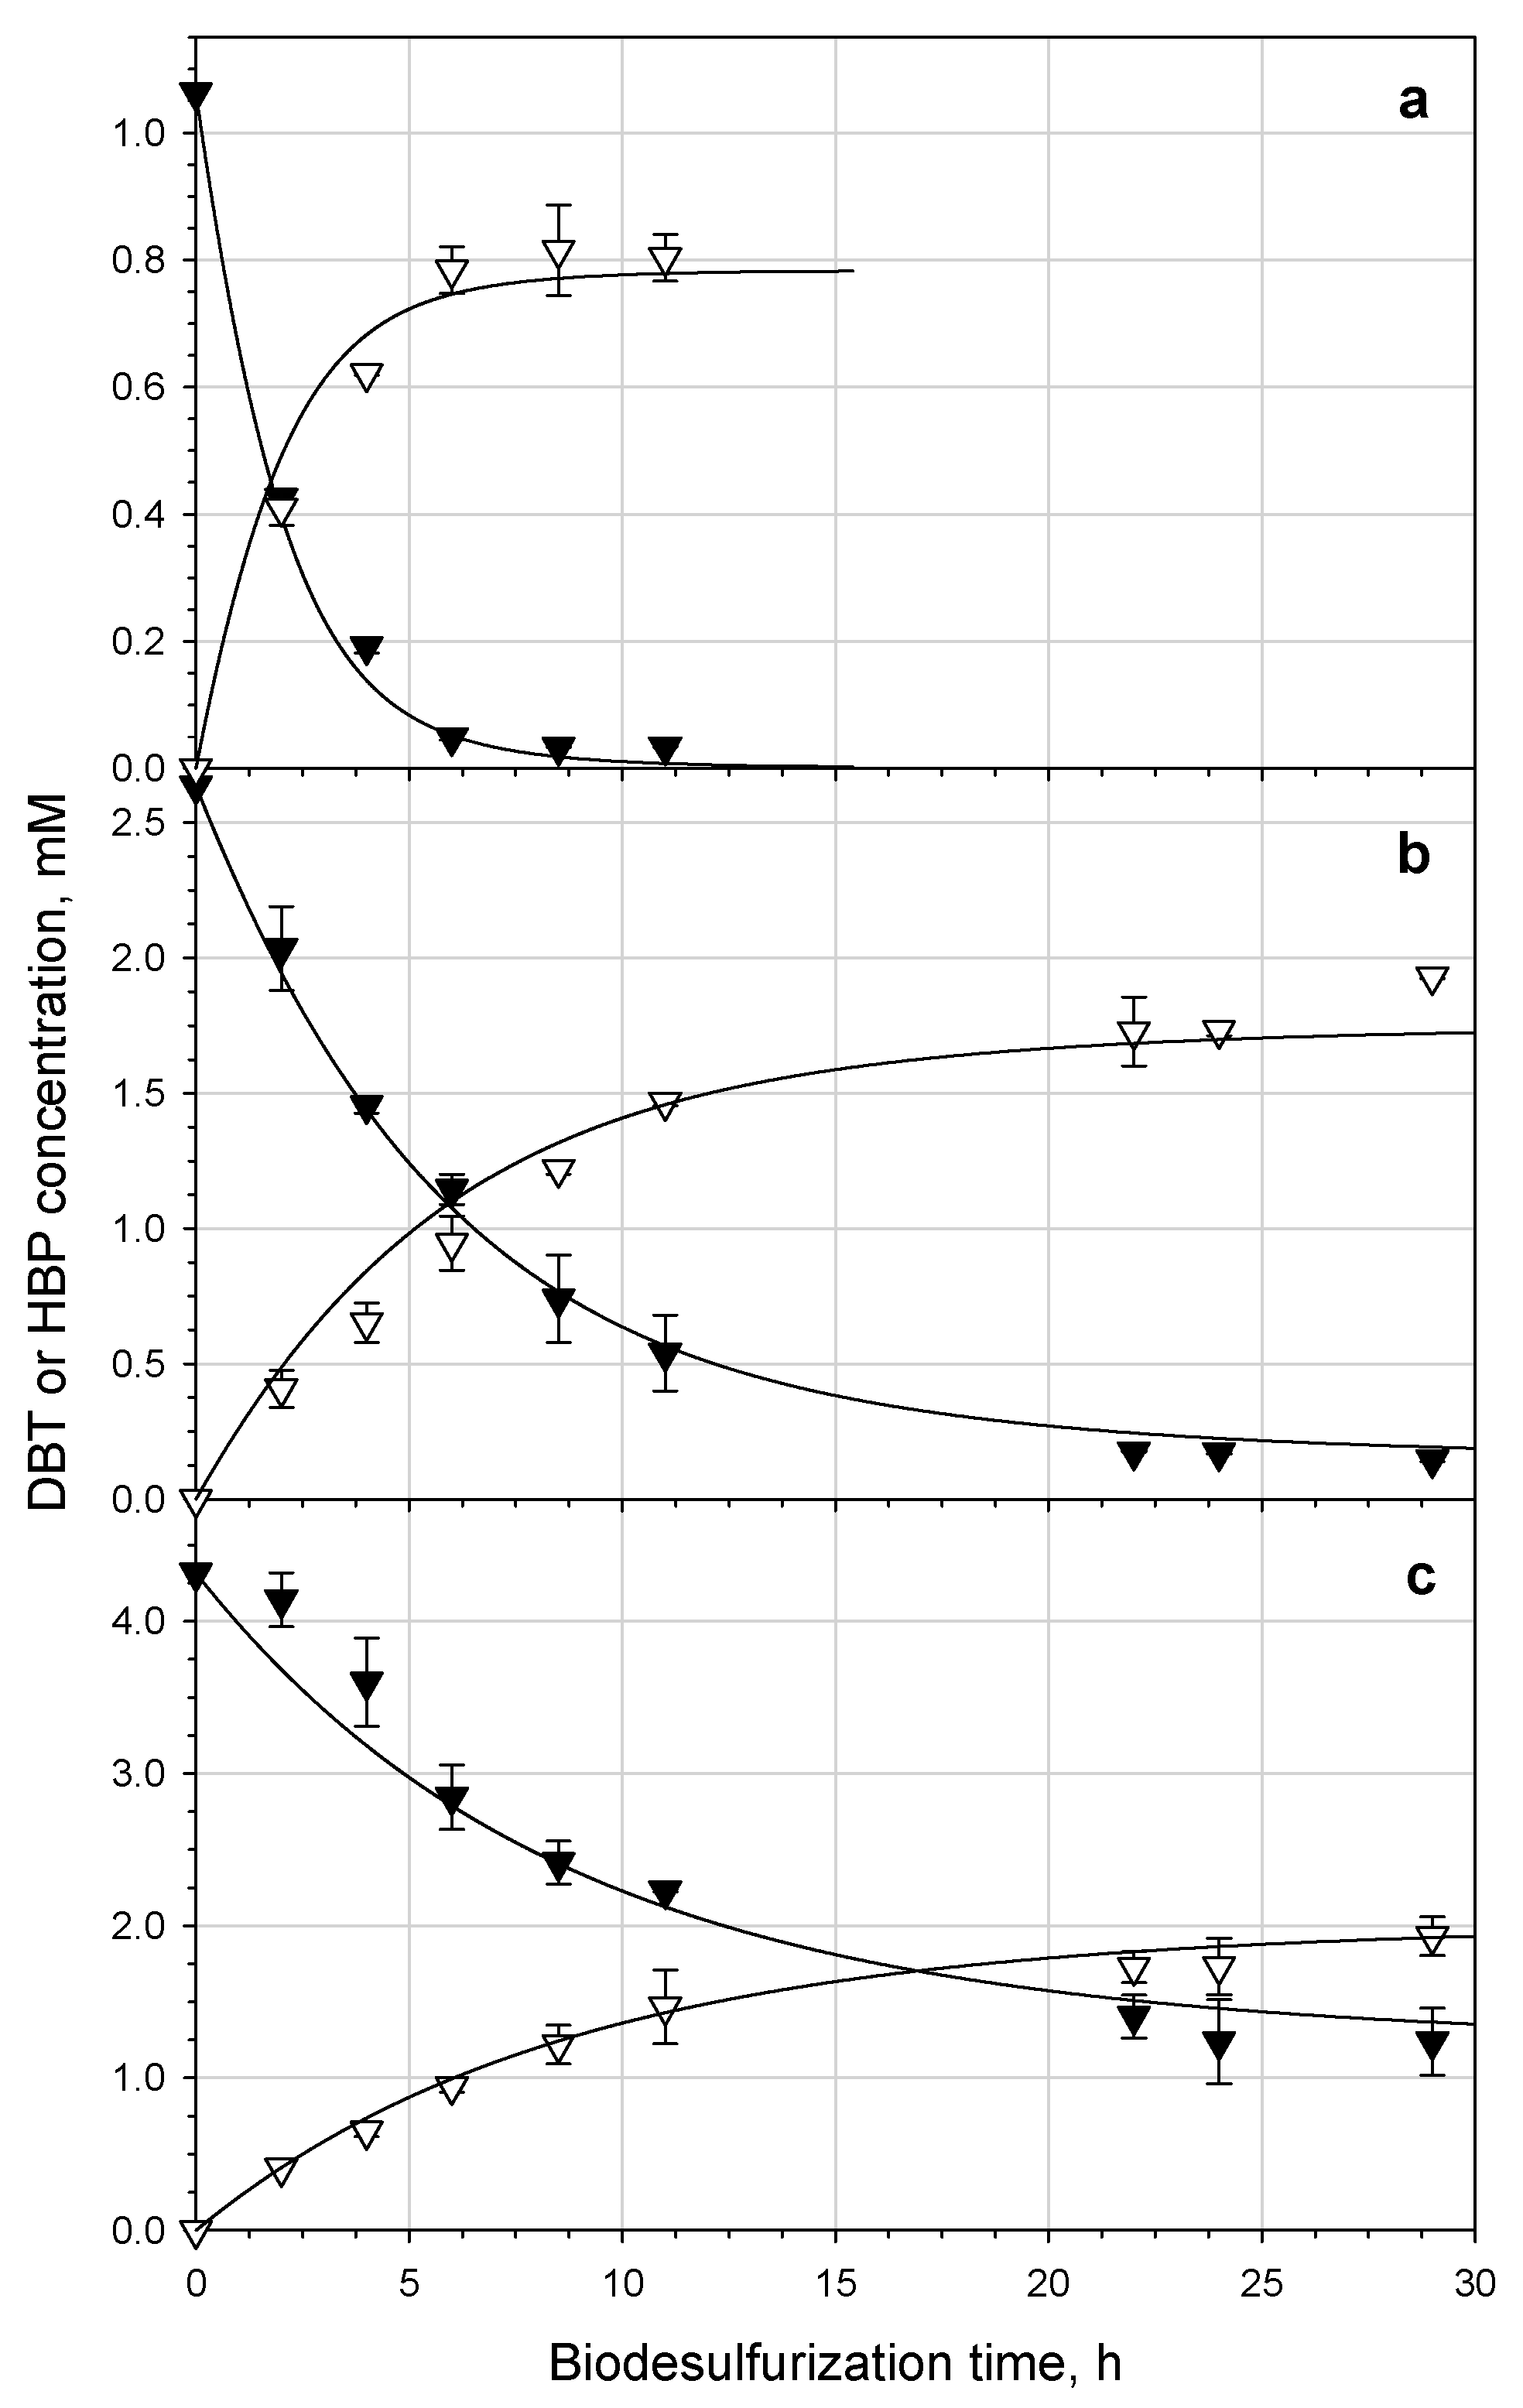
3.4. Effect of DBT Concentration

The effect of DBT concentration in the biphasic system was investigated for three different initial DBT concentrations—namely, 1.1, 2.6, and 4.3 mM (35, 83, and 138 ppm of S, respectively). The initial cell concentration in the aqueous phase was 10 g DCW/L, while the OFP was set at 50% (v/v).
At 1.1 mM and 2.6 mM DBT, almost-complete desulfurization was achieved (YBDS, 1mM = 96.7% and YBDS, 2.6mM = 94%), while at the highest concentration (4.3 mM), approximately 76% of DBT was desulfurized (Figure 8).
Khosravinia et al. [42] reported that the biodesulfurization efficiency of Rhodococcus FUM94 resting cells decreased from 71.9% to 57.0% when DBT concentration changed from 0.13 to 0.54 mM, respectively. The specific DBT removal rate exhibited its highest value of 8.3 mm DBT/kg DCW/h at 1 mM initial DBT concentration, and remained almost constant after that. The 2-HBP specific production rate follows the same trend, with the maximum value of 6.8 mmol 2-HBP/kg DCW/h at the lowest initial DBT concentration.
In addition, as can be seen in Figure 8, lower XBDS percentages were observed with increasing DBT concentration. The desulfurizing capability index (DDBT) started with a high value (81.9% g DCW/L/h) at 1 mM initial DBT concentration, and decreased dramatically as the concentration of DBT increased, with values between 18.0 and 7.6% g DCW/L/h.
Figure 9 shows the time course of biodesulfurization for the three initial DBT concentrations in detail. In the specific biphasic system used, at 1.1 mM DBT, biodesulfurization was almost complete over a 6 h reaction time; at higher initial DBT concentrations, the time required to reach equilibrium increased with the increase in the amount of unreacted DBT.
In an effort to semi-empirically model DBT biodesulfurization rates at different initial DBT concentrations in the organic phase, the DBT consumption data were fitted to the following first-order differential equation:
d [ DBT ] dt = A · [ DBT ] K + [ DBT ]
Equation (4) implies that the controlling step of the phenomenon is the enzymatic biotransformation of DBT—an assumption that is considered valid for an OFP of 50%. As a result, Equation (4) is a Michaelis–Menten equation representing the cumulative effect of the four enzymatic reactions in the 4S pathway that take place inside the biocatalyst. Thus, K corresponds to an apparent KM, while A is a lump constant representing the available desulfurizing activity as well as the underlying mass transfer phenomena.
In order to evaluate the remaining CDA during the BDS process, a small portion of the aqueous phase was removed at each timepoint. Cells were collected, washed, and subjected to the regular desulfurization assay (see Materials and Methods). As shown in Figure 10, CDA in the biphasic system drops quite significantly, and is practically independent of the initial DBT concentration.
A first-order decay model was successfully fitted to the results, yielding a mean deactivation constant of kd = 0.0992 ± 0.009 h−1. Similarly to the results of the present study, Schilling et al. [43] reported that the desulfurization activity of R. erythropolis IGTS8 cell suspension (66 g DCW/L) mixed with n-hexadecane (at OFP 50% v/v) containing 19 mM DBT was found to follow first-order decay, with a deactivation constant of 0.072 h−1. Reduction in biocatalyst activity could be attributed to the inhibition of DszA, DszB, and DszC enzymes by the 2-HBP accumulated in the cytoplasm during the BDS process [44].
Following the above analysis, Equation (4) was modified as follows to include the effect of biocatalyst deactivation:
d [ DBT ] dt = a · e k d · t · [ DBT ] K + [ DBT ]
where a is a lump constant that encompasses both Michaelis–Menten kinetics as well as the transport phenomena that take place within the biphasic system for DBT.
Equation (5) was integrated with the initial condition [DBT] = [DBT]0 at t = 0, yielding:
K · ln ( [ DBT ] [ DBT ] 0 ) + ( [ DBT ] [ DBT ] 0 ) = a k d · ( e k d · t 1 )
Following the above analysis, 2-HBP accumulation in the organic phase can be described via the following equation:
d [ HBP ] dt = b · [ DBT ] dt   integrated   to     [ HBP ] =   b · ( [ DBT ] 0 [ DBT ] )
where b represents the possible mass transfer limitations for 2-HBP from the aqueous phase to the organic phase.
The experimental data for DBT consumption and 2-HBP accumulation in the organic phase were fitted simultaneously for the three initial DBT concentrations to Equations (6) and (7), using the global nonlinear regression routine available in SigmaPlot (Ver. 12). Constant K, representing the 4S pathway enzyme kinetics, was kept constant for all initial DBT concentrations, while for kd we used the predetermined value above. The results are presented in Table 1.
The proposed model fits the experimental data very well (overall R2 = 0.992). Overall biodesulfurization kinetics are negatively affected by the increase in initial DBT concentration, as verified by the gradual decrease in the values of the lump constant a (Table 1). Since enzyme deactivation is already included in the proposed model, the observed reduction in desulfurization rates at increasing initial DBT concentrations probably reflects mass transfer limitations. All determined values of b are less than 1.0, indicating the non-stoichiometric relationship between the consumption of DBT and the production of 2-HBP. Mass transfer limitations for the accumulation of 2-HBP in the organic phase also increase with DBT concentration (b values decrease).

3.5. Biodesulfurization of Different OSCs

The susceptibility of sulfur compounds to HDS takes the following order: thiophene (TH) > alkylated TH > benzothiophene (BT) > alkylated BT > dibenzothiophene (DBT) and alkylated DBT without substituents at the 4 and 6 positions > alkylated DBT with alkyl substituents at the 4 and 6 positions [1,5]. Therefore, BDS in biphasic media of DBT, as well as of other OSCs with different degrees of alkylation, was studied. The initial concentration of all compounds in the organic phase was set at 3 mM; the OFP was 50% (v/v), and the biomass concentration in the aqueous phase was 10.0 g DCW/L.
The bacterial cells desulfurized the monomethyl, dimethyl, and diethyl dibenzothiophenes examined, and the desulfurization efficiencies (YBDS, %) decreased in inverse proportion to the increase in the carbon number of the alkyl substituent groups (Table 2). More specifically, DBT (the OSC with no substituent groups) was almost completely desulfurized within 24 h of reaction (Figure 9b), while its mono-methylated form (4-MDBT) exhibited lower desulfurization efficiency (72.2%) (Table 2). Increasing the number of methyl groups in the DBT molecules (4,6-DMDBT) resulted in a further decrease in desulfurization efficiency. Finally, changing the form of substituent groups from methyl to ethyl form (4,6-DEDBT) resulted in a drastic decrease in the desulfurization efficiency, which was found to be four times lower compared to DBT. The highest specific desulfurization rate was recorded with 4-MDBT, followed by 4,6-DMDBT, while the rate for 4,6-DEDBT was the lowest (Table 2).
Thus, the desulfurization activity of R. erythropolis IGTS8 resting cells follows the order DBT > 4-MDBT > 4,6-DMDBT > 4,6-DEDBT. The observed decrease in the biodesulfurization activity when increasing the size and/or hydrophobicity of the molecules could be attributed to the combined effects of reduced specificity of the biodesulfurization enzymes, along with the increased mass transfer limitations from the organic phase to the aqueous phase.
Similar to the results of the present study, Kobayashi et al. [45] and Boltes et al. [13], using R. erythropolis KA2-5-1 and P. putida CECT5279 cells as biocatalysts, respectively, showed that DBT could be desulfurized at higher rates compared to 4-MDBT and 4,6-DMDBT. In addition, the resting cells of S. subarctica T7b were able to desulfurize alkyl-DBTs with long alkyl chains, although the desulfurization rate decreased with an increase in the total carbon number of the alkylated DBTs [14].
The time-course data for the different OSCs were fitted to Equation (6), independently for each sulfur compound. Since each sulfur substrate has its own kinetic behavior in the 4S pathway, Equation (6) was fitted to both K and a. Enzyme deactivation was considered to be unaffected by OSC type, and as a result the already-determined kd value was used. In this case also, the proposed model adequately described the phenomenon (overall R2 = 0.988) (Figure 11). The corresponding model constants are given in Table 3.
The most obvious effect of OSC type on the kinetics of the biphasic biodesulfurization system is expressed through the apparent KM constant, K. Statistically identical K values were determined for both 4-MDBT and 4,6-DMDBT—almost 7.5 times higher than the corresponding K value for DBT, highlighting the lower affinity of the methylated substrates for the 4S-pathway enzymes. A K value an order of magnitude higher was determined for the ethylated 4,6-DEDBT, resulting in a very low desulfurization performance for this substrate.

3.6. Multisubstrate Biodesulfurization

Figure 12 depicts the time course of DBT and 4,6-DMDBT desulfurization, as well as that of their mixtures. In the single-compound desulfurization conditions, initial concentrations were set at 5 mM for DBT or 4,6-DMDBT (Figure 12a). Three additional mixtures were also examined, i.e., 3.5 mM DBT and 1.5 mM 4,6-DMDBT (Figure 12b), 2.5 mM DBT and 2.5 mM 4,6-DMDBT (Figure 12c), and 1.5 mM DBT and 3.5 mM 4,6-DMDBT (Figure 12d); the OFP was set at 50% (v/v), and the biomass concentration in the aqueous phase at 10.0 g DCW/L. In the first 6 h of the reaction, the desulfurization efficiency (YBDS) of DBT in the mixture system ranged from 40 to 50%, depending on its initial concentration in the mixture, while the corresponding values for 4,6-DMDBT were in the range of 17–21%, reflecting the specificity preference already demonstrated in the previous paragraph.
At the end of the experiment, the desulfurization efficiency (YBDS) of DBT in the mixture system ranged from 72 to 80%, depending on the concentrations of the DBT and 4,6-DMDBT in the mixture, while the desulfurization efficiency of 4,6-DMDBT was found to be around 50% in all cases (Table 4). Overall desulfurization efficiency in binary mixtures was almost constant.
In the single systems, the specific desulfurization rate of 4,6-DMDBT was found to be similar to that of DBT (Table 4). The specific desulfurization rate of DBT, when mixed with 4,6-DMDBT, was reduced as the concentration of 4,6-DMDBT in the mixture increased; a similar pattern could be observed for 4,6-DMDBT. More specifically, the DBT desulfurization rate decreased from 9.31 to 3.66 mmol DBT/kg DCW/h in the presence of increasing concentrations of 4,6-DMDBT (Table 4). Similarly, the 4,6-DMDBT desulfurization rate increased in the binary mixture as the concentration of DBT in the mixture decreased, reaching its maximum value of 11.0 mmol 4,6-DMDBT/kg DCW/h in the individual substrate condition. There was almost no difference in the overall desulfurization rates between binary and individual systems. Resting cells of R. erythropolis IGTS8 could desulfurize mixtures of DBT and 4,6-DMDBT with overall concentrations of 5 mM at the same overall rate, regardless of the concentration of each compound in the mixture.
Mingfang et al. [46] also reported that desulfurization of a mixture containing DBT and 4,6-DMDBT in n-dodecane by Nocardia globerula R-9 cells proceeded simultaneously, without preference for either compound, and that the desulfurization rate for each compound was decreased in binary systems. In contrast, according to Chen et al. [47], the BDS rates of DBT and 4,6-DMDBT in the mixture were lower than when they were desulfurized separately by Mycobacterium sp. ZD-19.

4. Conclusions

A system of bubble column bioreactors was evaluated for the first time as a prototype for biodesulfurization experiments. Bubble column bioreactors are simple to construct and operate, exhibit excellent heat and mass transfer characteristics, and could be an alternative to stirred-tank reactors for use in biodesulfurization processes, where the availability of oxygen is a key parameter. Each bioreactor consisted of an aqueous phase that contained the resting cells of R. erythropolis IGTS8, and an organic phase (n-dodecane) where the different organosulfur compounds were dissolved. Using this system, factors such as the age and concentration of the biocatalyst, OFP, and the type and concentration of organosulfur substrates were investigated. Cells’ age proved to be an important parameter affecting the BDS process, due to the fact that the expression of the Dsz enzymes involved in the 4S pathway varies with the culture phase (i.e., early-, mid-, and late-exponential, etc.). The use of a high cell concentration or high OFP has a detrimental effect on biodesulfurization efficiency, since saturation of the interface area hinders exploitation of the total amount of biomass in the aqueous phase. The bacterial cells were able to desulfurize the monomethyl, dimethyl, and diethyl dibenzothiophenes, with the desulfurization efficiency decreasing in proportion to the carbon number of the alkyl substituent groups. Notably, the desulfurization of dibenzothiophene and 4,6-dimethyldibenzothiophene mixtures proceeded with the same overall rate, regardless of the concentration of each compound in the mixture. This result should be considered important from an application point of view, since both compounds are simultaneously present in HDS-occurring oil fractions. Finally, a new semi-empirical kinetic model was developed to describe the BDS kinetics in the biphasic system. The model was based on the overall Michaelis–Menten kinetics, taking into consideration the deactivation of the biocatalyst over time, as well as the underlying mass transfer phenomena. The results from fitting the experimental data to the model showed that BDS kinetics are negatively affected by the increase in initial DBT concentration—mainly due to mass transfer limitations. Furthermore, the proposed model adequately described BDS of different types of organosulfur compounds, highlighting the lower affinity of the methylated and ethylated substrates for the 4S-pathway enzymes.

Author Contributions

Conceptualization, D.M., D.G.H., N.P. and D.K.; methodology, D.M. and D.G.H.; validation, S.S., C.T. and S.K.; formal analysis, S.S. and C.T.; investigation, G.P., K.D., P.G., S.S., C.T. and S.K.; resources, N.P. and D.K.; data curation, K.V.; writing—original draft preparation, D.M.; writing—review and editing, D.M., D.G.H. and K.V.; supervision, D.M., D.G.H., N.P. and D.K. All authors have read and agreed to the published version of the manuscript.

Funding

This work was co-financed by the European Regional Development Fund of the European Union, and Greek national funds through the Operational Program “Competitiveness, Entrepreneurship, and Innovation”, under the call RESEARCH-CREATE-INNOVATE (grant number: Τ1ΕΔΚ-02074, MIS 5030227). K.V. was supported by the European Union and Greek National Funds (European Social Fund) through the Operational Program “Human Resources Development, Education, and Lifelong Learning”, in the framework of the Act “SUPPORT OF POSTGRADUATE RESEARCHERS—B cycle” (MIS 5033021) implemented by the Foundation State Scholarships (IKY).

Institutional Review Board Statement

Not applicable.

Informed Consent Statement

Not applicable.

Data Availability Statement

Not applicable.

Conflicts of Interest

The authors declare no conflict of interest.

References

  1. Mohabeli, G.; Ball, A.S. Biodesulfurization of diesel fuels: Past, present and future perspectives. Int. Biodeter. Biodegr. 2016, 110, 163–180. [Google Scholar] [CrossRef]
  2. Directive 2012/33/EU of the European Parliament and of the Council (12 November 2012). Available online: https://eur-lex.europa.eu/legal-content/EN/TXT/PDF/?uri=CELEX:32012L0033&from=EN (accessed on 26 September 2021).
  3. Hossain, M.N.; Park, H.C.; Choi, H.S. A comprehensive review on catalytic oxidative desulfurization of liquid fuel oil. Catalysts 2019, 9, 229. [Google Scholar] [CrossRef] [Green Version]
  4. Sadare, O.O.; Obazu, F.; Daramola, M.O. Biodesulfurization of petroleum distillates-Current status, opportunities and future challenges. Environments 2017, 4, 85. [Google Scholar] [CrossRef] [Green Version]
  5. Babich, I.V.; Moulijn, J.A. Science and technology of novel processes for deep desulfurization of oil refinery streams: A review. Fuel 2003, 82, 607–631. [Google Scholar] [CrossRef]
  6. Kilbane, J.J.; Stark, B. Biodesulfurization: A model system for microbial physiology research. World J. Microbiol. Biotechnol. 2016, 32, 137. [Google Scholar] [CrossRef]
  7. Maghsoudi, S.; Vossoughi, M.; Kheirolomoomc, A.; Tanaka, E.; Katoh, S. Biodesulfurization of hydrocarbons and diesel fuels by Rhodococcus sp. strain P32C1. Biochem. Eng. J. 2001, 8, 151–156. [Google Scholar] [CrossRef]
  8. Goindi, H.K.; Saini, V.S.; Verma, P.S.; Adhikari, D.K. Dibenzothiophene desulfurization in hydrocarbon environment by Staphylococcus sp. resting cells. Biotechnol. Lett. 2002, 24, 779–781. [Google Scholar] [CrossRef]
  9. Luo, M.F.; Xing, J.M.; Gou, Z.X.; Li, S.; Liu, H.Z.; Chen, J.Y. Desulfurization of dibenzothiophene by lyophilized cells of Pseudomonas delafieldii R-8 in the presence of dodecane. Biochem. Eng. J. 2003, 13, 1–6. [Google Scholar] [CrossRef]
  10. Del Olmo, C.H.; Alcon, A.; Santos, V.E.; Garcia-Ochoa, F. Modeling the production of a Rhodococcus erythropolis IGTS8 biocatalyst for DBT biodesulfurization: Influence of media composition. Enzym. Microb. Technol. 2005, 37, 157–166. [Google Scholar] [CrossRef]
  11. Caro, A.; Boltes, K.; Letón, P.; García-Calvo, E. Dibenzothiophene biodesulfurization in resting cell conditions by aerobic bacteria. Biochem. Eng. J. 2007, 35, 191–197. [Google Scholar] [CrossRef]
  12. Arabian, D.; Najafi, H.; Farhadi, F.; Dehkordi, A.M. Biodesulfurization of simulated light fuel oil by a native isolated bacteria Bacillus cereus HN. J. Pet. Sci. Technol. 2014, 4, 31–40. [Google Scholar] [CrossRef]
  13. Boltes, K.; del Aguila, R.A.; García-Calvo, E. Effect of mass transfer on biodesulfurization kinetics of alkylated forms of dibenzothiophene by Pseudomonas putida CECT5279. J. Chem. Technol. Biotechnol. 2013, 88, 422–431. [Google Scholar] [CrossRef]
  14. Gunam, I.B.W.; Yamamura, K.; Sujaya, I.N.; Antara, N.S.; Aryanta, W.R.; Tanaka, M.; Tomita, F.; Sone, T.; Asano, K. Biodesulfurization of dibenzothiophene and its derivatives using resting and immobilized cells of Sphingomonas subarctica T7b. J. Microbiol. Biotechnol. 2013, 23, 473–482. [Google Scholar] [CrossRef] [PubMed] [Green Version]
  15. Maass, D.; de Oliveira, D.; de Souza, A.A.U.; Souza, S.M.A.G.U. Biodesulfurization of a system containing synthetic fuel using Rhodococcus erythropolis ATCC 4277. Appl. Biochem. Biotechnol. 2014, 174, 2079–2085. [Google Scholar] [CrossRef] [PubMed]
  16. Feng, S.; Yang, H.; Zhan, X.; Wang, W. Enhancement of dibenzothiophene biodesulfurization by weakening the feedback inhibition effects based on a systematic understanding of the biodesulfurization mechanism by Gordonia sp. through the potential “4S” pathway. RSC Adv. 2016, 6, 82872–82881. [Google Scholar] [CrossRef]
  17. Dejaloud, A.; Vahabzadeh, F.; Habibi, A. Ralstonia eutropha as a biocatalyst for desulfurization of dibenzothiophene. Bioprocess Biosyst. Eng. 2017, 40, 969–980. [Google Scholar] [CrossRef] [PubMed]
  18. Dejaloud, A.; Habibi, A.; Vahabzadeh, F. DBT desulfurization by Rhodococcus erythropolis PTCC 1767 in aqueous and biphasic systems. Chem. Pap. 2020, 74, 3605–3615. [Google Scholar] [CrossRef]
  19. Akhtar, N.; Akhtar, K.; Ghauri, M.A. Biodesulfurization of thiophenic compounds by a 2-hydroxybiphenyl-resistant Gordonia sp. HS126-4N carrying dszABC Genes. Curr. Microbiol. 2018, 75, 597–603. [Google Scholar] [CrossRef]
  20. Jatoi, A.S.; Aziz, S.; Soomro, S.A. Experimental and numerical investigation of DBT degradation via Rhodococcus spp. (SL-9) through the use of biological assisted method. Biomass Convers. Biorefinery 2021. [Google Scholar] [CrossRef]
  21. Martínez, I.; El-Said Mohamed, M.; Santos, V.E.; García, J.L.; García-Ochoa, F.; Díaz, E. Metabolic and process engineering for biodesulfurization in Gram-negative bacteria. J. Biotechnol. 2017, 262, 47–55. [Google Scholar] [CrossRef]
  22. Escobar, S.; Rodriguez, A.; Gomez, E.; Alcon, A.; Santos, V.E.; Garcia-Ochoa, F. Influence of oxygen transfer on Pseudomonas putida effects on growth rate and biodesulfurization capacity. Bioprocess Biosyst. Eng. 2016, 39, 545–554. [Google Scholar] [CrossRef] [PubMed]
  23. Gomez, E.; Alcón, A.; Escobar, S.; Santos, V.E.; Garcia-Ochoa, F. Effect of fluid dynamic conditions on growth rate and biodesulfurization capacity of Rhodococcus erythropolis IGTS8. Biochem. Eng. J. 2015, 99, 138–146. [Google Scholar] [CrossRef]
  24. Zhang, S.H.; Chen, H.; Li, W. Kinetic analysis of biodesulfurization of model oil containing multiple alkyl dibenzothiophenes. Appl. Microbiol. Biotechnol. 2013, 97, 2193–2200. [Google Scholar] [CrossRef]
  25. Martínez, I.; Santos, V.E.; Gómez, E.; García-Ochoa, F. Biodesulfurization of dibenzothiophene by resting cells of Pseudomonas putida CECT5279: Influence of the oxygen transfer rate in the scale-up from shaken flask to stirred tank reactor. J. Chem. Technol. Biotechnol. 2016, 91, 184–189. [Google Scholar] [CrossRef]
  26. Boltes, K.; Caro, A.; Leton, P.; Rodriguez, A.; Garcia-Calvo, E. Gas–liquid mass transfer in oil–water emulsions with an airlift bio-reactor. Chem. Eng. Process 2008, 47, 2408–2412. [Google Scholar] [CrossRef]
  27. Zhou, Y.; Han, L.-R.; He, H.-W.; Sang, B.; Yu, D.-L.; Feng, J.-T.; Zhang, X. Effects of agitation, aeration and temperature on production of a novel glycoprotein GP-1 by Streptomyces kanasenisi ZX01 and scale-up based on volumetric oxygen transfer coefficient. Molecules 2018, 23, 125. [Google Scholar] [CrossRef] [Green Version]
  28. Youssef, A.A.; Al-Dahhan, M.H.; Dudukovic, M.P. Bubble columns with internals: A review. Int. J. Chem. React. Eng. 2013, 11, 169–223. [Google Scholar] [CrossRef]
  29. Stanbury, P.F.; Whitaker, A.; Hall, S.J. Chapter 9—Aeration and agitation. In Principles of Fermentation Technology, 3rd ed.; Stanbury, P.F., Whitaker, A., Hall, S.J., Eds.; Butterworth-Heinemann: Oxford, UK, 2017; pp. 537–618. [Google Scholar] [CrossRef]
  30. Humbird, D.; Davis, R.; McMillan, J.D. Aeration costs in stirred-tank and bubble column bioreactors. Biochem. Eng. J. 2017, 127, 161–166. [Google Scholar] [CrossRef]
  31. Calzada, J.; Alcón, A.; Santos, V.E.; Garcia-Ochoa, F. Mixtures of Pseudomonas putida CECT 5279 cells of different ages: Optimization as biodesulfurization catalyst. Process Biochem. 2011, 46, 1323–1328. [Google Scholar] [CrossRef]
  32. Calzada, J.; Zamarro, M.T.; Alcón, A.; Santos, V.E.; Díaz, E.; García, J.L.; Garcia-Ochoa, F. Analysis of dibenzothiophene desulfurization in a recombinant Pseudomonas putida strain. Appl. Environ. Microbiol. 2009, 75, 875–877. [Google Scholar] [CrossRef] [Green Version]
  33. Alves, L.; Salgueiro, R.; Rodrigues, C.; Mesquita, E.; Matos, J.; Gírio, F.M. Desulfurization of dibenzothiophene, benzothiophene, and other thiophene analogs by a newly isolated bacterium, Gordonia alkanivorans strain 1B. Appl. Biochem. Biotechnol. 2005, 120, 199–208. [Google Scholar] [CrossRef]
  34. Ismail, W.; El-Sayed, W.S.; Abdul Raheem, A.S.; Mohamed, M.E.; El Nayal, A.M. Biocatalytic desulfurization capabilities of a mixed culture during non-destructive utilization of recalcitrant organosulfur compounds. Front. Microbiol. 2016, 7, 266. [Google Scholar] [CrossRef] [PubMed] [Green Version]
  35. Kayser, K.J.; Cleveland, L.; Park, H.S.; Kwak, J.H.; Kolhatkar, A.; Kilbane, J.J., II. Isolation and characterization of a moderate thermophile, Mycobacterium phlei GTIS10, capable of dibenzothiophene desulfurization. Appl. Microbiol. Biotechnol. 2002, 59, 737–745. [Google Scholar] [CrossRef]
  36. Li, L.; Ye, L.; Guo, Z.; Zhang, W.; Liao, X.; Lin, Y.; Liang, S. A kinetic model to optimize and direct the dose ratio of Dsz enzymes in the 4S desulfurization pathway in vitro and in vivo. Biotechnol. Lett. 2019, 41, 1333–1341. [Google Scholar] [CrossRef] [PubMed]
  37. Mohamed, M.E.; Al-Yacoub, Z.H.; Vedakumar, J.V. Biocatalytic desulfurization of thiophenic compounds and crude oil by newly isolated bacteria. Front. Microbiol. 2015, 6, 112. [Google Scholar] [CrossRef] [Green Version]
  38. Adlakha, J.; Singh, P.; Ram, S.K.; Kumar, M.; Singh, M.P.; Singh, D.; Sahai, V.; Srivastava, P. Optimization of conditions for deep desulfurization of heavy crude oil and hydrodesulfurized diesel by Gordonia sp. IITR100. Fuel 2016, 184, 761–769. [Google Scholar] [CrossRef]
  39. Malani, R.S.; Batghare, A.H.; Bhasarkar, J.B.; Moholkar, V.S. Kinetic modelling and process engineering aspects of biodesulfurization of liquid fuels: Review and analysis. Bioresour. Technol. Rep. 2021, 14, 100668. [Google Scholar] [CrossRef]
  40. Abin-Fuentes, A.; Leung, J.C.; El-Said Mohamed, M.; Wang, D.I.C.; Prather, K.L.J. Rate-limiting step analysis of the microbial desulfurization of dibenzothiophene in a model oil system. Biotechnol. Bioeng. 2014, 110, 876–884. [Google Scholar] [CrossRef] [Green Version]
  41. Nassar, H.N.; Abu Amr, S.S.; El-Gendy, N.S. Biodesulfurization of refractory sulfur compounds in petro-diesel by a novel hydrocarbon tolerable strain Paenibacillus glucanolyticus HN4. Environ. Sci. Pollut. Res. 2021, 28, 8102–8116. [Google Scholar] [CrossRef]
  42. Khosravinia, S.; Mahdavi, M.A.; Gheshlaghi, R.; Dehghani, H.; Rasekh, B. Construction and characterization of a new recombinant vector to remove sulfate repression of dsz promoter transcription in biodesulfurization of dibenzothiophene. Front. Microbiol. 2018, 9, 1578. [Google Scholar] [CrossRef]
  43. Schilling, B.M.; Alvarez, L.M.; Wang, D.I.C.; Cooney, C.L. Continuous desulfurization of dibenzothiophene with R. rhodochrous IGTS8 (ATCC 53968). Biotechnol. Prog. 2002, 18, 1207–1213. [Google Scholar] [CrossRef] [PubMed]
  44. Abin-Fuentes, A.; Mohamed, M.E.S.; Wang, D.I.; Prather, K.L. Exploring the mechanism of biocatalyst inhibition in microbial desulfurization. Appl. Environ. Microbiol. 2013, 79, 7807–7817. [Google Scholar] [CrossRef] [Green Version]
  45. Kobayashi, M.; Horiuchi, K.; Yoshikawa, O.; Hirasawa, K.; Ishii, Y.; Fujino, K.; Sugiyama, H.; Maruhashi, K. Kinetic analysis of microbial desulfurization of model and light gas oils containing multiple alkyl dibenzothiophenes. Biosci. Biotech. Bioch. 2001, 65, 298–304. [Google Scholar] [CrossRef] [PubMed] [Green Version]
  46. Mingfang, L.; Zhongxuan, G.; Jianmin, X.; Huizhou, L.; Jiayong, C. Microbial desulfurization of model and straight-run diesel oils. J. Chem. Technol. Biot. 2003, 78, 873–876. [Google Scholar] [CrossRef]
  47. Chen, H.; Zhang, W.J.; Chen, J.M.; Cai, Y.B.; Li, W. Desulfurization of various organic sulfur compounds and the mixture of DBT+4,6-DMDBT by Mycobacterium sp. ZD-19. Bioresour. Technol. 2008, 99, 3630–3634. [Google Scholar] [CrossRef] [PubMed]
Figure 1. The 4S pathway for DBT desulfurization.
Processes 09 02064 g001
Figure 2. Chemical structure of different OSCs.
Processes 09 02064 g002
Figure 3. Flow sheet of the bioreactor system used in biodesulfurization of biphasic media by resting cells of R. erythropolis IGTS8: (1) glass cylinder; (2) sparger; (3) gas flow meter; (4) water bath; (5) sampling port.
Processes 09 02064 g003
Figure 4. Evolution of cell mass concentration (◯) and biodesulfurization activity (CDA) (ν) of R. erythropolis ITGS8 during growth in a 20 L bioreactor.
Processes 09 02064 g004
Figure 5. Biodesulfurization of DBT by R. erythropolis IGTS8 resting cells obtained from different stages of growth. Symbols: (λ) YBDS (%), (◯) XBDS (%), (π) DDBT (% g DCW/L/h), (△) specific 2-HBP production rate (mmol 2-HBP/kg DCW/h), and (θ) specific BDT removal rate (mmol/kg DCW/h).
Processes 09 02064 g005
Figure 6. Effect of hydrocarbon–aqueous phase ratio on desulfurization of DBT by resting cells of R. erythropolis IGTS8. Symbols: (λ) YBDS (%), (◯) DBT removal rate (mmol/L/h), and (π) specific BDT removal rate (mmol/kg DCW/h). The volumes of the hydrocarbon and aqueous phases were varied by keeping the total reaction mixture volume constant.
Processes 09 02064 g006
Figure 7. Effect of resting cell concentration on desulfurization of DBT. Symbols: (λ) YBDS (%), (◯) DBT removal rate (mmol/L/h), and (π) specific BDT removal rate (mmol/kg DCW/h).
Processes 09 02064 g007
Figure 8. Biodesulfurization of DBT by R. erythropolis IGTS8 resting cells at different initial concentrations. Symbols: (λ) YBDS (%), (◯) XBDS (%), (π) DDBT (% g DCW/L/h), (△) specific 2-HBP production rate (mmol 2-HBP/kg DCW/h), and (θ) specific BDT removal rate (mmol/kg DCW/h).
Processes 09 02064 g008
Figure 9. Time course of biodesulfurization of DBT and production of 2-HBP by R. erythropolis IGTS8 resting cells at different initial DBT concentrations: (a) 1.1 mM DBT, (b) 2.6 mM DBT, and (c) 4.3 mM DBT. Symbols: DBT (θ), 2-HBP (σ). Solid lines represent model fitting (Equations (6) and (7)).
Processes 09 02064 g009
Figure 10. Time course of cells’ desulfurization activity during BDS of different concentrations of DBT. Symbols: 1.1 mM (λ), 2.6 mM (π), and 4.3 mM (□). Solid lines represent fitting of the first-order exponential decay model.
Processes 09 02064 g010
Figure 11. Time course of biodesulfurization of different OSCs by R. erythropolis IGTS8 resting cells. Symbols: (λ) 4-MDBT, (σ) 4,6-DMDBT, and (◯) 4,6-DEDBT. Solid line represents model fitting (Equation (6)).
Processes 09 02064 g011
Figure 12. Time course of biodesulfurization of DBT, 4,6-DMDBT, or their mixtures by R. erythropolis IGTS8 resting cells: (a) single system of DBT or 4,6-DMDBT, (b) mixture of 3.5 mM DBT and 1.5 mM 4,6-DMDBT, (c) mixture of 2.5 mM DBT and 2.5 mM 4,6-DMDBT, and (d) mixture of 1.5 mM DBT and 3.5 mM 4,6-DMDBT. Symbols: DBT (λ), 4,6-DMDBT (◯).
Processes 09 02064 g012
Table 1. Kinetic constants for BDT consumption and 2-HBP production (Equations (6) and (7)).
Initial DBT Concentration (mM)K (mM DBT)kd (h−1)a
(mM DBT/h)
b
(mM HBP/mM DBT)
1.11.151 ± 0.0650.099 ± 0.0090.990 ± 0.0320.738 ± 0.022
2.60.573 ± 0.0090.705 ± 0.016
4.30.449 ± 0.0110.652 ± 0.024
Table 2. ΥBDS and specific desulfurization rates of 4-MDBT, 4,6-DMDBT, and 4,6-DEDBT during biodesulfurization under biphasic conditions with R. erythropolis IGTS8 resting cells.
OSCsYBDS (%)Specific Desulfurization Rate
(Mmoles Cx-DBT/kg DCW/h)
4-MDBT72.2 ± 2.69.4 ± 0.5
4,6-DMDBT60.0 ± 0.77.1 ± 0.9
4,6-DEDBT21.1 ± 4.92.0 ± 0.7
Table 3. Kinetic constants for the biodesulfurization of different OSCs (Equation (6)).
OSCK (mM OSC)kd (h−1)a (mM OSC/h)
4-MDBT8.87 ± 1.030.099 ± 0.0091.50 + 0.05
4,6-DMDBT8.57 ± 0.681.27 + 0.09
4,6-DEDBT55.30 ± 4.411.21 + 0.19
Table 4. ΥBDS and specific desulfurization rates of R. erythropolis IGTS8 resting cells on DBT, 4,6-DMDBT, and the mixture of DBT + 4,6-DMDBT in the biphasic system.
Concentration of SubstrateYBDS (%)Specific Desulfurization Rate (Mmoles Cx-DBT/kg DCW/h)
5 mM DBT60.4 ± 0.211.19 ± 0.03
3.5 mM DBT + 1.5 mM 4,6 DMDBT
DBT72.7 ± 2.09.31 ± 0.25
4,6 DMDBT51.6 ± 1.03.0 ± 0.06
Overall66.2 ± 1.712.31 ± 0.19
2.5 mM DBT + 2.5 mM 4,6 DMDBT
DBT80.9 ± 2.37.35 ± 0.21
4,6 DMDBT52.2 ± 6.44.87 ± 0.60
Overall66.6 ± 4.412.22 ± 0.48
1.5 mM DBT + 3.5 mM 4,6 DMDBT
DBT76.8 ± 0.83.66 ± 0.04
4,6 DMDBT56.2 ± 3.27.38 ± 0.42
Overall62.4 ± 2.511.04 ± 0.28
5 mM 4,6 DMDBT56.9 ± 0.411.00 ± 0.07
Publisher’s Note: MDPI stays neutral with regard to jurisdictional claims in published maps and institutional affiliations.

