Abstract
Pre-dispatch is an important way for distribution networks to cope with typhoon weather, enhance resilience and reduce economic losses. In order to accurately describe the faults and consequences of components’ failure in the distribution network, this paper establishes a pre-dispatch model to cope with typhoon weather based on line failures consequence analysis. First, Monte Carlo simulation is used to sample the typical fault scenarios of vulnerable lines. According to the location of switchgear, the distribution network is partitioned and a block breaker correlation matrix is established. Combined with the line fault status, a fault consequence model of distribution lines related to the pre-dispatching strategy is established. Then, the objective function is given to minimize the sum of the cost of the pre-dispatch operation and the power outage, and then establish a pre-dispatch model for the distribution network. In order to reduce the computational complexity, PH (Progressive Hedging) algorithm is used to solve the model. Finally, the IEEE-69 test system is used to analyze the effectiveness of the method. The results show that the proposed dispatching model can effectively avoid potential risks, reduce system economic losses and improve the resilience of power grids.
1. Introduction
With the rapid development of the economy and the continuous improvement of residents’ living standards, consumers’ requirements for power demand, power quality and power supply reliability are constantly improving. On the other hand, with the increasing frequency of extreme weather such as typhoons, hail and thunderstorms, extreme weather brings great risks to the safe operation of a power grid [1]. Many failures caused by extreme weather have brought great economic losses to the power grid all over the world. For example, in 2005, Typhoon Davy brought a heavy blow to the Hainan power grid, causing nearly one hundred 110 kV lines to trip [2].In 2008, severe snow and ice disasters occurred in China, more than 2000 substations were shut down, more than 8500 power poles and towers collapsed, and residents in more than 170 cities experienced power outage losses [3]. Typhoon Sandy in 2012 afflicted New York and Caused 85% of residents to lose power [4].
In order to improve the resistance of power systems to extreme weather, long-term planning and short-term dispatch of power systems should be carried out before extreme weather occurs [5]. In previous studies, the planning method refers to reinforcing the infrastructure in the power system with stronger materials or improving the strength of the system by physical means [6], including vegetation management, equipment installation and line reinforcement [7]. However, the planning method generally has a long time cycle and needs a lot of economic costs. The short-term dispatch method refers to improving the operating characteristics of power systems under extreme weather by scheduling resources such as generators in power systems. Dispatch methods include topology transformation, generator dispatching, protection control, state perception and so on. These measures are active, real-time and low economic cost. They are common ways used in power systems to resist extreme weather. Different from a large main network, the voltage level of a distribution network is relatively low, the strength of poles, towers, lines and other components is not high, and the resistance ability to extreme weather is poor. In fact, 80–90% of power system outages are related to distribution networks [8]. Therefore, it is necessary to make the dispatch plan of the distribution network in advance to resist the negative impact of extreme weather and reduce the economic loss caused by load shedding.
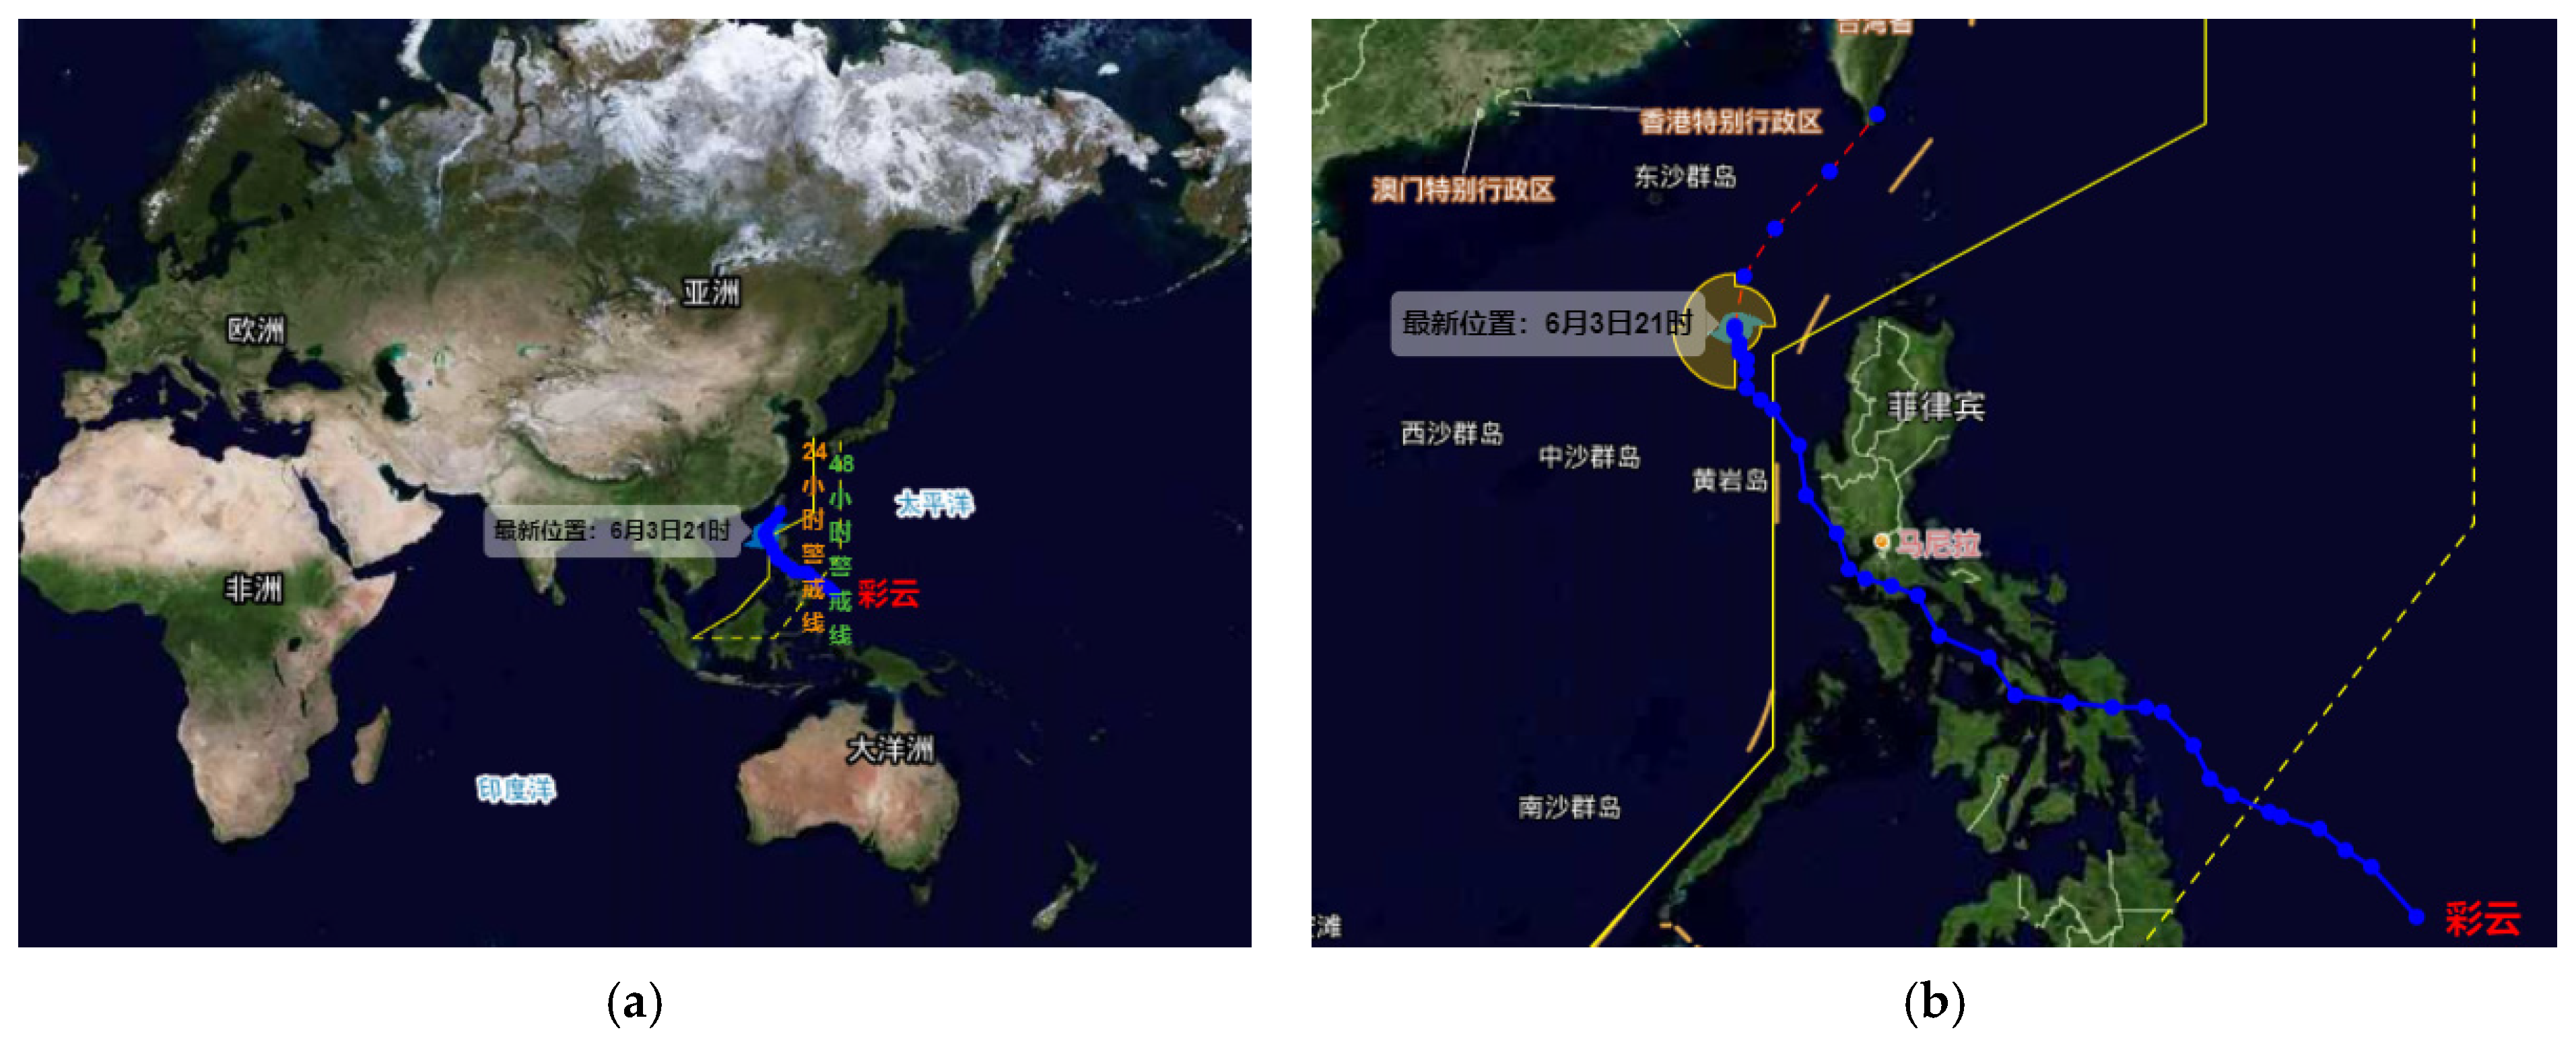
As shown in Figure 1, with the development of weather forecasting and monitoring technology, the power system operators can get the specific information of typhoon login several days in advance, and create conditions for the dispatch of a distribution network in advance. Many scholars have studied the pre-dispatch strategy of distribution networks and have achieved remarkable results. Literature [9] proposed a switching dispatch scheme in advance, which sorts lines with possible faults in the distribution network according to the fault probability and disconnects them in advance so that all loads can ensure work in normal operation and the distribution network operates in a low-risk state. Literature [10] establishes a pre-dispatch model for switches and distributed generation in a microgrid. This model takes the most serious line failure scenarios into account. The case analysis shows that the pre-dispatch strategy can effectively reduce the load loss of a distribution network under extreme weather conditions. Literature [11] considers the random fault scenario of a distribution network under extreme weather and aims at minimizing the system load shedding amount, thus establishing a novel component repairer scheduling model.
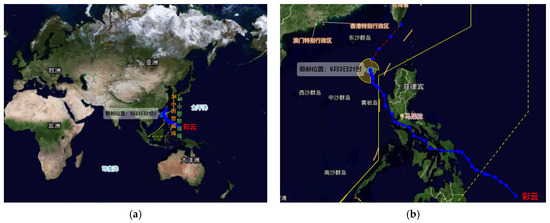
Figure 1.
Information display of typhoon network of Central Meteorological Station. (a) Meteorological cloud map and typhoon route. (b) Real time information monitoring and route prediction of Typhoon.
In addition, the differences in regional economic development and natural conditions cause the unbalanced development of automation of distribution networks in China [12]. In particular, China’s rural power grid has a large area and scattered load, which brings inconvenience to adopt the latest automation and communication technology [13], even some rural power grids still have not adopted automation technology. Since it is impossible to manually operate the equipment in the distribution network that does not adopt automation technology [14] during the process of extreme weather, the distribution network cannot remotely operate the equipment to quickly isolate the fault, and also lacks the ability to respond to the fault state of components in real-time, so it is more vulnerable to cause load shedding [15]. A reasonable pre-dispatch strategy will help reduce its economic loss under extreme weather conditions. However, there is little research on the pre-dispatch strategy for the distribution network without automation technology.
Based on the above analysis, this paper proposes a pre-dispatch model for distribution networks to deal with typhoon weather based on line fault consequence analysis. The remainder of this paper is as follows: firstly, based on the vulnerability curves of lines and towers under typhoon weather, the random fault probability of lines can be calculated, and the line fault scenario is generated by Monte Carlo simulation. Then, according to the fault location, the distribution network is partitioned according to the location of the switch, and the block breaker correlation matrix is established. The breaker trip identification vector is designed to characterize the whole trip process. Combined with the line fault state, a fault consequence model of lines, which is related to the pre-dispatch strategy, is established. Finally, based on the model above and the line fault scenario generation method, a pre-dispatch model for distribution network to cope with typhoon weather is established. The model mainly changes the state of the switch in the distribution network before a typhoon lands and modifies the network topology to reduce the possible influence of Typhoon wind on the distribution network. In essence, the model is a two-stage stochastic optimization model, which is solved by the progressive hedging (PH) algorithm in this paper.
The innovation of this article can be summarized as follows:
- (1)
- Firstly, previous studies mainly focused on the power grid with a high degree of automation. However, some regions in China still need field operations. When the typhoon comes, it poses a potential threat to the security operation of China. To overcome this challenge, a novel pre-dispatch model for the system without automation is established in this paper.
- (2)
- From the perspective of the model and algorithm, the pre-dispatch model is a mixed-integer linear programming problem. A traditional solving method such as the Benders Decomposition method is not suited for the model in this paper, because many scenarios are randomly generated. Therefore, PH (Progressive Hedging) algorithm is adopted in this paper to reduce the computational complexity and improve computational efficiency.
2. Generation of Line Fault Scenario under Typhoon Weather
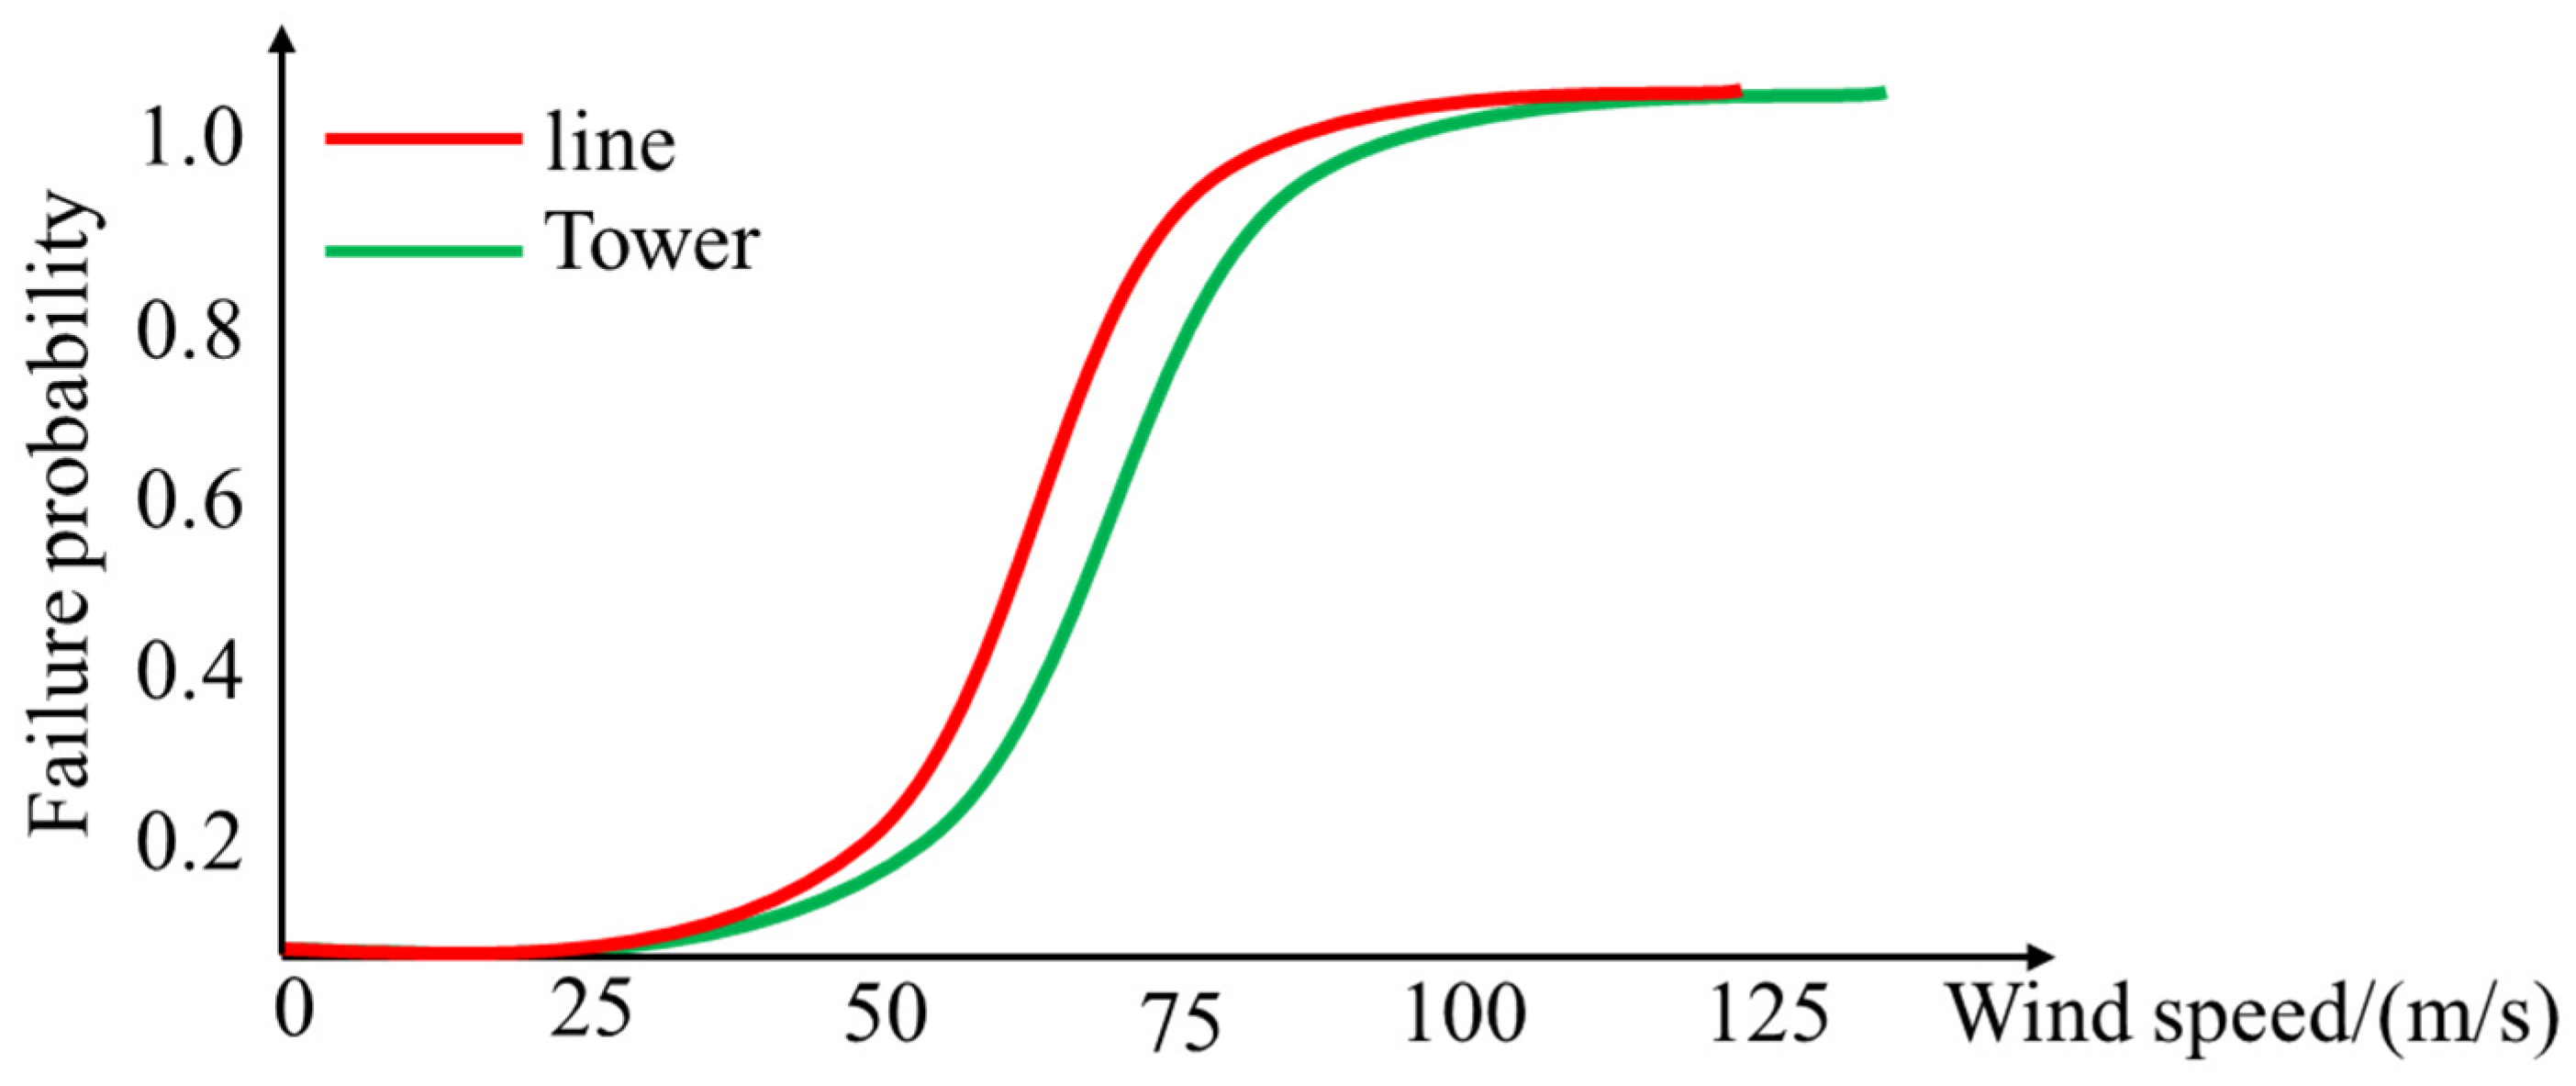
In the pre-dispatch model of the distribution network, typhoons have not yet occurred. However, the impact of the upcoming Typhoon on the distribution network needs to be considered, that is, the randomness of component faults in the distribution network under extreme weather conditions. In this section, line faults under extreme weather are regarded as independent random events and the line fault scenarios are extracted by the Monte Carlo simulation method based on the fault probability. Figure 2 shows a typical distribution network component vulnerability curve. As shown in Figure 2, the fault probability of lines or towers in distribution networks is influenced by wind speed. When the typhoon is coming, the fault scenarios of lines and towers can be obtained. To reduce the complexity of computation, we used the Monte Carlo simulation method to choose these scenarios.
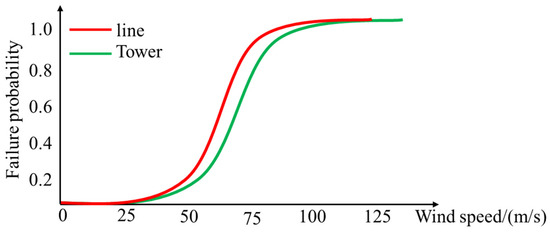
Figure 2.
Typical component failure probability curves in distribution network.
According to the literature [16,17], when the wind speed in the next few hours can be predicted or measured, the failure probability of lines or towers can be seen as a function of wind speed, and the relationship curve between failure probability and wind speed is called the component vulnerability curve of distribution network.
Assuming that the predicted wind speed at time t is vt, the failure probability of tower on line ij at time t is the function Pij,Tower (vt) of wind speed vt, and the failure probability of line ij is Pij,C (vt). The failure probability of a single tower or line can be obtained from the vulnerability curve of the distribution network in Figure 2.
It is assumed that there are Nij,T towers between line i and line j, then the relationship between Pij,Tower (vt) and Pij,T (vt) is shown as Equation (1).
The fault of the tower or line will lead to a line fault between two nodes. Therefore, the line fault probability Pij,L (vt) between nodes ij is shown as Equation (2):
Due to the large number of lines in the distribution network, there are many scenarios in which line faults may occur under extreme weather. In order to reduce the scenarios and speed up the calculation, this paper sets the failure rate threshold to screen the fragile lines. When the failure probability of the line exceeds the threshold, the line is considered a fragile line. If the threshold is not exceeded, the line is considered to be a stronger line and will not break down.
Suppose the typhoon weather event happens in the time period from t1 to t2, and the predicted wind speed is vt. According to the above calculation method of line fault probability, that is, Equations (1) and (2), the fault probability Pij,L (vt) between line i and line j can be obtained. Suppose the fault probability threshold of a fragile line as Pstep and fij,t as the sign of fragile line. Then for any line ij, the following Equation (3) is satisfied.
The set of all lines whose the value of fij,t are equal to 1 is the system fragile line set ΩLf. Suppose that there are NLf elements in the set in total, that is, there are NLf fragile lines in the distribution network that may occur failure, and each fragile line ij may occur failure in the period from t1 to t2.
For scenario s, a random number τij,t,s ∈ [0, 1] is extracted for the fragile line ij ∈ ΩLf. Then, when the value of τij,t,s is smaller than the line fault probability Pij,L (vt), the line will break down, and the value of line fault state uij,t,s is 1. When the value of τij,t,s is larger than or equal to the line fault probability Pij,L (vt), the line will not fail and can operate normally, and the value of line fault state uij,t,s is 0. The detailed mathematical expression is shown in (4):
For the fragile line ij ∈ ΩLf that has failed at the last time, the fault state of the line remains unchanged because the line cannot be repaired within the duration of extreme weather:
Since the faults of different lines are independent events, the fault status of each fragile line can be sampled one by one, and then the results are aggregated. Once a line fails at a certain time through sampling, because the line cannot be repaired during a typhoon, it will always maintain the fault state in the remaining time, that is, there is no need to sample to determine the fault state at the subsequent time. If the sampling results find that the line works normally in the whole typhoon period, consider the next line until the fault status of all lines has been determined, and the sampling process of one scenario is completed.
3. Distribution Line Fault Consequence Analysis and Modeling
3.1. Establishment of Block Breaker Correlation Matrix
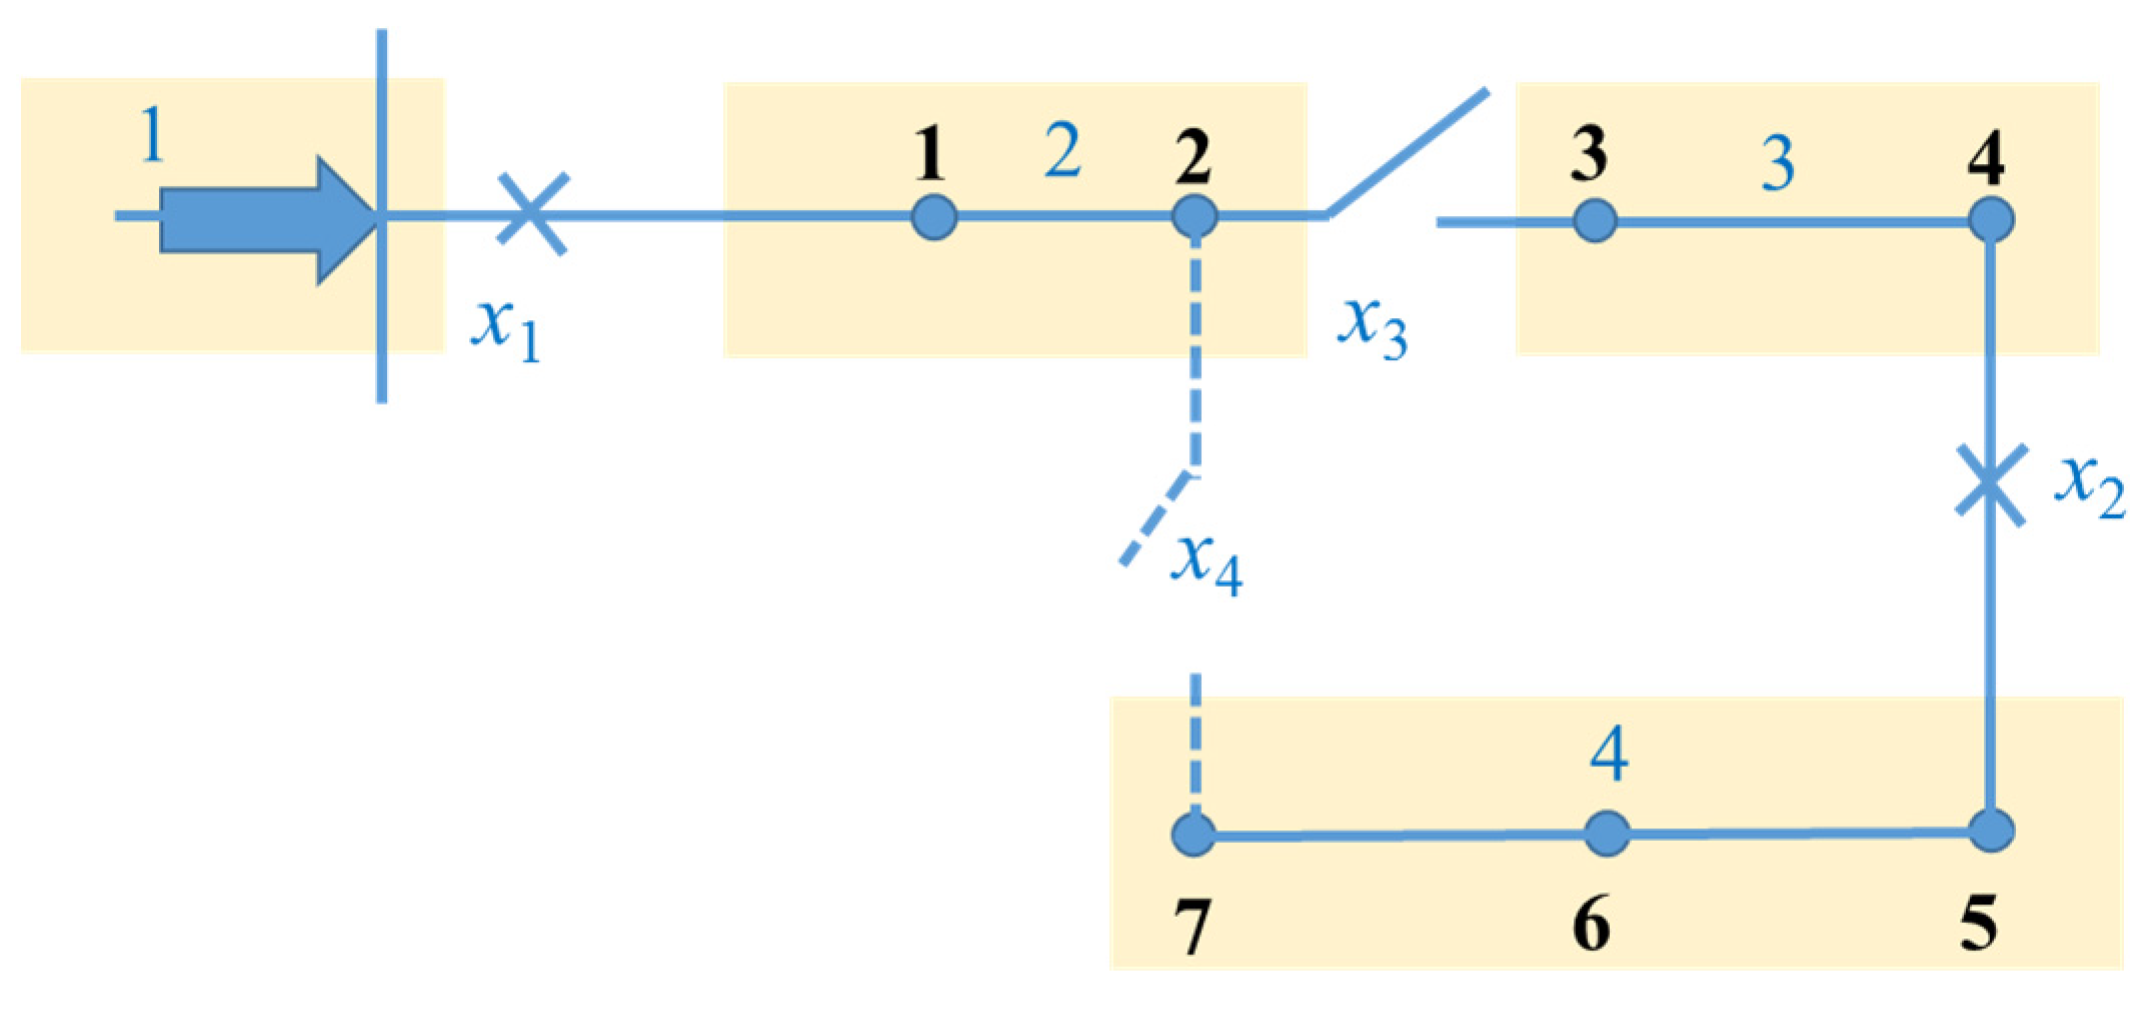
It can be seen that the consequence of line failure under typhoon weather is that the forward search circuit breaker of the fault line trips through the above analysis. Since the lines in the same area of the distribution network have the same forward search circuit breaker, the distribution network can be divided into certain blocks and a block breaker correlation matrix can be established to represent the corresponding relationship between the fault block and its upstream circuit breaker.
Figure 3 is a schematic diagram of a simple medium-voltage distribution system and its blocks. The number in the figure represents node number. The distribution network shown in the figure has seven nodes; two circuit breakers x1 and x2, one isolating switch x3 and one interconnection switch x4. The distribution network can be divided into 4 blocks according to the switch position, and the upstream circuit breakers of all lines in each block are the same. During normal operation, the circuit breaker and isolating switch are closed, and the interconnection switch is open.
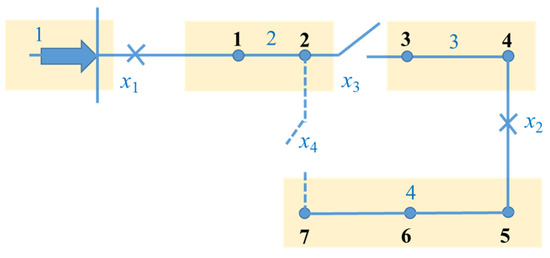
Figure 3.
A diagram for a sectionalized distribution system.
Supposing that a distribution network is equipped with Nbreaker circuit breakers, with a parameter of m. The distribution network is divided into NSection areas according to the position of circuit breakers, with a parameter of n. The partitioned area is regarded as a new node, and the lines where the switchgear is located are regarded as partitioned connecting lines. A block breaker correlation matrix H can be established to represent the corresponding relationship between the partitioned area and its upstream circuit breaker in the distribution network. The rows and columns of matrix H are Nbreaker and NSection respectively. If the upstream circuit breaker of block n is the m-th circuit breaker, the element Hmn = 1 in the matrix, otherwise Hmn = 0.
3.2. Line Fault Consequence Model Based on Block Breaker Correlation Matrix
In order to indicate the consequence of line failure in the distribution network, the tripping process of the circuit breaker after a fault should be expressed by a mathematical expression based on the block breaker correlation matrix H, and the formation process of block breaker correlation matrix under different network topology is analyzed to establish a fault consequence model of lines.
Let uij,t,s represents the fault state of line ij at time t under scenario s (here, 1 represents normal state and 0 represents fault state), and then use the fault state un,t,s to represent the fault state of the line, shown as Equation (6). Signm,t,s is the flag of the circuit breaker trip.
To gain a better understanding, we give an example. As shown in Figure 3, both line 5–6 and line 6–7 faults in block 4 will cause block 4 to break down, and the two lines have the same fault consequences.
Equation (7) indicates that the sufficient and necessary condition for circuit breaker tripping in a distribution network is that at least one block corresponding to the circuit breaker fails. When the conditions are met, the tripping flag of the circuit breaker is 0, otherwise, it is 1. Note xm,t,s is the opening and closing state of the circuit breaker (1 represents closed state, 0 represents open state), including:
Equations (7) and (8) indicate that the line fault sets the circuit breaker tripping flag to 0 in the H matrix to represent the tripping processes.
Due to the existence of tie lines in the distribution network, the topology of the distribution network can be changed in advance to cope with extreme weather. The corresponding circuit breaker may change the relationship between matrix H and the pre-dispatch strategy x0 is analyzed.
Since block 1 contains the node where the upstream power grid is connected, its fault consequence is an isolated island operation of the distribution network, which is not considered in this paper. Therefore, assuming that it does not fail, the H matrix satisfies Equation (9):
Except for block 1, each block has only one circuit breaker, shown as Equation (10).
Each circuit breaker in the distribution network corresponds to at least one block, shown as Equation (11).
when the interconnection switch or disconnector in the distribution network is closed, the two blocks connected by the switch have the same fault consequences, that is, the two blocks correspond to the same tripping circuit breaker. Suppose that the status of the disconnector or interconnection switch connecting blocks n1 and n2 in the pre-dispatch strategy is xl,0 (here 1 represents closed state and 0 represents open state), and the following formula holds:
In addition, when there is a circuit breaker between two blocks n1 and n2 in the distribution network and the circuit breaker is originally closed. The state of the circuit breaker in the pre-dispatch scheme is xm,0 (here, 1 represents closed state and 0 represents open state), and the above relationship can be expressed as Equation (13):
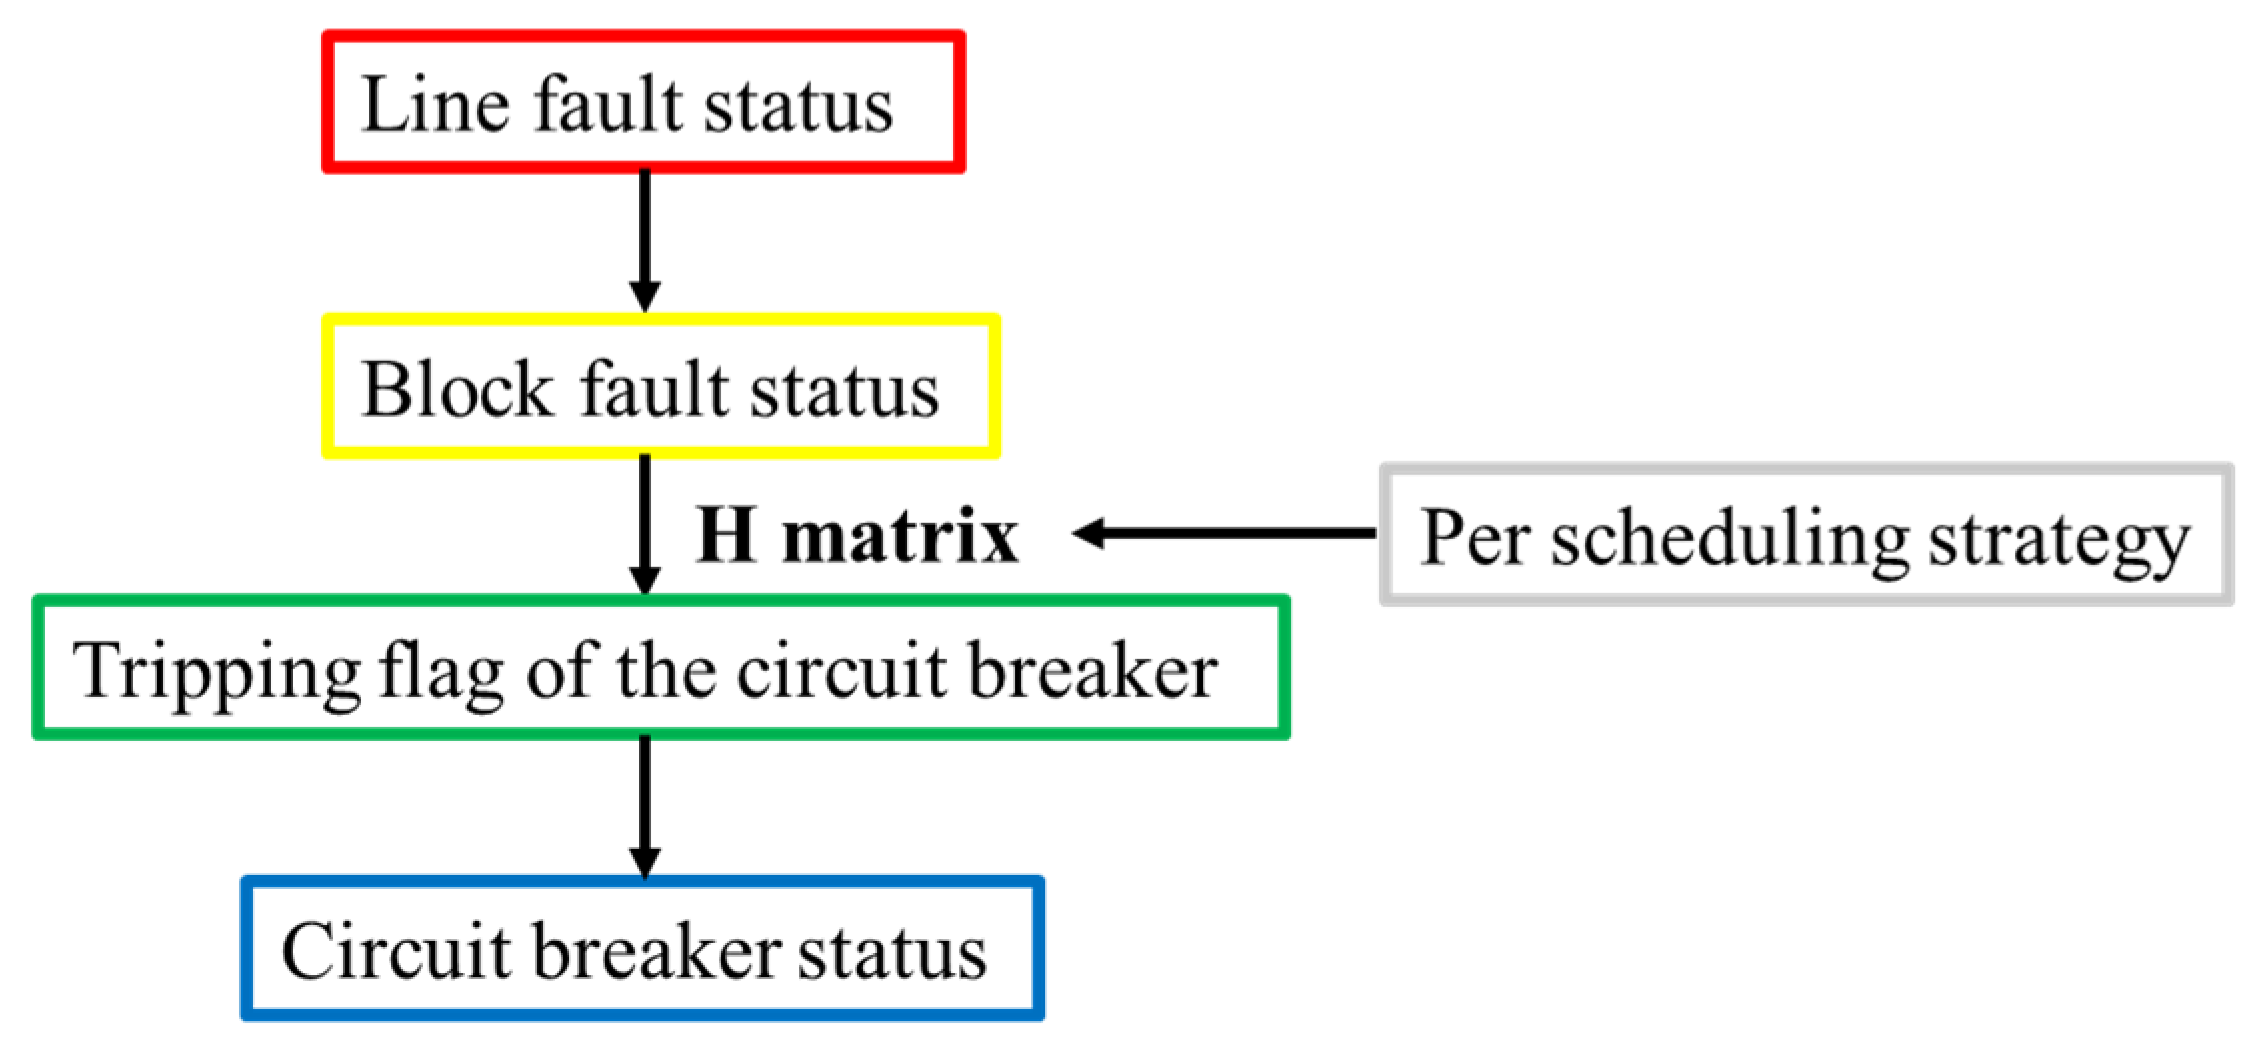
Figure 4 shows in detail the relationship between the pre-dispatch strategy x0, line fault state uij,t,s, circuit breaker state xm,t,s and matrix H, thereby establishing the fault consequence model of the line.
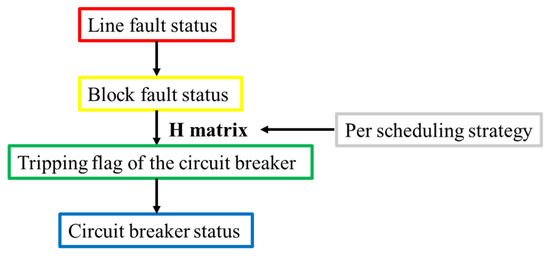
Figure 4.
Line fault consequence model in distribution network.
4. Pre-Dispatch Model for Distribution Network in Response to Typhoon Weather
4.1. The Objective Function of Pre-Dispatch Model
The objective function of a pre-dispatch model is to minimize the total cost of the distribution network before and after the arrival of extreme weather. The total operating cost includes the pre-dispatch cost to cope with extreme weather and the operation cost of the distribution network during the extreme event duration. In the first stage, the object of optimal dispatching of the distribution network is mainly switchgear, including circuit breaker, section switch and interconnection switch. Since this paper does not consider the access of remote switches, the switch action must be carried out by the operators to the scene. The cost of pre-dispatch is mainly the manual cost of switching. When the power system operates considering natural disasters such as typhoons, outage loss is the main loss in the operational process, which can be caused by common N-1 faults. In the event stage, the power system and distribution network are vulnerable to large-scale damage, and large-scale load shedding is very likely to occur. In this case, the outage loss can be seen as an operating cost of a distribution network.
Therefore, the objective function of the optimal dispatch model can be expressed as Equation (14):
The objective function is divided into two parts. The first part C1 represents the cost of switching before the extreme event occurs, and the pre-dispatch cost is applied to all scenarios. The second item represents the outage loss of the distribution network in the process of extreme events. The outage loss of the second item is applicable to different scenarios, and each scenario corresponds to its own outage loss. ωs represents the probability of each scenario. The formula for calculating the pre-dispatch cost C1 in the objective function is shown as Equation (15):
where, csw represents the economic cost of a single manual opening or closing of the switchgear, and ΩL and ij represent the set and subscript of all lines in the distribution network. xij,0 represents the opening and closing state of the lines after the pre-dispatch (here 1 represents closed state and 0 represents open state) and it is the decision variable in optimization problems. xij,ini represents the opening and closing state of the line under normal operation (here, 1 represents closed state and 0 represents open state), which is a fixed parameter determined by the system. The absolute value of the difference between xij,0 and xij,ini is 1 if the switchgear is opened and closed in pre-dispatch stage. C2(s) in the objective function represents the outage loss of the distribution network in line fault scenarios during typhoons. The calculation formula of C2(s) is shown as Equation (16):
Here, T represents the optimized period. ΩB represents the node set in the network. cshedi represents the unit outage loss of node i, Pi,t represents the load of node i, αi,t,s represents the load shedding ratio of node i under scenario s.
4.2. The Constraints of Pre-Dispatch Model
The optimal pre-dispatch model of distribution network under typhoon weather is a two-stage stochastic dispatch model. The optimal dispatch strategy should not only meet the normal operation requirements of the distribution network before the event but also ensure that the distribution network can maintain operation as normal as possible when the event occurs. Therefore, the constraints of the optimal pre-dispatch model are mainly divided into the first stage constraints in advance and the second stage constraints in the event.
4.2.1. Constraints of the First Stage
The first stage constraints in advance mainly include power flow balance constraints, upper and lower limits constraints of voltage, switching state constraints and topology constraints of the distribution system. It should be noted here that the subscripts of variables and constants in the first stage constraint contain “0”, indicating that variables are determined in advance before typhoon weather occurs.
Power flow balance constraint:
Equations (17) and (18) are power flow balance constraints. Here Pi,0 and Qi,0 represent the active power and reactive power of node load before typhoon weather. Pij,0 and Qij,0 represents the power flow on the line ij, which flows from node i to node j. Pji,0 and Qji,0 represents the power flow on the line ji, which flow from node j to node i., Pbps,0 and Qbps,0 in Equations (17) and (18) is the power purchased by the distribution network from the main network, which is decision variables.
Equation (19) is the line power flow balance constraint, where Rij and Xij are line impedance. Vi,0 and Vj,0 represents voltage amplitude of node i and j respectively. yij,0 indicate the actual opening and closing condition (here 1 represents closed state and 0 represents closed state) after pre-dispatch and all of them are decision variables in optimization problems. M is a large enough number. Traditional power flow calculation methods such as the Newton–Raphson method and PQ decomposition method are mainly used in high-voltage level power systems. However, the voltage level of the distribution network is low compared with the transmission network. Therefore, when the traditional method is used in the distribution network, a large error is produced. Under this background, some research has proposed a novel method named the distflow method [18]. The distflow model takes the active power, the reactive power and square of node voltage amplitude as state variables and then establish the state equation. By solving the distflow model, the accurate results on the power flow of the distribution network can be obtained. Equations (17)–(19) are distflow models commonly used in power flow balance constraints in distribution networks The upper and lower bound constraints are:
Equations (20) and (21) indicate that the power flow passing through the line ij cannot exceed the upper limits Pijmax and Qijmax. Here, Equations (22) and (23) represent the power purchased from the distribution network to the main network, Pbps,0 and Qbps,0 are positive value. Equation (24) is the constraint on the voltage amplitude of the node, and Vimax and Vimin are the upper and lower limits of the voltage amplitude of node i.
Switch state constraints:
xij,0 represents the line opening and closing state in the pre-dispatch strategy. Since there is no line fault in advance, the state of the switchgear is the actual opening and closing state of the line, as shown in Equation (25). xsij represents whether there is a switch on the line (here 1 represents yes and 0 represents no). Equation (26) represents that for the line without switchgear, its line state is closed, while for the line with switch, its line state will change according to switch state.
Radial constraint:
In order to effectively operate the protection system in case of emergencies and faults, the distribution system usually operates in a radial manner. Equations (27)–(29) represent the distribution network run radially in advance by restricting the parent-child relationship between nodes, where oij,0 represents the parent-child relationship between any two nodes in the distribution network. If the value of oij,0 is 1, it means that the node i is the parent node of node j before the pre-dispatch. Equation (27) represents that if there is a parent-child relationship between two nodes, the two nodes must be connected. Equation (28) represents that the root node has no parent node. Equation (29) represents that any node has at most one parent node.
4.2.2. Second Stage Constraint
The second stage constraints in the event are similar to the first stage constraints in advance, including power flow balance constraints, upper and lower limits constraints, switching state constraints and radial constraints, similar to Equations (17)–(29). Since the fault of the distribution line caused by typhoon weather will lead to protection action and fault isolation, the second stage constraints also include the constraints related to the consequences of a line fault.
Failure consequence constraints:
Equations (30)–(37) are based on the constraints of distribution line fault consequence analysis in Section 3 above, in which (30)–(32) is the description of circuit breaker tripping process, which is related to fault scenario s. As shown in Equation (30), the line fault status affects the block fault status. Then Signm,t,s can be influenced by the H matrix, causing the trip of the circuit breaker. In addition, the H matrix is determined by the pre-dispatch strategy. The relationship between the pre-dispatch strategy and the H matrix is (33)–(37).
4.3. Solution of Pre-Dispatch Model
In this optimization problem, different scenario decomposition techniques are needed to solve the scenario-related models. The commonly used Benders Decomposition method has poor effect in such problems because Benders Decomposition has high requirements for the convexity of the objective function and can not be directly applied to the problems with integer variables in the second stage [19].
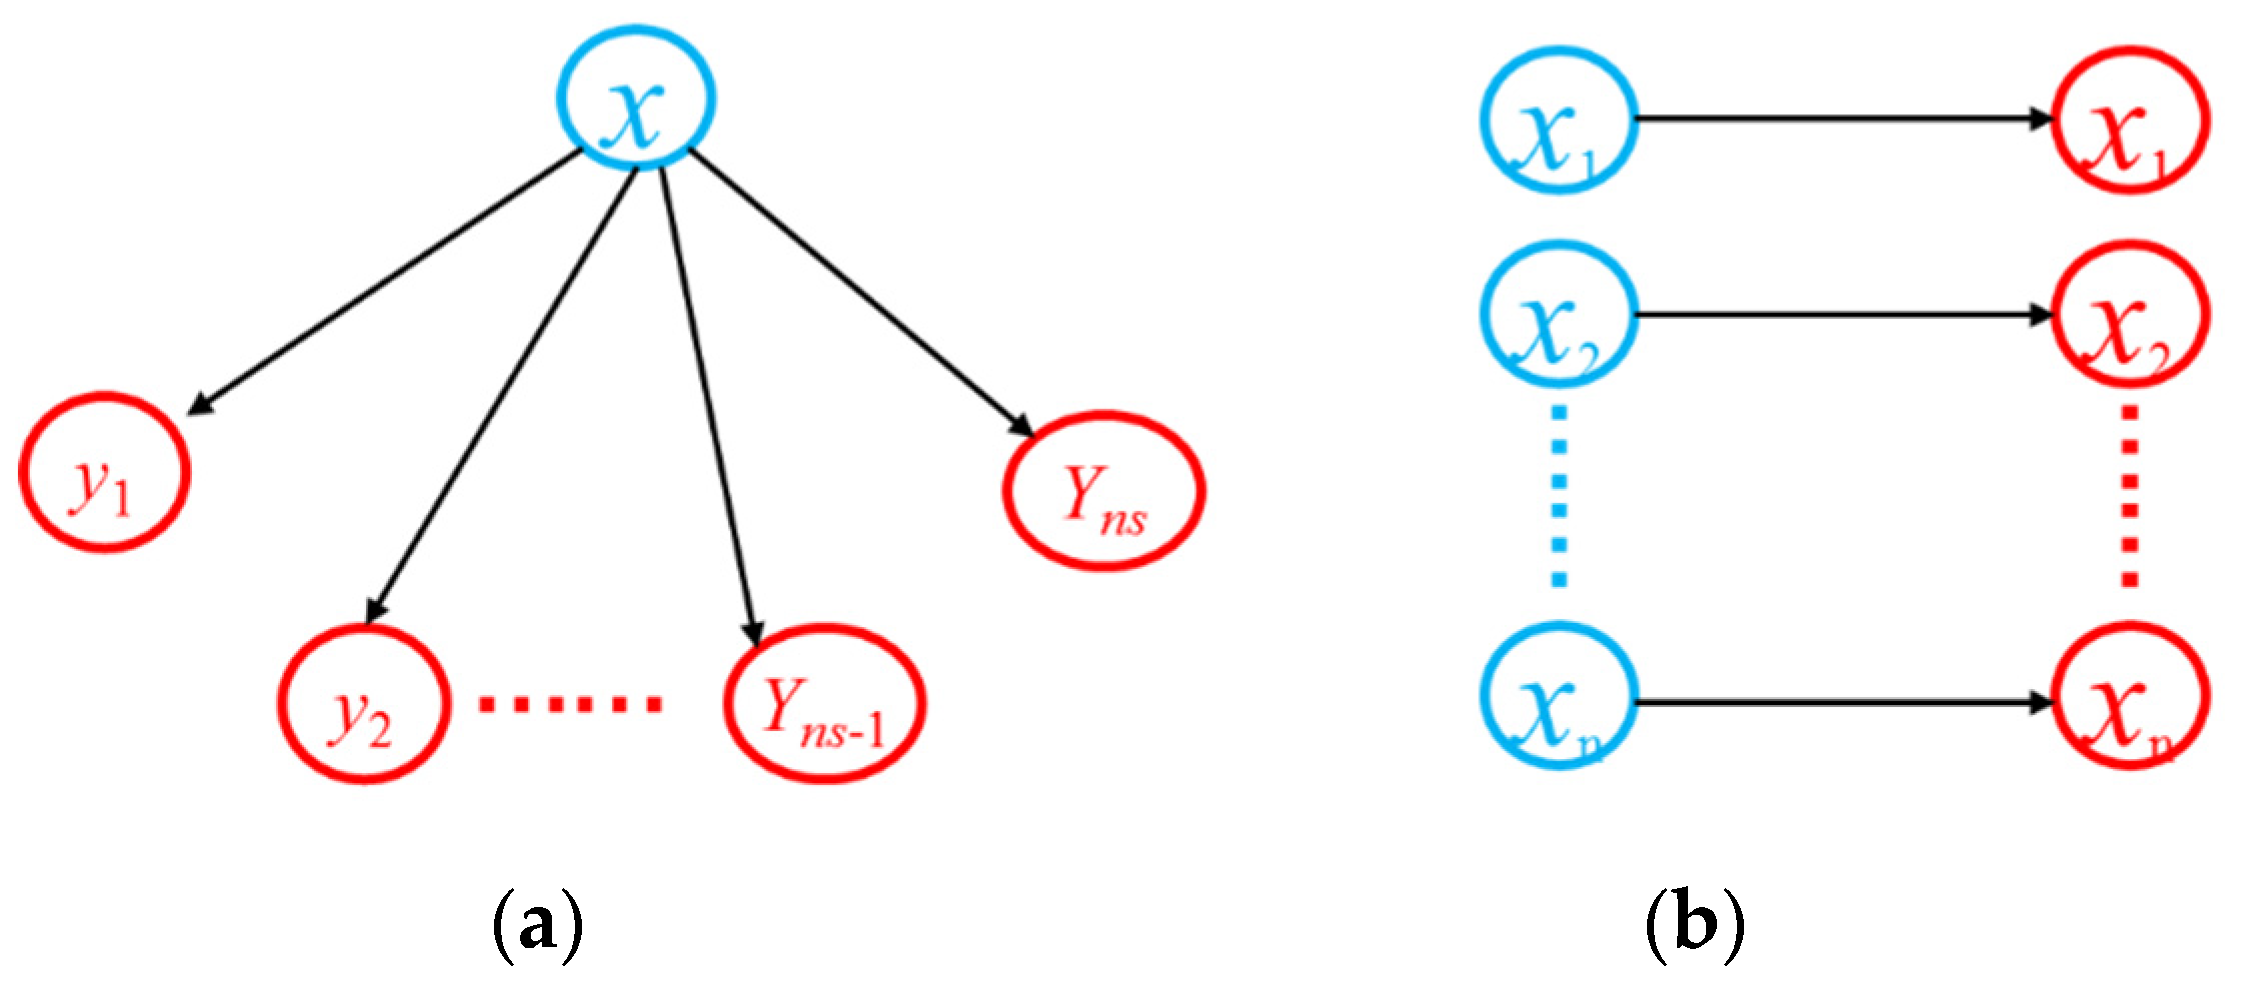
Therefore, Rockafellar and Wets proposed using progressive hedging (PH) decomposition algorithm to solve such problems [20]. The PH algorithm can effectively reduce the computational complexity of scenario-related optimization problems and solve sub-problems in parallel. PH algorithm has been widely used in unit commitment problems [21,22]. Figure 5 is a diagram comparing the decomposition scenario of the PH algorithm with the original problem.
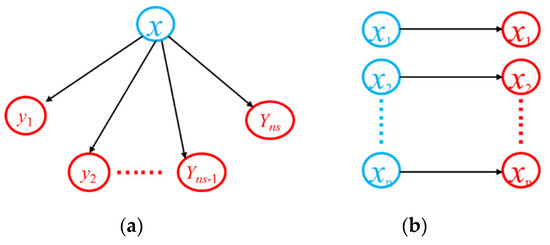
Figure 5.
Comparison of the original problem and PH decomposition. (a) Original problem (b) PH Decomposition.
As shown in Figure 5, the original problem is a two-stage optimization problem. PH algorithm decomposes the original two-stage stochastic optimization problem into Ns subproblems, where Ns is the number of scenarios. The original problem directly obtains the one-stage solution for all scenarios. While in the PH algorithm, each scenario can obtain the corresponding optimal one-stage solution yns. Then, based on the difference between the optimal solution xns in each scenario and the average value of the optimal solutions in all scenarios, a penalty term is added to the original objective function, which is repeated until the difference between the optimal solution xns in a single scenario and the average value is less than the threshold value.
5. Case Study
5.1. Introduction of Test System
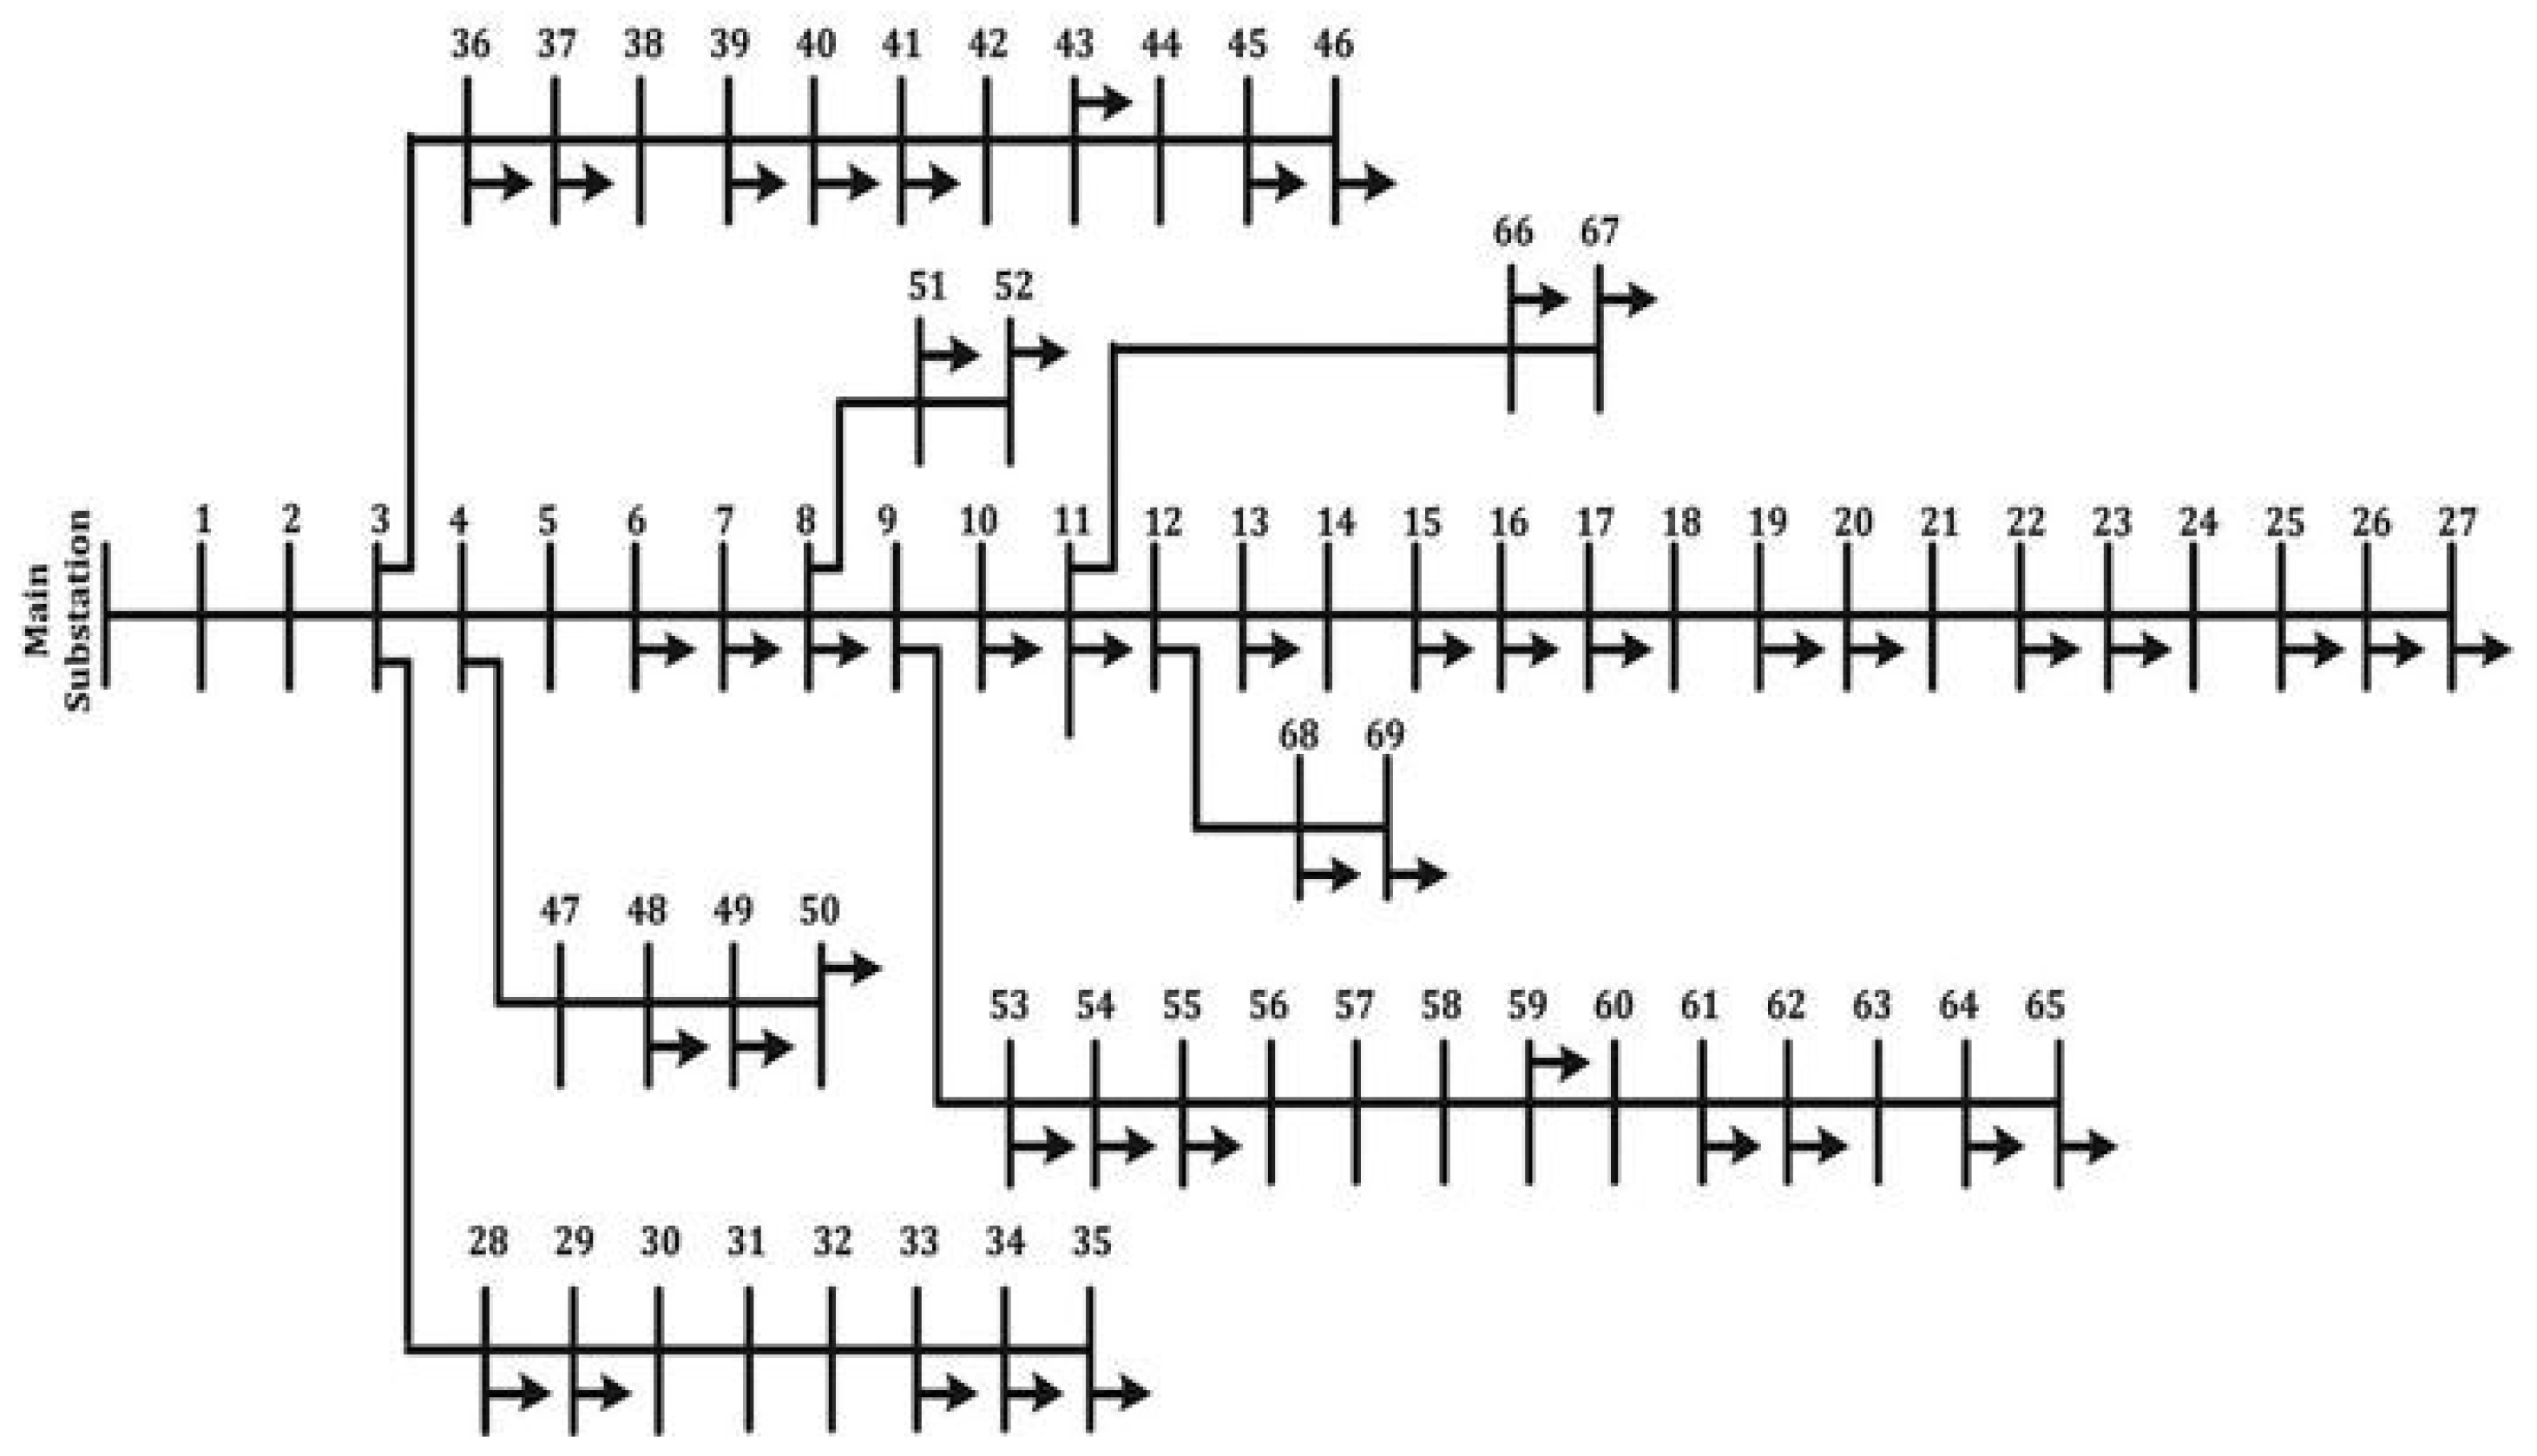
The dispatch model in Section 4 is applied to the IEEE-69 node system. The topology of the IEEE-69 node system is shown in Figure 6. The total load of the system is 6.715 MW, and the node load of the system can be referred to [23]. According to Ref. [24], the typical day in summer is selected to expand the node load by the hour. Basis capacity is Sbase = 100 MW, and basis voltage is Vbase = 12.66 kV. The upper and lower limits of node voltage amplitude are 1.05 p.u. and 0.95 p.u., respectively. The switching cost of the pre-dispatch operation is 1000$/times, and the power outage loss is 10$/kWh when the event occurs. According to the literature [25,26], the penalty coefficient of the PH algorithm is set to 1000, and the convergence threshold ε is 0.0001.
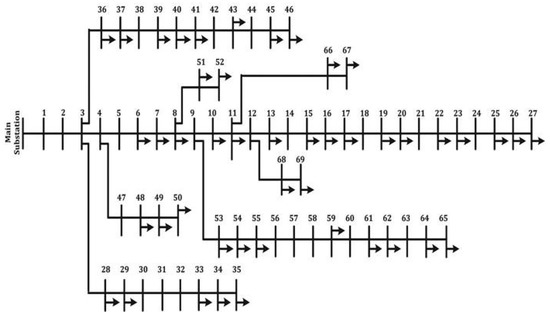
Figure 6.
Topology of the IEEE-69 system.
Set the duration of extreme weather events as 7 h, from 9 a.m. to 4 p.m. According to the predicted wind speed and the vulnerability curve of distribution lines in Figure 2, set the failure rate threshold Pstep of vulnerable lines as 0.05, and get that the vulnerable lines of the system are lines 7–8, 9–10, 12–13 and 13–14.
5.2. Analysis of Pre-Dispatch Results
The two-stage stochastic dispatch model is solved by MATLAB 2018a, using a desktop computer with Intel 5th processor and 8 G memory. The solution program is written in the Yalmip language and solved through solver Cplex 12.4. The solution time is 2395 s, and the PH algorithm converges after 12 iterations.
Next, we compare the two dispatch strategies of distribution networks to illustrate the effectiveness of the pre-dispatch model proposed in this paper.
Strategy 1: the distribution network maintains normal operation in advance;
Strategy 2: in advance, the distribution network implements the pre-dispatch strategy proposed in this paper.
The economic cost of the distribution grid under the two dispatching strategies is compared and analyzed, and the results are shown in Table 1.

Table 1.
Cost analysis under different preventive strategies.
When Strategy 1 is adopted, the cost of dispatch in advance was 0, but there was a large power outage loss of $130,362.85. This is because the distribution network has not been regulated in advance, and the distribution network operates in a high-risk state. Therefore, the consequences of line failure are serious and the loss of power failure is high. When the pre-dispatch strategy 2 is adopted, three switch actions occurred, each switching operation cost was $1000, and the cost of pre-dispatch switch was $3000. After this switch operation, the distribution network operates in a low-risk state, the fault influence range of the distribution line is small, the power failure loss is reduced. By comparing the results of strategy-1 and strategy-2, we can see that a certain dispatch cost of $3000 is needed before a typhoon occurs, but the power outage loss in dispatch is reduced by $6397.09.
As shown in Table 2 above, there is no line fault in the distribution network from time 1 to 3, and the pre-dispatch strategy-2 has a smaller load shedding amount of about 0.26 MW. After line 12–13 failure, the fault consequence of the pre-dispatch strategy-2 is small, so the load shedding amount from time 4 to time 5 is far less than the strategy-1. The sum of load shedding amount using strategy 1 under this scenario is 13.56 MWh. The load shedding amount using strategy-2 is 10.29 MWh, which reduces 3.27 MWh compared with strategy 1 in advance. It illustrates the feasibility and effectiveness of adopting the pre-dispatch strategy 2 under this scenario.

Table 2.
Comparison of system load shedding amount under two dispatch strategies.
Based on the above analysis, for the distribution network without automatic access, the switching state of switchgear can be adjusted before extreme weather occurs, and the topology can be changed to the state with fewer fault consequences. This pre-dispatch method is able to use less pre-dispatch costs instead of large amounts of losses caused by extreme weather, which is technically and economically feasible.
6. Conclusions
In view of the lack of researches on the pre-dispatch of distribution networks, this paper establishes a fault consequence model of distribution lines based on block breaker correlation matrix and circuit breaker trip identifier. Combined with the line fault scenario generation method, a pre-dispatch model of distribution network considering the consequences of random failure is proposed, and the PH algorithm is used to solve the two-stage stochastic optimization model. The following conclusions are obtained from the research on the IEEE-69 node system. The proposed method can effectively reduce the adverse effects and economic losses caused by extreme weather represented by a typhoon, and improve the resilience of the power grid. The model solving method based on the PH algorithm has good convergence and robustness and meets the requirements of online calculation in practical application.
In the future, the following points can be further studied. Firstly, the action mechanism, evolution process and uncertainty modeling of extreme weather such as typhoons and icing will be carried out in the future. Secondly, for the power system with automation access, how to consider communication delay and congestion in the practical application is still a difficult problem. Last but not the least, when the towers and lines in the distribution networks operate in an abnormal state, maintenance personnel should consider the dynamic characteristics of the traffic network, thus reducing economic loss.
Author Contributions
Conceptualization, T.H. and J.T.; methodology, Z.W. and Y.W.; software, X.L.; validation, S.X., W.W.; formal analysis, Y.M. and C.L.; investigation, T.N.; writing—original draft preparation, F.L. All authors have read and agreed to the published version of the manuscript.
Funding
This research was funded by Science and technology projects of State Grid Zhejiang Electric Power Co., Ltd. 2021ZK37 (Research on partition coordinated self-healing recovery technology of power system based on artificial intelligence).
Conflicts of Interest
The authors declare no conflict of interest.
References
- Xu, S.; Chen, J.; Duan, X. Review of the interaction between global warming and power system. Power Syst. Technol. 2010, 34, 33–40. [Google Scholar]
- Zhang, J.; Wei, J.; Li, X. Influence of Typhoon on cascading failure of power system. Power Autom. Equip. 2019, 10, 131–142. [Google Scholar]
- Lu, J.; Zhang, H.; Fang, Z. Monitoring results and analysis of ice disaster in Hunan power system. Power Syst. Prot. Control 2009, 12, 99–105. [Google Scholar]
- Yang, Y.; Tang, W.; Liu, Y.; Xin, Y.; Wu, Q. Quantitative Resilience Assessment for Power Transmission Systems Under Typhoon Weather. IEEE Access 2018, 6, 40747–40756. [Google Scholar] [CrossRef]
- Zhou, J. Short term comprehensive expansion planning of transmission network considering static security risk. Power Syst. Autom. 2010, 34, 22–25. [Google Scholar]
- Gao, H.; Chen, Y.; Huang, S. Distribution network resilience and its related research progress. Power Syst. Autom. 2015, 23, 1–8. [Google Scholar]
- Zhao, X.; Fang, H.; Wang, G. Component importance evaluation method for disaster prevention and mitigation of flexible distribution network. Power Syst. Prot. Control 2020, 16, 28–36. [Google Scholar]
- Yan, M.; Guo, W.; Hu, Y. Intelligent fault diagnosis method of distribution network based on 5G. Electr. Meas. Instrum. 2021, 5, 1–8. [Google Scholar]
- Amirioun, M.H.; Aminifar, F.; Lesani, H. Resilience-Oriented Proactive Management of Microgrids Against Windstorms. IEEE Trans. Power Syst. 2018, 4, 4275–4284. [Google Scholar] [CrossRef]
- Amirioun, M.H.; Aminifar, F.; Lesani, H. Towards Proactive Scheduling of Microgrids Against Extreme Floods. IEEE Trans. Smart Grid 2018, 4, 3900–3902. [Google Scholar] [CrossRef]
- Taheri, B.; Safdarian, A.; Moeini-Aghtaie, M.; Lehtonen, M. Enhancing Resilience Level of Power Distribution Systems Using Proactive Operational Actions. IEEE Access 2019, 1, 137378–137389. [Google Scholar] [CrossRef]
- Ma, Z. Present situation and Prospect of distribution automation in China. J. Shandong Electr. Power Coll. 2005, 1, 76–79. [Google Scholar]
- Tang, W.; Zhao, Y. Thinking on the intelligent construction of rural power grid. J. Electr. Power Sci. Technol. 2010, 4, 31–35. [Google Scholar]
- Lin, Y.; Chen, B.; Wang, J. A Combined Repair Crew Dispatch Problem for Resilient Electric and Natural Gas System Considering Reconfiguration and DG Islanding. IEEE Trans. Power Syst. 2019, 4, 2755–2767. [Google Scholar] [CrossRef]
- Gao, H.; Chen, Y.; Mei, S. Resilience-Oriented Pre-Hurricane Resource Allocation in Distribution Systems Considering Electric Buses. Proc. IEEE 2017, 105, 1214–1233. [Google Scholar] [CrossRef]
- Shafieezadeh, A.; Onyewuchi, U.; Begovic, M.; DesRoches, R. Age-dependent Fragility Models of Utility Wood Poles in Power Distribution Networks against Extreme Wind hazards. IEEE Trans. Power Deli 2014, 29, 131–139. [Google Scholar] [CrossRef]
- Liu, T.; Sun, R.; Liu, Y.; Wang, C. A Resilience Enhancement Scheme of Cyber-Physical Power System for Extreme Natural Disasters. In Proceedings of the 2020 IEEE Sustainable Power and Energy Conference (iSPEC), Chengdu, China, 23–25 November 2020; pp. 1684–1689. [Google Scholar]
- Xie, K.; Zhou, P.; Zhou, J. Reliability evaluation algorithm of complex medium voltage distribution system based on fault diffusion. Power Syst. Autom. 2001, 4, 45–48. [Google Scholar]
- Omisch, W.R.; Vigerske, S. Recent Progress in Two-stage Mixedinteger Stochastic Programming with Applications to Power Production Planning. In Handbook of Power Systems I; Springer: Berlin/Heidelberg, Germany, 2010; pp. 177–208. [Google Scholar]
- Rockafellar, R.T.; Wets, R.J. Scenarios and Policy Aggregation in Optimization under Uncertainty. Math. Oper. Res. 1991, 16, 119–147. [Google Scholar] [CrossRef] [Green Version]
- Ryan, S.M.; Wets, R.J.B.; Woodruff, D.L. Toward Scalable, Parallel Progressive Hedging for Stochastic Unit Commitment. In Proceedings of the 2013 IEEE Power and Energy Society General Meeting, Vancouver, BC, Canada, 21–25 July 2013; Institute of Electrical and Electronics Engineers: Piscataway, NJ, USA, 2013. [Google Scholar]
- Munoz, F.D.; Watson, J.P. A Scalable Solution Framework for Stochastic Transmission and Generation Planning Problems. Comput. Manag. Sci. 2015, 12, 491–518. [Google Scholar] [CrossRef]
- Baran, M.E.; Wu, F.F. Network Reconfiguration in Distribution Systems for Loss Reduction and Load Balancing. IEEE Trans. Power Deli 1989, 4, 1401–1407. [Google Scholar] [CrossRef]
- Grigg, C. The IEEE Reliability Test System-1996: A Report Prepared by the Reliability Test System Task Force of the Application of Probability Methods Subcommittee. IEEE Trans. Power Syst. 1999, 14, 1010–1020. [Google Scholar] [CrossRef]
- Watson, J.; Woodruf, D. Progressive Hedging Innovations for a Class of Stochastic Mixed-integer Resource Allocation Problems. Comput. Manag. Sci. 2011, 8, 355–370. [Google Scholar] [CrossRef]
- Yao, Y.; Xu, J.; Cui, Q. Optimal reconfiguration model of distribution network with distributed generation based on DistFlow. Energy Eng. 2020, 1, 12–16. [Google Scholar]
Publisher’s Note: MDPI stays neutral with regard to jurisdictional claims in published maps and institutional affiliations. |
© 2021 by the authors. Licensee MDPI, Basel, Switzerland. This article is an open access article distributed under the terms and conditions of the Creative Commons Attribution (CC BY) license (https://creativecommons.org/licenses/by/4.0/).

