
Conceptual Process Design, Energy and Economic Analysis of Solid Waste to Hydrocarbon Fuels via Thermochemical Processes


Abstract
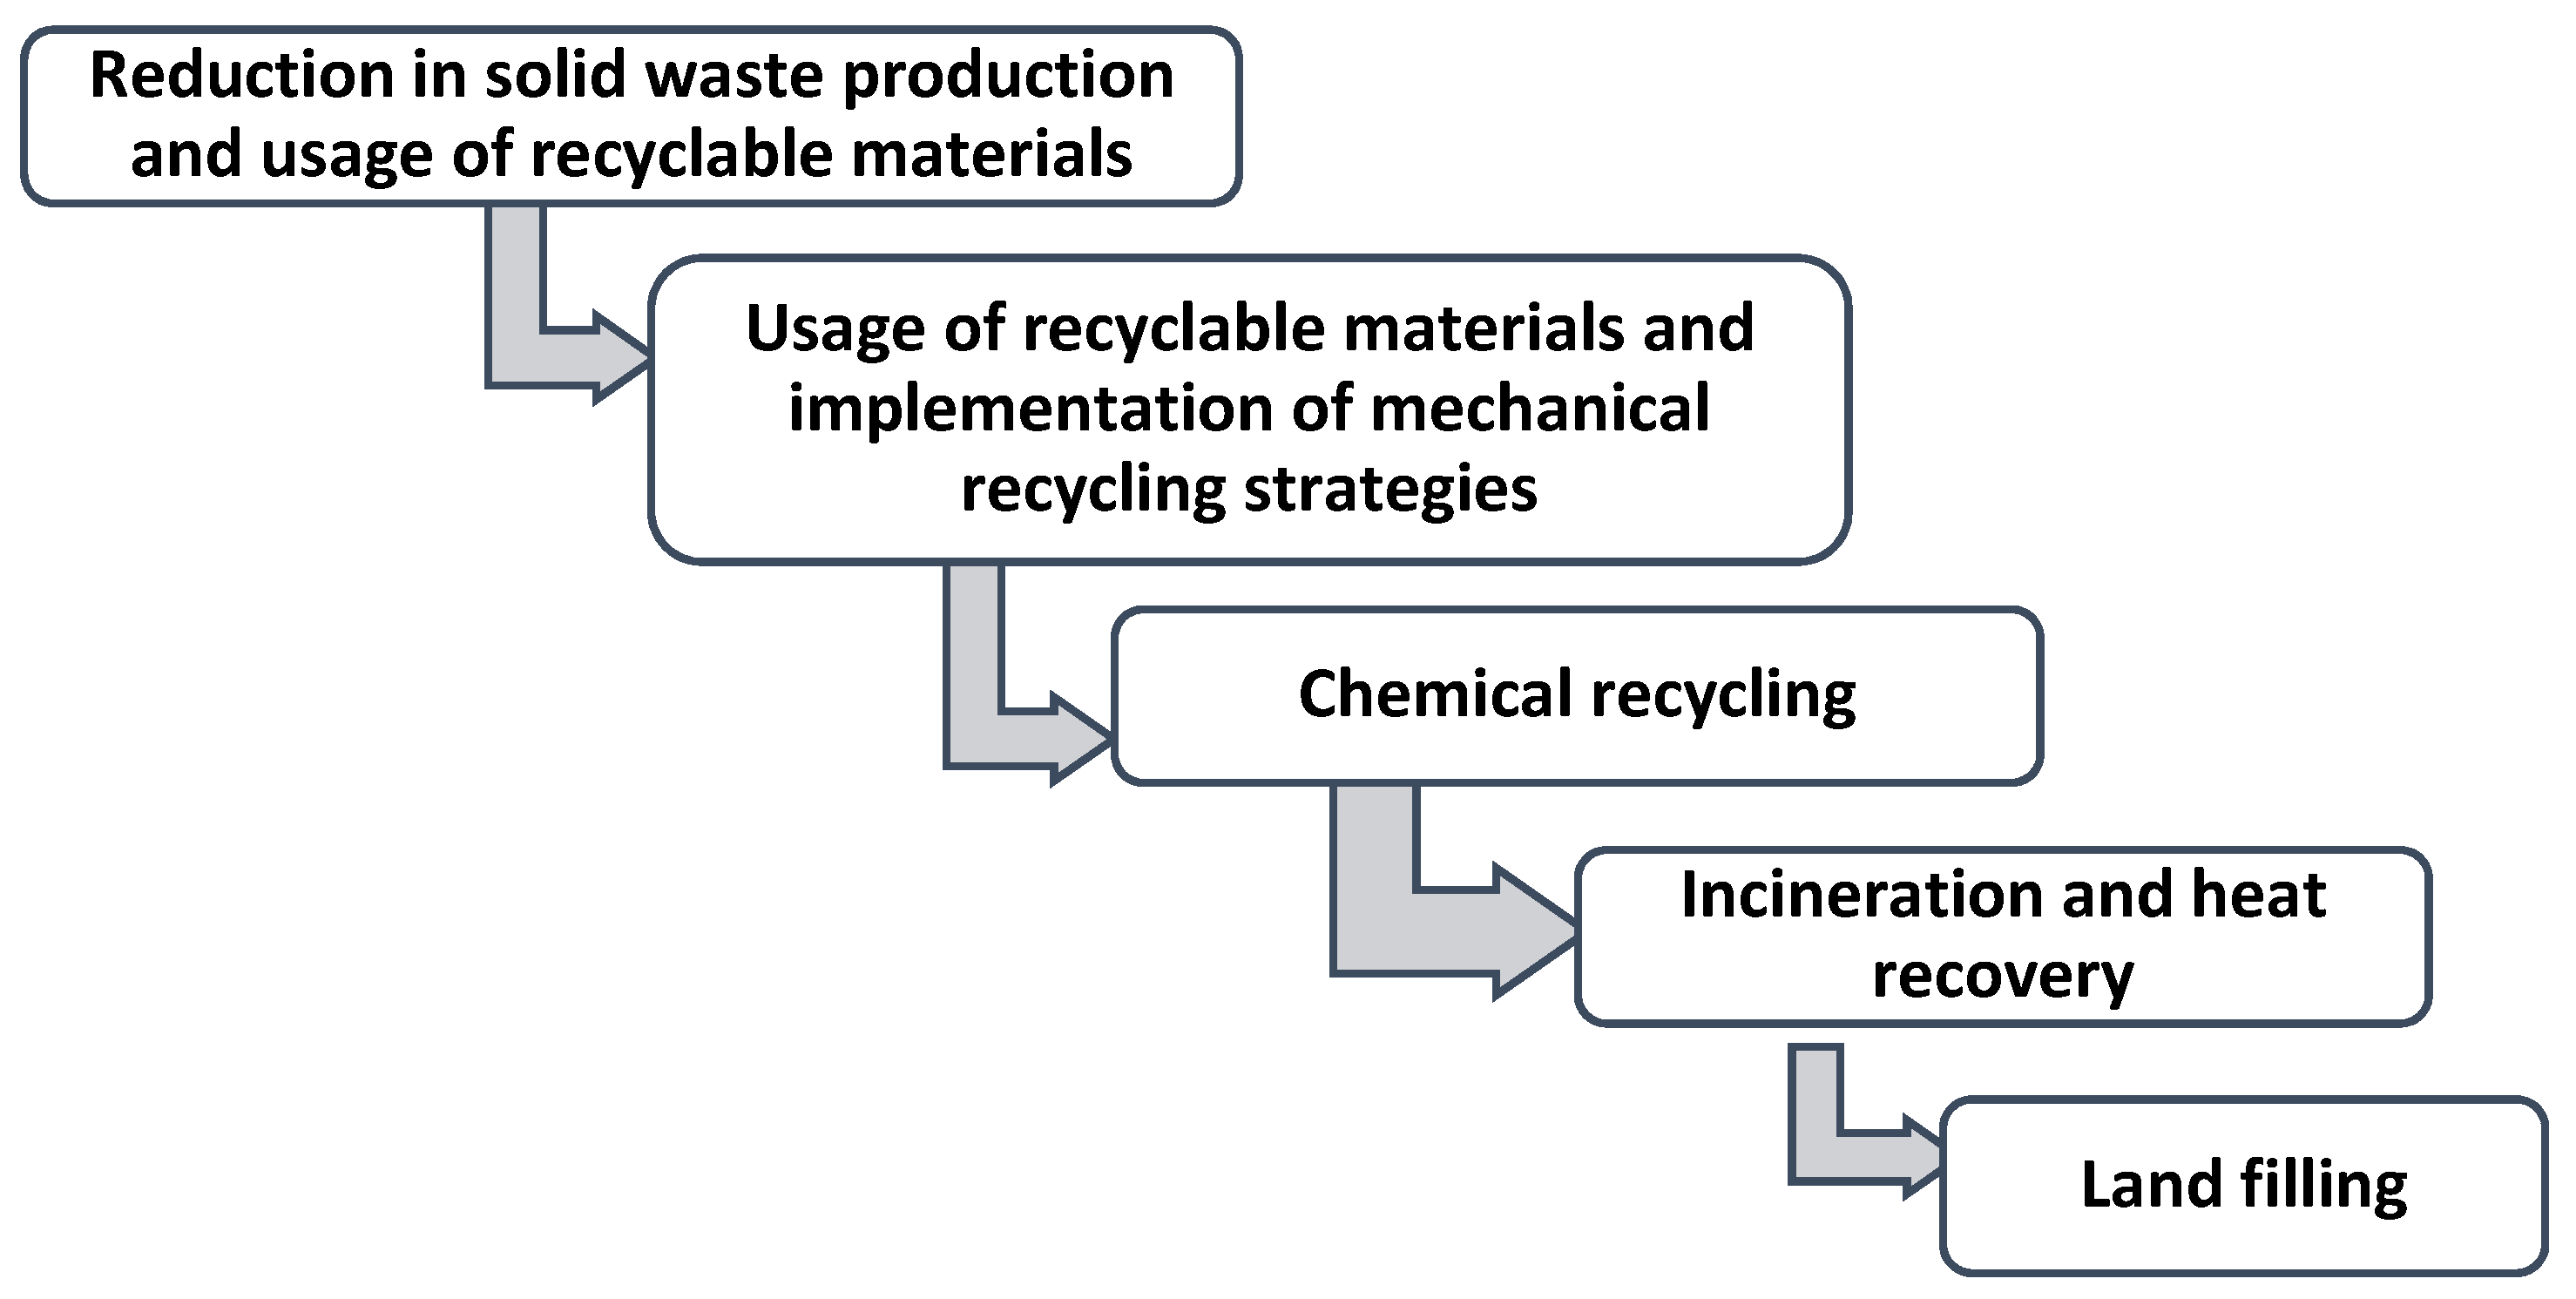
:1. Introduction
2. Conceptual Design and Process Description of Thermochemical Processes
2.1. Thermochemical Processes Chain Reactions
2.1.1. Solid Waste Pyrolysis Chain Reactions
- 2C + O2 → 2CO − 110 MJ/mol Incomplete combustion
- 2CO + O2 → 2CO2 − 280 MJ/mol Complete combustion of CO
- C + O2 → CO2 − 392 MJ/mol Complete Oxidation
- H2 + ½ O2 → H2O − 240 MJ/mol Hydrogen combustion
- 2CnHm + nO2 → nCO + m H2 Exothermic reaction CnHm incomplete oxidation
2.1.2. Solid Waste Gasification Chain Reactions
- C + H2O → CO + H2 130 MJ/Kmol Redox reaction
- CO + H2O → CO2 + H2 41 MJ/Kmol Water–gas reaction
- CH4 + H2O → CO + 3H2 + 206 MJ/Kmol Steam and methane reformation
- CnHm + nH2O → CO + 3H2 Endothermic Steam reformation
2.1.3. Solid Waste Gasification Chain Reactions with Carbon Dioxide
- C + CO2 → 2CO + 172 MJ/kmol Boudouard reaction
- CnHm + nCO2 → 2nCO + m/2 H2 Endothermic Reforming
2.1.4. Tar and Hydrocarbons Decomposition Reactions
- pCxHy → qCnHm + rH2 Hydrogenation
- CnHm → nC + m/2 H2 Carbonization
2.2. Thermochemical Reactions Process Block Diagrams (PBD)
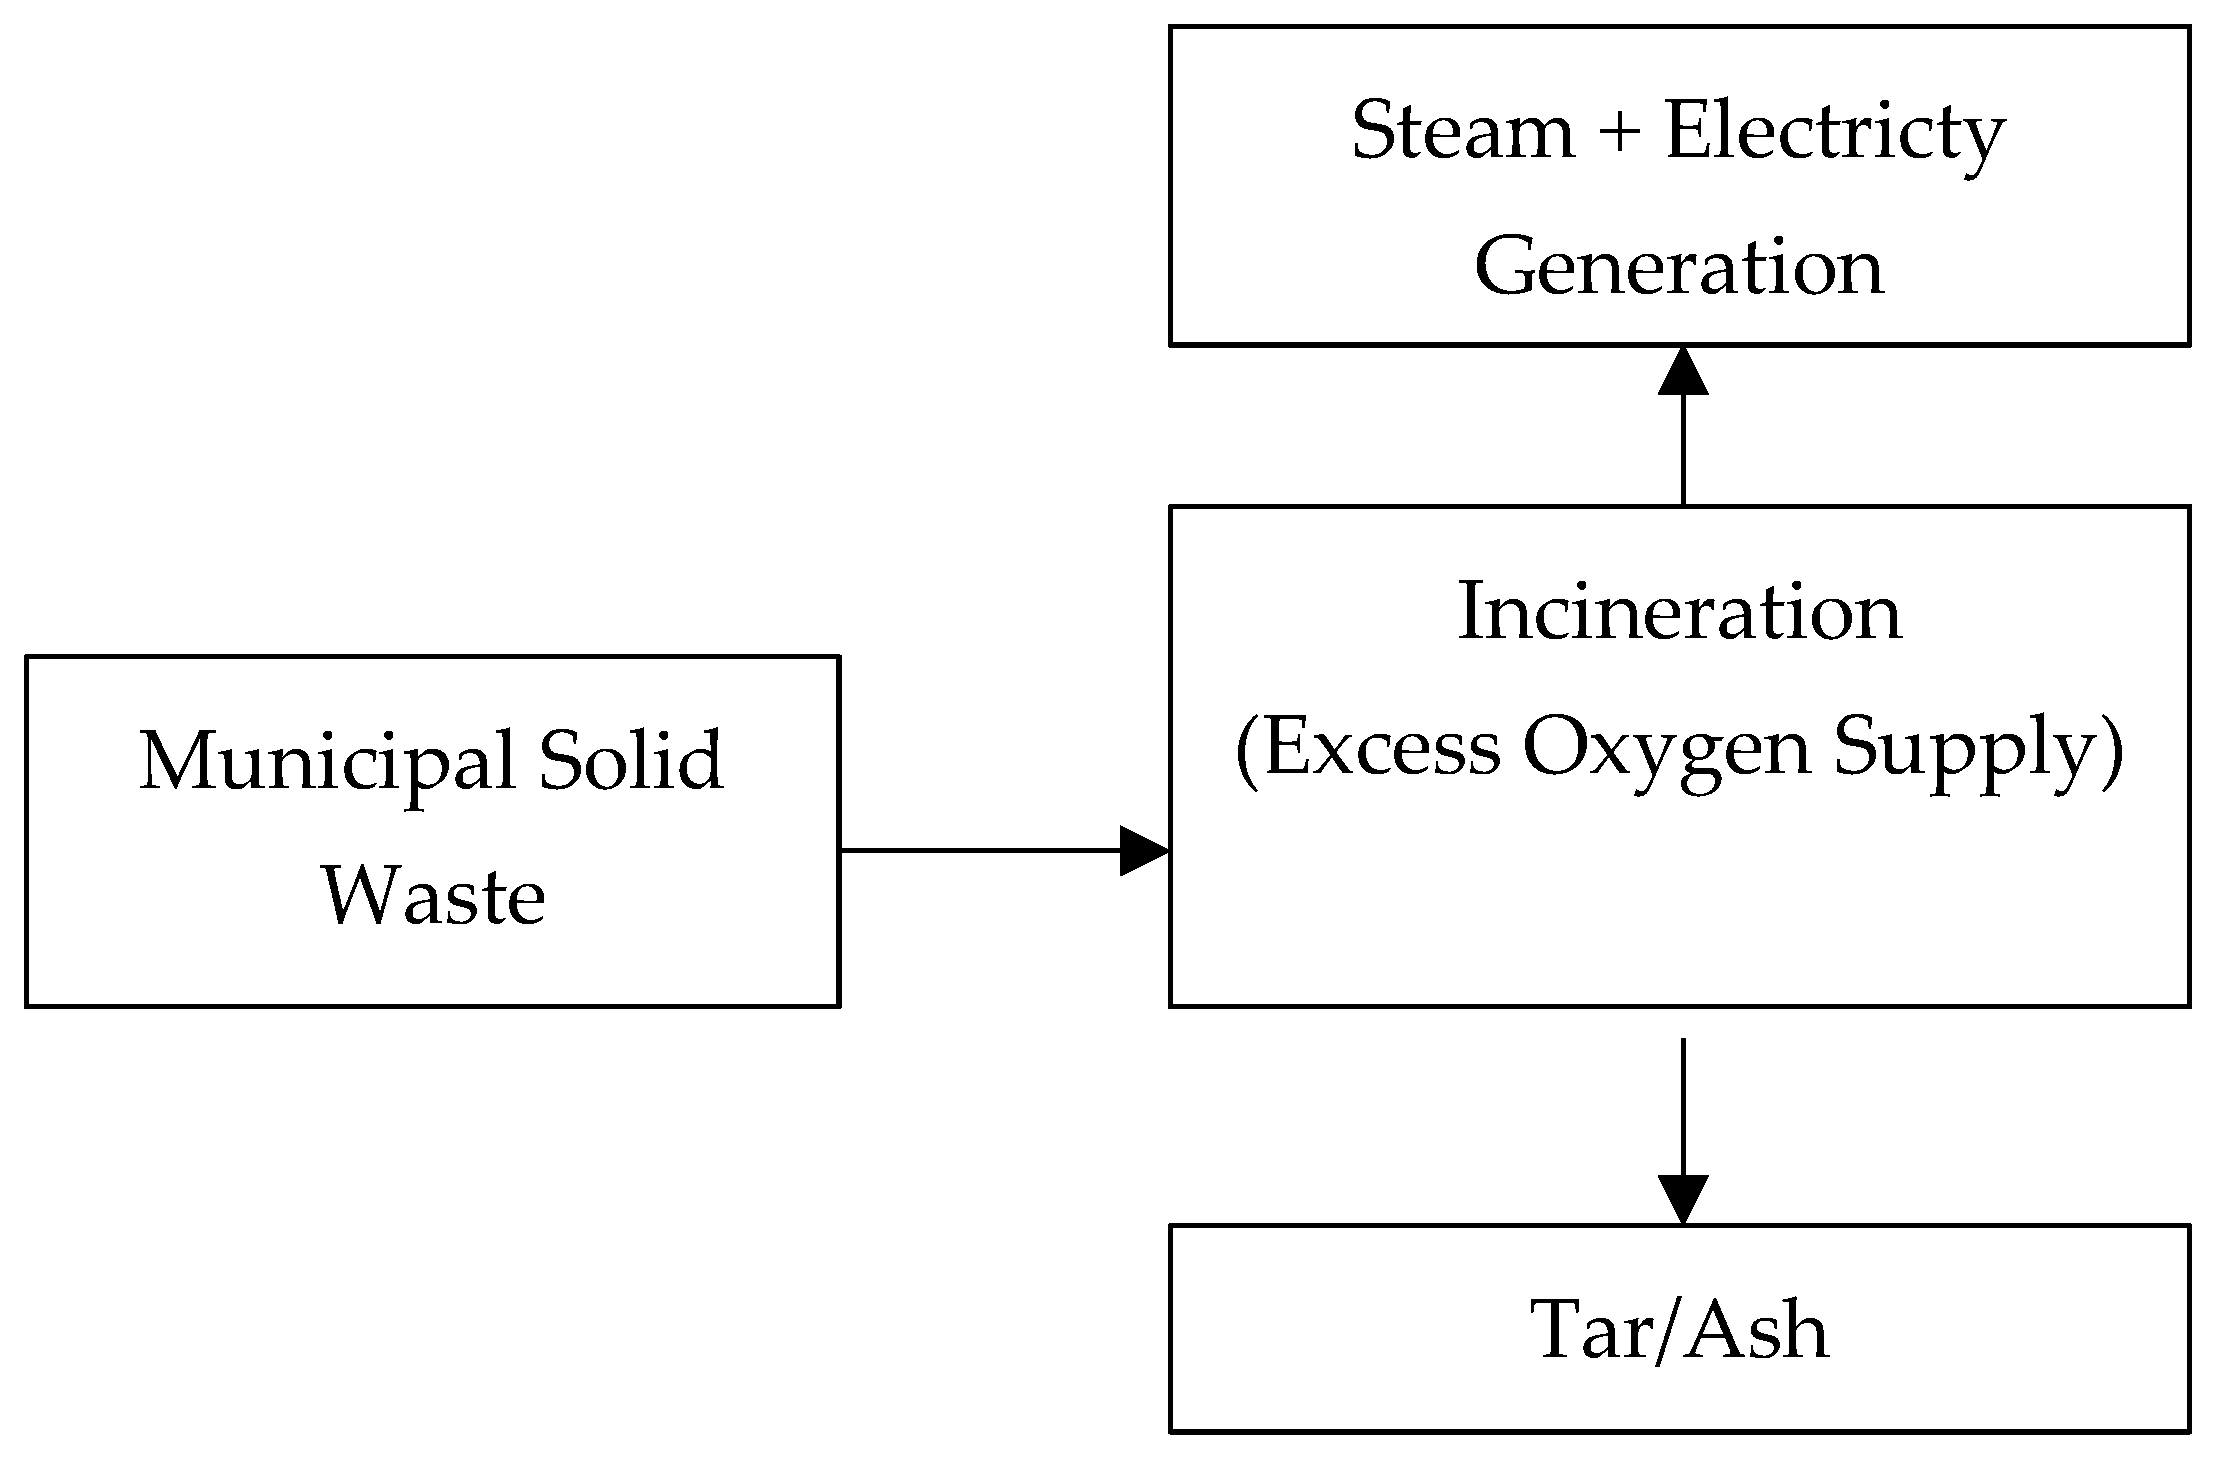
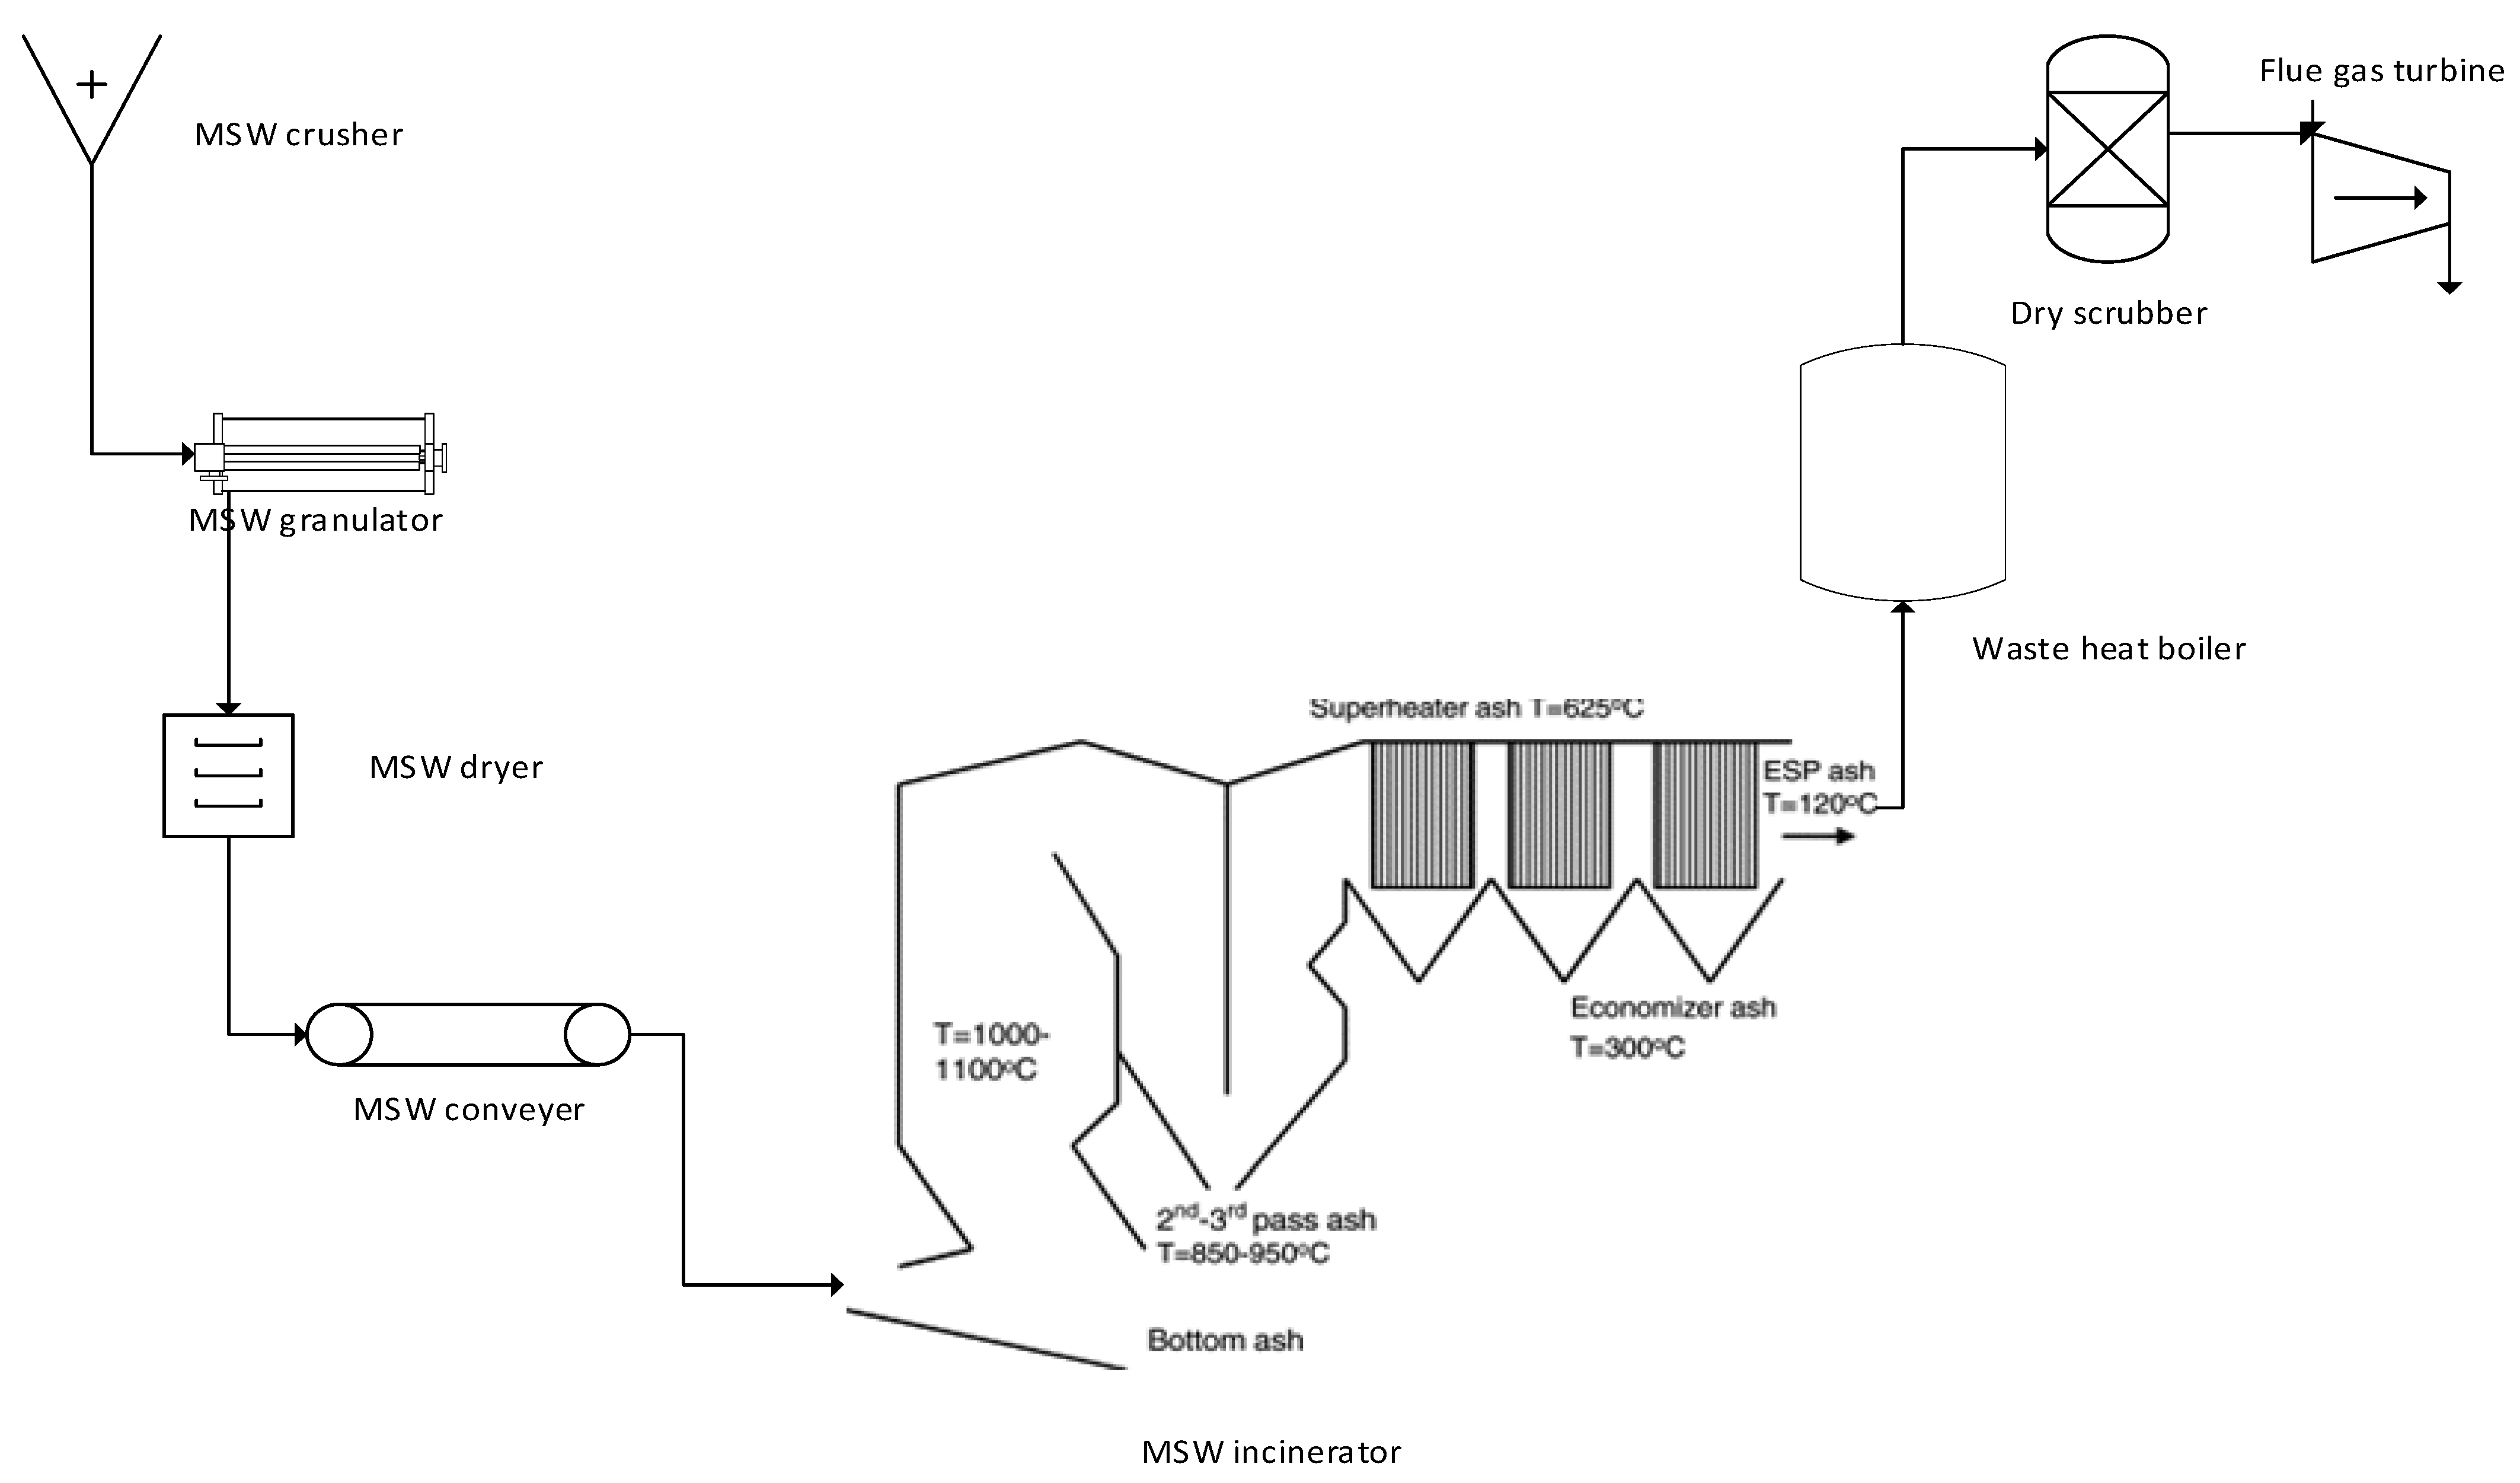
2.2.1. Incineration Process
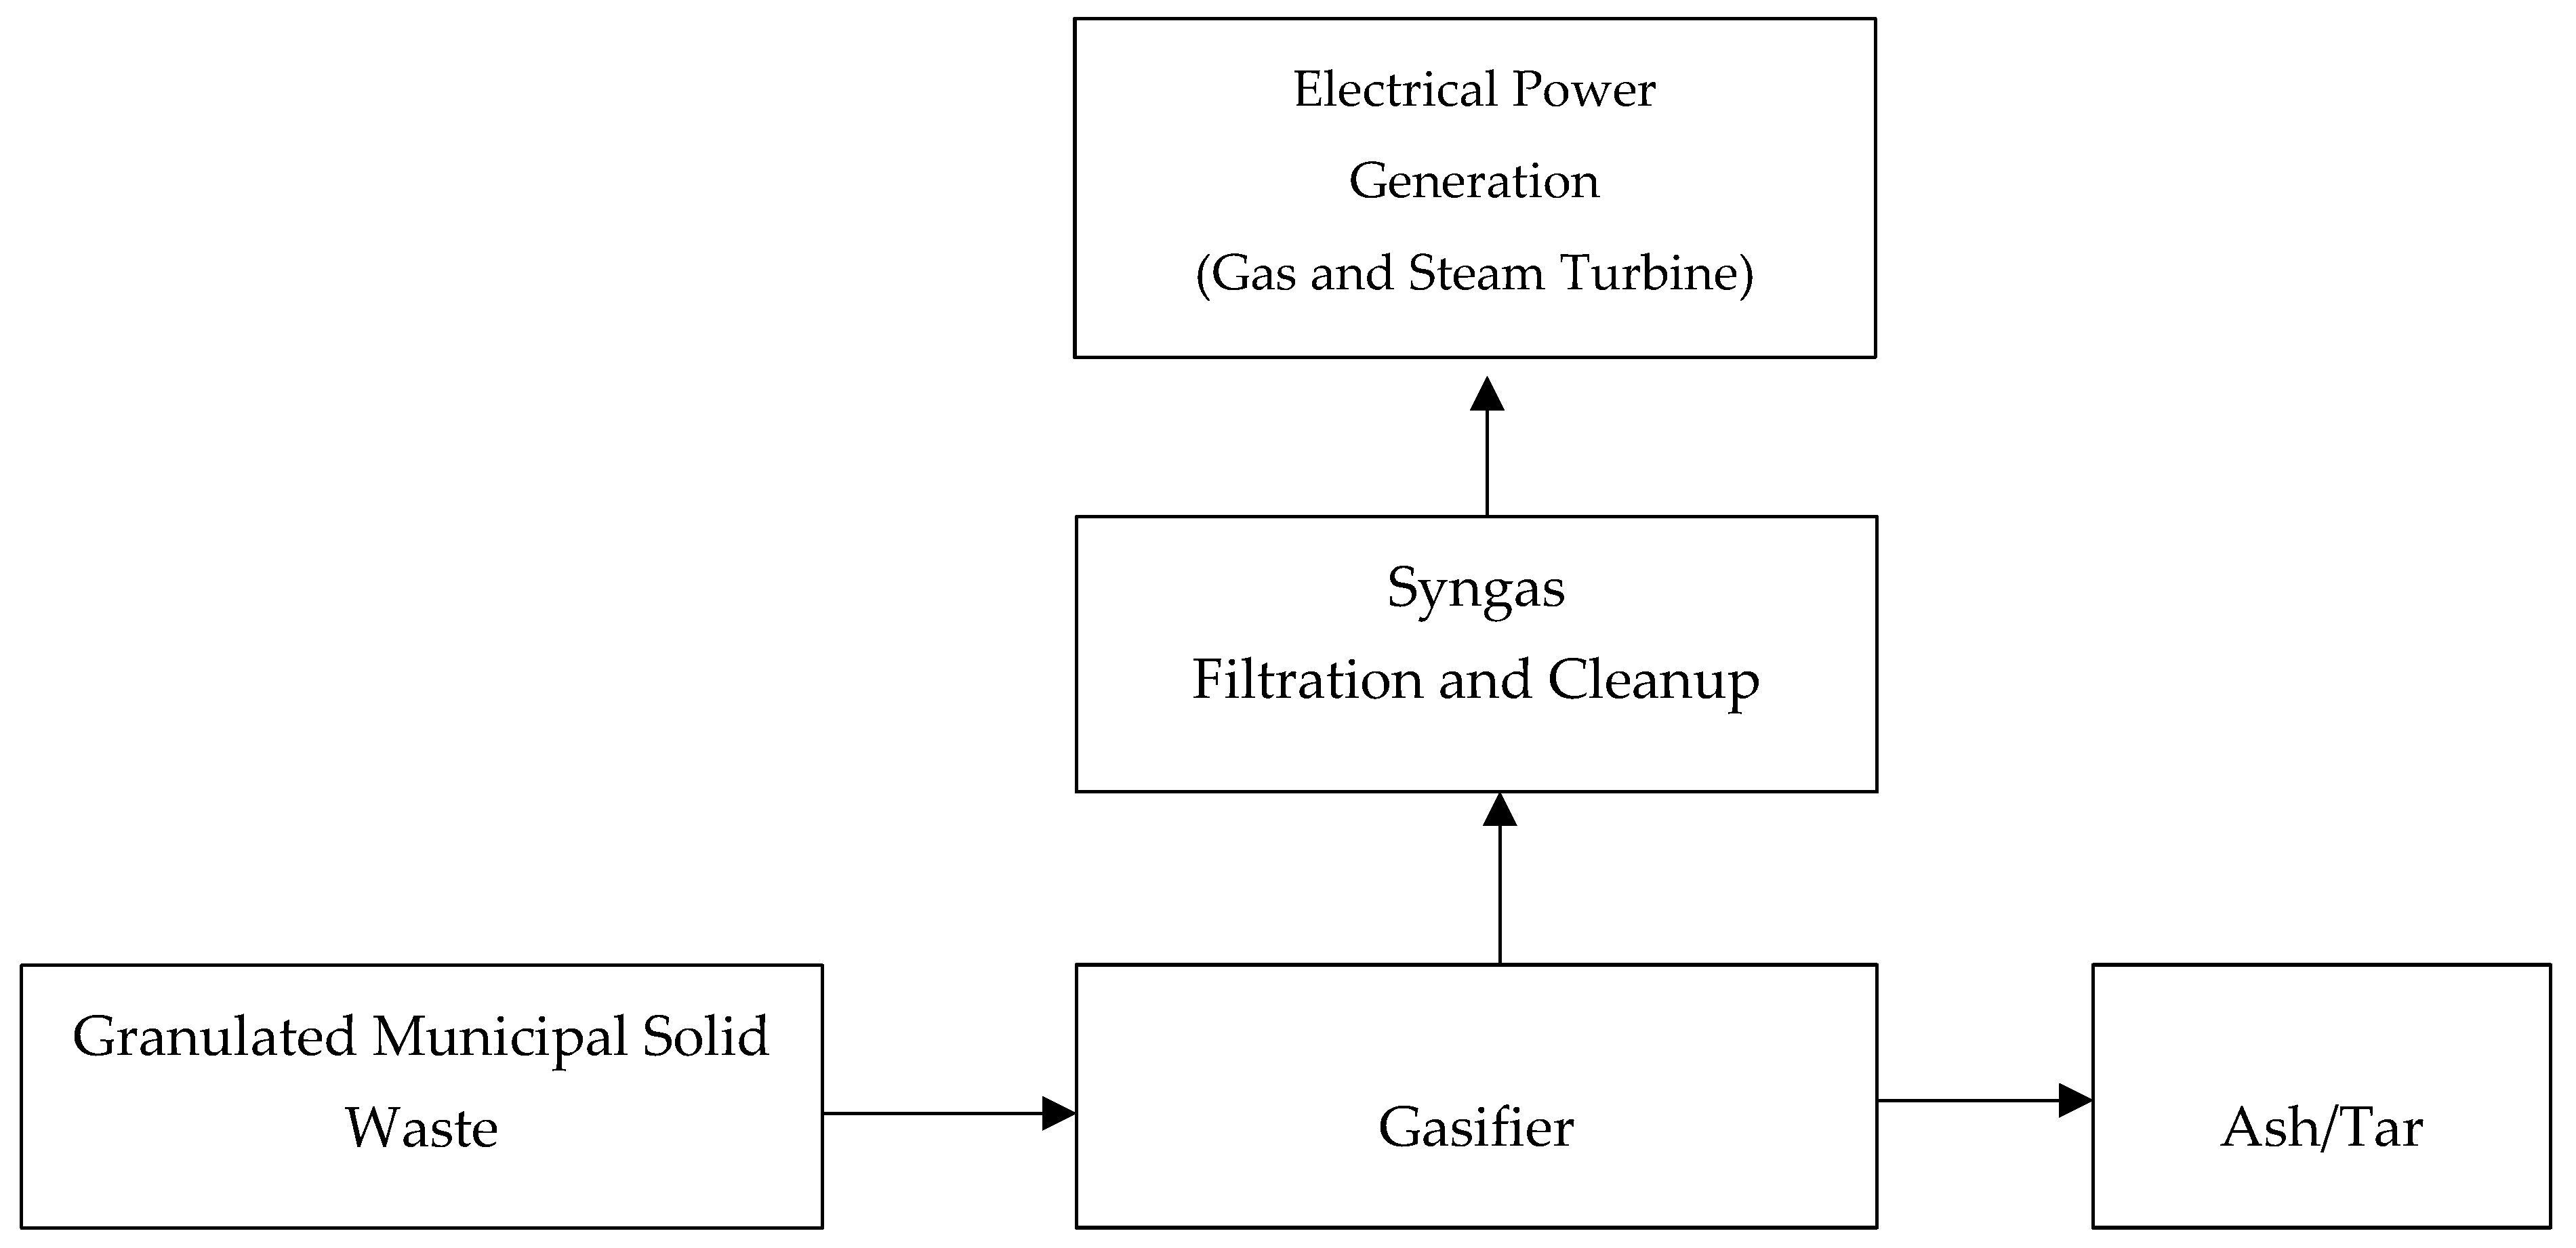
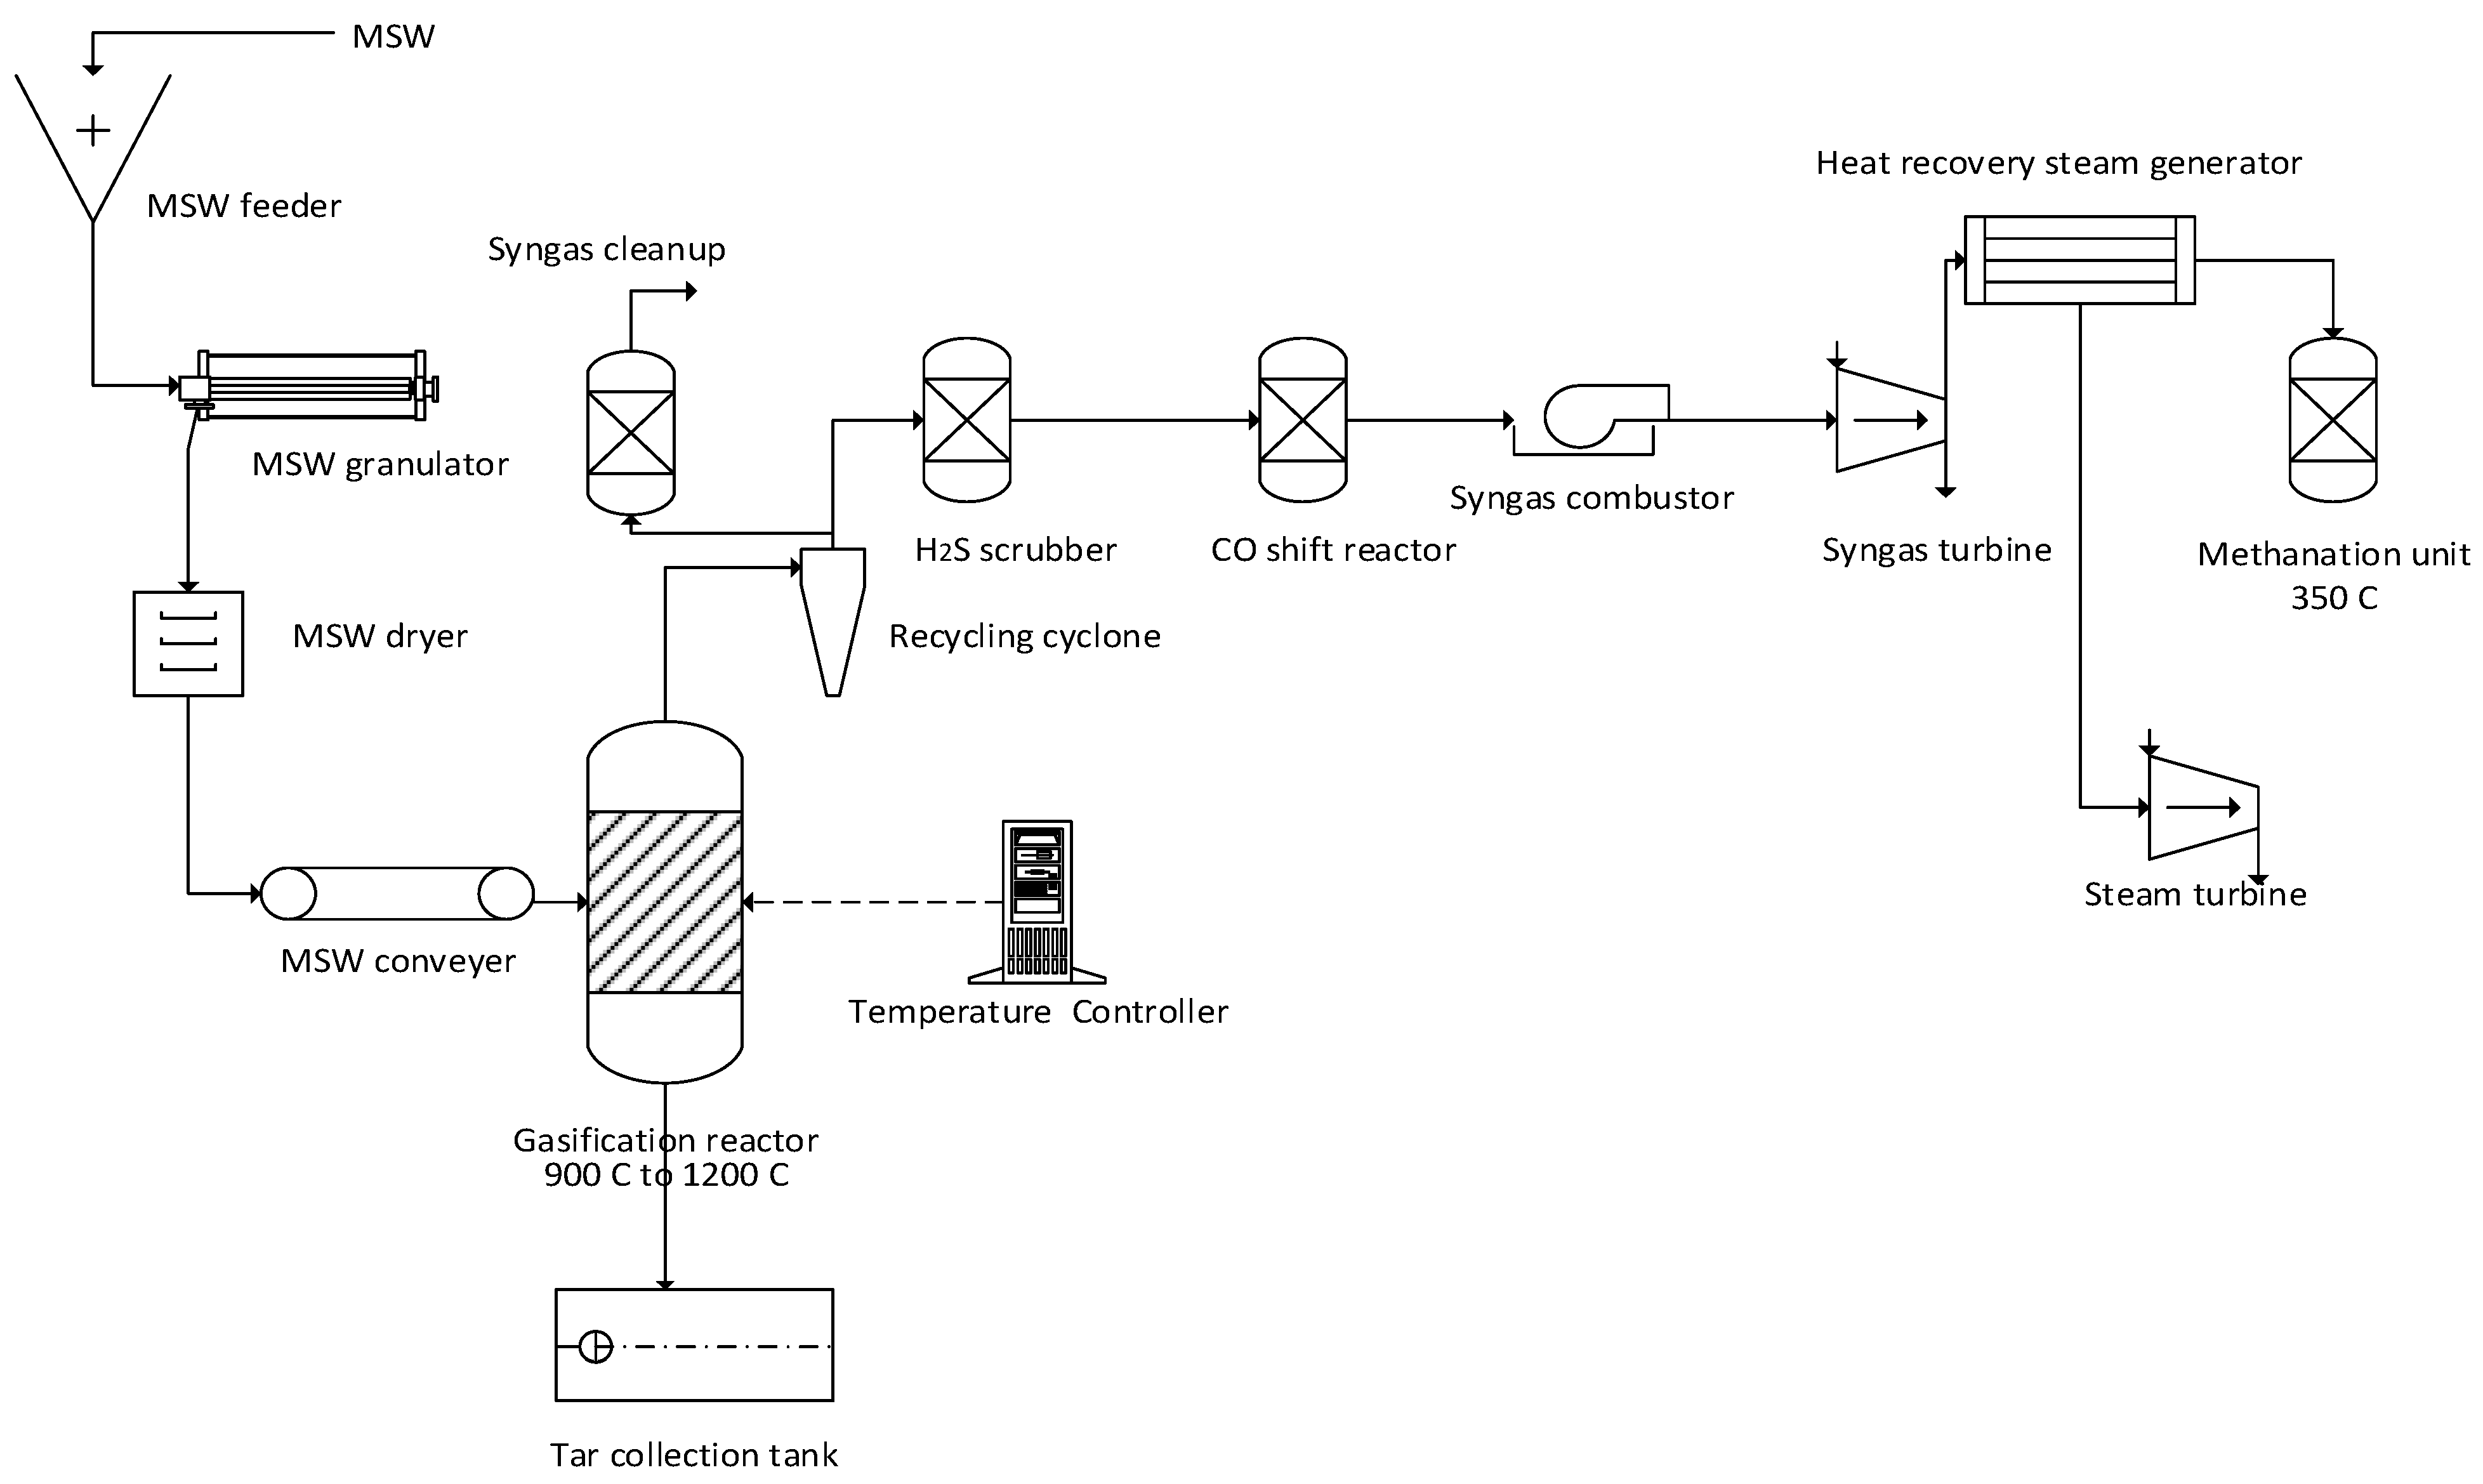
2.2.2. Solid Waste Gasification Process System
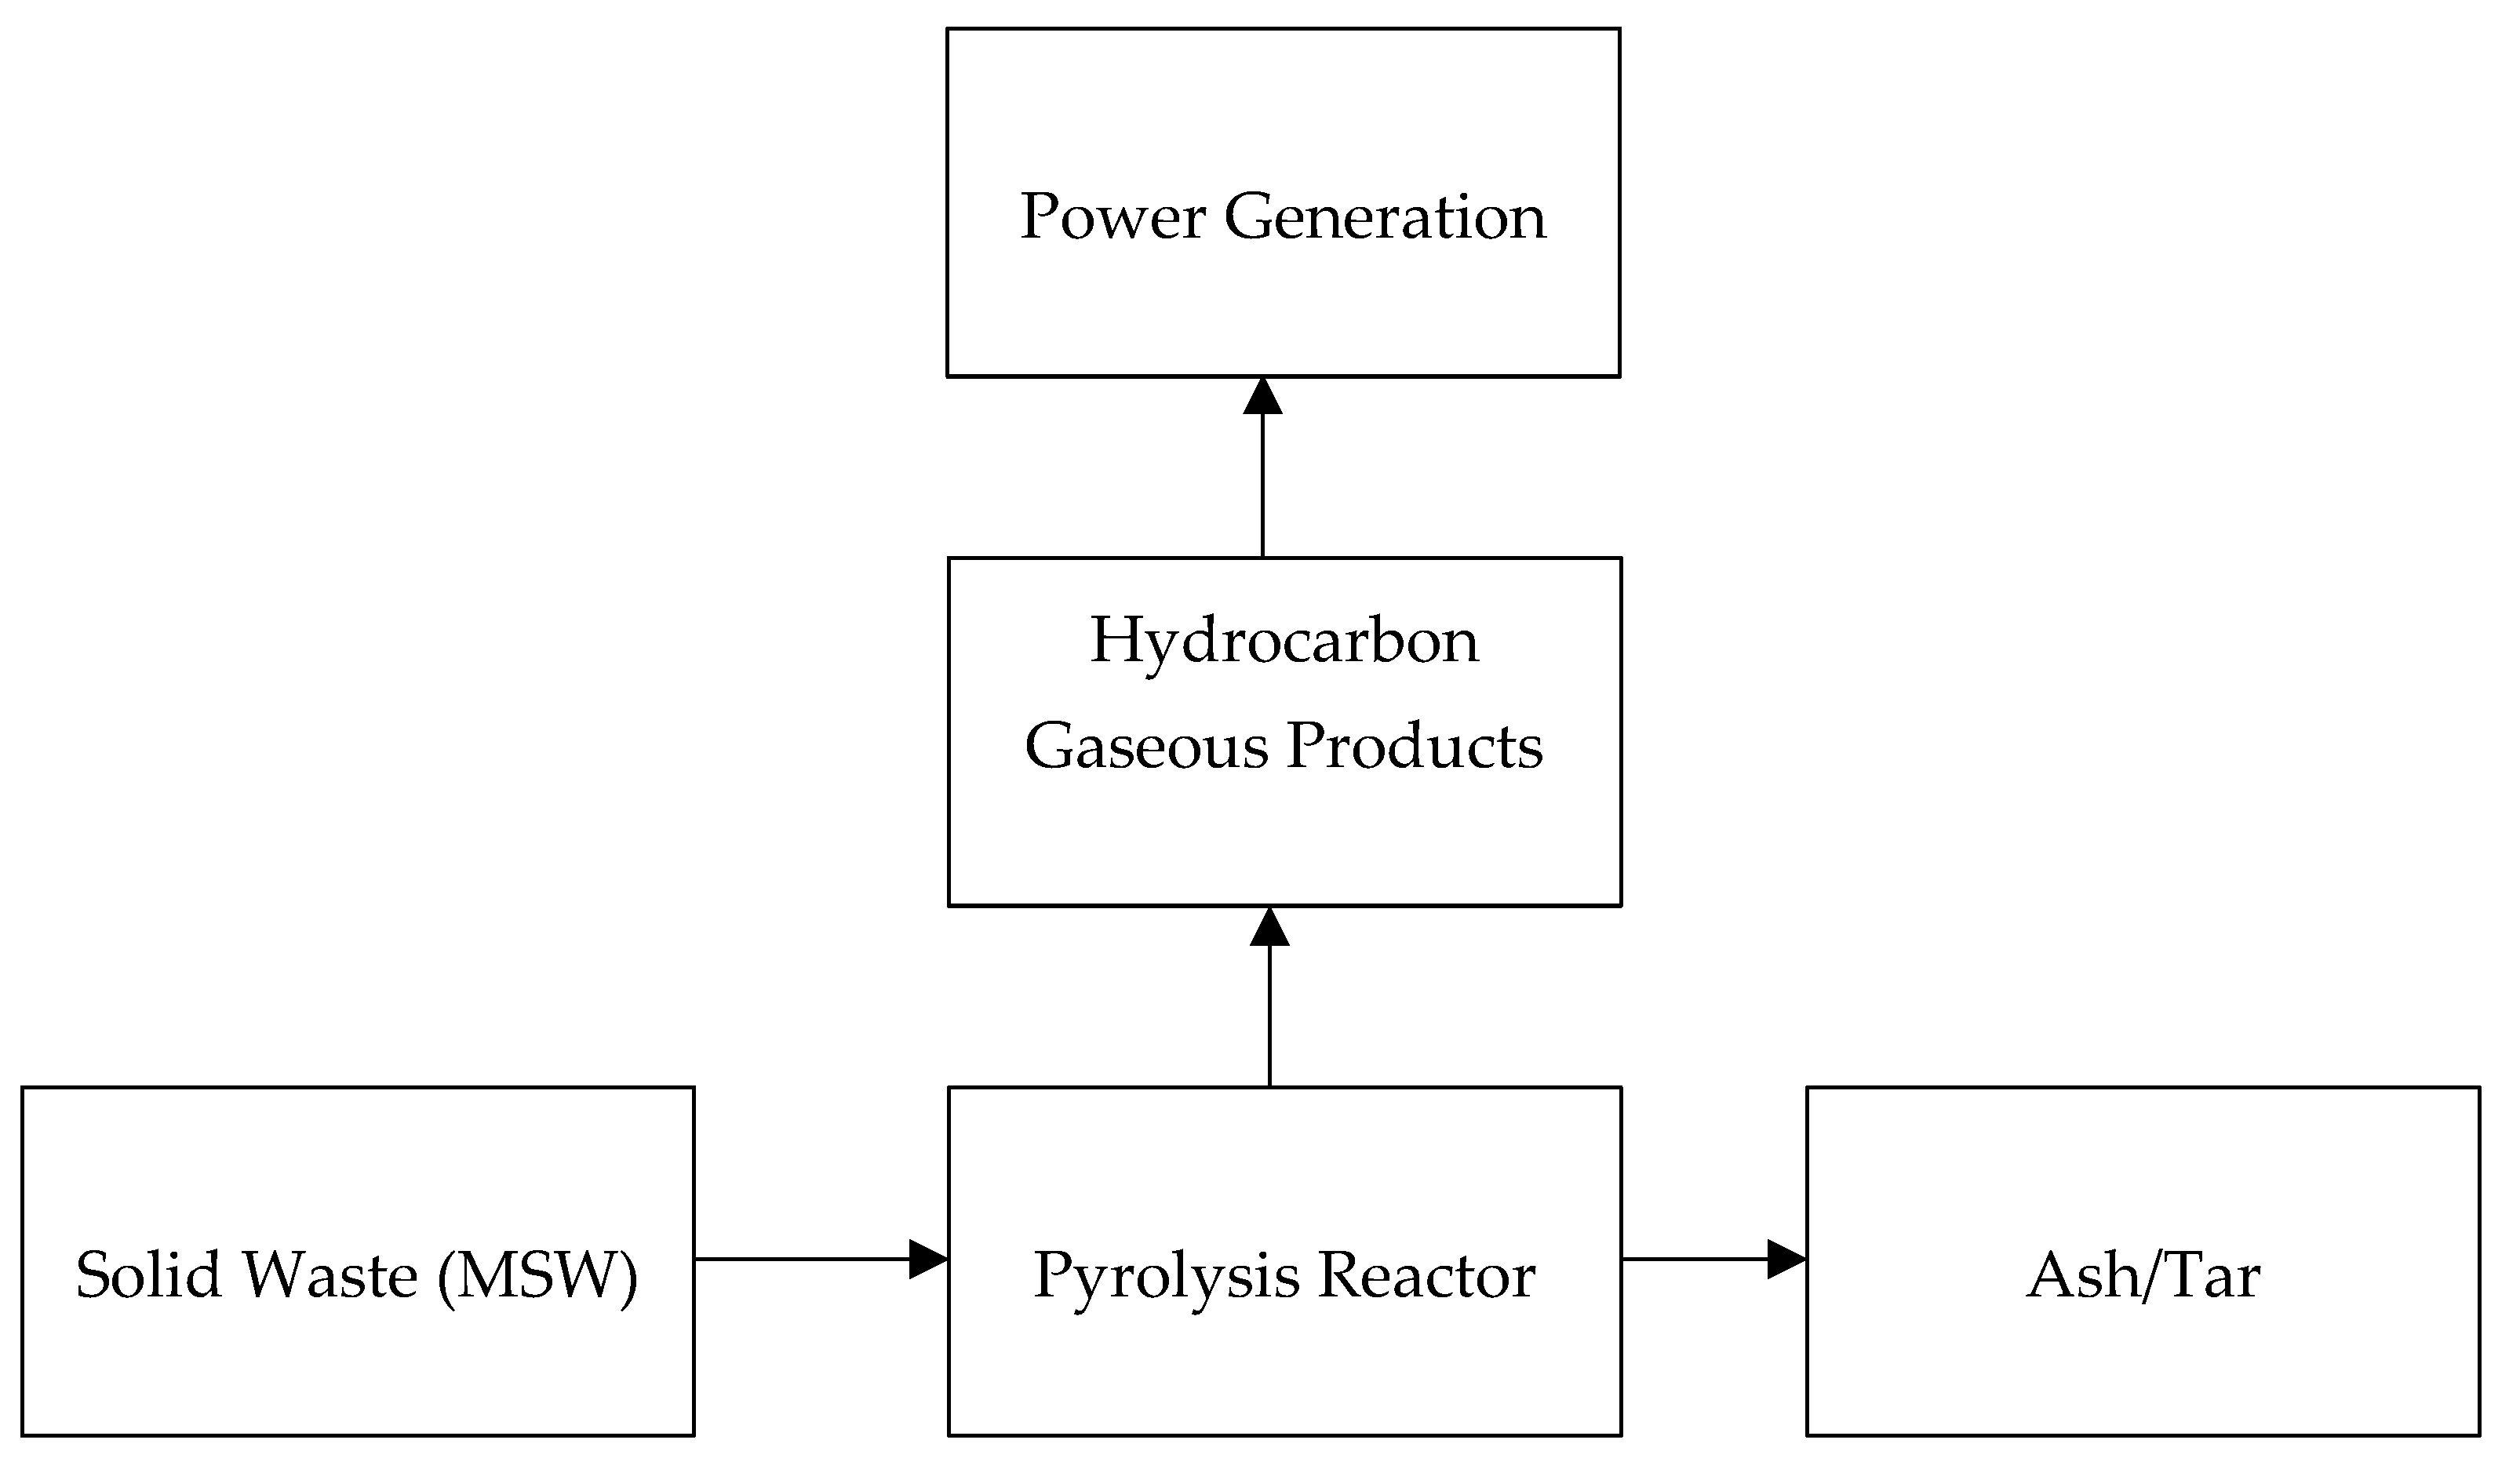
2.2.3. Solid Waste Pyrolysis Process System
2.3. Thermochemical Reactions Kinetic Models
3. Conceptual Design and Process Flow Diagram of Thermochemical Reactions
4. Energy Analysis of Solid Waste Thermochemical Reactions
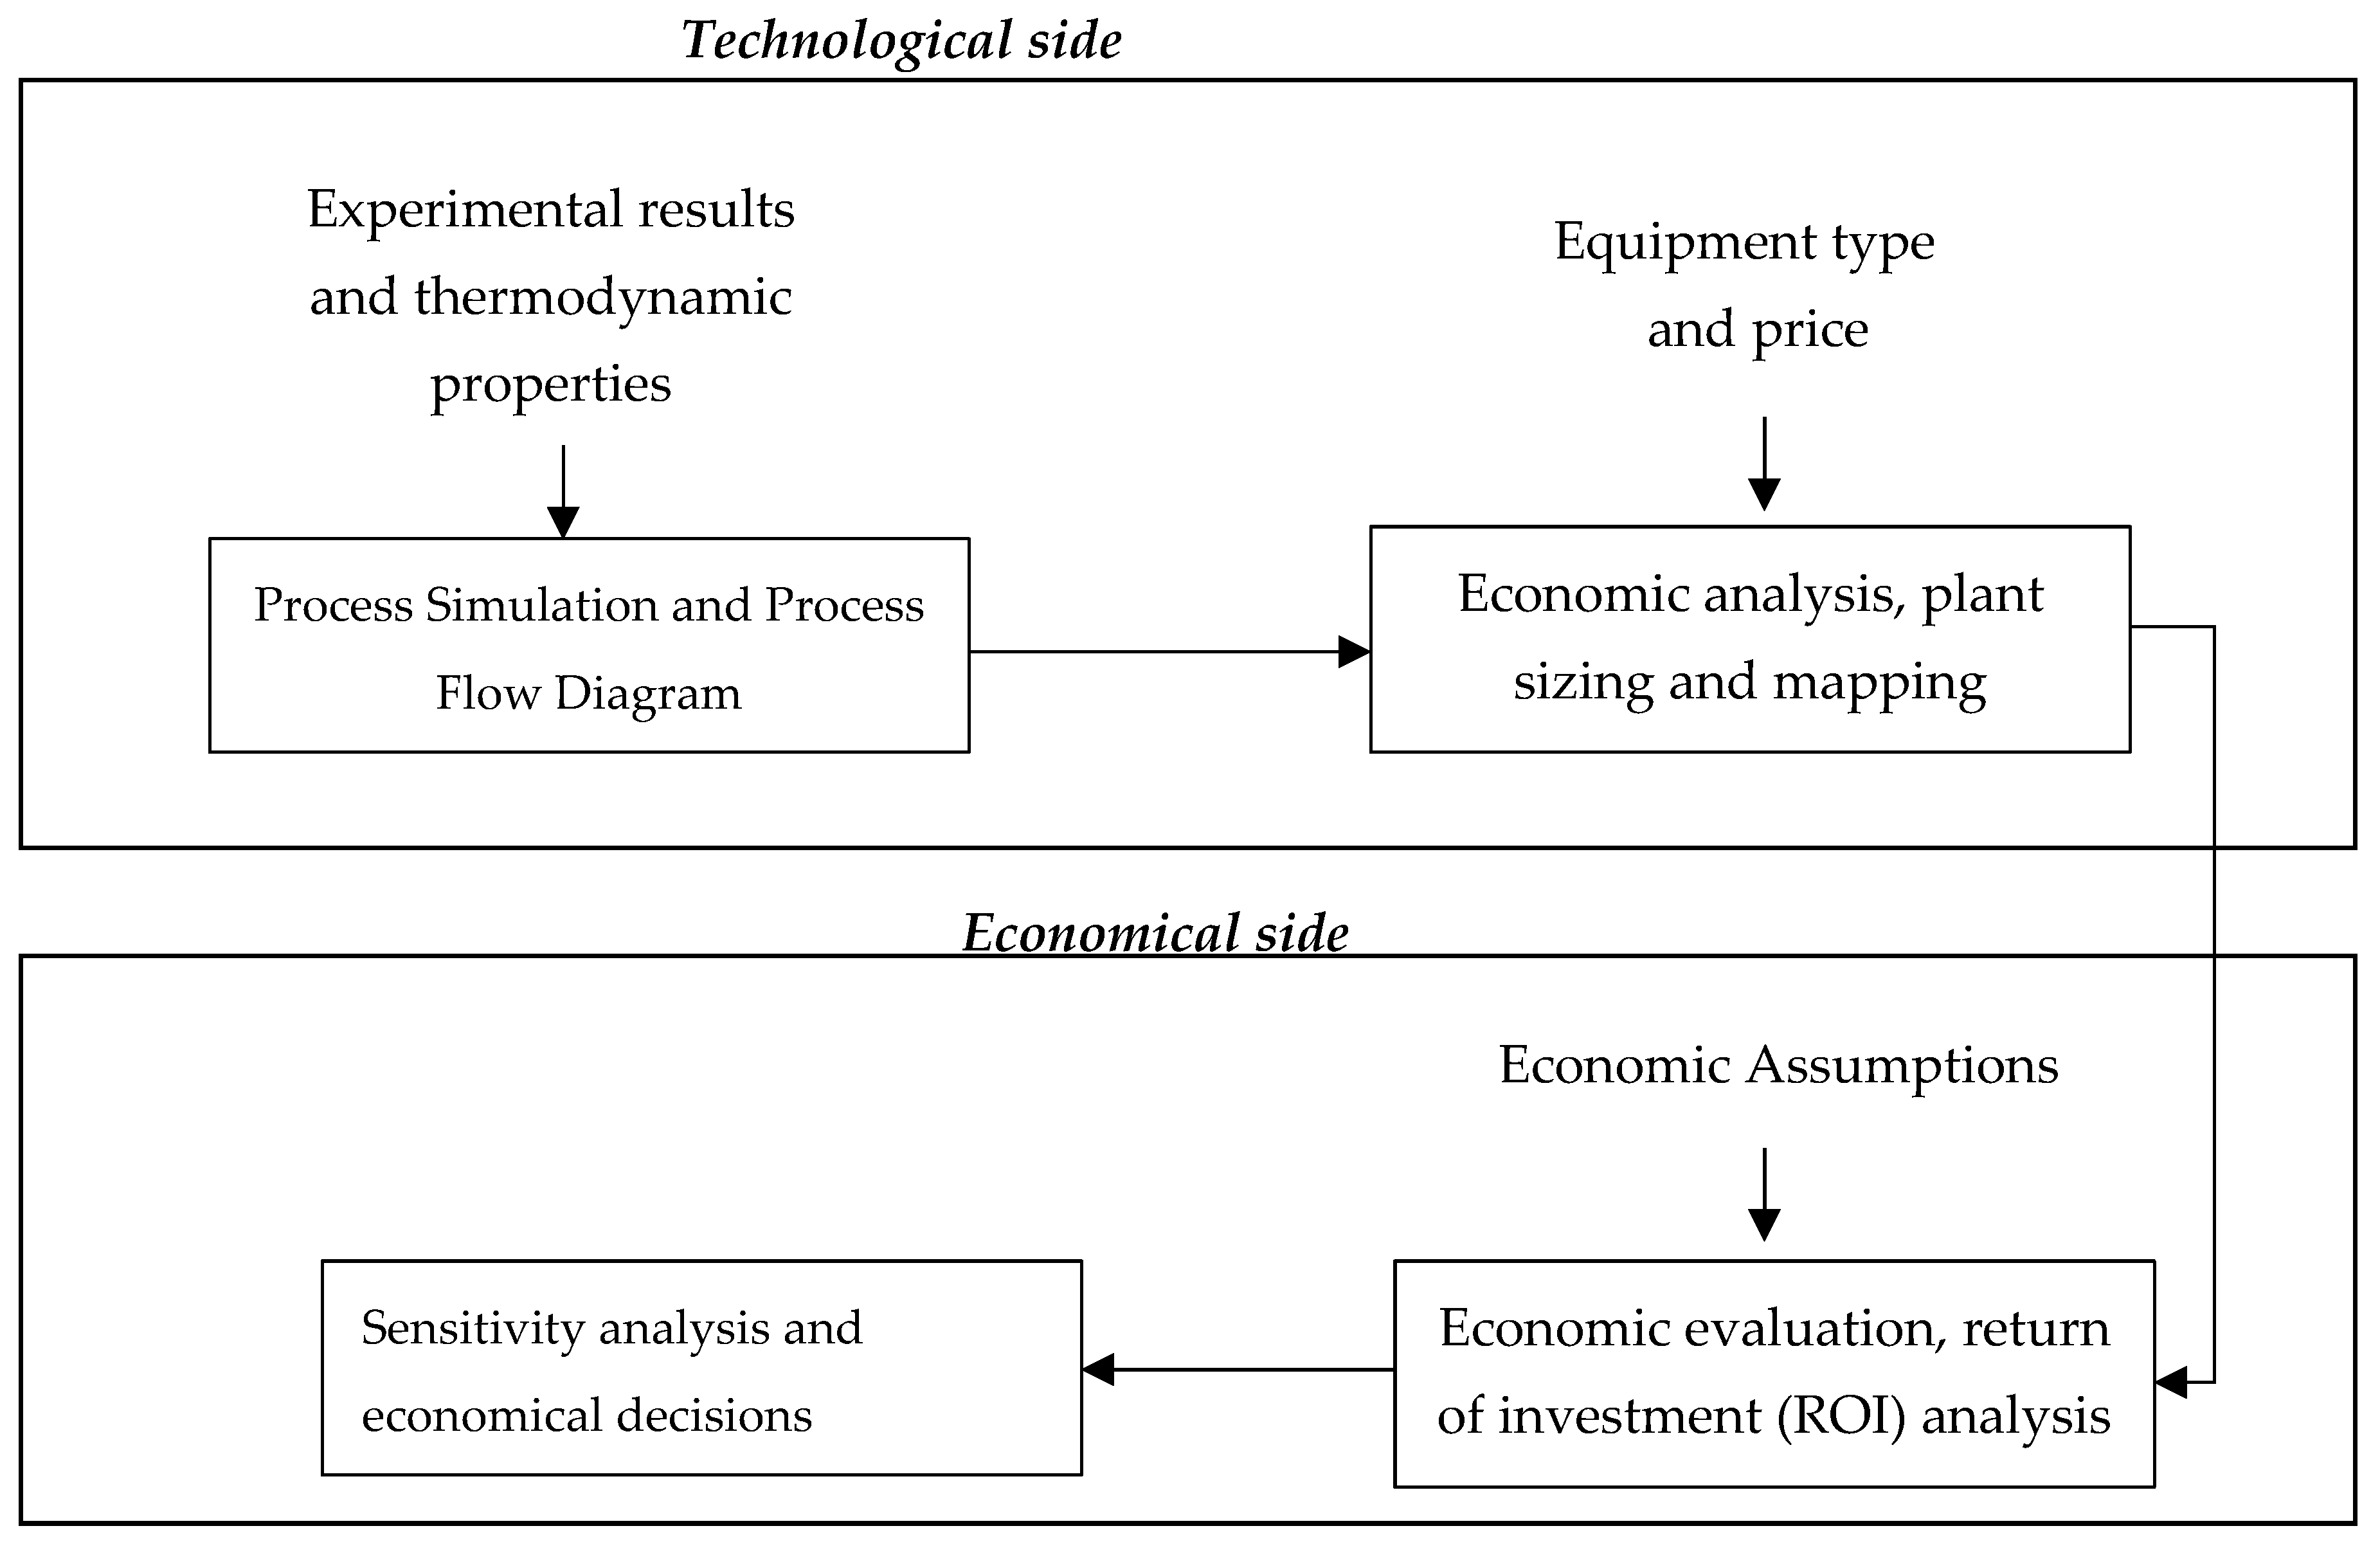
5. Techno-Economic Assessment of Thermochemical Processes
- The maximum temperature in the steam turbine is limited to reduce corrosion and formation of acids in major equipment such as boilers and steam turbines.
- The superheated steam maximum temperature is controlled to reduce the system pressure and avoid entrained liquids and damage to steam turbine blades
- The turbine isentropic efficiency is limited by steam mass flow rate and reduces with modest power output.
6. Conclusions
Author Contributions
Funding
Institutional Review Board Statement
Informed Consent Statement
Data Availability Statement
Conflicts of Interest
Abbreviations
| GWP | Global Warming Potential |
| KPI | Key Performance Indicators |
| MSW | Municipal Solid Waste |
| Mtpa | Million Tonnes per Annum |
| O & M | Operating and Maintenance Cost |
| WTE | Waste to Energy |
References
- The World Bank. Trends in Solid Waste Management; The World Bank: Washington, DC, USA, 2020. [Google Scholar]
- Environment Canada. Technical Document on Municipal Solid Waste Organics Processing; Minister of the Environment: Gatineau, QC, Canada, 2013. [Google Scholar]
- Rhyner, C.R.; Schwartz, L.J.; Wenger, R.B.; Kohrell, M.G. Waste Generation. In Waste Management and Resource Recovery; CRC Press: Boca Raton, FL, USA, 2018. [Google Scholar] [CrossRef]
- Kawai, K.; Tasaki, T. Revisiting estimates of municipal solid waste generation per capita and their reliability. J. Mater. Cycles Waste Manag. 2016, 18, 1–13. [Google Scholar] [CrossRef] [Green Version]
- Moustakas, K. Decision Maker’s Guide to Municipal Solid Waste Incineration. In Waste Management, 2nd ed.; Kumar, E.S., Ed.; InTechopen: London, UK, 2015; Available online: https://www.cambridge.org/core/books/abs/climate-change-2014-impacts-adaptation-and-vulnerability-part-b-regional-aspects/ocean/38C1BED42EBBDB07470534A27FE0FA5F (accessed on 17 October 2021). [CrossRef] [Green Version]
- Rajaeifar, M.A.; Ghanavati, H.; Dashti, B.B.; Heijungs, R.; Aghbashlo, M.; Tabatabaei, M. Electricity generation and GHG emission reduction potentials through different municipal solid waste management technologies: A comparative review. Renew. Sustain. Energy Rev. 2017, 79, 414–439. [Google Scholar] [CrossRef]
- Matsakas, L.; Gao, Q.; Jansson, S.; Rova, U.; Christakopoulos, P. Green conversion of municipal solid wastes into fuels and chemicals. Electron. J. Biotechnol. 2017, 26, 69–83. [Google Scholar] [CrossRef]
- Anshassi, M.; Sackles, H.; Townsend, T.G. A review of LCA assumptions impacting whether landfilling or incineration results in less greenhouse gas emissions. Resour. Conserv. Recycl. 2021, 174, 105810. [Google Scholar] [CrossRef]
- Assamoi, B.; Lawryshyn, Y. The environmental comparison of landfilling vs. incineration of MSW accounting for waste diversion. Waste Manag. 2012, 32, 1019–1030. [Google Scholar] [CrossRef] [PubMed]
- Vaish, B.; Sharma, B.; Srivastava, V.; Singh, P.; Ibrahim, M.H.; Singh, R.P. Energy recovery potential and environmental impact of gasification for municipal solid waste. Biofuels 2019, 10, 87–100. [Google Scholar] [CrossRef]
- Miertus, S.; Ren, X. Environmentally Degradable Plastics and ICS-UNIDO Global Program. In Biodegradable Polymers and Plastics; Springer Nature: Gewerbestrasse, Switzerland, 2003. [Google Scholar] [CrossRef]
- Luijsterburg, B.; Goossens, H. Assessment of plastic packaging waste: Material origin, methods, properties. Resour. Conserv. Recycl. 2014, 85, 88–97. [Google Scholar] [CrossRef]
- Manfredi, S.; Tonini, D.; Christensen, T.H.; Scharff, H. Landfilling of waste: Accounting of greenhouse gases and global warming contributions. Waste Manag. Res. 2009, 27, 825–836. [Google Scholar] [CrossRef]
- Sharma, K.D.; Jain, S. Municipal solid waste generation, composition, and management: The global scenario. Soc. Responsib. J. 2020, 16, 917–948. [Google Scholar] [CrossRef]
- Pranoto, P.; Himawanto, D.A.; Arifin, N.A. The influence of composition and final pyrolysis temperature variations on global kinetics of combustion of segregated municipal solid waste. IOP Conf. Ser. Mater. Sci. Eng. 2017, 193, 012044. [Google Scholar] [CrossRef] [Green Version]
- Gabbar, H.A.; Aboughaly, M.; Ayoub, N. Comparative study of MSW heat treatment processes and electricity generation. J. Energy Inst. 2017, 91, 481–488. [Google Scholar] [CrossRef]
- Ozturk, M.; Dincer, I. Integrated Gasification Combined Cycles. In Comprehensive Energy Systems; Elsevier: Amsterdam, The Netherlands, 2018; Volume 4–5. [Google Scholar] [CrossRef]
- Zhang, Y.; Cui, Y.; Chen, P.; Liu, S.; Zhou, N.; Ding, K.; Fan, L.; Peng, P.; Min, M.; Cheng, Y.; et al. Gasification technologies and their energy potentials. In Sustainable Resource Recovery and Zero Waste Approaches; Elsevier: Amsterdam, The Netherlands, 2019. [Google Scholar] [CrossRef]
- Rasul, M.G.; Begum, S. Energy recovery from solid waste: Application of gasification technology. In Handbook of Ecomaterials; Springer: Berlin, Germany, 2019; Volume 2. [Google Scholar] [CrossRef]
- Zhang, Q. Mathematical Modeling of Municipal Solid Waste Plasma Gasification in a Fixed-Bed Melting Reactor; KTH Royal Institute of Technology: Stockholm, Sweden, 2011. [Google Scholar]
- Xu, P.; Jin, Y.; Cheng, Y. Thermodynamic Analysis of the Gasification of Municipal Solid Waste. Engineering 2017, 3, 3. [Google Scholar] [CrossRef]
- Čespiva, J.; Skřínský, J.; Vereš, J.; Borovec, K.; Wnukowski, M. Solid-recovered fuel to liquid conversion using fixed bed gasification technology and a Fischer–Tropsch synthesis unit—Case study. Int. J. Energy Prod. Manag. 2020, 5, 3. [Google Scholar] [CrossRef]
- Speight, J.G. Fischer-Tropsch Process. In Handbook of Gasification Technology; Wiley: Hoboken, NJ, USA, 2020. [Google Scholar] [CrossRef]
- Frey, H.C.; Zhu, Y. Improved system integration for integrated gasification combined cycle (IGCC) systems. Environ. Sci. Technol. 2006, 40, 5. [Google Scholar] [CrossRef]
- Speight, J.G. Handbook of Gasification Technology: Science, Processes, and Applications; Wiley-Scrivener: Hoboken, NJ, USA, 2017; Volume 110. [Google Scholar]
- Chhabra, V.; Shastri, Y.; Bhattacharya, S. Kinetics of Pyrolysis of Mixed Municipal Solid Waste-A Review. Procedia Environ. Sci. 2016, 35, 513–527. [Google Scholar] [CrossRef]
- Young, G.C. How Can Plasma Arc Gasification Take Garbage to Liquid Fuels and Case Studies? In Municipal Solid Waste to Energy Conversion Processes: Economic, Technical, and Renewable Comparisons; Wiley: Hoboken, NJ, USA, 2010; Chapter 3. [Google Scholar]
- Bovea, M.D.; Ibáñez-Forés, V.; Gallardo, A.; Colomer-Mendoza, F.J. Environmental assessment of alternative municipal solid waste management strategies. A Spanish case study. Waste Manag. 2010, 30, 2383–2395. [Google Scholar] [CrossRef]
- Saheri, S.; Aghajani, M.; Basri, N.E.A.; Mahmod, N.Z.B.; Begum, R.A. Environmental assessment of municipal solid waste disposal options in Malaysia. Aust. J. Basic Appl. Sci. 2011, 5, 11. [Google Scholar]
- Ramos, A.; Teixeira, C.A.; Rouboa, A. Environmental assessment of municipal solid waste by two-stage plasma gasification. Energies 2019, 12, 137. [Google Scholar] [CrossRef] [Green Version]
- Maya, D.M.Y.; Sarmiento, A.L.E.; de Sales Oliveira, C.A.V.B.; Lora, E.E.S.; Andrade, R. Gasification of Municipal Solid Waste for Power Generation in Brazil, a Review of Available Technologies and Their Environmental Benefits. J. Chem. Chem. Eng. 2016, 10, 6. [Google Scholar] [CrossRef] [Green Version]
- Gent, S.; Twedt, M.; Gerometta, C.; Almberg, E. Introduction to Thermochemical Conversion Processes. In Theoretical and Applied Aspects of Biomass Torrefaction; Elsevier: Amsterdam, The Netherlands, 2017. [Google Scholar] [CrossRef]
- Panepinto, D.; Blengini, G.A.; Genon, G. Economic and environmental comparison between two scenarios of waste management: MBT vs thermal treatment. Resour. Conserv. Recycl. 2015, 97, 16–23. [Google Scholar] [CrossRef]
- Mashkin, N.A.; Bartenjeva, E.A. Foamer Influence on the Foam Concrete Properties Obtained in the High-Speed Foam Generator. Mater. Sci. Forum 2016, 870, 163–168. [Google Scholar] [CrossRef]
- Chen, D.; Yin, L.; Wang, H. Pyrolysis technologies for municipal solid waste. Waste Manag. 2014, 34, 2466–2486. [Google Scholar] [CrossRef] [PubMed]
- Gomez, E.; Rani, D.A.; Cheeseman, C.R.; Deegan, D.; Wise, M.; Boccaccini, A.R. Thermal plasma technology for the treatment of wastes: A critical review. J. Hazard. Mater. 2009, 161, 614–626. [Google Scholar] [CrossRef]
- Pichtel, J. Recycling Solid Wastes. In Waste Management Practices; CRC Press: Boca Raton, FL, USA, 2014. [Google Scholar] [CrossRef]
- Kwak, T.H.; Lee, S.; Park, J.W.; Maken, S.; Yoo, Y.D.; Lee, S.H. Gasification of municipal solid waste in a pilot plant and its impact on environment. Korean J. Chem. Eng. 2006, 23, 954–960. [Google Scholar] [CrossRef]
- Arena, U. Process and technological aspects of municipal solid waste gasification. A review. Waste Manag. 2012, 32, 625–639. [Google Scholar] [CrossRef]
- Gu, Q.; Wu, W.; Jin, B.; Zhou, Z. Analyses for synthesis gas from municipal solid waste gasification under medium temperatures. Processes 2020, 8, 84. [Google Scholar] [CrossRef] [Green Version]
- Mehariya, S.; Iovine, A.; Casella, P.; Musmarra, D.; Figoli, A.; Marino, T.; Sharma, N.; Molino, A. Fischer-Tropsch synthesis of syngas to liquid hydrocarbons. In Lignocellulosic Biomass to Liquid Biofuels; Elsevier: Amsterdam, The Netherlands, 2019. [Google Scholar] [CrossRef]
- Cheremisinoff, P.N. Handbook of Water and Wastewater Treatment Technology; Elsevier: Amsterdam, The Netherlands, 2019. [Google Scholar] [CrossRef]
- Dong, J.; Chi, Y.; Tang, Y.; Ni, M.; Nzihou, A.; Weiss-Hortala, E.; Huang, Q. Effect of Operating Parameters and Moisture Content on Municipal Solid Waste Pyrolysis and Gasification. Energy Fuels 2016, 30, 3994–4001. [Google Scholar] [CrossRef] [Green Version]
- Paode, R.D.; Liu, J.I.; Holsen, T.M. Modeling the Energy Content of Municipal Solid Waste Using Multiple Regression Analysis. J. Air Waste Manag. Assoc. 1996, 46, 650–656. [Google Scholar] [CrossRef] [Green Version]
- Qiao, Y. Pyrolysis Characteristics and Kinetics of Typical Municipal Solid Waste Components and Their Mixture: Analytical TG-FTIR Stud. Energy Fuels 2018, 32, 10801–10812. [Google Scholar] [CrossRef]
- Wang, L.; Lei, H.; Liu, J.; Bu, Q. Thermal decomposition behavior and kinetics for pyrolysis and catalytic pyrolysis of Douglas fir. RSC Adv. 2018, 8, 2196–2202. [Google Scholar] [CrossRef] [Green Version]
- Perry, D.G.R. Perrys Chemical Engineerings’ Handbook; McGraw-Hill Education: New York, NY, USA, 2008. [Google Scholar]
- Shabani, M.R.; Yekta, R.B. Suitable method for capital cost estimation in chemical processes industries. Cost Eng. 2006, 48, 22. [Google Scholar]
- Tcholbanoglous, G.; Kreith, F. Handbook of Solid Waste Management, 2nd ed.; McGraw-Hill Education: New York, NY, USA, 2002. [Google Scholar]
- Kim, J.; Jeong, S. Economic and environmental cost analysis of incineration and recovery alternatives for flammable industrial waste: The case of South Korea. Sustainability 2017, 9, 1638. [Google Scholar] [CrossRef] [Green Version]
- Makarichi, L.; Jutidamrongphan, W.; Techato, K. The evolution of waste-to-energy incineration: A review. Renew. Sustain. Energy Rev. 2018, 91, 812–821. [Google Scholar] [CrossRef]
- Young, G.C. Plasma Economics: Garbage/Wastes to Power, Case Study with Economics of a 94 ton/day Facility. In Municipal Solid Waste to Energy Conversion Processes: Economic, Technical, and Renewable Comparisons; Wiley: Hoboken, NJ, USA, 2010; Chapter 7. [Google Scholar]
- van der Vaart, D.R.; Vatavuk, W.M.; Wehe, A.H. The Estimation of Thermal and Catalytic Incinerators for the Control of VOCs. J. Air Waste Manag. Assoc. 1991, 41, 497–501. [Google Scholar] [CrossRef]


| Thermochemical Process | Nitrogen Oxides (NOx) | SOx | CO | HCl |
|---|---|---|---|---|
| Combined Pyrolysis–gasification | ||||
| Solid Waste Pyrolysis | ||||
| Solid Waste Gasification |
| Parameters | Conventional Pyrolysis (Slow Pyrolysis) | Fast Pyrolysis | Flash Pyrolysis |
|---|---|---|---|
| Operating temperature (°C) | 550–900 | 850–1250 | 900–1300 |
| Heat flux(°C/s) | 0.1–1 | 10–200 | >1000 |
| (s) | 300–3600 | 0.5–10 | <0.5 |
| Reference | Pyrolysis Models | Properties |
|---|---|---|
| [36] | Where the regression rate (1/s) v | Pre-exponential factor B, heat of evaporation L, required activation energy E, universal gas constant R, and reaction temperature Ts |
| [37] | Pre-exponential factor B, heat of vaporization Hv, activation energy E, and reaction temperature Tz |
| Parameter | Incineration (USD/ton) | Pyrolysis (USD/ton) | Pyrolysis /Gasification (P-G) (USD/ton) | Gasification (USD/ton) |
|---|---|---|---|---|
| Capital Investment | 231,995 | 173,873 | 205,186 | 160,675 |
| O&M Cost | 16,433 | 143,874 | 15,422 | 13,743 |
| Revenue | −6400 | 400 | 300 | 62,000 |
| CAPEX Costs | OPEX Costs |
|---|---|
| Chemical and Engineering Equipment | Electricity Usage |
| Utility equipment | Operational and labor costs |
| Engineering costs | Maintenance materials and spare parts |
| Equipment start-up costs | Administration costs |
| General facilities costs such as offices | Research and development costs |
| Plant Type | Incineration | Gasification | ||||
|---|---|---|---|---|---|---|
| Capacity (tons/Day) | 1000 | 2000 | 3000 | 1000 | 2000 | 3000 |
| Capital Cost (USD Million) | 100 | 170 | 300 | 55 | 110 | 180 |
| Thermochemical Process | Energy Required for Start-Up (kWh) | Residual/Solid Waste for DISPOSAL (kg) |
|---|---|---|
| Pyrolysis–gasification (P-G) | 300 | 19.55 |
| Pyrolysis | 200 | 90.13 |
| Thermal cracking gasification | 12 | 18.02 |
| Thermochemical Process | Gross Electricity Efficiency | Net Electricity Efficiency | Net Heat Efficiency |
|---|---|---|---|
| Incineration | 0–34 | 2–30 | 0–87 |
| Gasification | 33–34 | 34 | 26–40 |
| Pyrolysis | 18 | 15.25 | 70 |
| Combined Pyrolysis–gasification | 35 | 32 | 40 |
Publisher’s Note: MDPI stays neutral with regard to jurisdictional claims in published maps and institutional affiliations. |
© 2021 by the authors. Licensee MDPI, Basel, Switzerland. This article is an open access article distributed under the terms and conditions of the Creative Commons Attribution (CC BY) license (https://creativecommons.org/licenses/by/4.0/).
Share and Cite
A. Gabbar, H.; Aboughaly, M. Conceptual Process Design, Energy and Economic Analysis of Solid Waste to Hydrocarbon Fuels via Thermochemical Processes. Processes 2021, 9, 2149. https://doi.org/10.3390/pr9122149
A. Gabbar H, Aboughaly M. Conceptual Process Design, Energy and Economic Analysis of Solid Waste to Hydrocarbon Fuels via Thermochemical Processes. Processes. 2021; 9(12):2149. https://doi.org/10.3390/pr9122149
Chicago/Turabian StyleA. Gabbar, Hossam, and Mohamed Aboughaly. 2021. "Conceptual Process Design, Energy and Economic Analysis of Solid Waste to Hydrocarbon Fuels via Thermochemical Processes" Processes 9, no. 12: 2149. https://doi.org/10.3390/pr9122149
APA StyleA. Gabbar, H., & Aboughaly, M. (2021). Conceptual Process Design, Energy and Economic Analysis of Solid Waste to Hydrocarbon Fuels via Thermochemical Processes. Processes, 9(12), 2149. https://doi.org/10.3390/pr9122149