Article

Environmental and Energetic Evaluation of Refuse-Derived Fuel Gasification for Electricity Generation

by
Taís Eliane Marques
1,
York Castillo Santiago
2,*,
Maria Luiza Grillo Renó
1,
Diego Mauricio Yepes Maya
1,*,
Leandro Alcoforado Sphaier
2,
Yunye Shi
3,* and
Albert Ratner
4
1
Excellence Group in Thermal Power and Distributed Generation (NEST), Institute of Mechanical Engineering, Federal University of Itajubá, Av. BPS 1303, Itajuba 37500-903, MG, Brazil
2
Laboratory of Thermal Sciences (LATERMO), Mechanical Engineering Department (TEM/PGMEC), Fluminense Federal University, Rua Passo da Pátria 156, Niteroi 24210-240, RJ, Brazil
3
Department of Mechanical Engineering, The University of Tennessee at Chattanooga, Chattanooga, TN 37403, USA
4
Mechanical Engineering, University of Iowa, Iowa City, IA 52242, USA
*
Authors to whom correspondence should be addressed.
Processes 2021, 9(12), 2255; https://doi.org/10.3390/pr9122255
Submission received: 1 November 2021 / Revised: 4 December 2021 / Accepted: 5 December 2021 / Published: 14 December 2021
(This article belongs to the Special Issue Gasification Processing of Biomass and Refuse Derived Fuel)

Abstract

:
In this work, an energetic and environmental evaluation of the electricity generation process through refuse-derived fuel (RDF) gasification coupled to a gas microturbine (GM) was performed. Two scenarios are considered with different gasification agents in RDF gasification modeling: air and air enriched with oxygen. A thermodynamic chemical equilibrium approach was used to analyze the gasification parameters. The results of RDF gasification indicate a maximum value of syngas low heating value (LHV) equal to 8.0 MJ/Nm3, obtained for an equivalence ratio of 0.3. The use of these syngas in the gas microturbine produces 79.6 kW of electrical power. For the environmental evaluation of gasification and electricity generation systems, the Life Cycle Assessment methodology was employed. The calculated environmental impacts indicate that the emission of contaminants from fossil fuel combustion (in the stage of transport by heavy load vehicles) and that the electricity consumption for equipment operation (in the stage of municipal solid waste pretreatment) contributes to environmental pollution. On the other hand, electricity generation through GM presented lower environmental impact for all analyzed categories, suggesting that the electricity generation from gas obtained from gasification could be a viable option for thermochemical conversion of RDF and its subsequent energetic use.

1. Introduction

Currently, Brazil is one of the largest generators of municipal solid waste (MSW) in Latin America, reaching 79 million tons of waste in 2019, corresponding to a per capita generation of 379 kg/inhabitant/year [1]. When looking into the associated greenhouse gases (GHG) emissions, in 2016 a total of 91.97 million tons (Mt) of CO2 equivalent (CO2-eq) were emitted, with 57.5% coming from the final disposal of MSW [2]. According to Gouveia [3], due to the various composition of MSW and the inappropriate final treatment (resulting in pollutants dispersion in air and water, and soil contamination), selective collection activity is the main alternative to waste management processes.
Another waste management option is the use of refuse-derived fuel (RDF), which refers to the fuel fraction recovered from non-hazardous solid waste of diverse origins such as organic matter present in MSW, various types of plastics, biodegradable waste, and considerable amounts of inorganic material, such as pieces of metal and glass [4]. Considering the need to standardize the information about MSW generation and management Brazilian, a list of solid waste was created, where the RDF is classified as combustible waste and identified by code 19.12.10 [5].
The inappropriate disposal of MSW in the environment has various impacts, affecting air quality due to GHG emissions, as well as water and soil contamination. These impacts can be minimized by converting MSW into energy through different Waste-to-Energy (WtE) technologies, such as incineration, pyrolysis, and gasification [6]. In this way, energy recovered from WtE technologies can be described as the conversion of non-recyclable waste materials into heat, electricity, or fuel and other products with high added value, such as those resulting from biochemical treatments [7].
Gasification is considered the thermochemical conversion process of carbonaceous materials into fuel gas, where a controlled amount of a gasification agent (air, oxygen, steam, CO2) or a mixture of them is used, leading to an alteration of the chemical structure of fuel particles due to the high temperatures reached (above 700 °C) [8]. This gaseous fuel, known as syngas, is generated from the gasification process with air in the temperature range between 770 °C and 1000 °C. The syngas produced from gasification with air mixtures enriched with oxygen, steam, and CO2, offers an improved calorific value [9].
According to Couto et al. [10], gasification offers a good solution to the recovery of chemical energy present in MSW, producing syngas that can be used in various applications for the chemical industry or as fuel for the efficient production of electricity or heat, becoming an interesting option for the management of MSW. One of the technologies used for power generation involves gas microturbines (GM), which produce a nominal power between 25 kWe and 300 kWe [11]. The structural configuration of turbines may vary according to the manufacturer and its application [12], but GM usually operates in a single-shaft configuration with a regeneration system, reaching efficiencies of up to 35%. In the case of GM without a regeneration mechanism, the electrical efficiency can reach values up to 17% [13].
The GM operating principle is based on the Brayton regenerative cycle and its components, which includes a centrifugal compressor coupled to a radial turbine that operates at a high rotation, and requires a digital power controller to manage the power output and can utilize both liquid and gaseous fuels [14]. The main operational concerns of GM are associated with damage to components subjected to high temperatures, susceptible to severe degradation when there is an excess of contaminants in the fuel and the supply air. Liquids found in gaseous fuels can also cause structural damage to the microturbine [15]. According to Capstone [16], the fuel must enter the Capstone C200 GM with a pressure of 5.5 bar and a temperature between −20 and 50 °C, which indicates a need for fuel conditioning before usage in a GM.
Life Cycle Assessment (LCA) is a methodology used for the evaluation and quantification of environmental impacts attributable to the life cycle of the process, or service. Likewise, LCA involves the compilation and assessment of inputs, outputs, and associated potential environmental impacts throughout the lifecycle of products [17]. The structure, principles, requirements, and guidelines that a study must consider for LCA methodology are based on the ISO 14.040 and ISO 14.044 standards. Thus, the LCA study includes objective and scope, allocation method, inventory, impact assessment, and finally interpretation [18].
Rabou et al. [19] analyzed the performance of GM using syngas and identified that the lower limit for stable GM operation was obtained by using a syngas with a lower heating value (LHV) of approximately 8 MJ/Nm3. Corrêa et al. [20] studied the effect of mixtures of syngas and natural gas use in a GM. The results showed that the efficiency drops about 13% (compared to using only natural gas) when the GM was powered with a mixture of 50% natural gas and 50% syngas. This behavior is associated with the composition of fuel gases and their LHV since the syngas/natural gas mixture contained lower concentrations of CH4 (1.8%vol.) and H2 (5.1%vol.) due to the presence of N2 (57.7%vol.), while for natural gas the values of CH4 and H2, were 8.6%vol. and 38.1%vol., respectively. Additionally, the temperature analysis showed that the temperature of the gases released by the GM undergoes insignificant variations, despite the different fuel compositions.
Lozano et al. [21] carried out an energetic and economic evaluation of the RDF gasification process coupled to an internal combustion engine, operating with air as a working fluid at 1.0 bar and 25 °C. The maximum cold gas efficiency of 57–60% was obtained for equivalence ratio values between 0.25 and 0.3, where the associated syngas (with LHV of 5.8 MJ/Nm3) was burned in the engine, reaching an electrical power of 50 kW at 20% engine efficiency. The economic analysis showed that the project is feasible for a power greater than 120 kW, for which an investment of approximately $300,000 is required. In addition, Dong et al. [22] compared seven systems that involve the thermochemical conversion of MSW (highlighting pyrolysis, gasification, and incineration) and subsequent syngas energy use in prime movers (steam cycle, gas turbine/combined cycle, internal combustion engine) through the LCA methodology. The results indicated that pyrolysis and gasification together with the gas turbine/combined cycle, have the potential to reduce environmental loads. Furthermore, the heterogeneity of the purification technologies of MSW and syngas are the most relevant impediments for WtE systems based on pyrolysis or gasification.
This work aims to perform an energetic and environmental evaluation of refuse-derived fuel gasification as an alternative for solid waste energy recovery. To simulate the gasification process, two scenarios were considered. In the first scenario, the air is used as the gasification agent while a mixture of air enriched with oxygen (60% O2–40% N2) is utilized in the second scenario. The model of the gasification process was validated and different parameters such as gasification temperature, cold-gas efficiency, syngas LHV, and syngas composition were evaluated. The usage of syngas in a gas microturbine to generate electricity was also modeled. Thus, in order to determine energy recovery potential from RDF conversion, an analysis of power generated and gas microturbine efficiency at different operational conditions was performed. For the environmental evaluation of the gasification/electricity generation process, the LCA methodology was applied by using the SimaPro software, being possible to quantify the potential environmental impacts of the analyzed system. Therefore, this paper provides an energetic evaluation and a life cycle analysis of the RDF gasification and power generation process, which are essential to determine the viability of RDF thermochemical conversion as well as the associated environmental impacts.

2. Materials and Methods

2.1. Gasification Model

A thermodynamic chemical equilibrium model was developed using the Scilab® v 6.1.1. For the simulation of the gasification process, some assumptions were adopted in agreement with several authors who developed equilibrium models [23,24,25]:
  • Ashes are inert and do not participate in chemical balance.
  • The residence time is long enough to allow the chemical balance to be reached, and thus, the gasification process occurs in a steady state.
  • The gasification reactor is completely isothermal.
  • The gasifier operating pressure is 1.0 atm.
  • The char is composed solely of carbon.
  • The formation of tar and heavy hydrocarbons during gasification is negligible.
  • Undesirable chemical compounds were separated through the method of adsorption using iron oxides.
  • Clean syngas was cooled to 25 °C in a cooler.
  • No heat losses are considered.
RDF characterization includes ultimate analysis and proximate analysis, where Table 1 shows the values of these analyses used in simulation modeling.
The composition of RDF has the chemical formula CxHyOzNwSv. Considering that β moles of air are gasified, the global gasification reaction can be written as follows:
C x H y O z N w S v + β O 2 + δ N 2   a 1 CO 2 + a 2 CO + a 3 H 2 + a 4 H 2 O + a 5 CH 4 + a 6 N 2 + a 7 SO 2
where x, y, z, w, and v are derived from the ultimate and proximate analysis results; and a1 through a7 are the molar products of one mole of fuel. It is worth mentioning that Equation (1) only presents SO2 as a product from sulfur. However, other compounds such as H2S, COS, and elemental sulfur (S) may be produced. These products were not considered in the model because their participation in syngas can be up to 1%vol. and because their separation, in addition to being complex, requires large amounts of solvents [26,27].
The following equations are used to solve the global reaction:
Carbon: x = a1 + a2 + a5
Hydrogen: y + 2a + 2γ = 2a3 + 2a4 + 4a5
Oxygen: z + a + γ + 2β = 2a1 + a2 + a4 + 2a7
Nitrogen: w + 2δβ = 2a6
Sulfur: v = a7
In order to determine the stoichiometric coefficients, the Gibbs free energy minimization approach was used for the following reactions in the gasification process:
C + CO2 → 2CO
C + H2O → CO + H2
C + 2H2 → CH4
CO + H2O → CO2+ H2
In addition, for the calculation of the reaction’s equilibrium constants the following equation was employed:
k p = i = 1 p n p i τ p i j = 1 r n R j τ R j   p p o 1 n t Δ τ = e Δ G T 0 R T
where Δ τ is the variation of moles number between the products and reactants of the reaction (10), Δ τ   = i = 1 p τ i j = 1 r τ j ; p is the system pressure (Pa); p O is the atmospheric pressure (101,325 Pa); n t is the total number of moles; Δ G T 0 is the variation of Gibbs free energy (J); R is the ideal gas constant (8.314 J/mol∙K); n p i τ p i is the moles’ number of species i from reaction with C, n R j τ R j is the moles’ number of specie j from reaction with C; ( τ i ) is the moles’ number of species i from reaction with C that is part of primary reaction reagents; ( τ j ) is the moles’ number of species j from reaction with C that is part of the reaction products; T is the temperature (K).
Through the calculation of the equilibrium constants from the gas-water reaction (k1) and the methane reform reaction (k2) one obtains
k 1 = a 1 a 3 a 2 a 4 = e   g ¯ T , CO 2   + g ¯ T , H 2   g ¯ T , CO   g ¯ T H 2 O   / RT
k 2 =   a 5 a 3 2 = e g ¯ T , CH 4 2   g ¯ T , H 2   / RT
where g ¯ T , i = h ¯ T T s ¯ T represents the molar Gibbs free energy at temperature and pressure of element i (J/mol); h ¯ T is the molar enthalpy of specie i at temperature T (J/mol); and s ¯ T is the molar entropy of species i at temperature T (J/mol∙K).
The system temperature influences the conservation of energy, as described by:
R N i   h ¯ f , i 0   P N j   h ¯ 0   f , j + Δ h ¯ j   25   ° C ,   T = 0
where Ni is the moles’ number of element i from reactants; Nj is the moles’ number of species j from products;   h ¯ f , i 0   is the formation enthalpy of specie i from the reactants at a temperature of 25 °C (J/mol);   h ¯ f , i 0   is the formation enthalpy of specie j from products at a temperature of 25 °C (J/mol);   h ¯ j   25   ° C ,   T is the enthalpy variation between at temperature T and 25 °C of specie j from the products (J/mol).
The equivalence ratio (ER) is one of the most important operational variables of the gasification process and corresponds to the value of the actual air/fuel ratio used during the process, divided by the stoichiometric air/fuel ratio, as represented by:
ER = A F   a c t u a l A F   e s t
where A F   a c t u a l = actual air/fuel ratio; A F   e s t = stoichiometric air/fuel ratio.
The molar fractions of CO, H2, and CH4 estimated are used to calculate the syngas LHV as shown below:
L H V g a s = y H 2 L H V H 2 + y CO L H V CO + y CH 4 L H V CH 4
According to Kuo et al. [28], the cold gas efficiency of the gasification process is the ratio between the chemical energy of syngas and fuel:
E cold =   Q gas m ˙ RDF × L H V gas L H V RDF
where Q gas is the syngas volumetric flow; L H V gas is the Syngas LHV on a volumetric basis; m ˙ RDF is the mass flowrate of RDF; and L H V RDF is the LHV of RDF on a mass basis.

2.2. Validation of Gasification Model

The model that simulates gasification was designed as a self-sufficient process from a thermal point of view, where the gasifier configuration and bed type were disregarded. Thus, for the validation of the model, the experimental data reported by Campoy et al. [29] was considered, who obtained results for autothermal fluidized bed gasification for different operating conditions with air, O2, and steam as gasification agents. The ER of the tests ranged from 0.24 to 0.38 and the steam-biomass (SB) ratio ranged from 0 to 0.63. Table 2 presents the composition of the biomass used in this study as well as the operational conditions.
The validation results are presented in Table 3, where E corresponds to the experimental result, M is the result obtained from the model, and SB is the steam-biomass ratio. The root mean square (RMS) error is calculated for five conditions, where Ei are the experimental values, Mi correspond to the values predicted by the mathematical model, and N is the number of experiments performed as given by:
R M S =   E i M i 2 N
It can be observed that the results offered by the model have a satisfactory correlation with the experimental data, presenting RMS values lower than 6.08. Through the comparison shown in Table 3, it can be concluded that the equilibrium model developed provides a slightly higher concentration of H2 and CO than the experimental tests and a slightly lower concentration of CO2. The greatest percentage difference was concerning CH4, which occurs because equilibrium models assume that all reactions reach a permanent equilibrium condition, without considering the kinetic parameters of the reactions involved.

2.3. Gas Microturbine Model

The GM model was developed using GateCycle™ v 6.1.2 software, to simulate electricity generation using syngas as fuel. The GM’s principle of operation is based on the regenerative Brayton cycle, as presented in Figure 1. The cycle is described as follows: the airflow (S0) enters the compressor (C1) and is then circulated through the regenerator (HX1); it is subsequently transferred to the combustion chamber (CMB1) where it is being mixed with the syngas (S3), which was previously compressed (C2). The resulting combustion gases are sent to the turbine rotor (EX1), where expansion and generation of mechanical work occurs. The expanded gases finally flow through the regenerator (HX1) before being released into the atmosphere. The technical specifications of the considered Capstone C200 gas microturbine are presented in Table 4.
The modeling of the microturbine and its components assumes on-design conditions, i.e., the microturbine is operating at the rotation, pressure ratio, and mass flow for which the components were designed. However, this study seeks to study the variation in microturbine performance throughout the operating range of rotation and power using a fuel (syngas) different from that tested in the on-design condition, a situation that is known as off-design.
To define the characteristics of the compressor in microturbine modeling at off-design conditions, the compressor map developed by Zhu and Saravanamuttoo [35] was used, which is available in the GateCycle™ software and is useful for microturbines with pressure ratios lower than 8. In the developed model, it was considered that the microturbine operates with the choked flow. Thus, the compressor discharge pressure becomes dependent on the flow characteristics at the turbine nozzle.

2.4. Environmental Impact Assessment

LCA was carried out to evaluate the environmental performance of the gasifier/gas microturbine system. Table 5 presents the data considered for the life cycle inventories: inputs and outputs adopted for MSW transportation stage—consumption and emissions from diesel-burning in heavy-duty vehicles, RDF processing for taking into account the waste pretreatment stage, as well as RDF processing until electricity is produced.
The distance assumed for the truck’s route was 9 km, an average data for a medium-sized city. The emissions corresponding to CO2, CO, nitrogen oxides (NOx), total hydrocarbons (THC), and particulate matter (PM10) associated with the transport stage, were calculated using the emission factors reported by Grigoratos et al. [36]. The environmental performance analysis of the system was computed through the environmental impact assessment method ReCiPe v1.10, available in the SimaPro 8.0.3.14 software database. This method seeks to harmonize the midpoint impacts and the damage categories (endpoint), as described by Goedkoop et al. [37].

3. Results and Discussion

In the next items are the results of the different evaluation parameters (ER, LHV, cold gas efficiency) associated with the RDF gasification process (at atmospheric pressure) and its use in the GM, as well as the environmental impacts from the gasifier/GM system.

3.1. Gasification Process Analysis

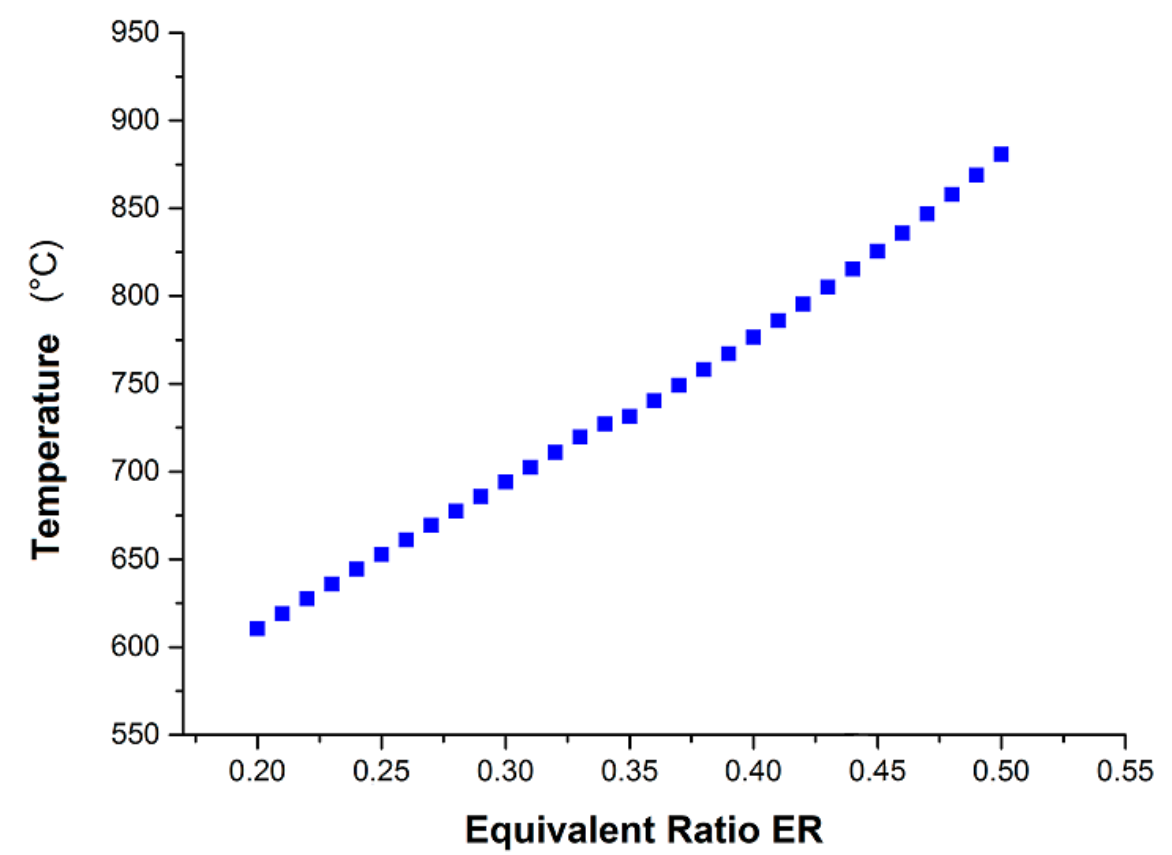
The calculated gasification temperature for different equivalence ratios using air as the gasification agent is in Figure 2. As it can be seen, the temperature rises as ER is increased, reaching a value of 694 °C for ER = 0.30. The temperature in the gasifier results from interactions of the endothermic and exothermic reactions. Higher ER values promote oxidation reactions and lead to an increase in temperature due to greater heat release [38]. Meanwhile, more energy is consumed during the process with increasing temperature. Likewise, these results correspond to those reported by.
Next, Figure 3 displays the calculated syngas compositions for different equivalence ratios. As can be observed, higher ERs promote a decrease in the concentrations of H2, CO, and CH4, as well as an increase in the content of N2 due to high concentrations of air inside the reactor [39]. Low ER diminishes the gasification temperature, which is unfavorable for the reactions in the reduction zone. However, lower ER favors pyrolysis reactions and consequently reduces the H2 content [40].
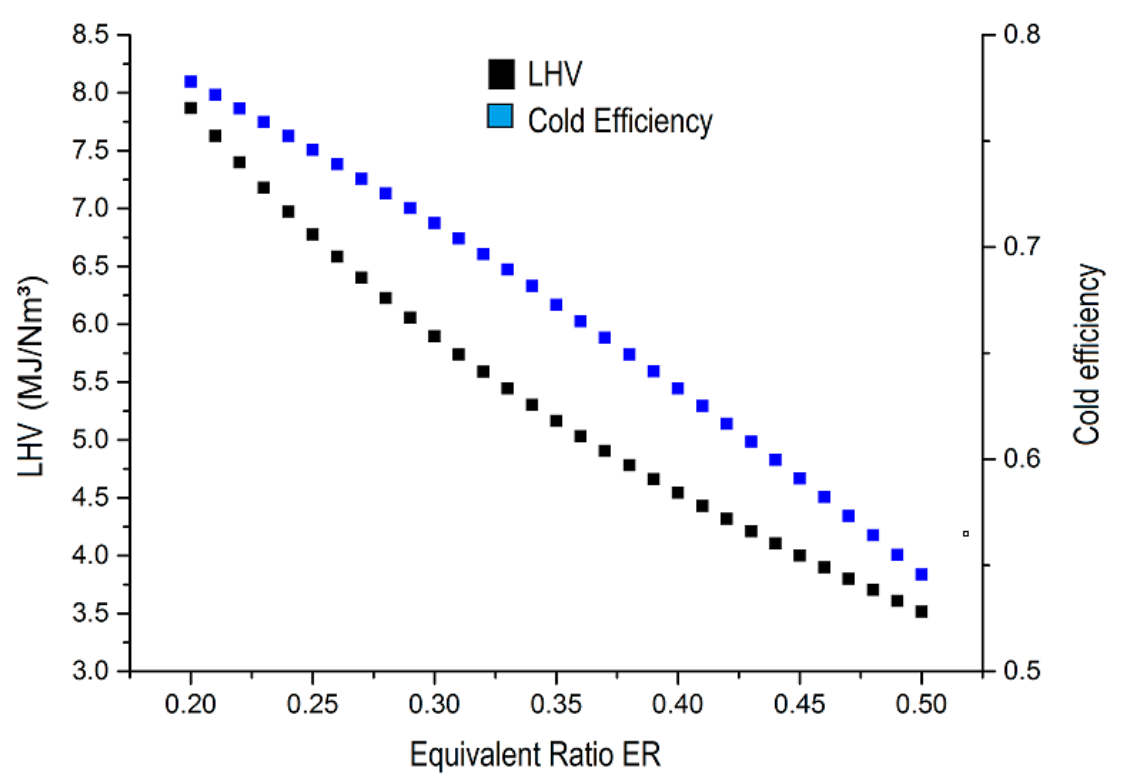
Syngas LHV and cold gas efficiency (Ecold) are calculated from Equations (16) and (17), respectively to evaluate gasification performance. Results (Figure 4) show that Ecold decreases as ER increases. For the case with air as the gasification agent, an LHV of 5.8 MJ/Nm3 and an Ecold value of 64% are obtained for ER = 0.3. The results obtained for the LHV, and Ecold agree with those reported in the study carried out by Lozano et al. [21], where a gasification plant with 100 kg/h of RDF was simulated in a chemical equilibrium model. Likewise, these results correspond to those reported by Couto et al. [41], who performed an experimental and numerical analysis of the gasification of RDF in similar conditions (ER between 0.2–0.5).
Given that the syngas LHV from air gasification is less than 8 MJ/Nm3, it is inappropriate to gasify RDF with air considering GM operation limitations (Rabou et al. [19]). Therefore, simulations were carried out utilizing air enriched with oxygen (60% O2–40% N2) as the gasifying agent to obtain syngas with a higher LHV, suitable for GM use.
Figure 5 displays the results for this configuration, where ER intervals from 0.2 to 0.5 are also employed. As observed, the temperature rises at a near-uniform rate as the ER is increased since a greater amount of gasification agent fed causes the combustion of a greater portion of fuel, leading to higher gasification temperatures [42]. The temperatures obtained are close to those reported in the literature (Ramzan et al. [43]), where for an ER range of 0.25–0.30 the temperatures are between 700 and 800 °C.
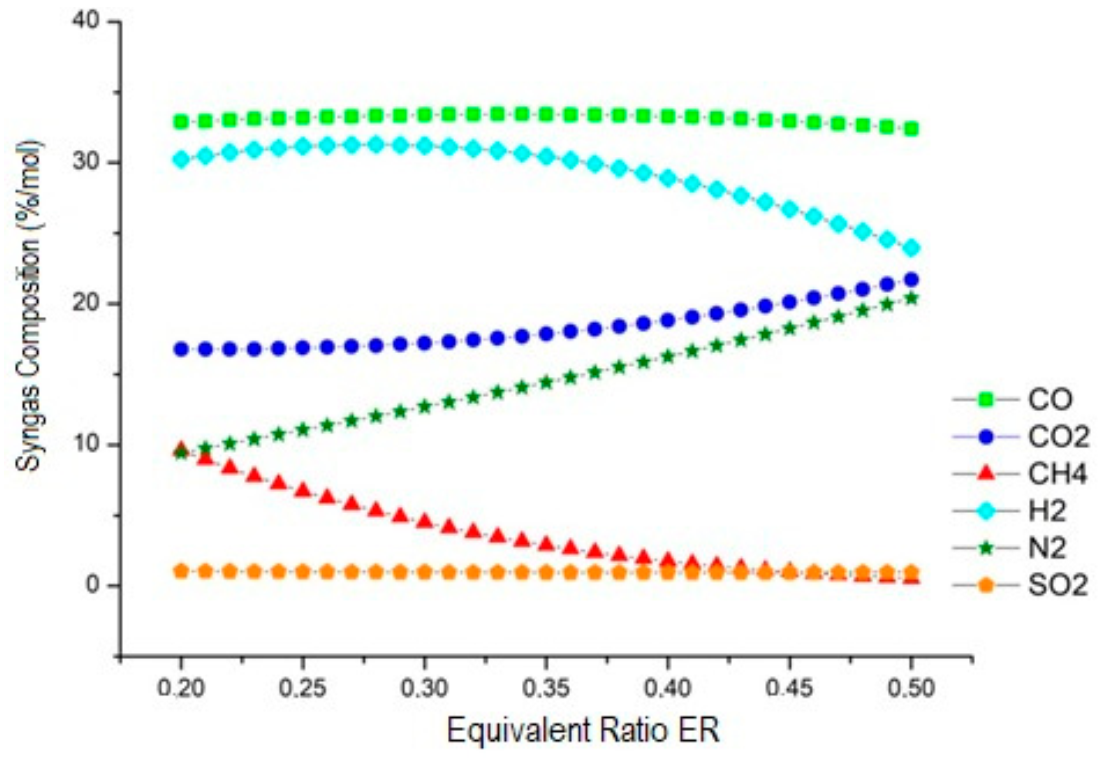
The following results analyze the syngas composition as a function of ER for gasification using oxygen-enriched air, as portrayed in Figure 6. As seen, a higher composition of H2 (31.2%) is observed for ER = 0.30 when compared to the one shown in Figure 3 (17.8%). However, as the concentration of oxygen increases, H2 decreases due to the oxidation of the volatiles.
H2 varies from 30% to 31.2% for ER in between 0.25 and 0.3 while CO concentration varies from 32.8% to 33.4% with ER in between 0.28 and 0.37. In addition, the CH4 content in the syngas decreases as ER increases, varying from 9.6% to 1.2% for ER values between 0.2 and 0.43. Increasing ER leads to increments of the rate of several endothermic reactions that consumed methane and subsequently lead to a greater hydrogen production [44]. Similar trends were obtained by Islam et al. [45] using oxygen-enriched air as a reagent and an ER range between 0.25 and 0.33.
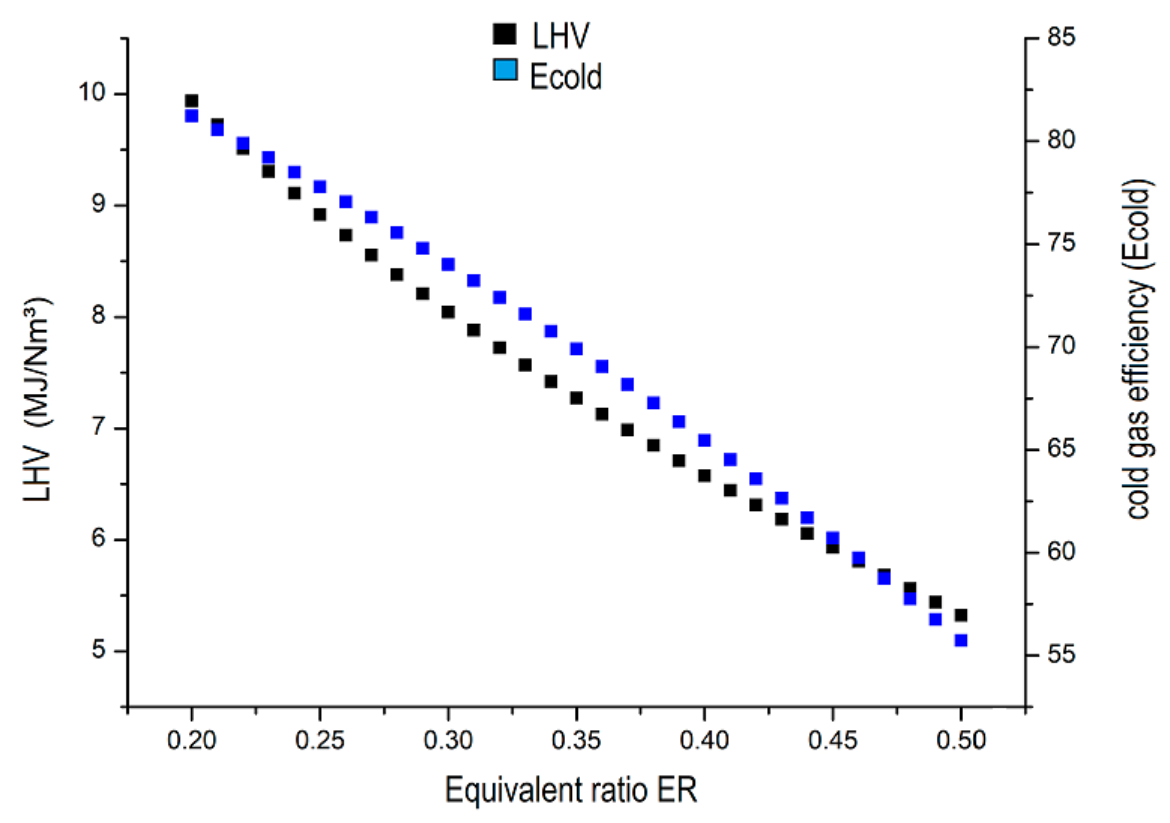
Furthermore, the syngas LHV, obtained using oxygen-enriched air, decreased with increasing ER and the value ranges between 7 and 8 MJ/Nm3 for ER ranges between 0.3 and 0.36, as shown in Figure 7. Ecold also shows a decreasing trend with an increasing ER, with Ecold being 81% for ER = 0.2 and 74% for ER = 0.3, respectively. The LHV declined due to the decrease of H2 (Figure 6), which is associated with the additional oxygen introduced in the reactor that favors the oxidation reactions. Ecold is the energy input over the potential energy output based on the LHV of the biomass and of the syngas [46]. Therefore, Ecold also diminishes as it depends on the syngas LHV. These tendencies in the calorific value parameters are in agreement with data reported in other works [47,48].
The oxygen enrichment can cause a considerable increase in nitrogen oxide emissions due to increased combustion temperature, however, in this study, it was not possible to calculate this increase.

3.2. Gas Microturbine Analysis

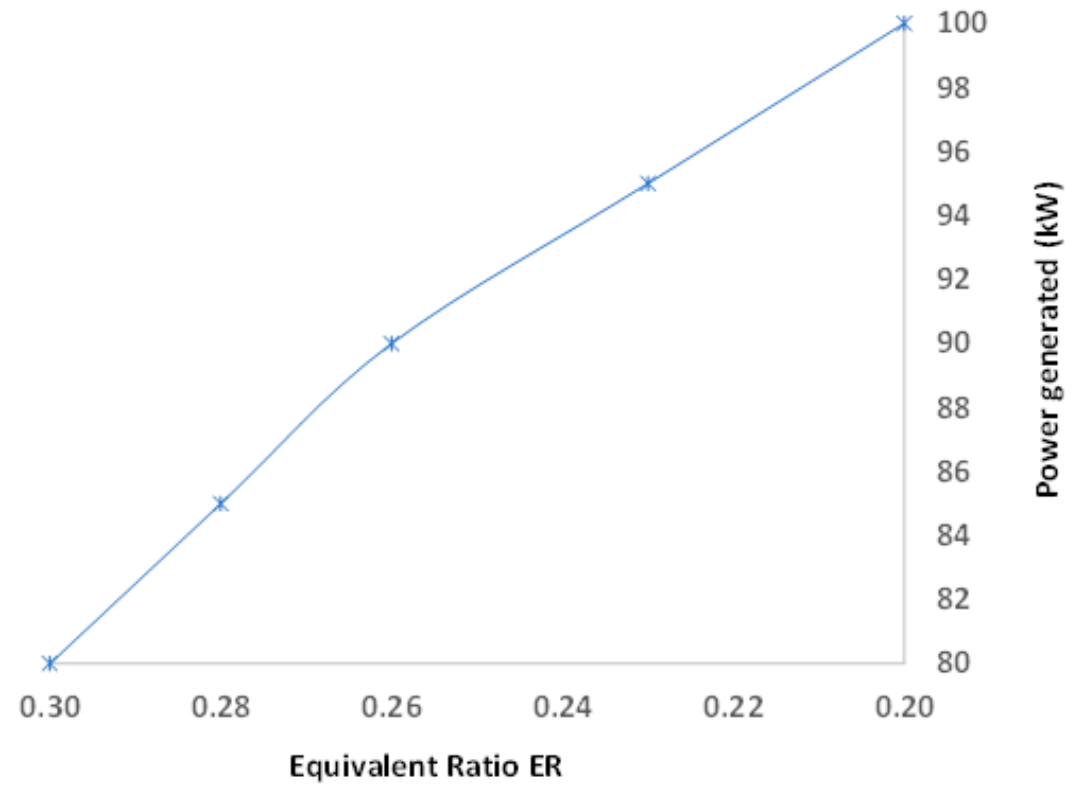
To guarantee a stable operation of GM, the LHV must be greater than 8 MJ/Nm3 and the content of H2 in the syngas less than 30% (according to Page et al. [49]) because managing H2 concentration is essential to avoid flashbacks and blowout. To operate the microturbine, the syngas produced with ER between 0.2 and 0.3 in oxygen-enriched air gasification were considered, at the maximum fuel flow rate (0.02 kg/s). Under these conditions, electric powers were obtained in the range of 79.6 and 100 kW, as presented in Figure 8.
As also seen in this figure, the highest power generated was reached for ER = 0.2, where there is a higher value of the air/fuel ratio and consequently an increase in the electrical power generated. The air/fuel ratio used in the GM ranged from 64.7 to 47.8 for the ER between 0.2 and 0.3. Following the previous data, Figure 9 shows the calculated GM efficiency for equivalence ratios ranging from 0.2 to 0.3. As can be seen, a decreasing trend in efficiency is observed, which follows the decrease in generated power with increasing ER.
The highest efficiency values were obtained for ER values between 0.2 and 0.25, associated with higher electrical power values, 100 and 91 kW, respectively. This behavior is related to the decrease in the syngas chemical energy since the syngas LHV was reduced from 9 MJ/Nm3 to 8 MJ/Nm3 as ER was varied, which are associated with augmentation of the content of CO2 and N2 in the syngas.

3.3. Environmental Assessment

For the environmental impact analysis, midpoint categories were computed, which are indicators commonly adopted to calculate the performance of the life cycle of a process. The impact categories and their respective units are, mainly: Climate change (kg CO2-eq); Ozone depletion (kg CFC-11 eq); Terrestrial acidification (kg SO2 eq); Freshwater eutrophication (kg N eq); Terrestrial ecotoxicity and Human toxicity (kg 1.4-DB eq); Photochemical oxidant formation (kg MNVOC eq) and Agricultural land occupation (m2a). Thus, an indicator represents a variable, which describes a characteristic of the state of a system, generally through observed or estimated data [50].
Table 6 shows the results obtained for the impact categories analyzed. Higher values indicate worse performance in the category, while lower or negative values indicate environmental benefits. The results obtained for the climate change category were satisfactory, generating values that indicate the reduction of emissions, resulting from the charges avoided by the improvement of electricity generation. Furthermore, the energy generation stage is the one that contributes the least to the total CO2 emission, with a value of −4360.05 kg CO2 eq due to the use of MG. On the other hand, the MSW pretreatment step is the one that most contributes to the emission of CO2 with a value of 2474.49 kg CO2 eq, followed by the transportation step with 17.00316264 kg CO2 eq and gasification with a value of 16.8 kg CO2 eq. According to Nie et al. [51], the emissions originating from waste transportation activity are mainly related to the fuels used during the operation in heavy-duty trucks. The study also found that the mixed collection of waste and conventional transport is not distinguished between categories, and thus revealing the highest efficiency. Nevertheless, electricity consumption from the use of RDF preparation equipment also contributes to GHG emissions.
Figure 10 shows the potential environmental impacts for the evaluated scenario (gasification using air enriched with oxygen coupled to GM), following the stages such as transportation and pre-treatment of MSW, gasification, and electricity generation. Great contributions are from the impact categories on terrestrial and marine ecotoxicity, associated with the burning of organic compounds and SO2 emissions originating in the process of gasification and power generation in GM, which constitute pollutants that directly contribute to terrestrial acidification/eutrophication, as well as damage in the climate change and resource categories.
However, these results are better than conventional technologies, as shown by Dong et al. [22]. The results of this study showed that gasification has the potential to reduce environmental loads by reducing emissions from the process, when compared to fossil technologies, in addition to presenting better energy efficiency.
Another work was by Evangelisti et al. [52] who compared gasification with conventional treatments. The results showed less impact from acidification compared to incineration and less CH4 emission.
It is worth mentioning that the use of land is still one of the difficulties related to the sustainable management of MSW, while there is a significant reduction in arable land occupied by sanitary landfills and places of inadequate waste disposal. The limitations regarding the use and occupation of the land, and the need for advances concerning the development of practices and technologies that meet the different waste management scenarios still constitute major obstacles worldwide. For the considered scenario, the agricultural land occupation category presents a value of −4.39 m2a, which indicates that less landfill area would be used, as RDF is the fuel in gasification process.

4. Conclusions

This study involves an economic and environmental evaluation of refuse-derived fuel gasification/electricity generation. In this work, a chemical equilibrium model was developed for RDF gasification and the Life Cycle Assessment methodology was performed. Two scenarios were considered in RDF gasification modeling with different gasification agents: air and oxygen-enriched air (with 60% O2–40% N2). Key results show that in an oxygen-enriched RDF gasification environment, the syngas LHV value reaches 8.0 MJ/Nm3 with ER equals 0.3, which produces 79.6 kW of electrical power when used in the GM.
Environmental impacts in various scenarios were assessed using a life cycle assessment. Emissions from the pretreatment and gasification stages of the MSW are the dominant ones with a value of 2474.49 kg CO2 eq. The electricity generation stage had positive impacts for all categories analyzed through the LCA. The environmental impacts determined by the ReCiPe method indicate that pollutant emissions from the burning of fossil fuels present greater impacts for climate change, ozone depletion, terrestrial ecotoxicity, and fossil depletion categories. Therefore, gasification can be considered a promising technology for the management and use of MSW, it enables the production of useful syngas for different applications and with low environmental impact when compared to traditional MSW management methods, such as incineration. Taking into account the results of environmental impacts, concerning emissions from the MSW transport stage, a potential way to reduce these negative impacts would be to re-dimension the MSW collection routes, optimize the collection of fractions and reduce fuel consumption. The processes for transforming and obtaining RDF are highly energy-intensive, therefore, an alternative to reduce the negative environmental impact of RDF production could be the reduction of energy consumption in these operations with the use of more efficient equipment in the energy context and use of green energy (use of clean sources of electricity generation such as solar photovoltaics mainly for MSW drying and crushing steps). These are certain initiatives that depend on the assessment of economic feasibility among other variables. In summary, several factors will affect the quality and characteristics of the RDF. The use of urban solid waste also requires continuous work on environmental education for citizens and changes in consumption habits, which will allow greater advances in the future in terms of sustainable management of waste and preservation of the environment.

Author Contributions

Conceptualization T.E.M. and Y.C.S.; methodology, T.E.M. and D.M.Y.M.; software, T.E.M., M.L.G.R. and Y.C.S.; validation, T.E.M., Y.C.S. and Y.S.; formal analysis, L.A.S., A.R. and D.M.Y.M.; investigation, T.E.M. and Y.C.S.; resources, M.L.G.R.; writing—original draft preparation, T.E.M. and Y.C.S.; writing—review and editing, D.M.Y.M. and L.A.S.; visualization, Y.C.S. and L.A.S.; review, editing, and supervision, Y.S. and A.R.; project administration, D.M.Y.M.; funding acquisition, M.L.G.R. All authors have read and agreed to the published version of the manuscript.

Funding

The authors wish to express their gratitude to the financial support provided by, CNPq, CAPES, FAPEMIG, FAPERJ, and to the Human Resources Program of the ANP (PRH-ANP n°51.1).

Institutional Review Board Statement

Not applicable.

Informed Consent Statement

Not applicable.

Data Availability Statement

Not applicable.

Conflicts of Interest

The authors declare no conflict of interest.

References

  1. ABRELPE. Panorama dos Resíduos Sólidos no Brasil 2020; ABRELPE: São Paulo, Brazil, 2020. [Google Scholar]
  2. SEEG Sistema de Estimativas de Emissões e Remoções de Gases de Efeito Estufa—Emissões Do Setor De Resíduos. Available online: https://seeg.eco.br/ (accessed on 10 February 2021).
  3. Gouveia, N. Resíduos sólidos urbanos: Impactos socioambientais e perspectiva de manejo sustentável com inclusão social. Cien. Saude Colet. 2012, 17, 1503–1510. [Google Scholar] [CrossRef] [Green Version]
  4. Mamede, M.C.D.S. Avaliação Econômica e Ambiental do Aproveitamento Energético de Resíduos Sólidos no Brasil; Universidade Estadual de Campinas: Campinas, Brazil, 2010. [Google Scholar]
  5. Instituto Brasileiro de Meio Ambiente Instrução Normativa No 13, de 18 de Dezembro de 2012. Available online: https://www.legisweb.com.br/legislacao/?id=248656 (accessed on 23 January 2021).
  6. Yaman, C.; Anil, I.; Alagha, O. Potential for greenhouse gas reduction and energy recovery from MSW through different waste management technologies. J. Clean. Prod. 2020, 264, 121432. [Google Scholar] [CrossRef]
  7. Beyene, H.D.; Werkneh, A.A.; Ambaye, T.G. Current updates on waste to energy (WtE) technologies: A review. Renew. Energy Focus 2018, 24, 1–11. [Google Scholar] [CrossRef]
  8. Ramos, A.; Monteiro, E.; Silva, V.; Rouboa, A. Co-gasification and recent developments on waste-to-energy conversion: A review. Renew. Sustain. Energy Rev. 2018, 81, 380–398. [Google Scholar] [CrossRef]
  9. Martínez González, A.; Silva Lora, E.E.; Escobar Palacio, J.C. Syngas production from oil sludge gasification and its potential use in power generation systems: An energy and exergy analysis. Energy 2019, 169, 1175–1190. [Google Scholar] [CrossRef]
  10. Couto, N.D.; Silva, V.B.; Rouboa, A. Assessment on steam gasification of municipal solid waste against biomass substrates. Energy Convers. Manag. 2016, 124, 92–103. [Google Scholar] [CrossRef]
  11. Lensu, T.; Alakangas, E. Small-Scale Electricity Generation from Renewable Energy Sources: A Glance at Selected Technologies, Their Market Potential and Future Prospects; VTT Technical Research Centre of Finland: Espoo, Finland, 2010. [Google Scholar]
  12. Sarmiento, A.L.E.; de Oliveira, W.; Camacho, R.G.R. Influence of the vortex design method in the performance characteristics of reversible axial rotors. J. Brazilian Soc. Mech. Sci. Eng. 2017, 39, 1575–1588. [Google Scholar] [CrossRef]
  13. Perna, A.; Minutillo, M.; Jannelli, E.; Cigolotti, V.; Nam, S.W.; Yoon, K.J. Performance assessment of a hybrid SOFC/MGT cogeneration power plant fed by syngas from a biomass down-draft gasifier. Appl. Energy 2018, 227, 80–91. [Google Scholar] [CrossRef]
  14. Benini, E. Progress in Gas Turbine Performance, 1st ed.; Benini, E., Ed.; IntechOpen: London, UK, 2013; ISBN 978-953-51-1166-5. [Google Scholar]
  15. Konečná, E.; Teng, S.Y.; Máša, V. New insights into the potential of the gas microturbine in microgrids and industrial applications. Renew. Sustain. Energy Rev. 2020, 134, 110078. [Google Scholar] [CrossRef]
  16. Capstone. Capstone MicroTurbine® Fuel Requirements Technical Reference; Capstone: Chatsworth, CA, USA, 2014. [Google Scholar]
  17. Khatri, P.; Jain, S.; Pandey, S. A cradle-to-gate assessment of environmental impacts for production of mustard oil using life cycle assessment approach. J. Clean. Prod. 2017, 166, 988–997. [Google Scholar] [CrossRef]
  18. Venturini, O.J.; Júnior, J.C.F.; Palacio, J.C.E.; Batlle, E.A.O.; Carvalho, M.; Lora, E.E.S. Indicators for sustainability assessment of biofuels: Economic, environmental, social, and technological dimensions. In Biofuels for a More Sustainable Future: Life Cycle Sustainability Assessment and Multi-Criteria Decision Making; Ren, J., Scipioni, A., Manzardo, A., Liang, H., Eds.; Elsevier: Amsterdam, The Netherlands, 2020; pp. 73–113. ISBN 978-0-12-815581-3. [Google Scholar]
  19. Rabou, L.P.L.M.; Grift, J.M.; Conradie, R.E.; Fransen, S. Micro Gas Turbine Operation with Biomass Producer Gas and Mixtures of Biomass Producer Gas and Natural Gas. Energy Fuels 2008, 22, 1944–1948. [Google Scholar] [CrossRef] [Green Version]
  20. Corrêa, P.S.P.; Zhang, J.; Lora, E.E.S.; Andrade, R.V.; de Mello e Pinto, L.R.; Ratner, A. Experimental study on applying biomass-derived syngas in a microturbine. Appl. Therm. Eng. 2019, 146, 328–337. [Google Scholar] [CrossRef]
  21. Násner Lozano, A.M.; Silva Lora, E.E.; Escobar Palacio, J.C.; Rocha, M.H.; Restrepo, J.C.; Venturini, O.J.; Ratner, A. Refuse Derived Fuel (RDF) production and gasification in a pilot plant integrated with an Otto cycle ICE through Aspen plusTM modelling: Thermodynamic and economic viability. Waste Manag. 2017, 69, 187–201. [Google Scholar] [CrossRef] [PubMed]
  22. Dong, J.; Tang, Y.; Nzihou, A.; Chi, Y.; Weiss-Hortala, E.; Ni, M. Life cycle assessment of pyrolysis, gasification and incineration waste-to-energy technologies: Theoretical analysis and case study of commercial plants. Sci. Total Environ. 2018, 626, 744–753. [Google Scholar] [CrossRef]
  23. Acar, M.C.; Böke, Y.E. Simulation of biomass gasification in a BFBG using chemical equilibrium model and restricted chemical equilibrium method. Biomass Bioenergy 2019, 125, 131–138. [Google Scholar] [CrossRef]
  24. Aydin, E.S.; Yucel, O.; Sadikoglu, H. Development of a semi-empirical equilibrium model for downdraft gasification systems. Energy 2017, 130, 86–98. [Google Scholar] [CrossRef]
  25. Sittisun, P.; Tippayawong, N.; Pang, S. Biomass gasification in a fixed bed downdraft reactor with oxygen enriched air: A modified equilibrium modeling study. Energy Procedia 2019, 160, 317–323. [Google Scholar] [CrossRef]
  26. Bhattacharyya, D.; Turton, R.; Zitney, S.E. Steady-State Simulation and Optimization of an Integrated Gasification Combined Cycle Power Plant with CO2 Capture. Ind. Eng. Chem. Res. 2011, 50, 1674–1690. [Google Scholar] [CrossRef]
  27. Roussanaly, S.; Brunsvold, A.L.; Hognes, E.S.; Jakobsen, J.P.; Zhang, X. Integrated Techno-economic and Environmental Assessment of an Amine-based Capture. Energy Procedia 2013, 37, 2453–2461. [Google Scholar] [CrossRef] [Green Version]
  28. Kuo, P.C.; Wu, W.; Chen, W.H. Gasification performances of raw and torrefied biomass in a downdraft fixed bed gasifier using thermodynamic analysis. Fuel 2014, 117, 1231–1241. [Google Scholar] [CrossRef]
  29. Campoy, M.; Gómez-Barea, A.; Vidal, F.B.; Ollero, P. Air–steam gasification of biomass in a fluidised bed: Process optimisation by enriched air. Fuel Process. Technol. 2009, 90, 677–685. [Google Scholar] [CrossRef]
  30. Capstone. Combined Heat and Power Systems Technology Development and Demonstration 370 kW High Efficiency Microturbine; Capstone: Los Angeles, CA, USA, 2015. [Google Scholar]
  31. Capstone Capstone C200 Microturbine Technical Reference; Capstone: Los Angeles, CA, USA, 2009.
  32. Malkamäk, M.; Jaatinen-Värri, A.; Honkatukia, J.; Backman, J.; Larjola, J. A High efficiency microturbine concept. In Proceedings of the 11th European Conference on Turbomachinery Fluid dynamics & Thermodynamics, Madrid, Spain, 23–27 March 2015; pp. 1–12. [Google Scholar]
  33. Saravanamuttoo, H.; Rogers, G.; Cohen, H.; Straznicky, P.; Nix, A. Gas Turbine Theory, 7th ed.; Saravanamuttoo, H., Rogers, G., Cohen, H., Straznicky, P., Nix, A., Eds.; Pearson Education Limited: Harlow, UK, 2017; ISBN 9781-292-09313-0. [Google Scholar]
  34. Venturini, O.J.; Orozco, D.J.R.; Escobar, J.C.P.; Lora, E.E.S. Performance Evaluation of Microturbines Operating With Second-Generation Biofuels. In Proceedings of the ENCIT 2016, Vitória, Brazil, 7–10 November 2016; ABCM: Vitória, Brazil, 2016; pp. 1–10. [Google Scholar]
  35. Zhu, P.; Saravanamuttoo, H.I.H. Simulation of an Advanced Twin-Spool Industrial Gas Turbine. J. Eng. Gas Turbines Power 1992, 114, 180–185. [Google Scholar] [CrossRef]
  36. Grigoratos, T.; Fontaras, G.; Giechaskiel, B.; Zacharof, N. Real world emissions performance of heavy-duty Euro VI diesel vehicles. Atmos. Environ. 2019, 201, 348–359. [Google Scholar] [CrossRef]
  37. Goedkoop, M.; Heijungs, R.; Huijbregts, M.; De Schryver, A.; Struijs, J.; van Zelm, R. ReCiPe 2008: A Life Cycle Impact Assessment Method Which Comprises Harmonised Category Indicators at the Midpoint and the Endpoint Level; Ruimte & Milieu: Amersfoort, The Netherlands, 2009. [Google Scholar]
  38. Castillo Santiago, Y.; Martínez González, A.; Venturini, O.J.; Yepes Maya, D.M. Assessment of the energy recovery potential of oil sludge through gasification aiming electricity generation. Energy 2021, 215, 119210. [Google Scholar] [CrossRef]
  39. Lv, P.; Yuan, Z.; Ma, L.; Wu, C.; Chen, Y.; Zhu, J. Hydrogen-rich gas production from biomass air and oxygen/steam gasification in a downdraft gasifier. Renew. Energy 2007, 32, 2173–2185. [Google Scholar] [CrossRef]
  40. Yepes Maya, D.M.; Silva Lora, E.E.; Vieira Andrade, R.; Ratner, A.; Espinosa Sarmiento, A.L.; de Mello e Pinto, L.R.; Mendes Neto, L.J. Biomass Gasification in Downdraft Dual Stage Reactor by Experimental Analysis and Simulation with CFD Tools. In Proceedings of the 25th European Biomass Conference and Exhibition, Stockholm, Sweden, 12–15 June 2017; pp. 808–816. [Google Scholar]
  41. Couto, N.D.; Silva, V.B.; Monteiro, E.; Rouboa, A. Assessment of municipal solid wastes gasification in a semi-industrial gasifier using syngas quality indices. Energy 2015, 93, 864–873. [Google Scholar] [CrossRef]
  42. Tamošiūnas, A.; Jeguirim, M. Char gasification. In Char and Carbon Materials Derived from Biomass; Jeguirim, M., Limousy, L., Eds.; Elsevier: Amsterdam, The Netherlands, 2019; pp. 187–228. ISBN 978-0-12-814893-8. [Google Scholar]
  43. Ramzan, N.; Ashraf, A.; Naveed, S.; Malik, A. Simulation of hybrid biomass gasification using Aspen plus: A comparative performance analysis for food, municipal solid and poultry waste. Biomass Bioenergy 2011, 35, 3962–3969. [Google Scholar] [CrossRef]
  44. Cao, Y.; Wang, Q.; Du, J.; Chen, J. Oxygen-enriched air gasification of biomass materials for high-quality syngas production. Energy Convers. Manag. 2019, 199, 111628. [Google Scholar] [CrossRef]
  45. Islam, M.W. Effect of different gasifying agents (steam, H2O2, oxygen, CO2, and air) on gasification parameters. Int. J. Hydrogen Energy 2020, 45, 31760–31774. [Google Scholar] [CrossRef]
  46. Basu, P. Biomass Gasification, Pyrolysis, and Torrefaction: Practical Design and Theory, 2nd ed.; Basu, P., Ed.; Elsevier: San Diego, CA, USA, 2013; ISBN 978-0-12-396488-5. [Google Scholar]
  47. Ismail, T.M.; Ramos, A.; Monteiro, E.; El-Salam, M.A.; Rouboa, A. Parametric studies in the gasification agent and fluidization velocity during oxygen-enriched gasification of biomass in a pilot-scale fluidized bed: Experimental and numerical assessment. Renew. Energy 2020, 147, 2429–2439. [Google Scholar] [CrossRef]
  48. Liu, L.; Huang, Y.; Cao, J.; Liu, C.; Dong, L.; Xu, L.; Zha, J. Experimental study of biomass gasification with oxygen-enriched air in fluidized bed gasifier. Sci. Total Environ. 2018, 626, 423–433. [Google Scholar] [CrossRef]
  49. Page, D.; Shaffer, B.; McDonell, V. Establishing Operating Limits in a Commercial Lean Premixed Combustor Operating on Synthesis Gas Pertaining to Flashback and Blowout. In Proceedings of the ASME Turbo Expo 2012: Turbine Technical Conference and Exposition, Copenhagen, Denmark, 11 June 2012; ASME: Copenhagen, Denmark, 2012; pp. 647–656. [Google Scholar]
  50. Renó, M.L.G.; Del Olmo, O.A.; Palacio, J.C.E.; Lora, E.E.S.; Venturini, O.J. Sugarcane biorefineries: Case studies applied to the Brazilian sugar-alcohol industry. Energy Convers. Manag. 2014, 86, 981–991. [Google Scholar] [CrossRef]
  51. Nie, Y.; Wu, Y.; Zhao, J.; Zhao, J.; Chen, X.; Maraseni, T.; Qian, G. Is the finer the better for municipal solid waste (MSW) classification in view of recyclable constituents? A comprehensive social, economic and environmental analysis. Waste Manag. 2018, 79, 472–480. [Google Scholar] [CrossRef] [PubMed]
  52. Evangelisti, S.; Tagliaferri, C.; Clift, R.; Lettieri, P.; Taylor, R.; Chapman, C. Life cycle assessment of conventional and two-stage advanced energy-from-waste technologies for municipal solid waste treatment. J. Clean. Prod. 2015, 100, 212–223. [Google Scholar] [CrossRef]
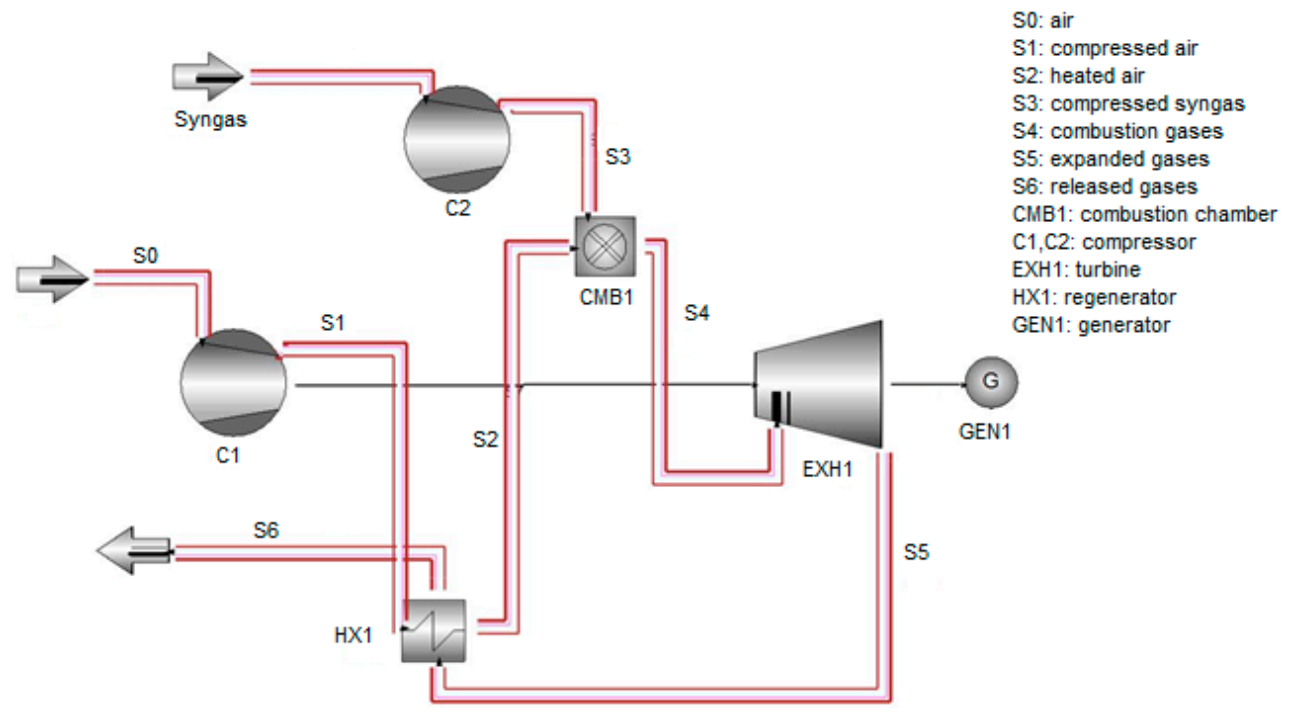
Figure 1. Schematic representation of gas microturbine.
Processes 09 02255 g001
Figure 2. Gasification temperature: gasification with air.
Processes 09 02255 g002
Figure 3. Syngas composition: gasification with air (dry basis).
Processes 09 02255 g003
Figure 4. LHV and Ecold of syngas: gasification with air.
Processes 09 02255 g004
Figure 5. Gasification temperature: oxygen-enriched air gasification.
Processes 09 02255 g005
Figure 6. Syngas composition: oxygen-enriched air (dry basis).
Processes 09 02255 g006
Figure 7. Syngas LHV and Ecold: Gasification with oxygen-enriched air.
Processes 09 02255 g007
Figure 8. Power generated by the microturbine using syngas as fuel.
Processes 09 02255 g008
Figure 9. Gas microturbine efficiency using syngas as fuel.
Processes 09 02255 g009
Figure 10. Impact categories evaluated for gasification/gas microturbine system.
Processes 09 02255 g010
Table 1. Ultimate and proximate analysis of RDF on a dry basis.
CHONSAshVolatileFCMoisture
44.91%6.45%44.82%1.7%2.12%2.43%72.58%16.70%8.29%
Table 2. Biomass composition and operational conditions.
ParameterUnitValueParameterUnitValue
Proximate AnalysisOperational Conditions
Fixed Carbon%19.5Biomass mass flowkg/h21.6
Volatiles%80.0Reactor pressurebar1.013
Moisture%6.3Average bed temperature°C840
Ash%0.5ER-0.24–0.38
Ultimate Analysis
Carbon%49.5
Hydrogen%5.8
Nitrogen%2.0
Sulfur%0.1
Oxygen%42.1
Table 3. Model validation results on a dry basis (%vol.).
ERSB%CO (E)%CO (M)%H2 (E)%H2 (M)%CO2 (E)%CO2 (M)%CH4 (E)%CH4 (M)RMS
0.350.0015.8024.578.7017.0315.109.685.102.086.08
0.330.2215.4019.3011.9019.2615.9013.964.803.273.89
0.330.4513.8014.4613.3020.1217.0017.564.604.123.09
0.270.2315.0017.6214.0018.9016.2016.674.706.462.64
0.270.4311.9012.9616.2019.6718.6020.125.307.281.97
Table 4. GM operational parameters for on-design condition [30,31,32,33,34].
ParameterValueParameterValue
Rated power200 ± 4 kWCompressor efficiency79%
Net efficiency33 ± 2%Turbine efficiency82.5%
Heat rate (LHV)10.9 MJ/kWhRegenerator effectiveness85%
Generator efficiency93.8%Regenerator cold side loss1.6%
Fuel energetic flow2400 MJ/hRegenerator hot side loss3.8%
Exhaust temperature280 °CCombustion efficiency98%
Pressure ratio4.0Turbine inlet temperature951 °C
Table 5. Life cycle inventory.
InputQuantityOutputQuantity
Stage—MSW Transportation
Diesel5.09078 kgCO213.74 kg
CO0.09 kg
NOx—Nitrogen oxides0.01143 kg
THC—Total hydrocarbons0.0189 kg
PM10—Particulate matter0.009324 kg
Stage—RDF Pretreatment and Gasification
RDF pretreatment44.4 kWAsh2.43 kg
Electricity for gasification36 kW
Air64.8 kg
Stage—Electricity Generation from GM
Syngas164.8 kgCO225.35 kg
SO27.48 kg
Electricity79.6 kW
Table 6. Environmental impacts of the gasification/gas microturbine system.
Impact Categories MidpointMSW TransportationPretreatment MSW/RDFRDF GasificationElectric Generation in GMUnit
Climate change17.02474.4916.8−4360.05kg CO2 eq
Ozone depletion6.55 × 10−102.83 × 10−72.30 × 10−9−5.07 × 10⁻⁷kg CFC−11
Terrestrial acidification0.0317.740.144−29.84kg SO2 eq
Freshwater eutrophication00.0011.19 × 10−5−0.002kg P eq
Marine eutrophication0.0011.000.008−1.8kg N eq
Human toxicity0.570.280.002−0.51kg 1.4-DB eq
Photochemical oxidant formation0.0426.540.21−47.43kg NMVOC
Particulate matter formation0.016.670.05−11.56kg PM10 eq
Terrestrial ecotoxicity2.03 × 10−50.070.00062.03 × 10−5kg 1.4-DB eq
Freshwater ecotoxicity0.070.110.0009−0.20kg 1.4-DB eq
Marine ecotoxicity0.070.050.0004−0.09kg 1.4-DB eq
Ionizing radiation01.040.008−1.87kg Bq U235 eq
Agricultural land occupation02.450.02−4.39m2a
Urban land occupation00.090.0007−0.17m2a
Natural land transformation00.0075.97 × 10−5−0.01m2
Water depletion0239.051.94−428.56m3
Metal depletion00.320.002−0.58kg Feeq
Fossil depletion5.352.360.02−4.23kg oileq
Publisher’s Note: MDPI stays neutral with regard to jurisdictional claims in published maps and institutional affiliations.