Article

Three-Dimensional Numerical Simulations and Antifouling Mechanism of Microorganisms on Microstructured Surfaces

Department of Power Engineering, North China Electric Power University, Baoding 071003, China
*
Author to whom correspondence should be addressed.
Processes 2021, 9(2), 319; https://doi.org/10.3390/pr9020319
Submission received: 12 December 2020 / Revised: 29 January 2021 / Accepted: 5 February 2021 / Published: 9 February 2021

Abstract

:
As marine biofouling seriously affects the development and utilization of oceans, the antifouling technology of microstructured surface has become a research hotspot due to its green and environmentally friendly advantages. In the present research, the motion models of microorganisms on the surfaces of five rectangular micropits, in co-current and counter-current flow direction, were established. Dynamic mesh technology was used to simulate the movements of microorganisms with different radii in the near-wall area, and the fluid kinematics and shear stress distributions in different-sized micropits were compared. Furthermore, moving microorganisms were included in the three-dimensional microstructure model to achieve the real situation of biofouling. Simulation results revealed that the vortex flow velocity in the micropits increased with the increase of the inlet flow velocity and the existence of the vortex flow effectively reduced the formation of conditioning layers in the micropits. In the downstream and countercurrent directions, the average shear stresses on the wall decreased with the increase of the micropit depth and width, and the shear stress on the inner wall of the Mp1 micropit (a patterned surface arranged with cubes of 2 µm × 2 µm × 2 µm) was found to be the largest. A low shear stress region with a low flow velocity was formed around microorganisms in the process of approaching the microstructured surface. The shear stress gradient of micro-ridge steps increased with the approach of microorganisms, indicating that microridge edges had a better effect on reducing microbial attachment.

1. Introduction

Biofouling occurs when marine organisms become adhered to the surfaces of offshore artificial facilities, and the deepening of the adhesion leads to shipping energy loss, hull corrosion, pipeline blockage, and instrument failure. Exploiting the drag reduction and self-cleaning characteristics of natural animal and plant surfaces [1,2,3,4], microstructured surfaces with antifouling properties have been designed [5,6]. Moreover, the antifouling technology of microstructured surfaces has become a research hotspot due to its green and environmentally friendly advantages. Antifouling microstructured surfaces are mainly developed by imitating multiscale micro-nano structures of natural biological surfaces. The evaluation of the antifouling performance of microstructures is mainly carried out based on the experimental results of common fouling organisms. Therefore, it is crucial to investigate the antifouling mechanism of microstructured surfaces.
A biofouling process generally occurs in three stages. The first stage is the formation of a conditioning layer from the surface covered by seawater, and it lasts one minute to one hour [7]. In the second stage, bacteria, and other microorganisms approach, settle, contact, and adhere to form a biofilm near the surface, and it is a reversible process [8]. In the third stage, large fouling organisms aggregate outside the biofilm to form a stable and complex biological community. Therefore, the main aim of the antifouling technology of microstructured surfaces is to reduce the probability of microbial approach and contact and increase the desorption rate in the first two stages to reduce the amount of attachments.
In the early 20th century, Wenzel et al. [9] and Cassie et al. [10] discovered that different surface roughness values would lead to different wettability of materials. Numerous studies have been conducted to explore the influence of wettability on biological attachments [11,12]. Since then, scholars from various countries have begun to design anti-fouling surfaces with different microstructures and have conducted a large number of experimental studies.
Brennan et al. and Carman et al. [5] designed cylindrical and ridge-shaped sharklet adhesively backed film bionic surfaces by imitating the microstructure of sharkskin and found that these microstructures could reduce the microbial attachment by about 85%. Schumacher et al. [13] studied four types of microstructural surfaces with 2-mm spacing and 3-mm height. Patterns designed included geometric features of 2-mm-wide ribs of various lengths (4, 8, 12, and 16 mm), 2-mm-diameter circular pillars, 2-mm-wide continuous ridges, and 10-mm equilateral triangles. Experimental results showed that these surfaces correspondingly reduced spore settlement by 77%, 58%, 36%, and 31%, respectively.
Zheng et al. [14] studied the micron-level protrusions on the surface of the starfish, and simulated the surface microstructure of the starfish with polydimethylsiloxane (PDMS). The regular hexagon is formed by 19 small cylindrical protrusions with a diameter of 2.5 μm and a pitch of 6 μm. The experimental results showed that the PDMS surface with the starfish microstructure has better antifouling performance than the smooth PDMS surface.
Scardino et al. [15] found the best antifouling performance when the characteristic size of the microstructure was slightly smaller than that of the attached organisms and proposed the “attachment contact theory”, which is the basis of the engineered roughness index (ERI) model, the ERIII model, the nano-force gradient model, and the surface energetic attachment (SEA) model.
Schumacher et al. [13] evaluated the ERI model based on the antifouling performances of four different microstructured surfaces with distinct arrangement rules. It was observed that the adhesion density of microorganisms decreased with the increase of the ERI value, and the validity of the predicted results was proved by an attachment experiment of Ulva lactuca spores. Long et al. [16] improved the parameters of the ERI model and established the ERIII model. It was asserted that when the area fraction of different characteristic structures on the surface increased, the number of attached spores decreased. Magin et al. [17] took the Reynolds number (Re) and the sensitivity factor (m) of microorganisms into account and found that the larger the Re value, the easier the microorganism movement with the water flow and the higher the difficulty of attachments.
Schumacher et al. [18] also considered the stress of microorganisms attached to different microstructures, summarized the ERI model data from mechanical perspectives, and established a nano-force gradient model based on the force transfer model. Decker et al. [19] meshed a microstructured surface, added the interface free energy based on the two ERI models, and established the SEA model to better predict the attachment of Ulva Lactuca spores, diatoms, and other organisms.
The two ERI models can only predict the attachment of Ulva Lactuca spores without considering surface wettability, the microbial characteristic size, and other parameters. The limitation of the nano-force gradient model is that microorganisms become attached to the protruding area of a microstructure and need multiple attachment points. However, in the nano-force gradient model, it is not considered that microorganisms may be smaller than the characteristic size or can adjust their directions to adhere to grooves. This model only considers rectangular protruded structures of different lengths and arrangements. The SEA model can well predict the adhesion of several microorganisms; however, some predicted results are inconsistent with those of the nano-force gradient model, and the reason for this contradiction is not reasonably explained.
The numerical simulation method based on computational fluid dynamics (CFD) is widely adopted in various fluid research because it is time saving, economical, and offers diverse research models, which has also been widely used in the microstructure antifouling field in recent years [20]. Young June won et al. [21] carried out numerical simulations on a film surface with prismatic stripe patterns and found that vortices were formed in groove areas between prismatic patterns; thus, particles entering the grooves could flow back to the cross-flow region along the vortices. Seon Yeop Jung et al. [22] simulated the deposition of colloidal particles on the surface of a ridge-patterned film and propounded that an “inaccessible zone” was formed near the surface of the microstructured film. It was also found that with the increase of Re and the ratio of particle radius to microridge height, the number of deposited particles decreased. Bin Ahmad Fawzan et al. [23] compared the antifouling performance of hierarchical and non-hierarchical topographies. Simulation results expressed that the range for wall shear of hierarchical topography is between 0.00281 Pa and 0.00452 Pa, while non-hierarchical topography is between 0.00165 Pa and 0.00301 Pa. Lee et al. [24] studied the shear stress distribution on a prismatic surface by simulations and suggested that a high shear stress was generated on the surface of the prismatic structure; hence, shear stress was considered as the main antifouling factor of the microstructured surface. In the present study, CFD was employed to simulate the movement of microorganisms in the near-wall zone and explain the antifouling mechanism of a microstructured surface.

2. Mathematical Physical Model

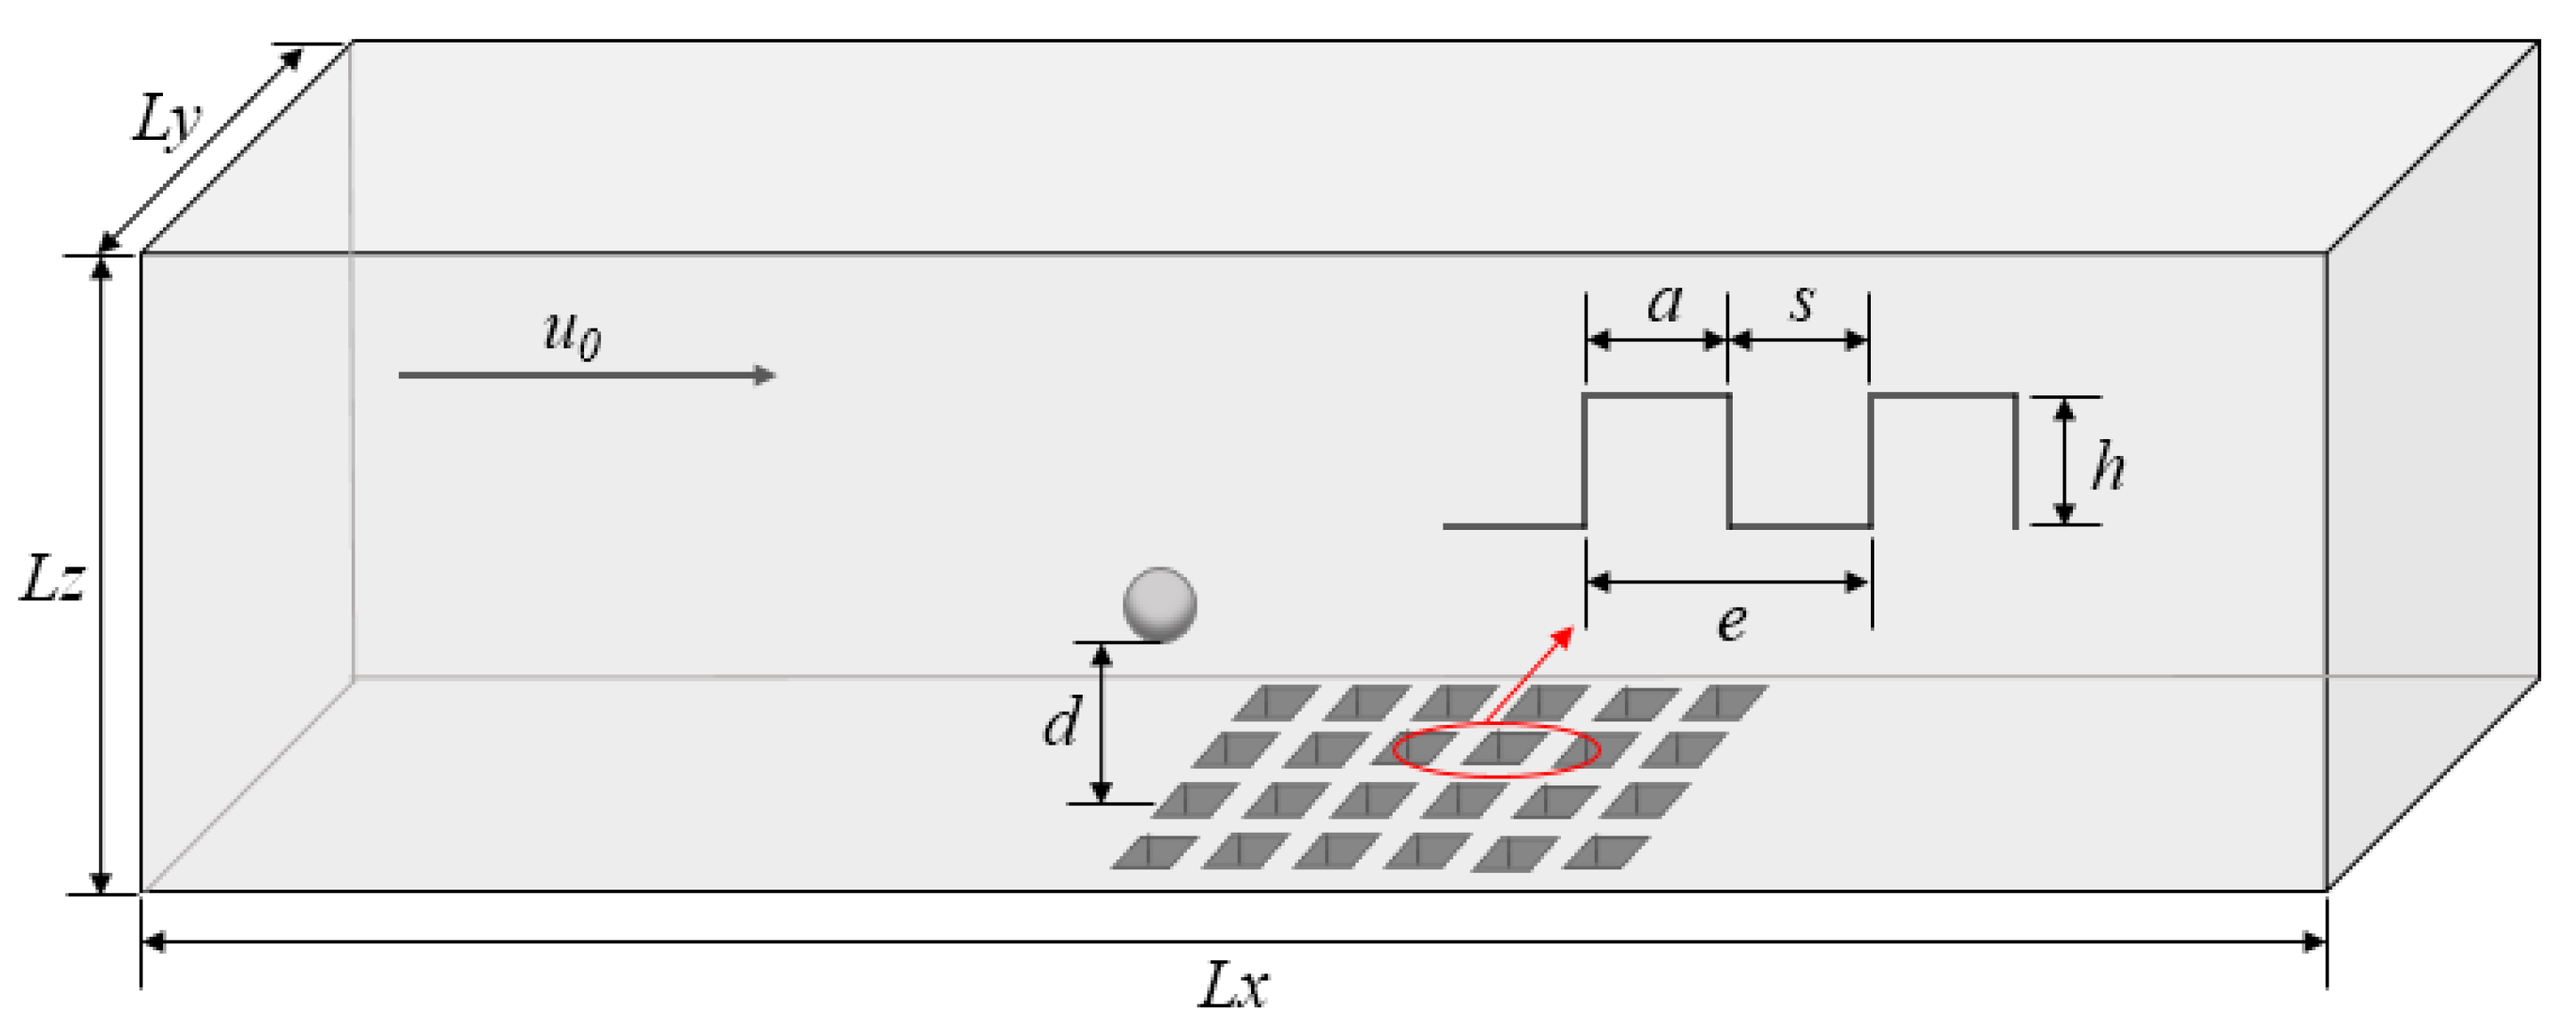
2.1. Model Parameters and Boundary Conditions

The fluid flow in a three-dimensional channel was simulated in the present research (Figure 1). The fluid was water at room temperature, and the viscosity was 0.894 × 10⁻³ Pa·s. The fluid was incompressible, and moved in a laminar flow with an inlet velocity of u0. The length, height, and width of the channel were, respectively, Lx = 350 µm, Ly = 60 µm, and Lz = 100 µm. The length of the microstructure area was 60 µm, and square micropits were evenly distributed on it. The depth and width of the micropits were h and s, respectively, and they were marked as Mp. The protrusion between two adjacent pits was called microridge, marked as Mr. The width of each microridge was a = 2 µm. The sizes of different micropit structures are presented in Table 1. In order to eliminate the influence of the inlet and outlet sections of the channel on the fluid state, a smooth surface with a certain length was set up at the inlet and outlet sections. The microbial model was simplified as an undeformable sphere with non-slip boundary and a radius of r, and the distance between the bottom of the microorganisms and the surface of the microstructure was d. It was assumed that the microorganisms could move forward and backward in the direction parallel to the microstructured surfaces. There are many microorganisms in the fluid, and they affect each other during the formation of fouling. In this article, we only focus on the situation where a single microorganism is affected by the fluid on the microstructured surface to analyze the factors of the antifouling mechanism, which does not mean replacing all the microorganisms in the flow field with a single microorganism. The simulation of a single microorganism can avoid the influence of a large number of microorganisms on the flow field and give a clearer demonstration of the mechanism of the microstructured surface.
The measurement positions at different heights above the microstructured surface were recorded as dc, and the fluid inflow and outflow positions in the micropits were denoted as Sin and Sout, respectively. The following dimensionless parameters were also used for calculations: the height-to-width ratio of the micropits β = h/s, the characteristic step size of nodes λe, and the pressure drop ratio:
Π = Δ p S Δ p Δ p S
where Δps and Δp are the pressure drops in the smooth microchannel and the channel with micropits, respectively.
In order to compare the simulation results of different-sized micropits, the normalized coordinate parameter xe was used:
x e = x x min x max x min
The shear stress gradient τ could be expressed as
τ = τ i + 1 τ i λ e
It was assumed that the microorganisms moved along the direction parallel to the bottom of the microstructured surface with a given inlet velocity, and dynamic mesh technology was used to simulate their movements. The average velocity of the microorganisms was 3 × 10⁻⁵ m/s [25]. The flow field in the channel was calculated according to the low-speed fluid flow experiment conducted by Halder [26], and the outlet was under free-flow conditions. The sedimentation velocity of algae microorganisms (υm) is usually expressed by Stokes equation [27] as:
υ m = 2 9 g r 2 ( ρ ρ ) η
where ρ and ρ′ denote the microbial cell density and water density, respectively, ρ = 1.046~1.076 × 10³ kg/m3 [28] and ρ′ = 1 × 10³ kg/m3. r, g and η are the microbial radii, acceleration of gravity and dynamic viscosity of the fluid, respectively. In our manuscript, the maximum radii of the microbial we simulated is 2.5 × 10⁻⁶ m. The sedimentation velocity (υm) of microbial under gravity is 0.70~1.16 × 10⁻⁶ m/s. The velocity of the microbial is 3 × 10⁻⁵ m/s, much greater than the sedimentation velocity caused by gravity. Therefore, the effect of gravity was neglected in the simulation.

2.2. Governing Equation and Calculation Method

The microscale flow state was simulated in the present analysis, and the fluid region was continuous and in the same velocity field; therefore, the governing equations for a continuous medium were still applicable. The density and viscosity of water were considered to be constant, and the laminar flow was determined without considering the effect of gravity. Hence, the governing equations for this analysis can be formulated as
The velocity vector:
V = u i + υ j + w k
Continuity equation:
V = 0
Momentum equation:
ρ D V D t = P + ρ g + η 2 V
where x, y, and z denote the coordinates along the X-, Y-, and Z-axes, respectively; u, v, and w are the fluid velocity components along the x-, y-, and z-axes, respectively.
In order to ensure calculation accuracy, the three-dimensional double precision solver of FLUENT software was used. SIMPLE algorithm was used for velocity and pressure, and the momentum equation was discretized by the second-order upwind scheme. In the dynamic flow field, the inlet velocity was uniformly distributed as u0 and the rest of the boundaries were non-slip surfaces. In the simulation, the time step of the unsteady model was 0.01 s. When the residuals of velocity and other parameters in all directions were less than 10−6, the convergence of the calculated results was noticed.

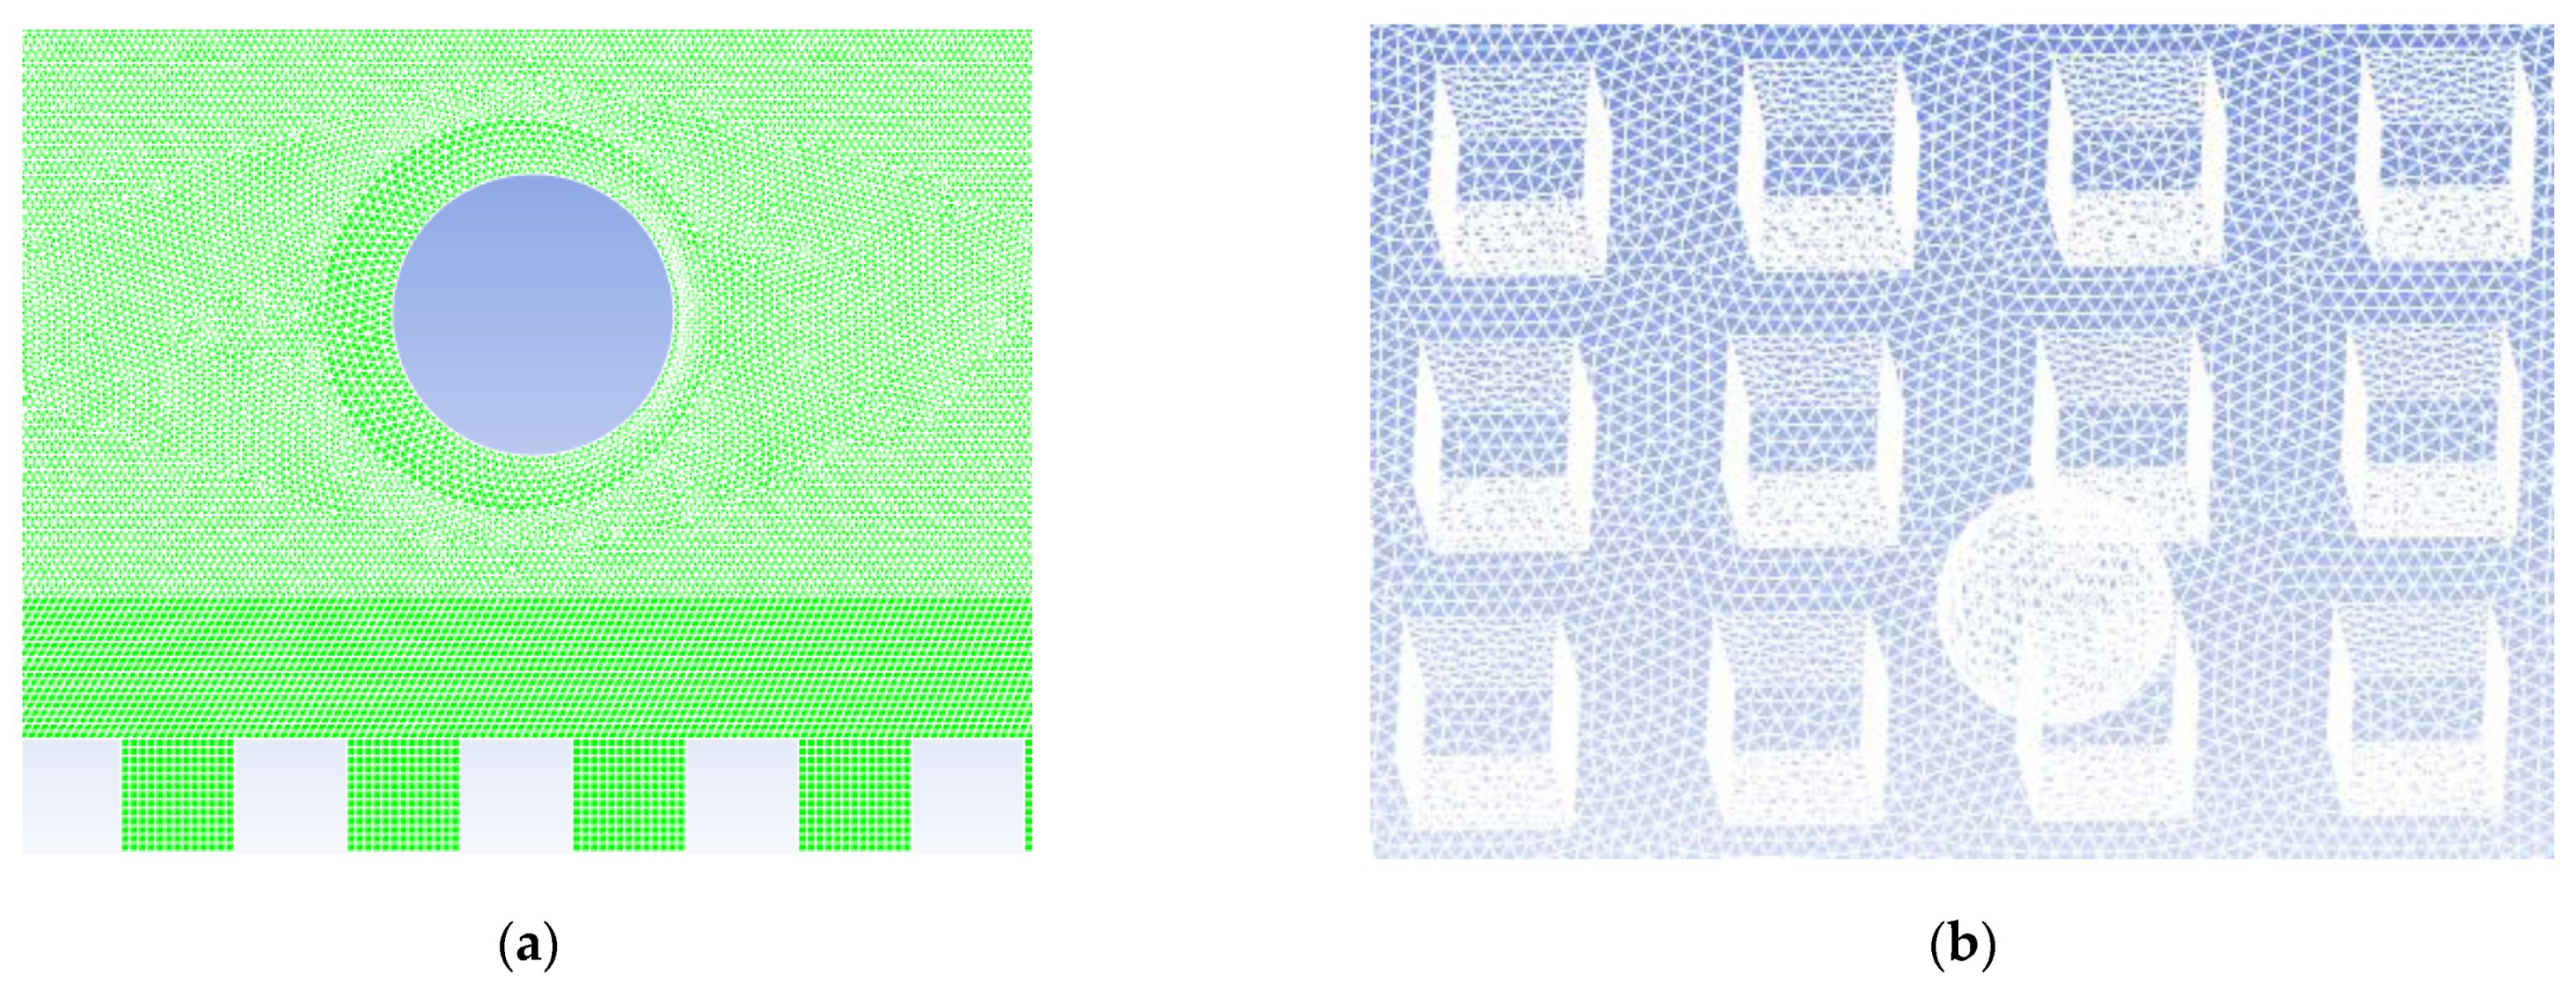
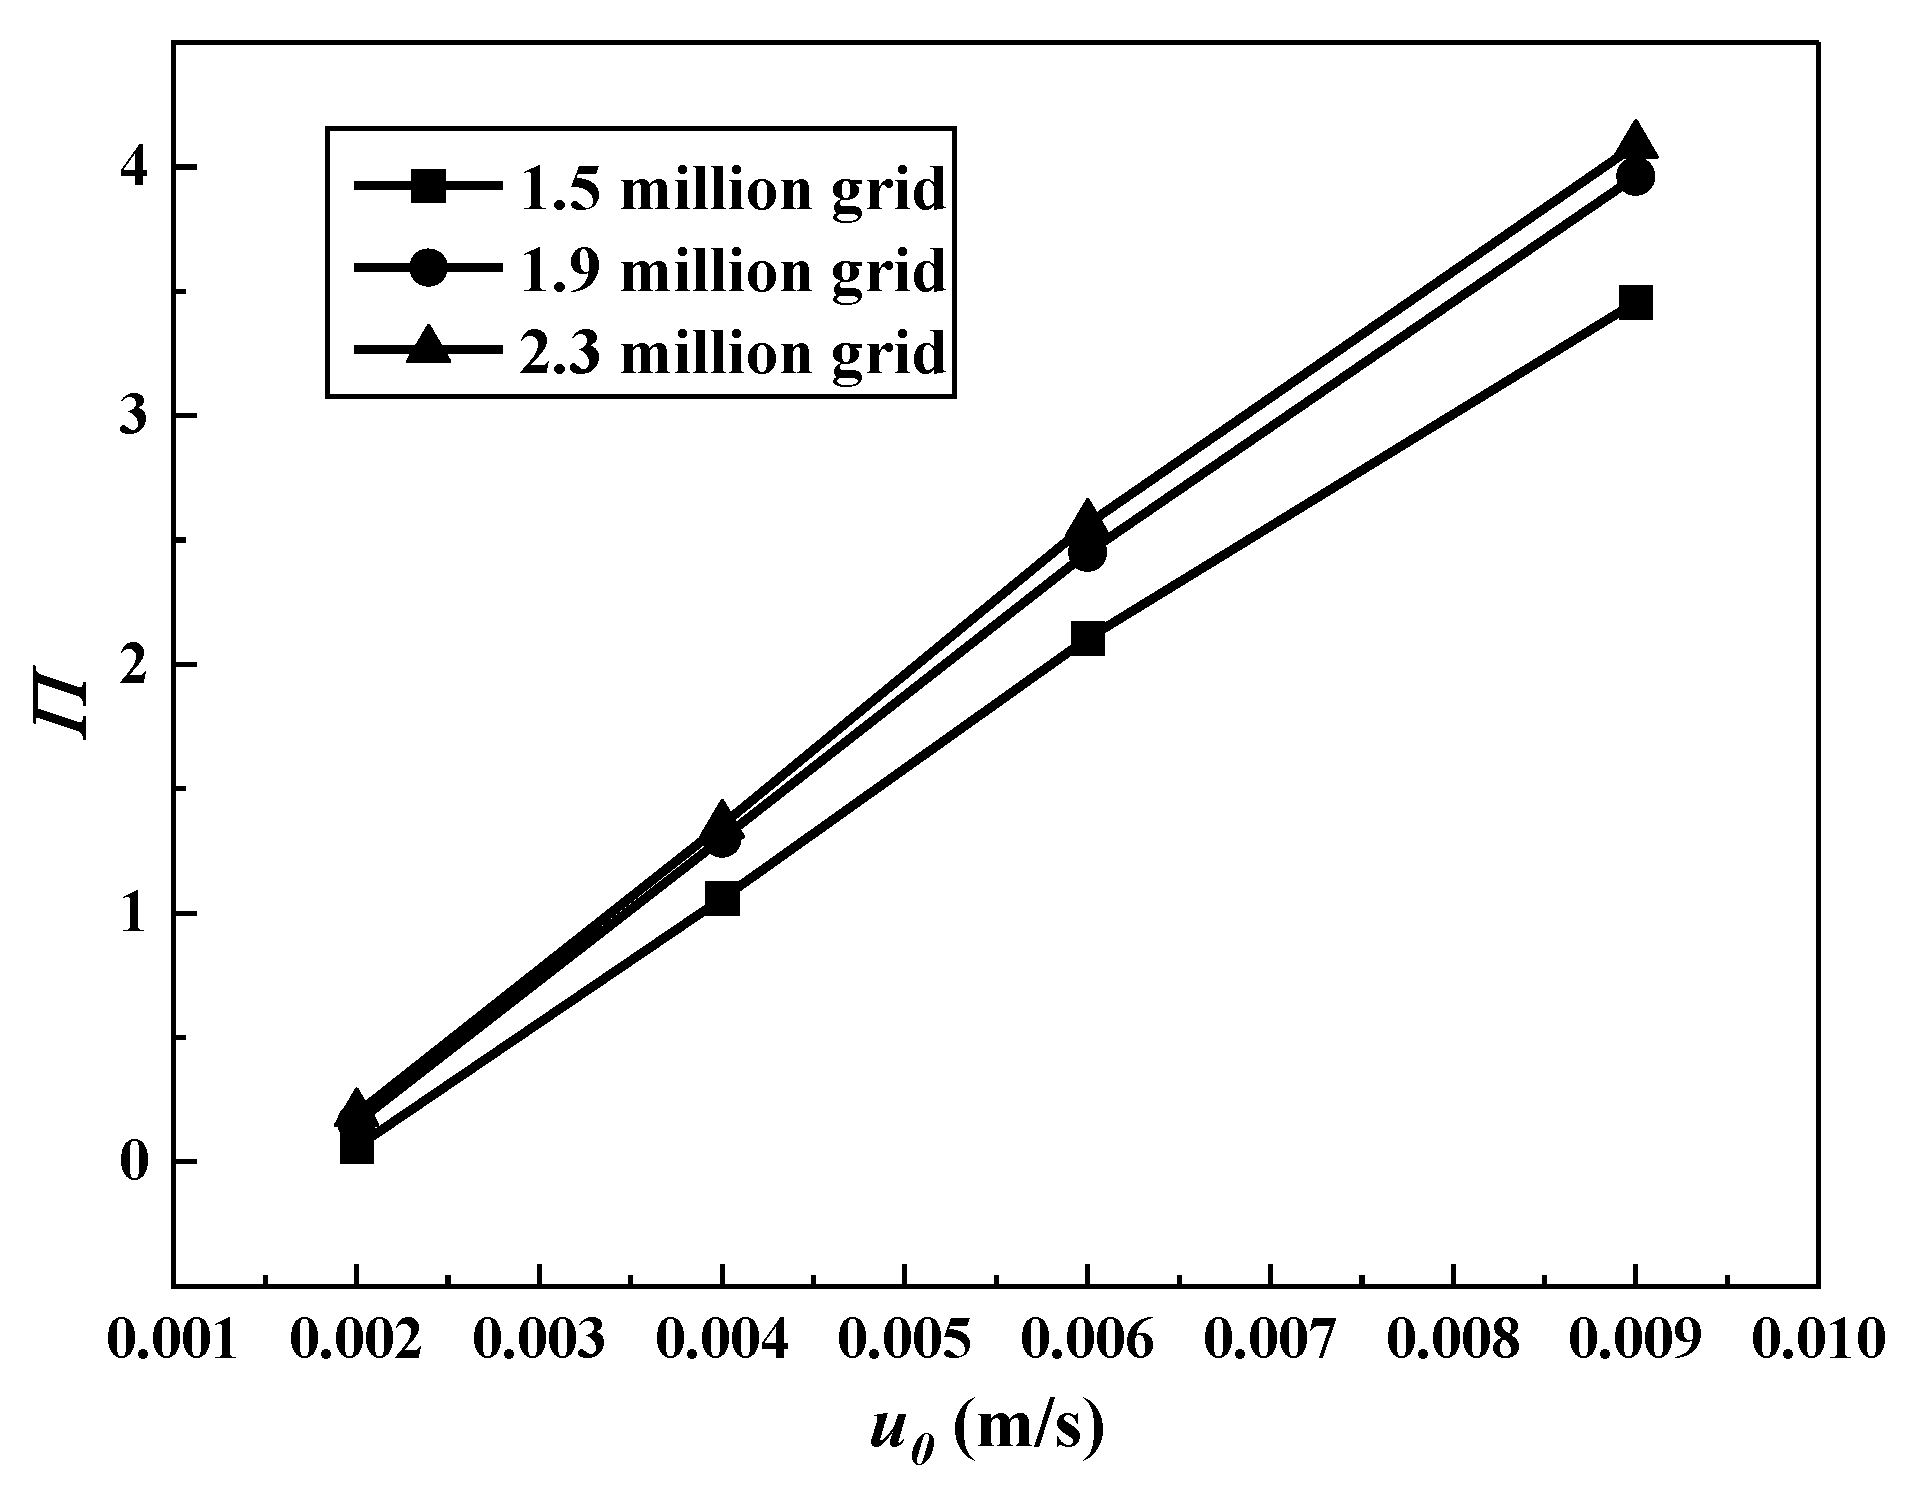
2.3. Mesh Generation and Independence Test

Unstructured and structured meshes were employed around the microorganisms and the microstructure, respectively. As the microorganisms and the microstructure were significantly smaller than the entire channel, meshes near the microorganisms and microstructure were encrypted (Figure 2).
When the aggregates of meshes were 1.5, 1.9, and 2.3 million, the pressure drops in the channel at different inlet velocities were calculated, and the corresponding results are presented in Figure 3. Considering the accuracy of numerical simulations and the calculation time, the total grid number was determined to be 1.9 million, including 1.2 million in the encrypted area.

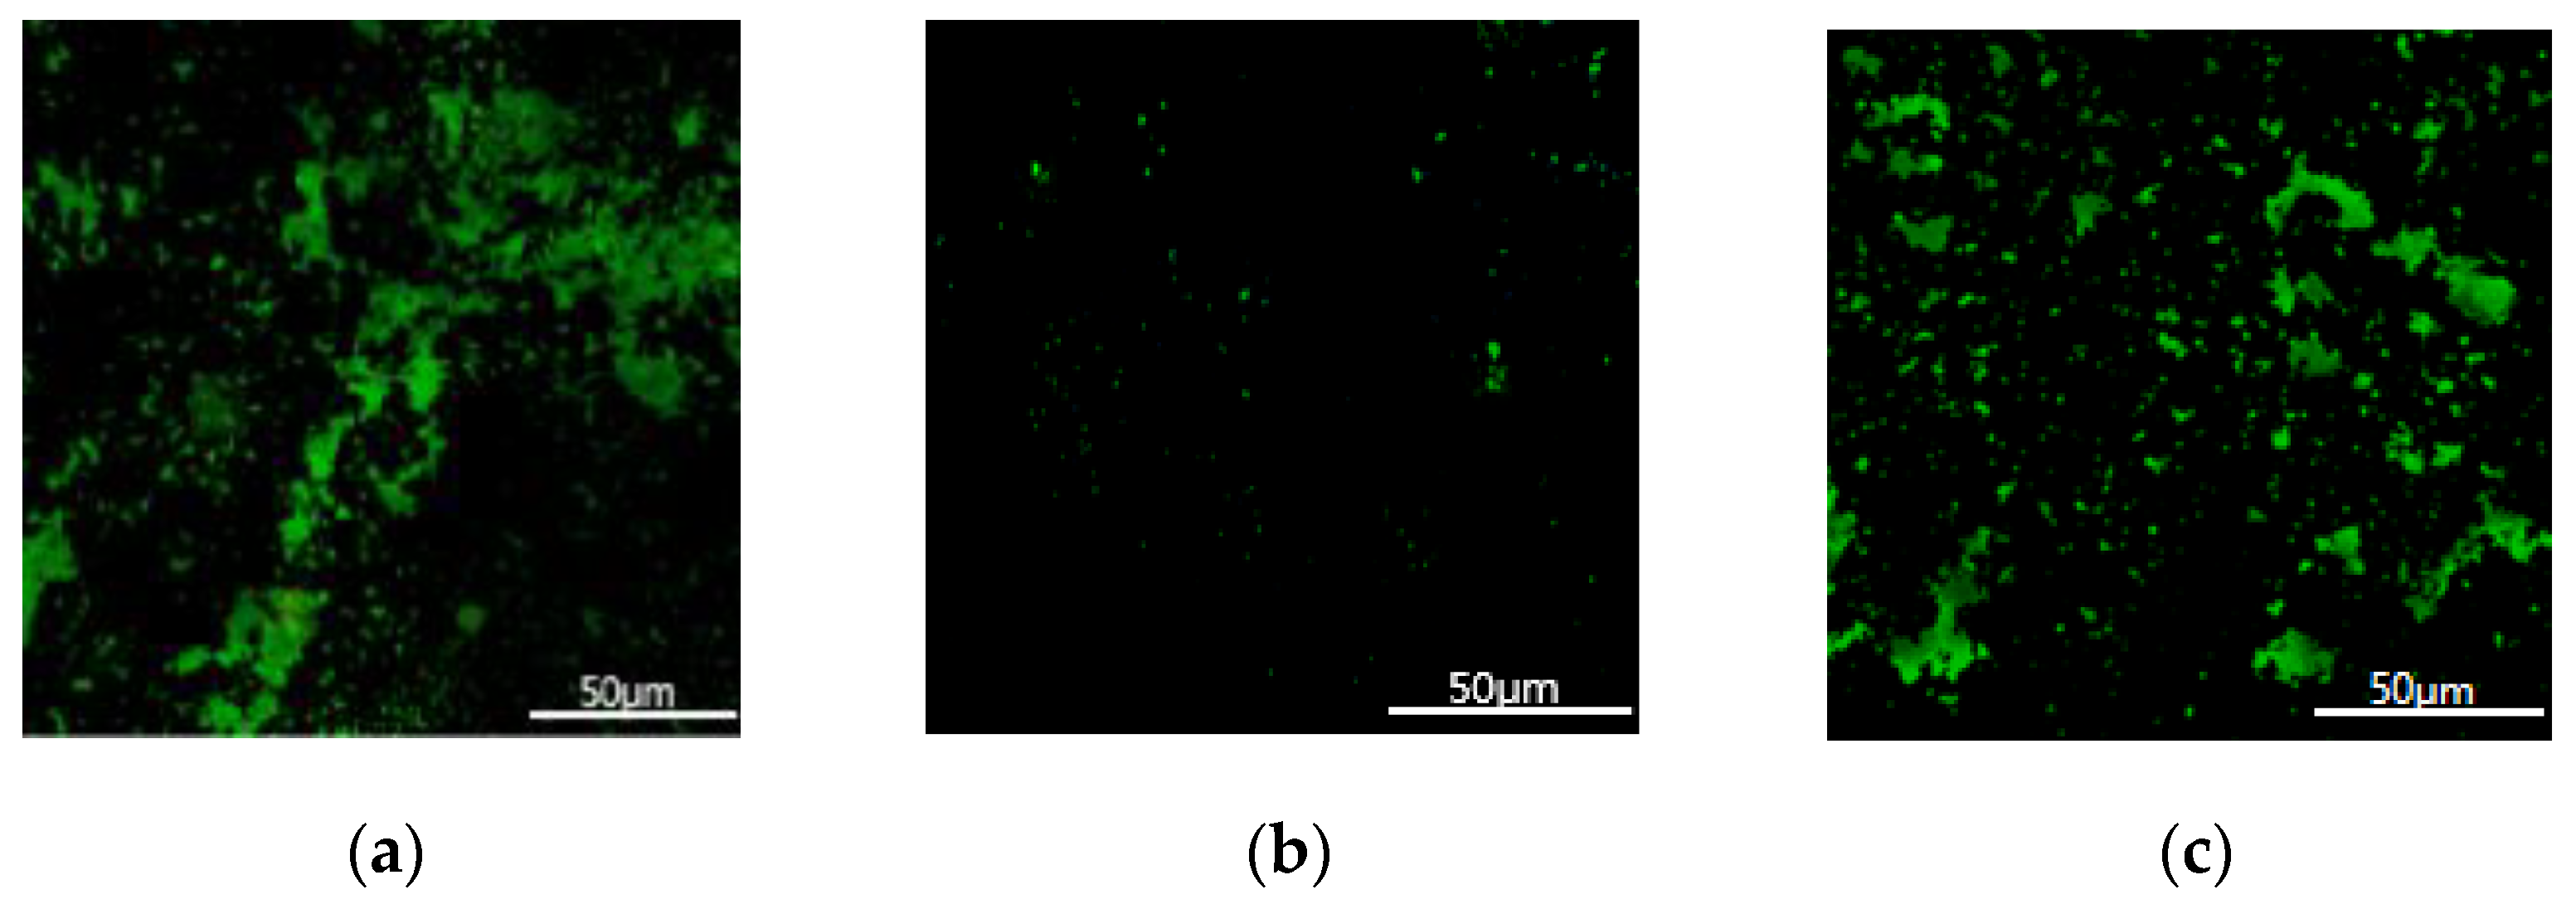
3. Experiment and Model Validation

Four-inch silicon wafers were selected to fabricate the smooth surfaces, Mp1 and Mp5 microstructured surfaces, and tested in algae solution. We put the processed silicon wafer flat in the green algae petri dish, set the water inlet and outlet on both sides of the petri dish and made the flow rate of algae liquid 0.005 ± 0.002 m/s. After seven days in the green algae petri dish, the silicon wafers were taken out and slowly put into the petri dish with deionized water, which was placed on the shaker and slowly shaken for 15 min. This process was repeated for 3 times in order to remove the attached microalgae and minimize the experimental error. Then the silicon wafer were transferred to the petri dish with 2% glutaraldehyde aqueous solution, which fully covered and soaked the whole sample for 2 h, and finally the silicon wafer was taken out and dried naturally.
In order to analyze the attachment of algae on the surface of the sample, the laser scanning confocal fluorescence microscope (LSCFM) was used to analyze the attachment rate of algae on the material surface. The algae tissue cells had fluorescent substances that could be excited. The excited fluorescence could be processed and exhibited on the computer display. By analyzing the algae coverage of the image, the anti-algae adhesion ability of the material surface could be obtained. Figure 4 shows the laser scanning confocal microscope image of the experimental silicon wafer. It can be seen from the picture that the attachment amount of Chlorella on the surface with Mp1 (h = 2 μm, s = 2 μm) and Mp5 (h = 5 μm, s = 10 μm) was significantly less than that on the smooth surface. After image analysis and calculation, surface area fraction with attached microorganism in the Figure 4a–c was 22.83%, 0.76% and 10.73%, respectively. The surface antifouling rate K was calculated by the following formula:
K = A 0 A m A 0 × 100 %
A0 is the attachment area of Chlorella on the smooth surface and Am is the attachment area of other microstructure surfaces. The results showed that the antifouling rates of Mp1 and Mp5 were 96.7% and 53% respectively. The microstructure with smaller pits and smaller spacing had better antifouling performance.

4. Simulation Results and Discussion

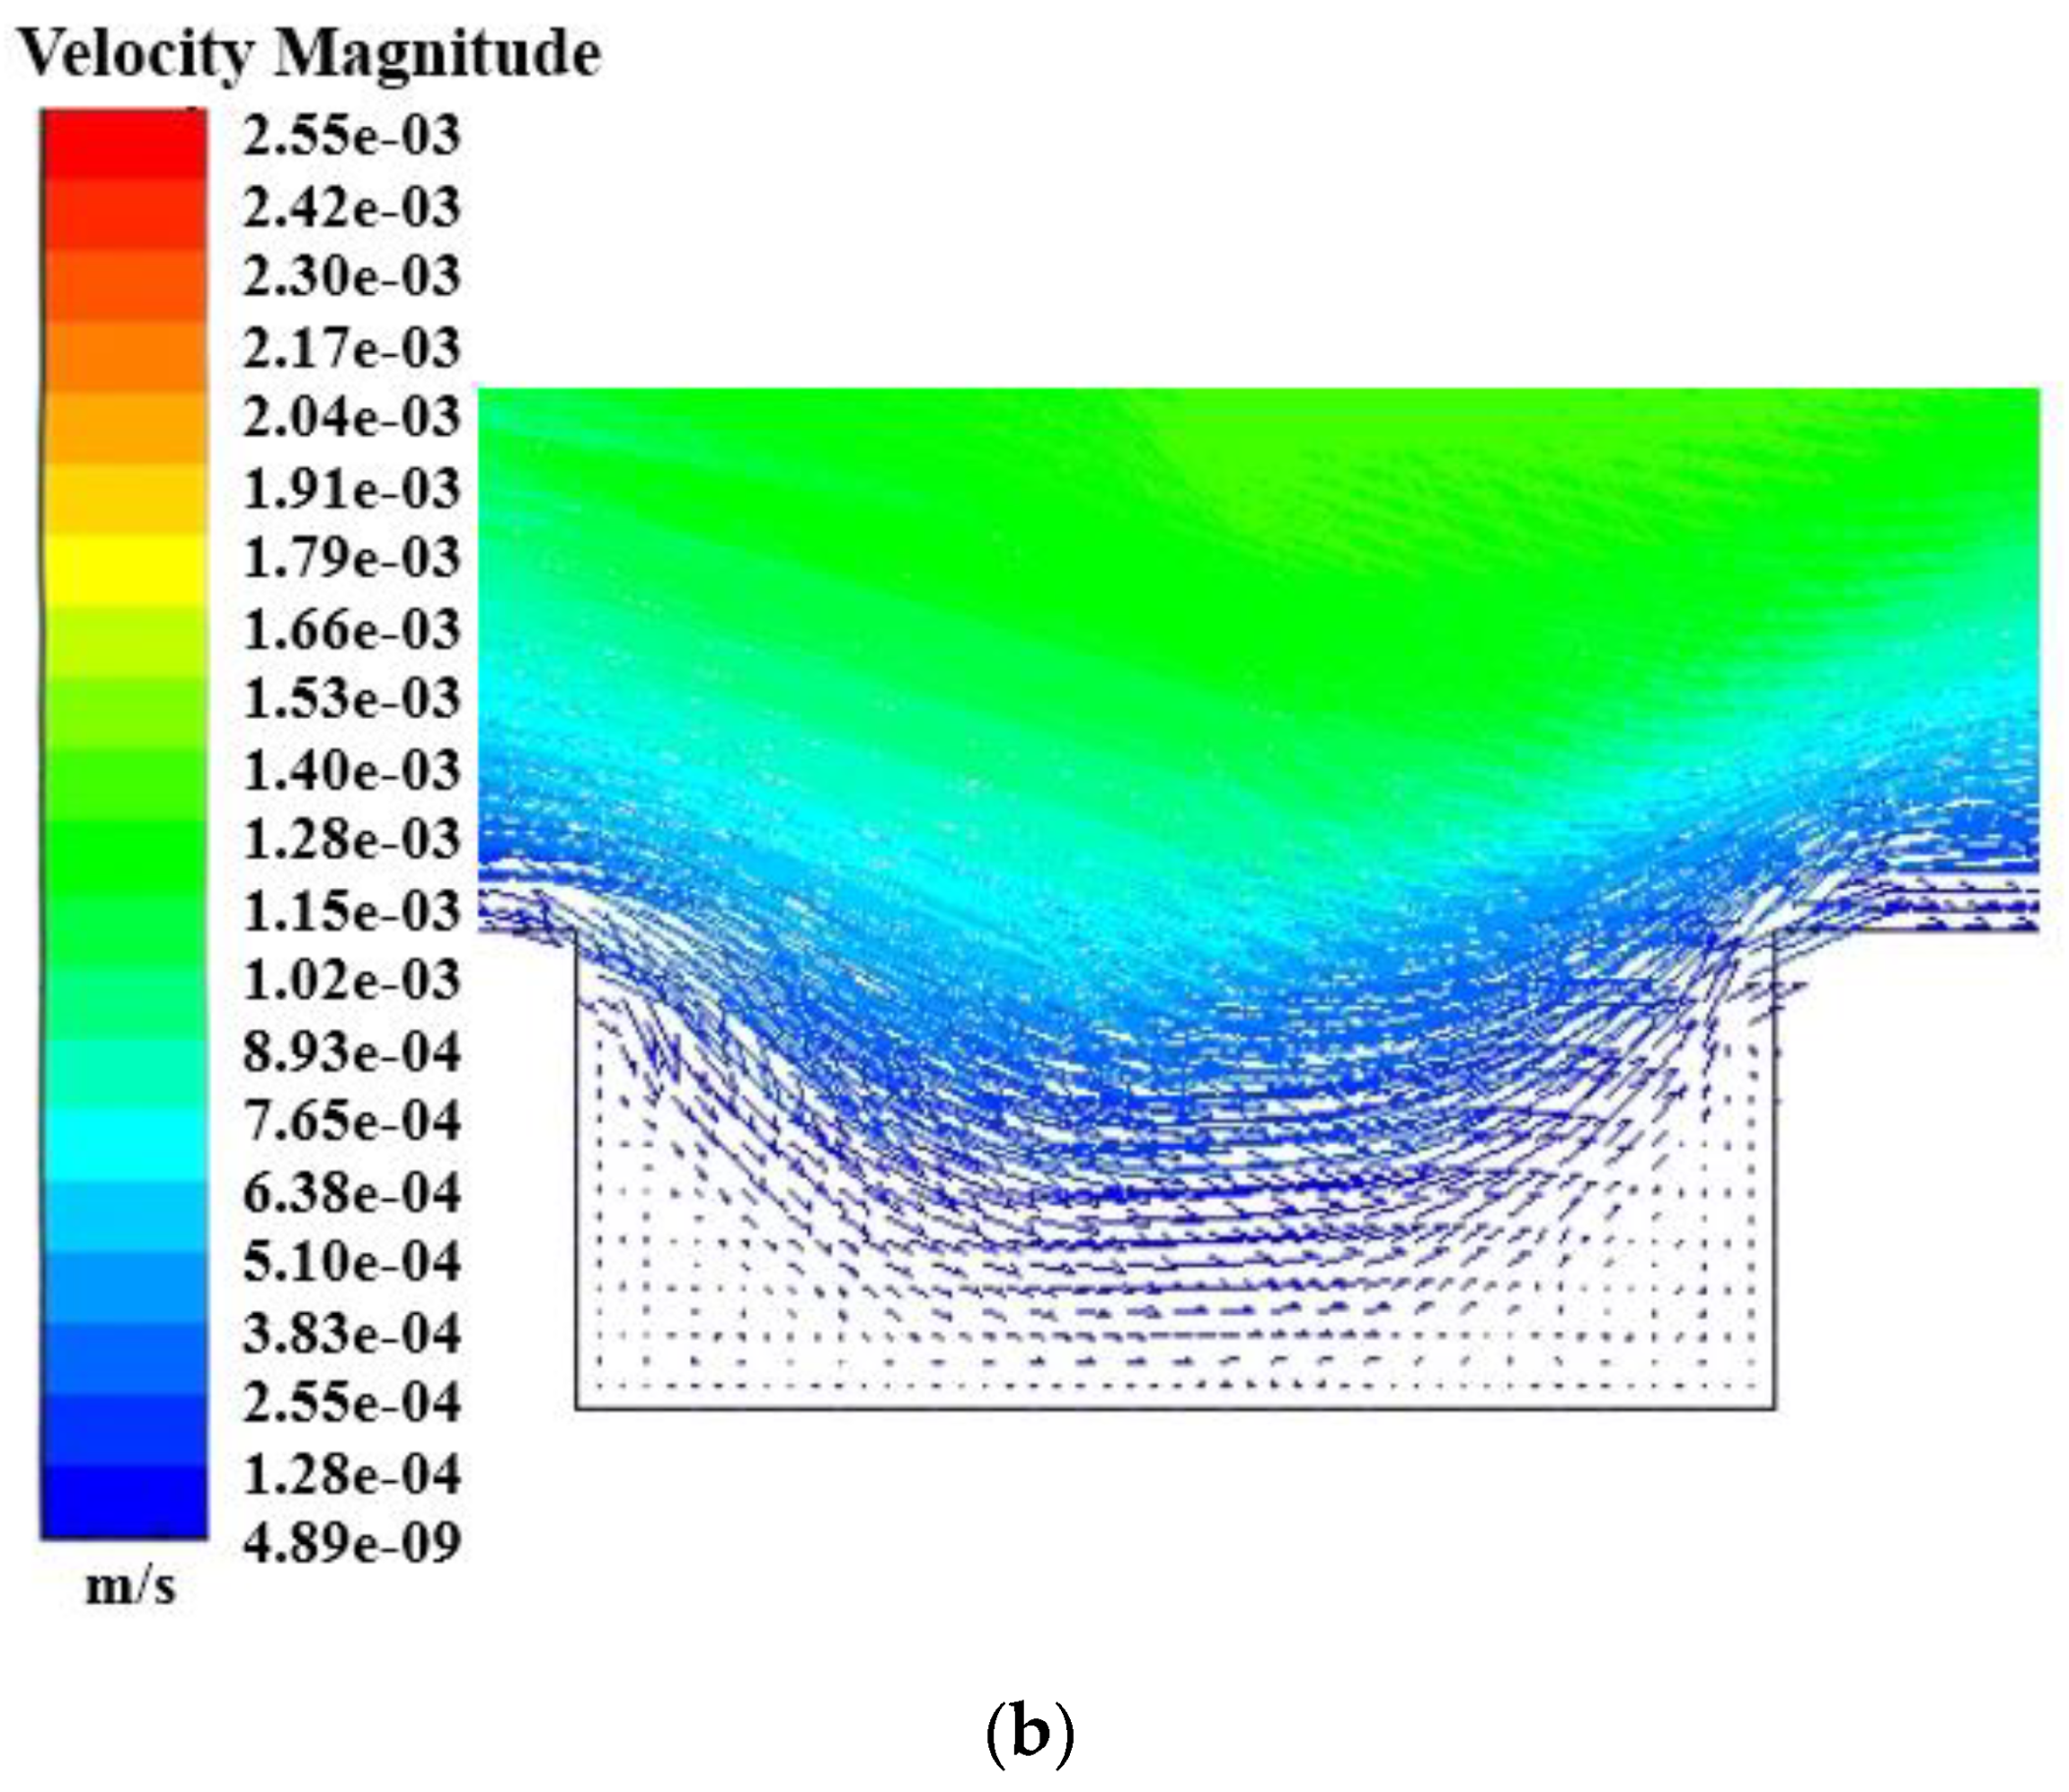
4.1. Characteristics of Fluid Kinematics in Microbial Motion

It was assumed that the velocity (u0) at the inlet section of the channel ranged between 0.002 and 0.009 m/s (low-velocity flow) and the microbial radii (r) were 1.5 and 2.5 μm (set according to the common Chlorella size). The microorganisms started directly from above the micropits and moved in co-current and counter-current flow directions at a speed of 3 × 10⁻⁵ m/s.
Microorganisms on patterned surfaces experience a complex microhydrodynamic environment, which includes differential strain rates, fluctuating velocity, and wall shear distribution that develops on the microstructured surfaces [26]. It is evident that there were a continuous microfluidic disturbance near the patterned surface (Figure 5a), and almost no change on the smooth surface (Figure 5b). Figure 5c,d present the different strengths of strain rate experienced by microorganisms on their body surface when they are at the same height on the surface. This means that microorganisms can perceive fluctuations through its body surface, and make the surface appear unfavorable for settlement.
Figure 6a presents the average velocities above six microstructures. As shown in the small picture in 6a, the microorganism is now directly above the microridge. The velocity of adjacent micropits under the microorganisms is much higher than that of the other micropits. The velocity under the smooth surface changed smoothly, and the maximum velocity was only 31.25% of that for the microstructural surface. Figure 6b presents the average velocities at three different measuring positions (dc = 0.1, 0.3, and 0. 5 μm) when the height of the microbes from the surface (d) was 5 μm. The velocity fluctuation in the micropits and microridges increased with the decrease of the distance from the surface. Therefore, when the microorganisms settled in the y-direction, it was difficult for them to approach the surface and find the attachment point due to the increase in velocity. When dc = 0.1 μm, the flow velocity above the micropits was significantly higher than that in the microridges. When the microorganisms settled above the surface, it was difficult for them to maintain their balance and complete the settlement due to the change in the flow velocity. The observation points A, B, C, and D in Figure 6b are micropit steps, where the velocity changed rapidly (Inset of Figure 6b is the enlarged view of the velocity at point A). When the microorganisms moved, they vibrated due to the sudden change of the velocity and slid through the micropits with the fluid.
Figure 7a displays the microbial location. At this time, the microorganisms moved from Mr1 to directly above the No. 2 micropit. Figure 7b displays the average velocity distributions on the microstructured surface at different heights of microorganisms. The microbial radius (r) was 2.5 μm, which was directly above the No. 2 micropit. The movement direction was from left to right, and the measuring height (dc) was 0.1 μm. When d = 5 μm and u0 = 0.002 m/s, the average velocity in the micropits and microridges under the microorganisms was 1.3 × 10⁻⁴ m/s, the velocity in adjacent pits was about 1.06 × 10⁻⁴ m/s, and the velocity above the surface far away from the microorganisms was only 3.6 × 10⁻⁵ m/s. When d = 0.5 μm and u0 = 0.009 m/s, the average velocity in the micropits and microridges under the microorganisms was only 1.2 × 10⁻⁴ m/s and the average velocity in adjacent pits was 4.8 × 10⁻⁴ m/s. When d > r, the velocity under the microorganisms was greater than that above the surrounding microstructure, and when d < r, the velocity under the microorganisms was significantly lower than that above the surrounding microstructure. Hence, when the microorganisms moved closer to the surface, a low-velocity region was formed around them; thus, weakening the influence of velocity fluctuation caused by the microstructure on the microorganisms.
Figure 8 exhibits the velocity distributions in the Mp1 micropit directly below the microorganisms at different inlet velocities. It is noticeable from Figure 8a that the vortex velocity in the micro-pit increased with the rise of the inlet velocity and the distribution curves at different velocities intersected when ux = 0. Hence, the increase of the flow velocity had no significant effect on the location of the low-velocity area of the vortex in the micropit. When u0 = 0.002 m/s, the velocity variation at the bottom of the micropit flattened out towards zero. When u0 = 0.008 m/s, the counterflow at the bottom area of the micropit significantly increased. It is noticeable from the velocity vector diagram in Figure 8b that a vortex was generated in the Mp1 micropit. Therefore, the increase of the initial flow velocity in the channel significantly increased the vortex movement in the micropits. In the first stage of fouling formation, the size of conditioning layer-forming particles (proteins, polysaccharides, bacteria) was at the nanoscale; thus, the existence of the micro-vortex flow slowed down the formation speed of conditioning layers.
Figure 9a displays the velocity distributions in the micropits at the measuring positions (ye) under the same movement of the microorganisms and the channel fluid (co-current flow). The velocity distributions of Mp4 and Mp5 micropits were similar, and the velocity distributions at the bottom of Mp3 and Mp1 micropits were nearly the same. The velocities at the top of Mp3 and Mp1 micropits were similar to those of Mp4 and Mp5, indicating that the flow velocity on the upper layer of the micropits was greatly influenced by the micropit depth (h) and the flow pattern in the micropits was affected by β. It is noticeable from Figure 9b that no vortex existed in the Mp2 micropit (h = 2 μm and s = 5 μm) and it had the smallest height to width ratio (β = 0.4) among the five microstructures. Further, no counterflow was noticed in Mp2 (Figure 9a). This might have happened because the width of the micropit was relatively larger than its depth. When the low-velocity fluid flowed through the micropit steps, the drop height and flow spacing were insufficient to enable the fluid to form a vortex.
According to Rosenhahn et al. [29], the rotation of algal spores in a certain place determines the adhesion strength of permanent attachment. Therefore, when microbial particles settle in a micropit, they will rotate with the vortex formed in the micropit and easily become trapped on the wall or corner of the micropit. Consequently, the closer the low-velocity region of the vortex to the bottom of the micropit, the higher the chance of biological settlement and adhesion. It is discernible from the enlarged view in Figure 9a that the intersections of the velocity distribution curves of different microstructures and the ux = 0 line differed greatly. The intersection for Mp1 was closest to the top, and those for Mp4 and Mp5 were closest to the bottom.

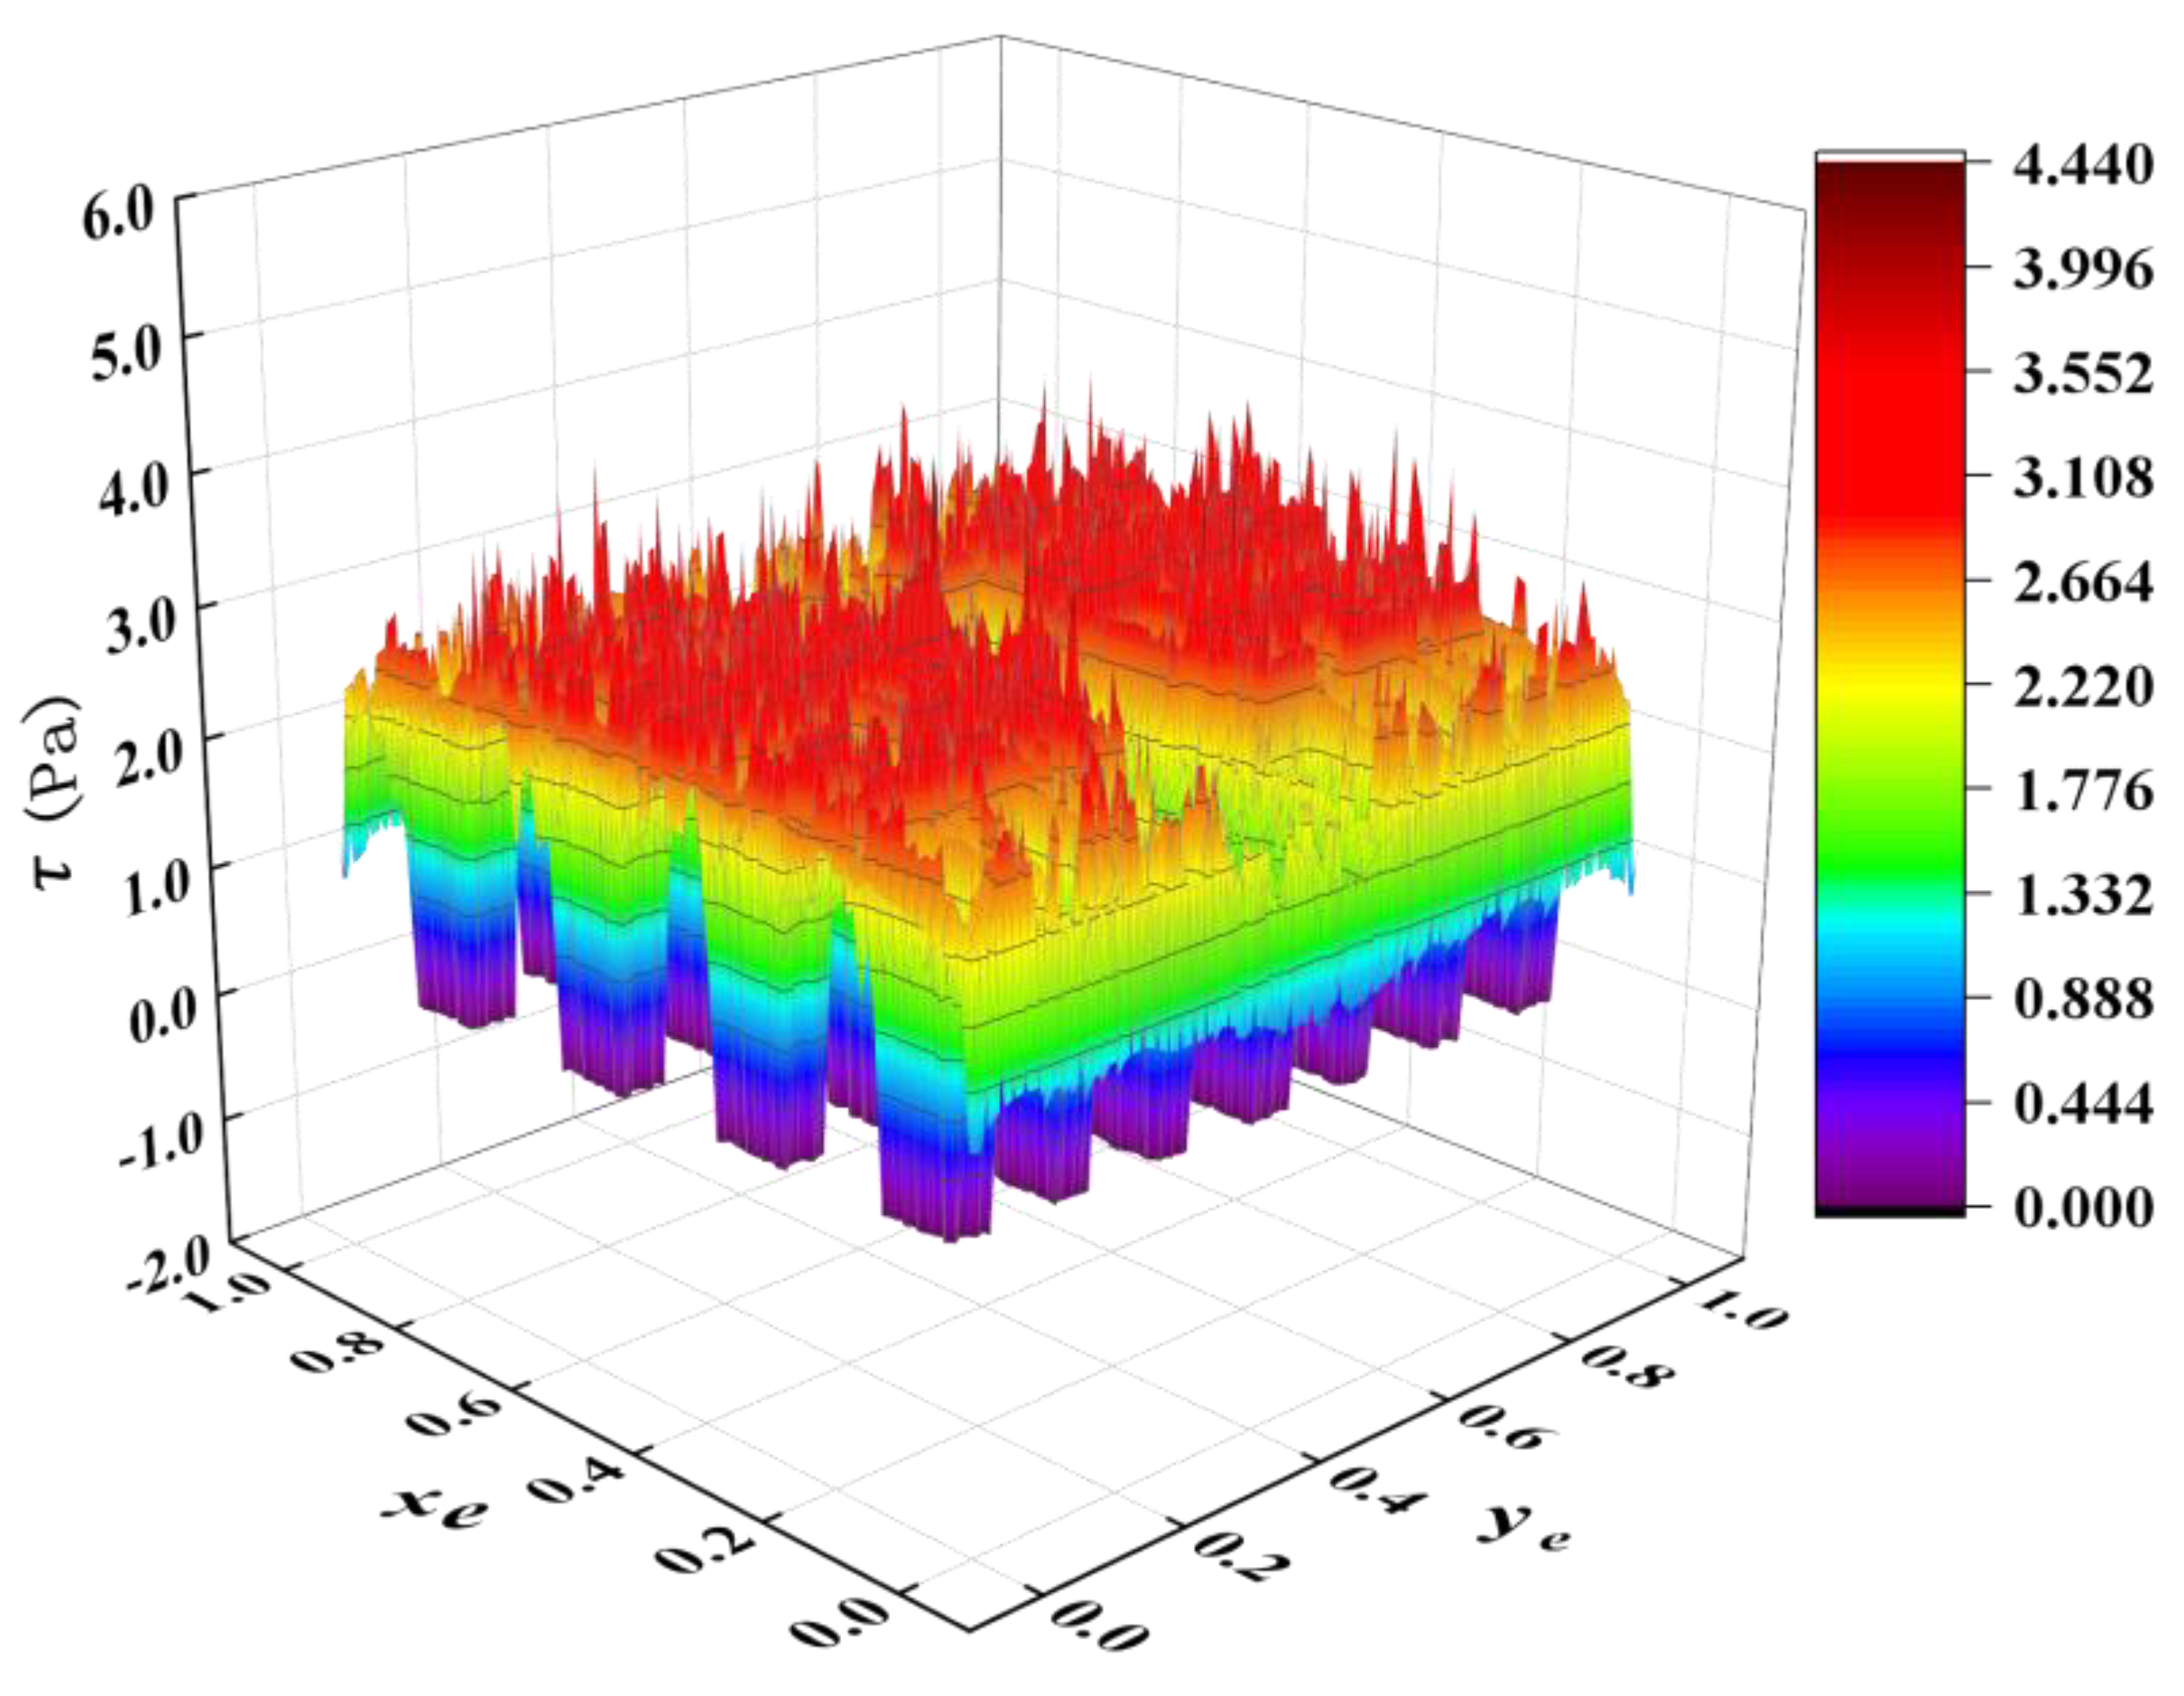
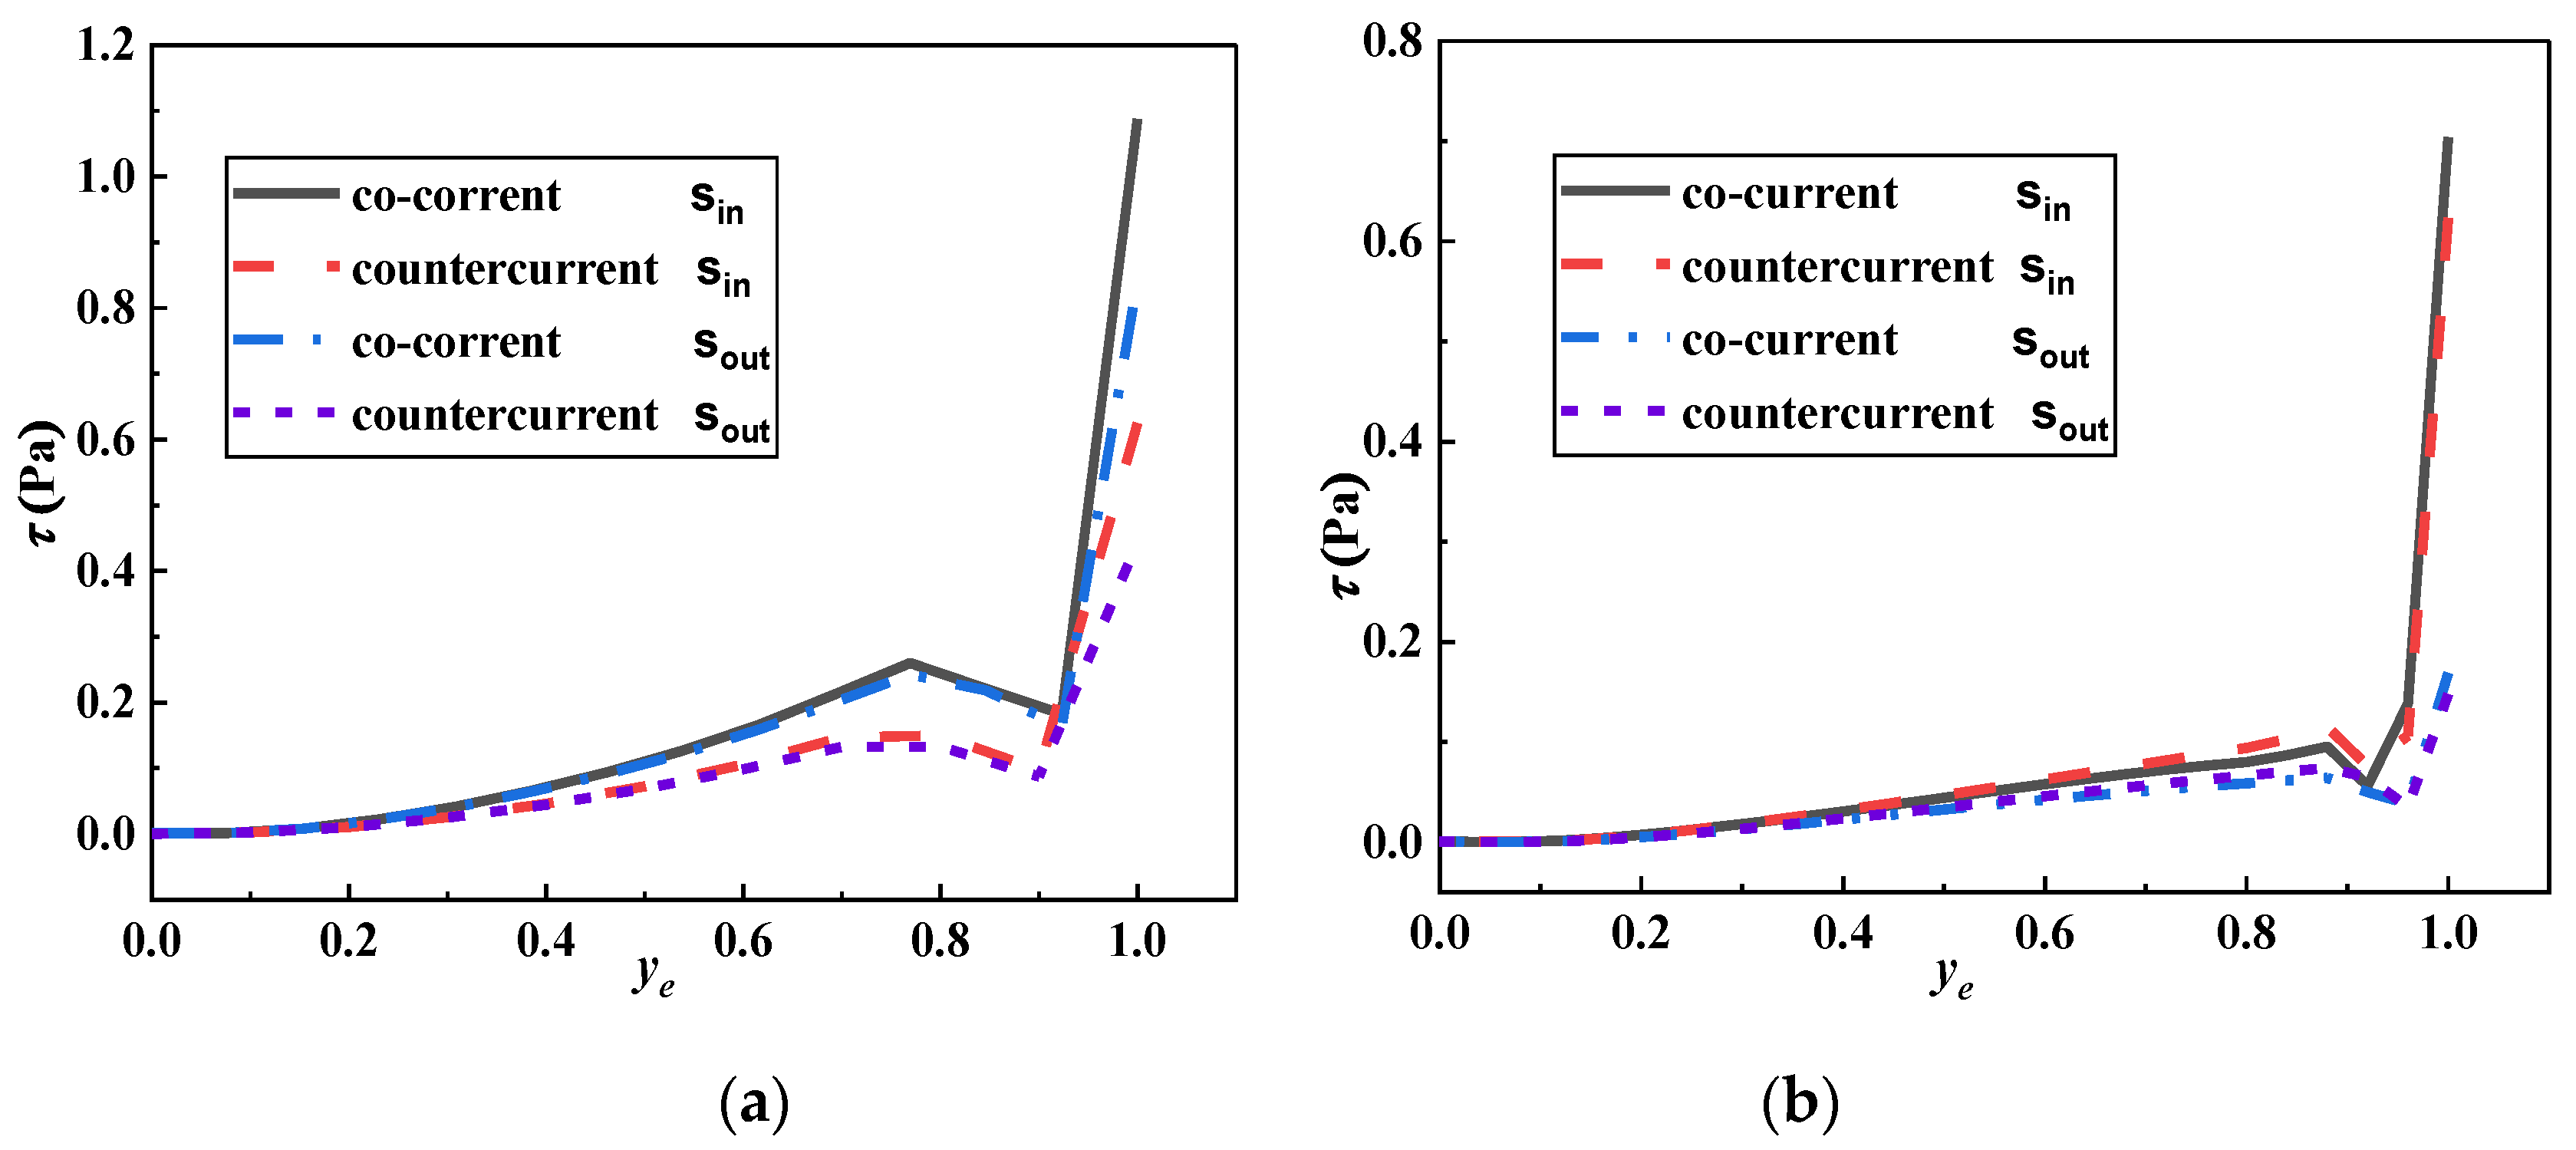
4.2. Shear Stress Distribution of Microbial Movement

When microorganisms settle on a surface, the higher shear stress on the surface increases the possibility of microorganism separation; thus, reducing the possibility of deep adhesion.
Figure 10 exhibits the shear stress distribution on the microstructured surface when the microorganisms were in the middle (d = 0.5 μm) and moved along the x-axis at the speed of 3 × 10⁻⁵ m/s (dc = 0.1 μm). The shear stress in the movement direction of the microorganisms was significantly lower than that in the surrounding microridges; thus, a low shear stress area was formed around the microorganisms. The existence of micropits made the microorganisms undergo periodic fluctuations in flow velocity and shear stress during their movements. Due to the addition of moving microorganisms to the model, the shear stress fluctuation around the microstructured surface was noticeably weakened, and it is contradictory to Lee’s view—high shear stress is the main antifouling factor of microstructured surface, and the effect of shear stress has been overestimated in previous studies [24].
Figure 11 displays the shear stress distributions on the microstructured surface at different heights of microorganisms. The microorganisms moved from left to right directly above the micropits, and the measuring height (dc) was 0.1 μm. When d = 5 μm and u0 = 0.002 m/s, shear stresses at adjacent microridges of the microorganisms were higher than those of other microridges, and it happened because when d > r, the velocity below the microorganisms was greater than that above the surrounding microstructure (Figure 6); thereby, the friction resistance between the fluid and the surface increased. When d = 0.5 μm and u0 = 0.009 m/s, shear stresses at the adjacent Mr1 and Mr2 microridges were significantly lower than those of other microridges (Table 2). The microbial radius (r) at this moment was 1.5 μm, the length of the low shear stress region (including the length of adjacent low shear stress microridges and micropits) was about 9.432 μm, and the length of microbial movement was about 3.728 μm.
Table 3 shows the shear stress gradient of adjacent microridges. When the height of the microorganism from the surface is d = 5 μm, the shear stress gradient of the microridge directly below the microorganism is lower than that of other adjacent microridges, but the shear stress gradient is significantly increased compared to when d = 0.5.
Figure 12 illustrates the shear stress gradients of the smooth surface and the five microstructured surfaces at dc = 0.1 μm, and the microorganisms were directly above the microridges. The rapid variation of the shear stress gradient only occurred in the microridge region. The maximum shear stress gradients ( τ ) for different microstructures all appeared in the microridges below the microorganisms, and the Mp5 micropit had the largest τ . The shear stress gradient values at adjacent microridges of different microstructures did not vary greatly, and τ at the middle area of the microridges (approximately zero) was similar to that of the smooth surface. It is clear from Figure 11 that the high shear stress on the surface caused by the microstructures was significantly reduced due to microbial movements near the wall. However, it is evident from Figure 12 that the shear stress gradients of the microridges were relatively large and fluctuated sharply at the steps. Sudden changes in shear stress will affect the speed and direction of microorganisms. Therefore, it can be concluded from the simulation results in Figure 10 and Figure 11 that the relatively high shear stress is not enough to serve, as the antifouling mechanism of microstructure, and the sudden change in the shear stress was another important parameter for microbial adhesion reduction.
A0, B0, C0, and D0 in Figure 10 were the maximum shear stress gradients of Mp5 and Mp1 under the microorganism. According to the normalized coordinates (xe) in Table 4, these points were located at the microridge steps. A1 and C1 were the next gradient peaks of Mp5 and Mp1 in the microbial movement direction, and no significant difference in the stress gradients of the five microstructures was noticed.
Figure 13 displays the shear stress distributions on the inner surface of Mp1 and Mp5 micropits in the downstream and countercurrent directions (Sin and Sout represent the inner wall surfaces of the micropits in the inflow and outflow sides, respectively), and a remarkable difference in the shear stress distributions of the two micropits was noticed. It is noticeable from Figure 13a that shear stresses on both inner sidewalls of Mp1 in the downstream direction were greater than those in the counterflow direction. Figure 13b reveals that in different directions, the shear stress on the inlet sidewall of Mp5 was significantly higher than that on the outlet sidewall; thus, small particles entering the Mp5 micropit were deposited on the outlet sidewall, and unable to fall off to be carried out by the fluid. Table 5 compares the shear stresses of Sin and Sout in the five micropits under different microbial movement directions. ( τ ¯ d , i n and τ ¯ d , o u t denote the average shear stresses on the inlet and outlet sidewalls in the downstream direction, respectively, and τ ¯ c , i n and τ ¯ c , o u t indicate the average shear stresses on the inlet and outlet sidewalls in the countercurrent direction, respectively.) The shear stress on the inner wall of the micropits decreased with the increase of the micropit depth and width. The microridge shear stress gradient of Mp5 was larger than those of the other surfaces (Figure 12), indicating that when r > s/2 (the diameter of spherical algae was larger than the micropit width), the surface of Mp5 was the most difficult to adhere to. However, when r < s/2, i.e., the diameter of spherical algae was less than the width of the micropit, the microorganisms entered the micropits. Shear stresses on the inflow and outflow sidewalls of Mp1 were significantly higher than those of the other microstructures; thus, the surface of Mp1 was the most difficult to adhere to. This result agrees well with the finding of Scardino et al. [15]—when the characteristic size of a microstructure is slightly smaller than the size of attached microorganisms, the best antifouling effect is achieved.

5. Conclusions

It is believed that the characterization of patterned surfaces based on anti-fouling effectiveness is complex, involving many interrelated parameters, including biological factors, the presence of other organics, material wettability, mechanical properties, microstructure characteristics, environmental nutrients, and environmental fluid characteristics. Our study investigated the effects and distribution of high-speed flow, wall shear stress, and stress gradient near the surface of microstructures. These effects may destroy the early deposition behavior of microorganisms, or cause microorganisms to be removed from the surface due to fluctuations in high-speed flow and shear stress before deep attachment is complete.
Therefore, this study emphasizes that when selecting a surface for biological contamination control, microfluidic characteristics are an important reference factor for evaluating the anti-fouling performance of the geometric characteristics of a patterned surface. The influencing factors of antifouling mechanism on microstructured surface are complex, and it has been widely accepted that shear stress distribution is the antifouling mechanism of the microstructured surface. Based on previous studies, this paper studies the antifouling mechanism of microstructures with different sizes. It was found that the aspect ratio of micropits had a great influence on the formation of vortex in microstructures. Meanwhile, the shear stress decreased with the decline of the position of micro-organisms, and the shear stress gradient had a greater influence on the microorganisms near the wall.
In the present research, five different-sized three-dimensional rectangular micropit surfaces were established and the movements of different-sized spherical algae at different heights in the near-wall zone co-current and counter-current flow direction were simulated by CFD. The fluid kinematics and shear stress distributions on the microstructured surface and in the micropits were compared. The main inferences are presented below.
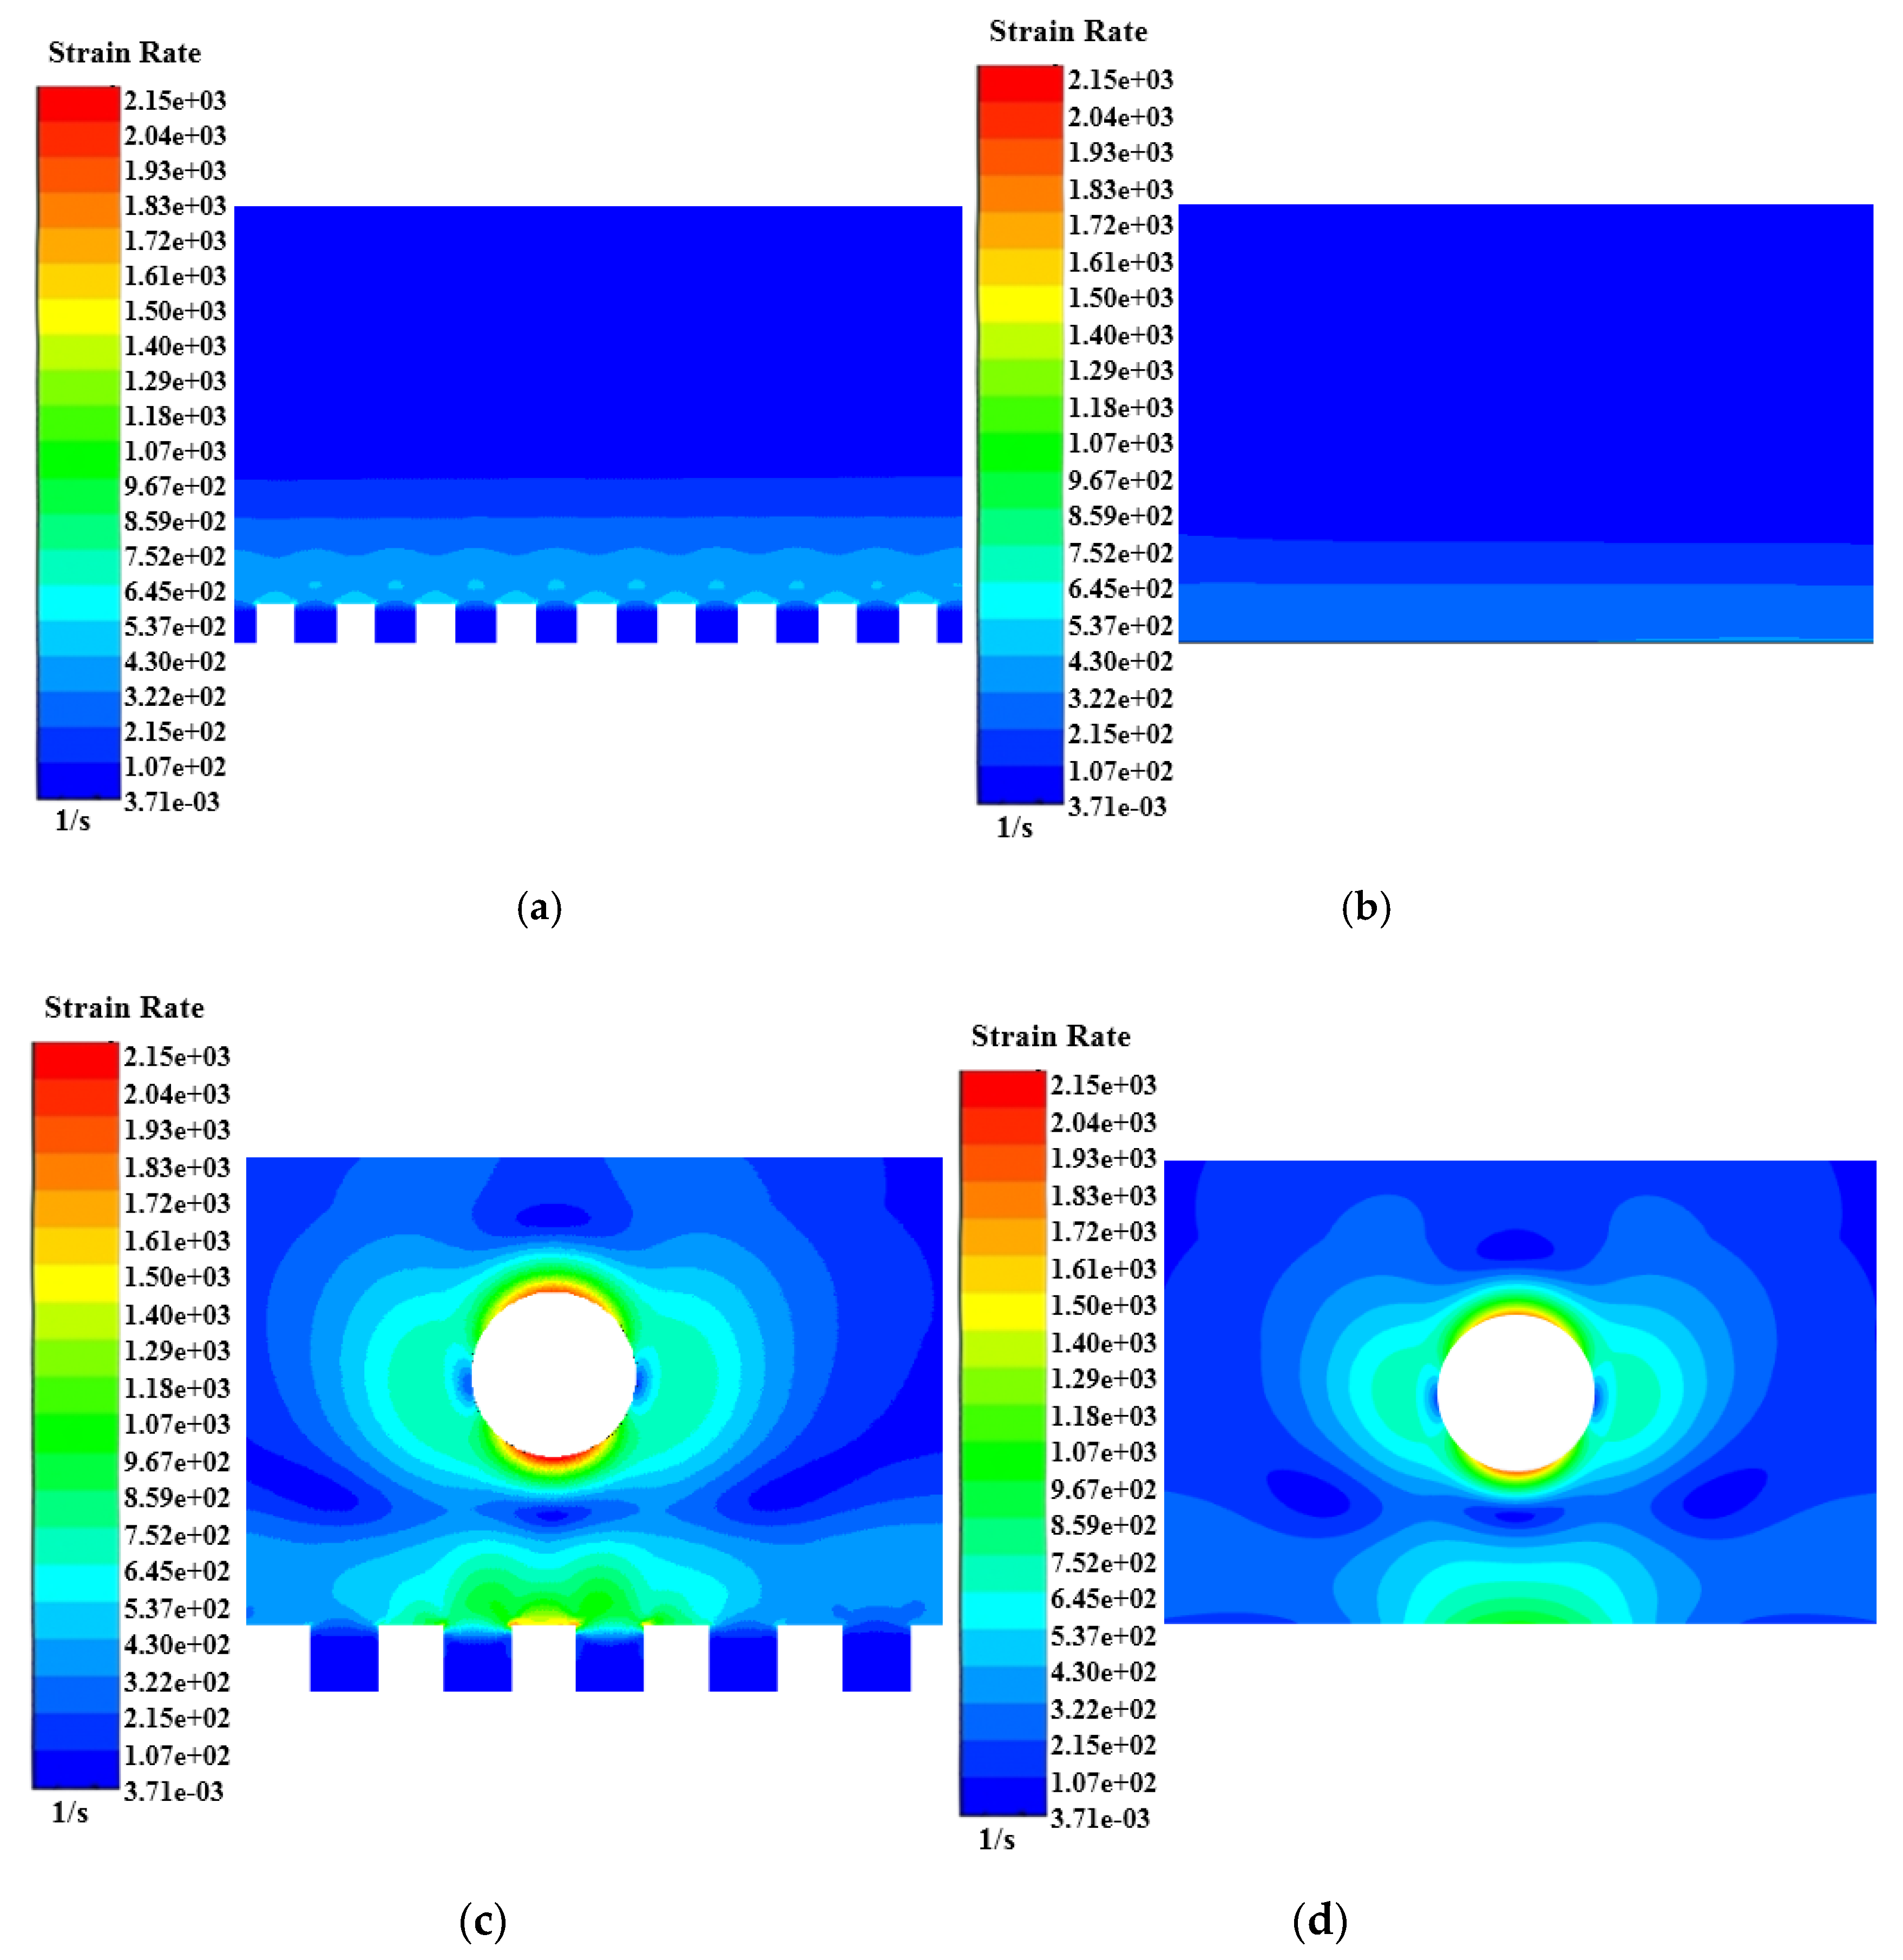
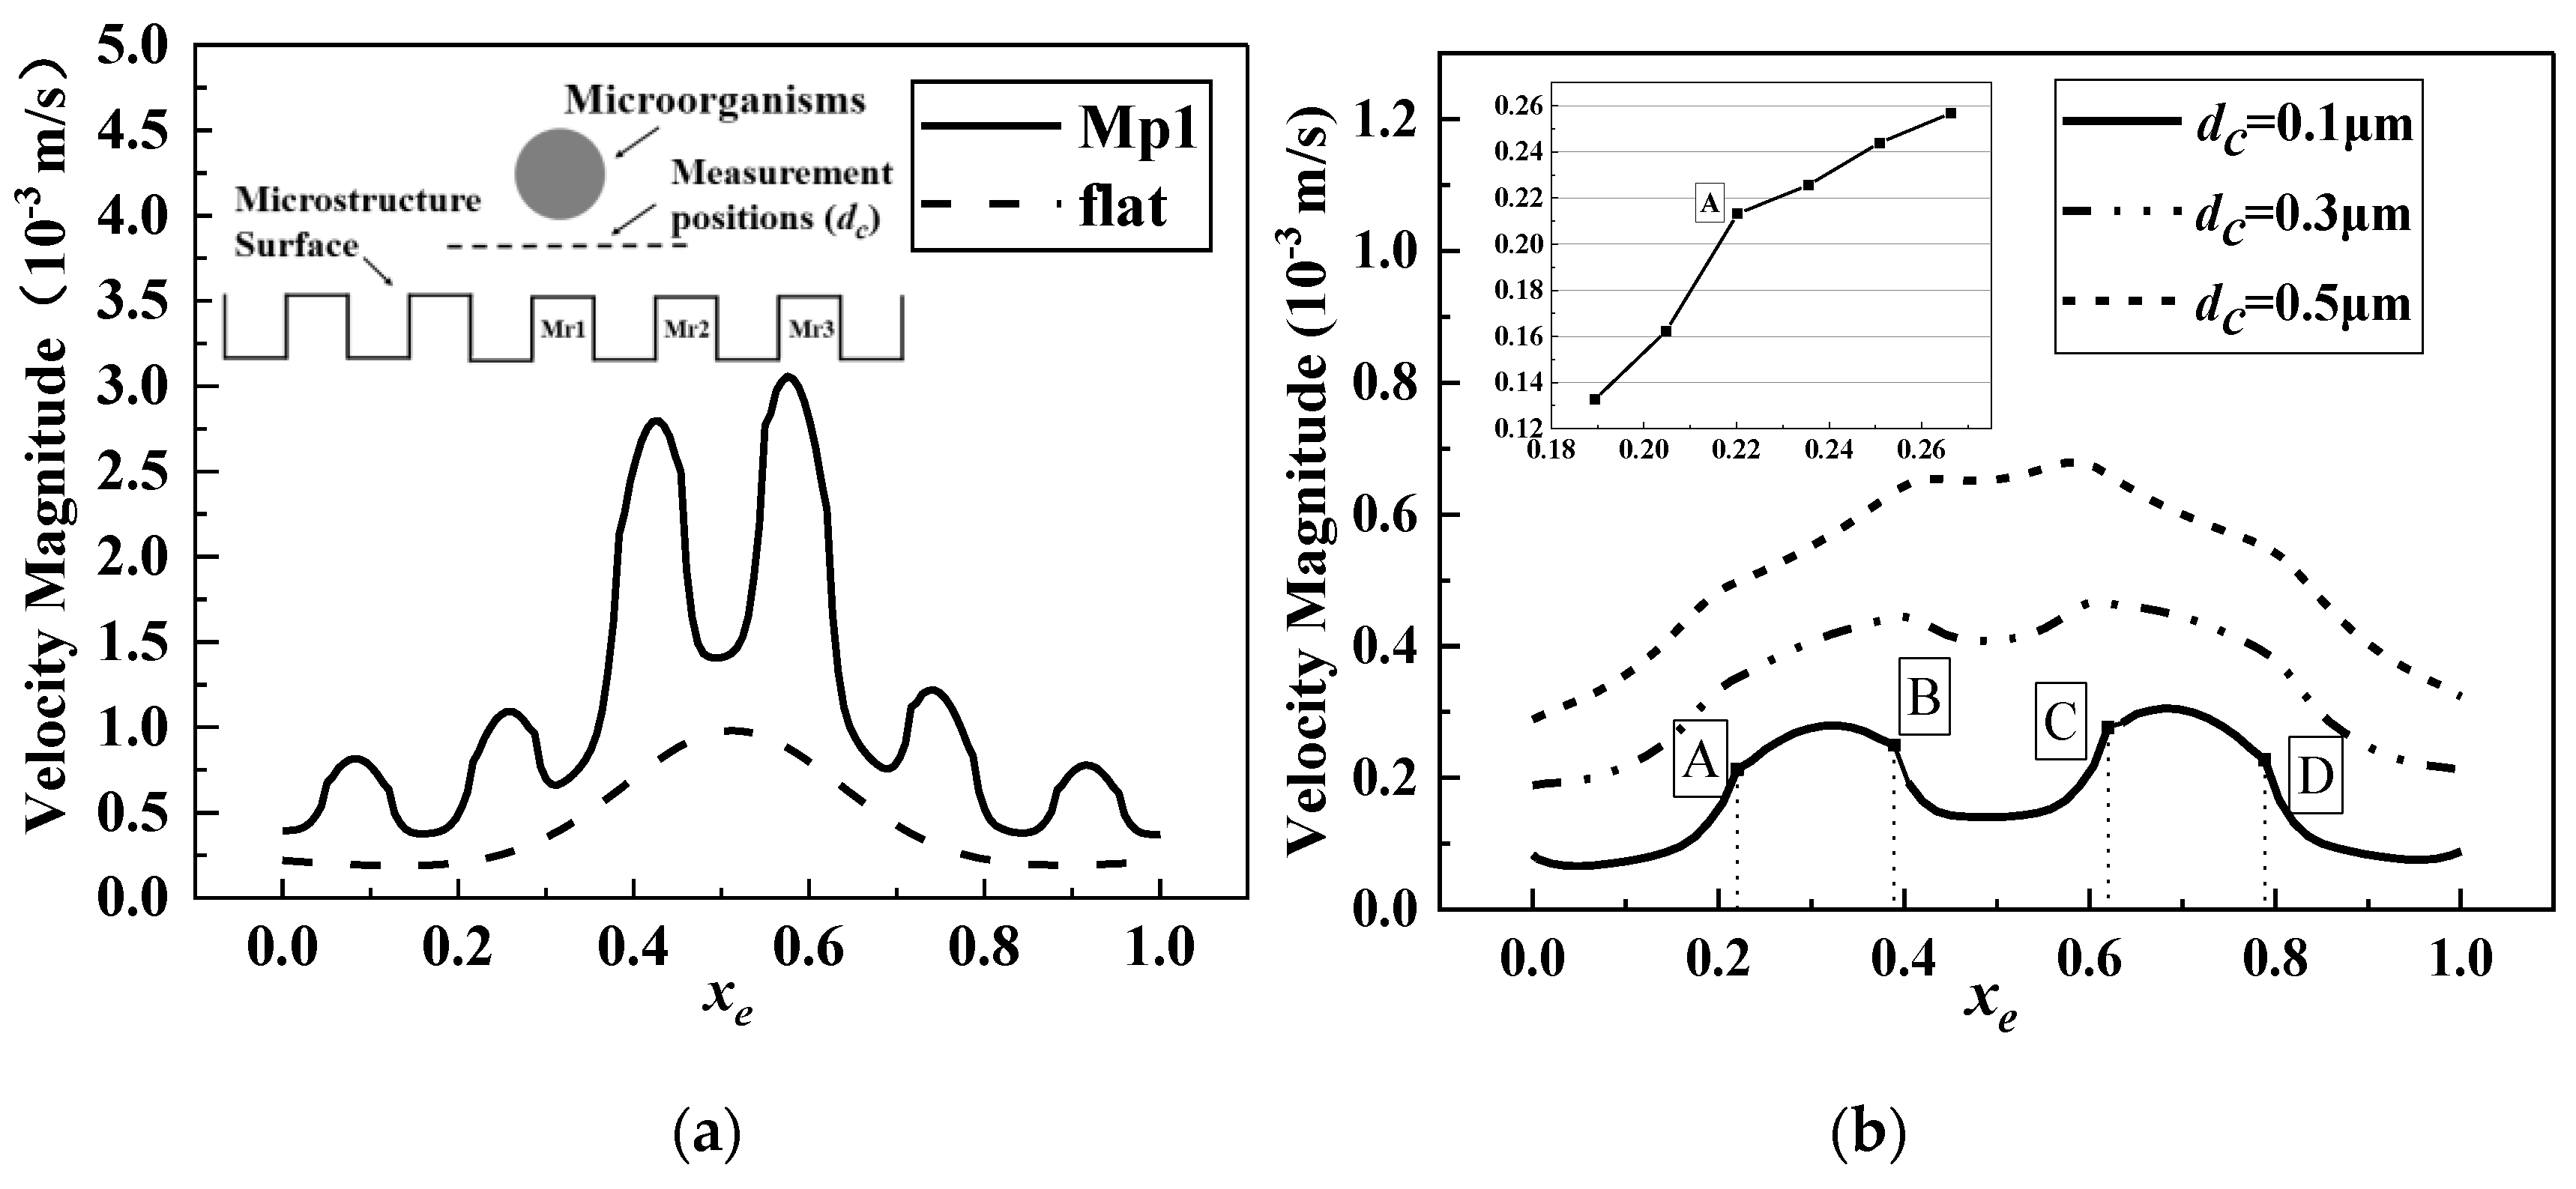
  • When microorganisms moved at different heights on the microstructured surface, the influences of their movements on the flow velocity were related to the heights at which they were located. When d > r, the velocity below the microorganisms was greater than that above the surrounding microstructure, and when d < r, the flow velocity below the microorganisms was significantly lower than that above the surrounding microstructure. Therefore, a low-velocity region was formed around the microorganisms in the process of approaching the microstructured surface.
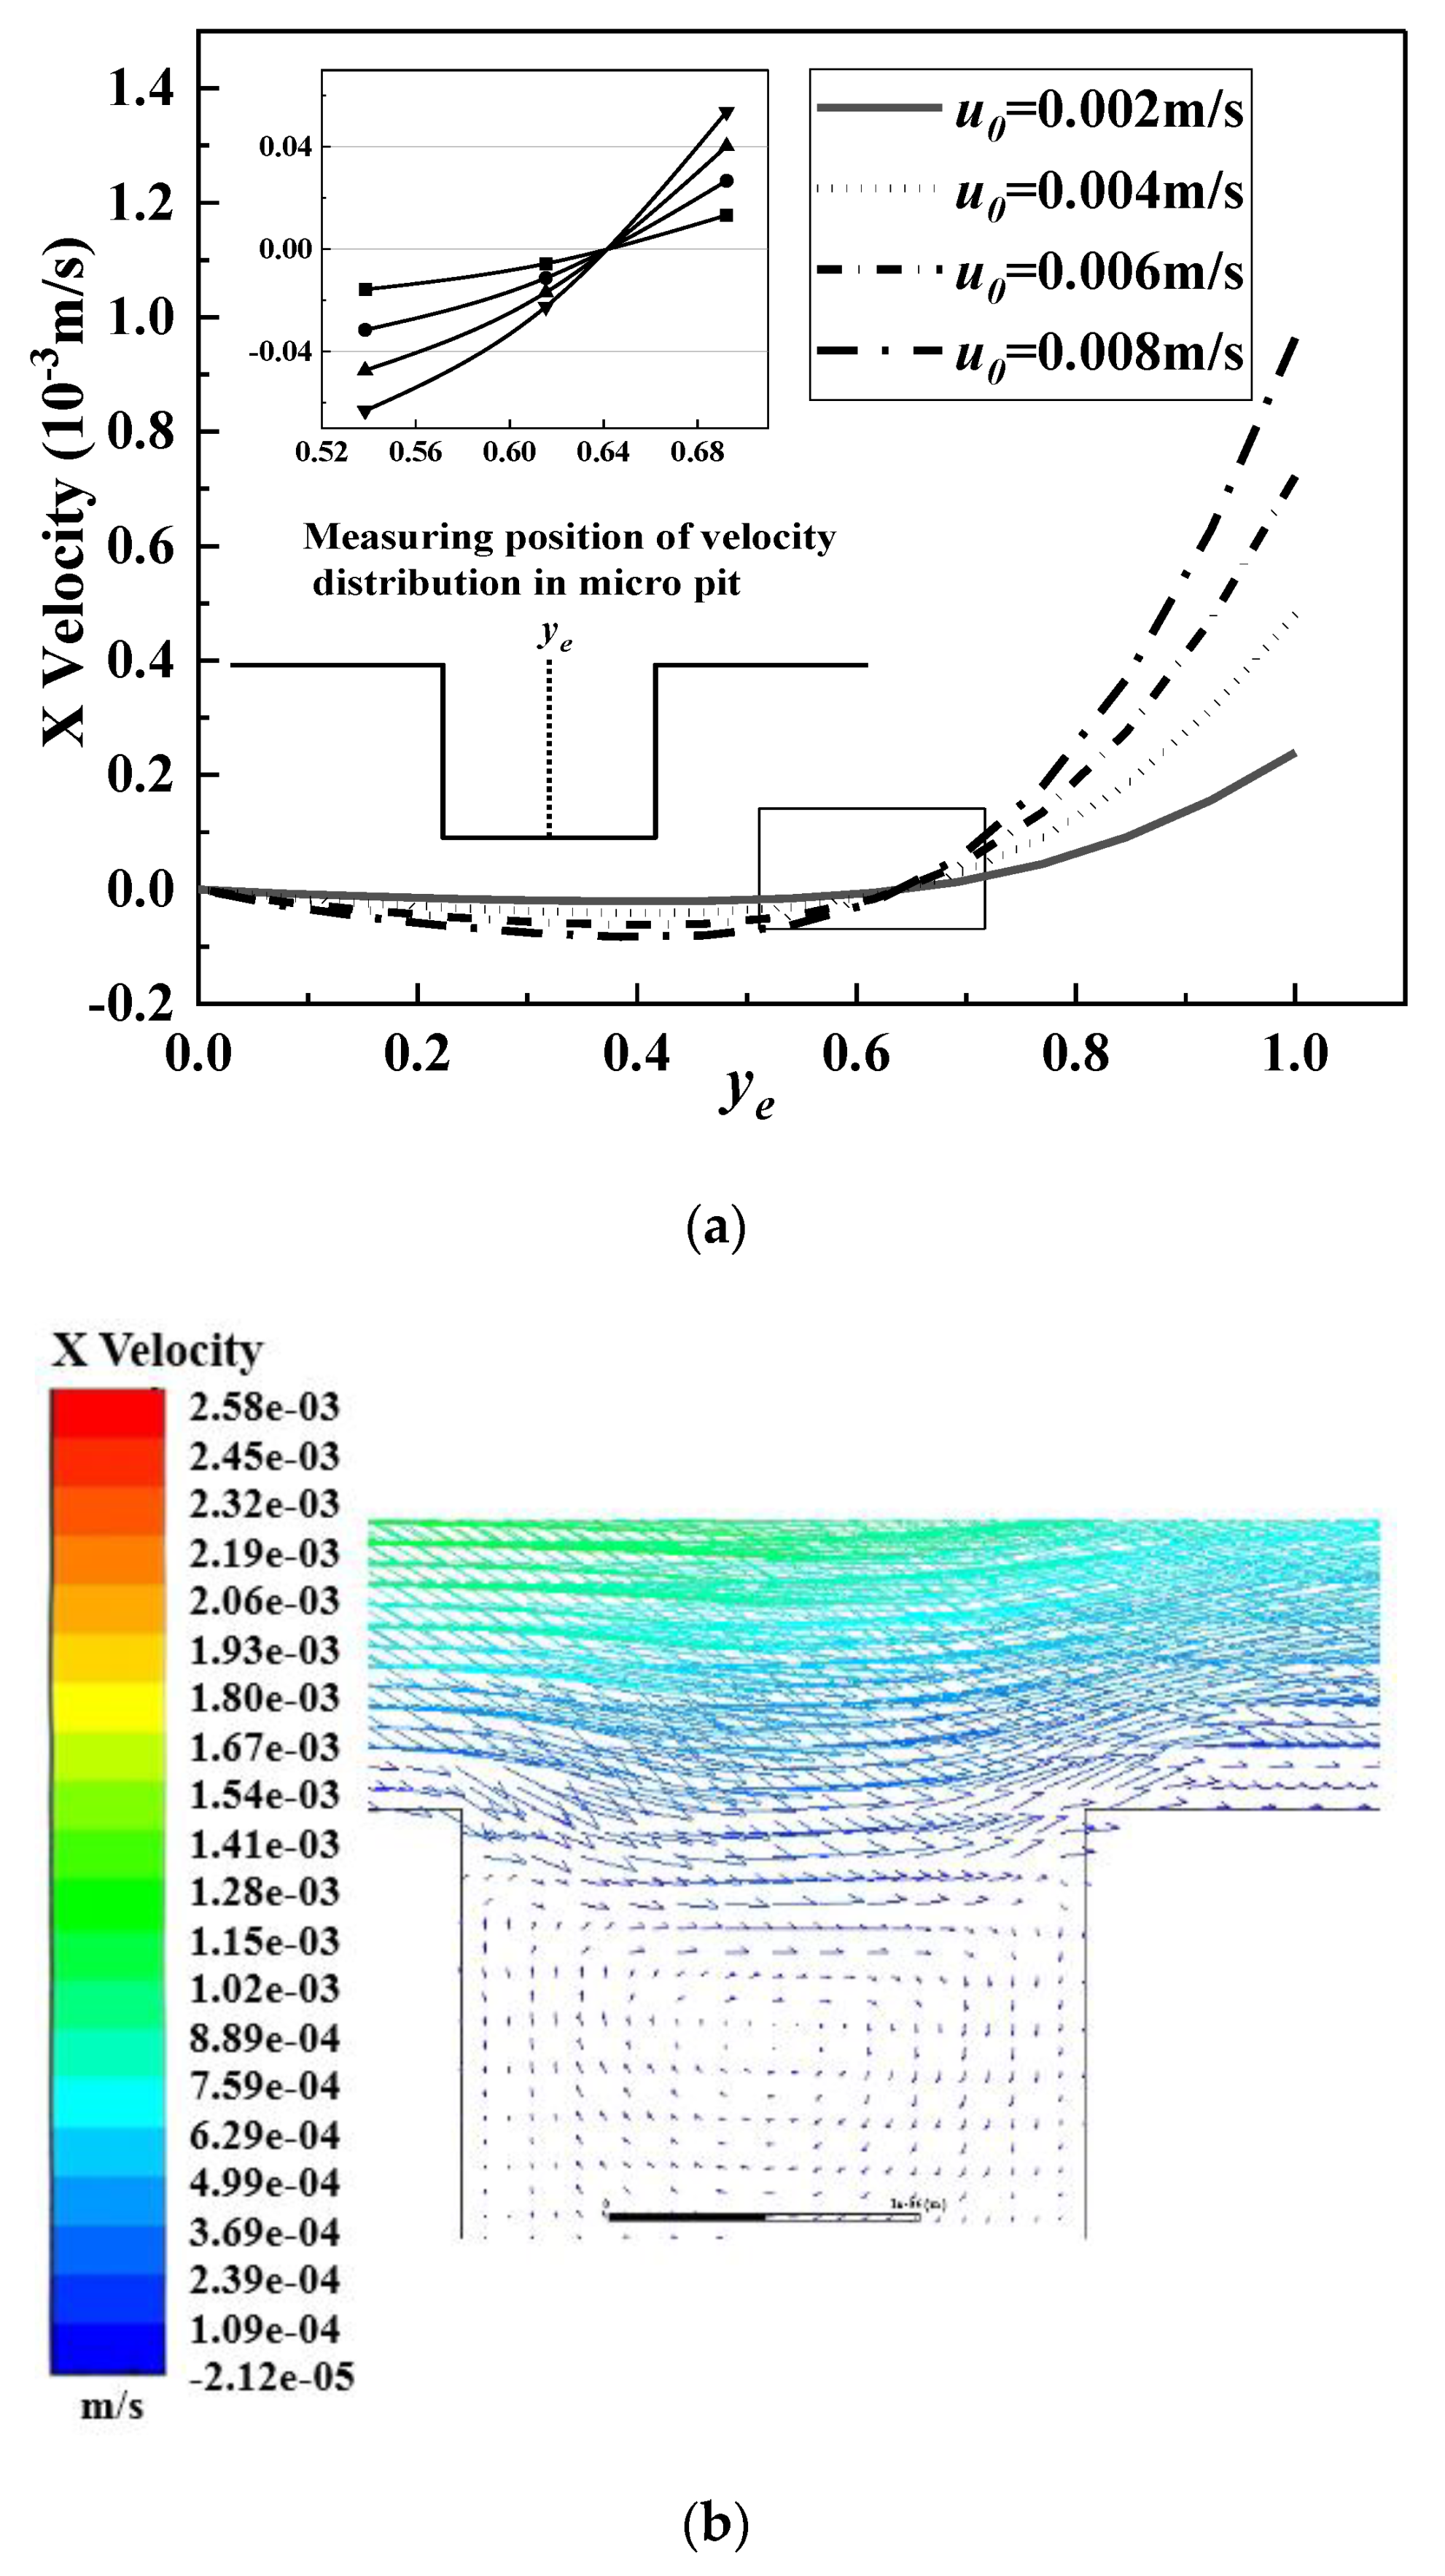
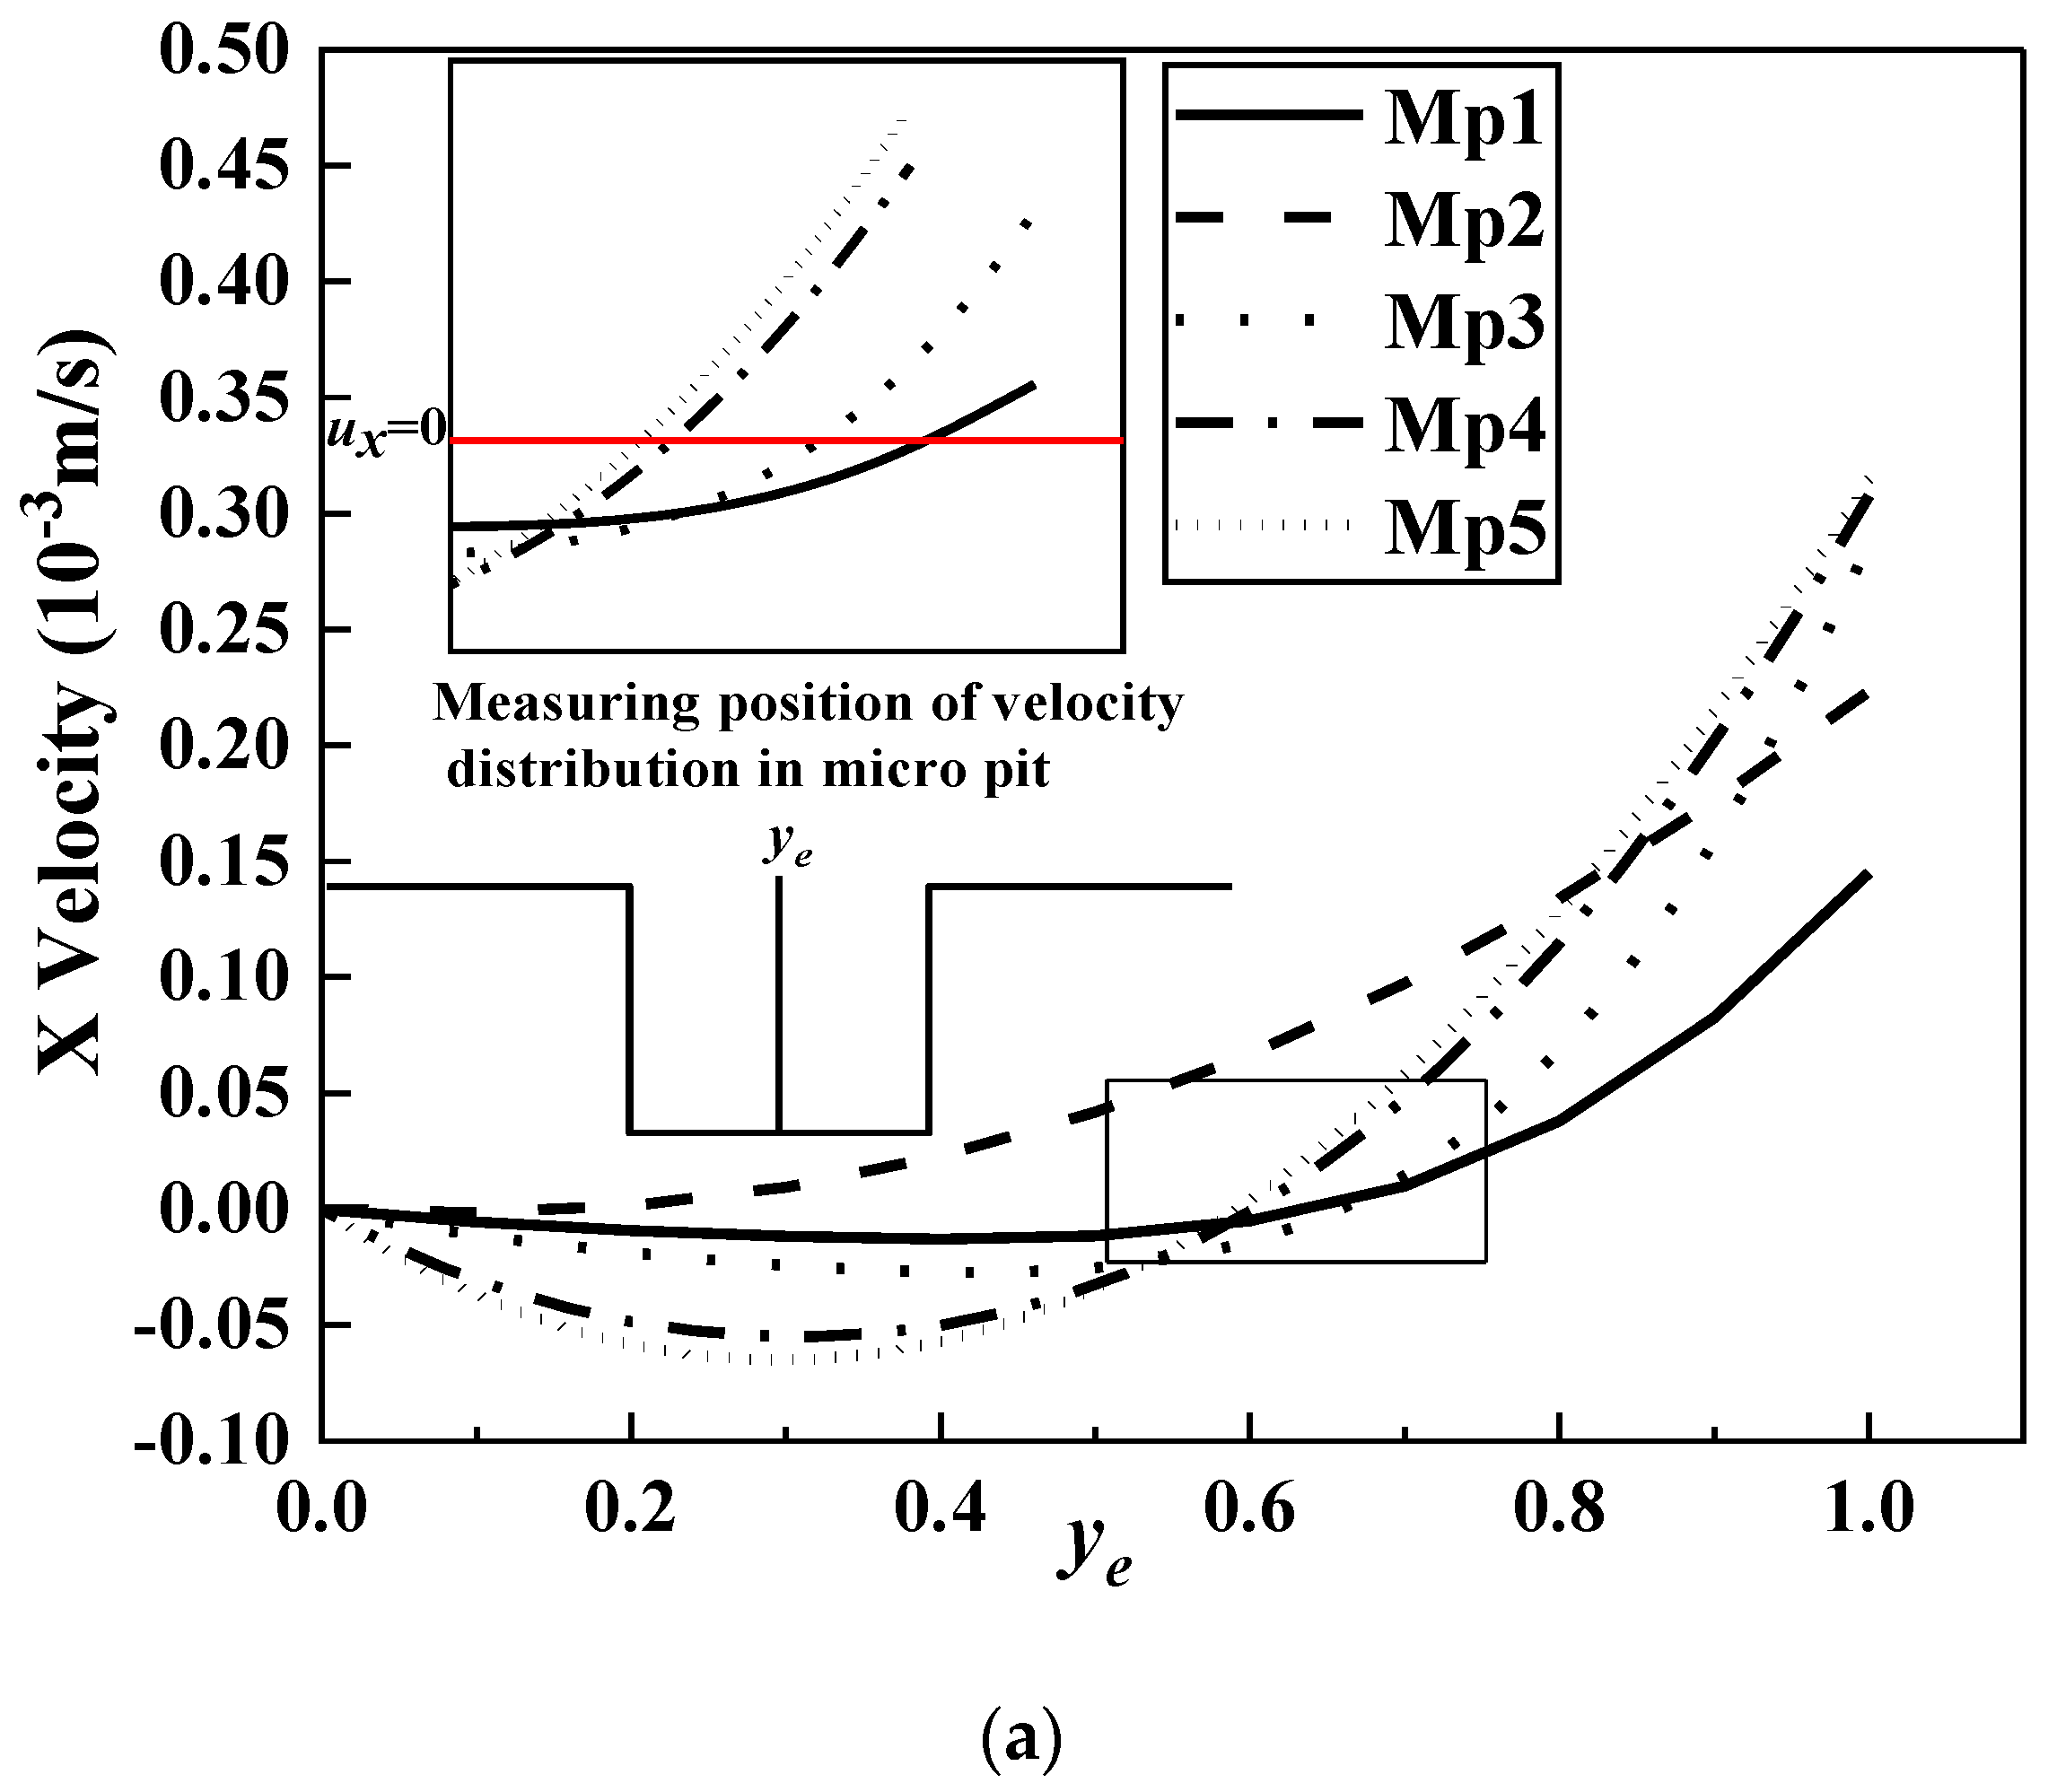
  • The increase of the initial velocity in the simulation channel significantly increased the vortex motion in the micropits. As the formation of biofouling conditioning layers occurred in the nanoscale, they easily entered the micropits and appeared everywhere on the microstructured surface. However, the existence of the micro-vortex flow caused particles to rotate and even spin out of the micropits; thereby, reducing the formation of conditioning layers in the microstructure.
  • The movement of microorganisms near the wall caused a low shear stress distribution on adjacent microridges. In previous studies, the consideration of relatively high shear stress on microstructured surfaces caused difficulty in microbial attachments. However, in the current simulation, the addition of moving microorganisms significantly weakened the shear stress when the microbes approached the wall, indicating that its impact has been overestimated in previous studies. There is no conclusive evidence that high shear stress is the main antifouling factor for microstructured surfaces. The shear stress gradient of the microstructured surface fluctuated sharply at ridge steps, signifying that microridge edges have a better effect in reducing biological attachment. The sudden change of the shear stress (large τ ) was found to be an important parameter to reduce microbial attachment.
  • The average shear stresses of the wall Sin and Sout in the downstream and counterflow directions decreased with the increase in micropit depth and width. The Mp5 microridge had a larger shear stress gradient, suggesting its superior antifouling performance to other surfaces; however, this inference was only applicable when r > s/2, that is, when the main fouling organisms cannot enter the micropit. Further investigation of the shear stress in the micro pits shows that when r < s/2, the Mp1 micropit was the most difficult to adhere to. Spherical microorganisms were only considered in the current simulation; however, in actual situations, the shape and characteristic size of microorganisms are quite different. Therefore, in future simulations, microorganisms with different shapes and sizes will be considered to optimize antifouling models of microstructured surfaces.

Author Contributions

H.Y. and C.L. proposed the research direction and methodology. H.Y. designed the 3D model of biological movement. H.L. completed numerical simulation with FLUENT, mapping with Origin, and data analysis. H.Y. wrote the paper. S.W. provided theoretical guidance and paper revision. All authors have read and agreed to the published version of the manuscript.

Funding

This paper was supported by the National Natural Science Foundation of China (51876065) and Fundamental Research Funds for the Central Universities of Ministry of Education of China (Grant No. 2015MS105).

Informed Consent Statement

Informed consent was obtained from all subjects involved in the study.

Data Availability Statement

The data presented in this study are available on request from the corresponding author.

Acknowledgments

We thank Songling Wang for his theoretical guidance. Special thanks go to the National Natural Science Foundation of China (51876065) and Fundamental Research Funds for the Central Universities of Ministry of Education of China (Grant No. 2015MS105) for support with the finance.

Conflicts of Interest

The authors declare no conflict of interest.

References

  1. Gu, Y.Q.; Mou, J.G.; Dai, D.S.; Zheng, S.H.; Jiang, L.F.; Wu, D.H.; Ren, Y.; Liu, F.Q. Characteristics on drag reduction of bionic jet surface based on earthworm’s back orifice jet. Acta Phys. Sin. 2015, 64, 024701. [Google Scholar] [CrossRef]
  2. Murthy, P.S.; Venugopalan, V.P.; Nair, K.V.K.; Subramoniam, T. Larval Settlement and Surfaces: Implications in Development of Antifouling Strategies. Mar. Ind. Biofouling 2009, 4, 233–263. [Google Scholar] [CrossRef]
  3. Lou, T.; Bai, X.Q.; Yuan, C.Q.; Yang, Z.C. Advances in Surface Microstructure Antifouling Technology for Ship Hull. Surf. Technol. 2019, 48, 115–126. [Google Scholar] [CrossRef]
  4. Gregory, S.W.; David, W.G.; Lin, S.; Li, X.; Bronwen, W.C.; Sverre, M.; Jolanta, A.W. A gecko skin micro/nano structure-a low adhesion, superhydrophobic, anti-wetting, self-cleaning, biocompatible, antibacterial surface. Acta Biomater. 2015, 21, 109–122. [Google Scholar] [CrossRef]
  5. Brennan, A.B.; Baney, R.H.; Carman, M.L.; Estes, T.G.; Feinberg, A.W.; Wilson, L.H.; Schumacher, J.F. Surface Topography for Non-Toxic Bioadhesion Control. U.S. Patent 7143709 B2, 5 December 2006. [Google Scholar]
  6. Kommeren, A.S. Structured Antifouling Coatings for the Marine Environment; Technische Universiteit Eindhoven: Eindhoven, The Netherlands, 2017. [Google Scholar]
  7. Callow, M.E.; Fletcher, R.L. The influence of low surface energy materials on bioadhesion a review. Int. Biodeterior. Biodegrad. 1994, 34, 333–348. [Google Scholar] [CrossRef]
  8. Fletcher, M.; Loeb, G. Influence of substratum characteristics on the attachment of a marine pseudomonad to solid surfaces. Appl. Environ. Microb. 1979, 37, 67–72. [Google Scholar] [CrossRef] [Green Version]
  9. Wenzel, R.N. Resistance of solid surfaces to wetting by water. Ind. Eng. Chem. 1936, 28, 988–994. [Google Scholar] [CrossRef]
  10. Cassie, A.B.D.; Baxter, S. Wettability of porous surfaces. Trans. Faraday Soc. 1944, 40, 546–551. [Google Scholar] [CrossRef]
  11. Berntsson, K.M.; Andreasson, H.; Jonsson, P.R.; Larsson, L.; Ring, K.; Petronis, S.; Gatenholm, P. Reduction of barnacle recruitment on micro-textured surfaces: Analysis of effective topographic characteristics and evaluation of skin friction. Biofouling 2000, 16, 245–261. [Google Scholar] [CrossRef]
  12. Omran, M.; Akarri, S.; Torsaeter, O. The Effect of Wettability and Flow Rate on Oil Displacement Using Polymer-Coated Silica Nanoparticles: A Microfluidic Study. Processes 2020, 8, 991. [Google Scholar] [CrossRef]
  13. Schumacher, J.F.; Carman, M.L.; Estes, T.G.; Feinberg, A.W.; Wilson, L.H.; Callow, M.E.; Callow, J.A.; Finlay, J.A.; Brennan, A.B. Engineered antifouling microtopographies-effect of feature size, geometry, and roughness on settlement of zoospores of the green alga ulva. Biofouling 2007, 23, 55–62. [Google Scholar] [CrossRef]
  14. Zheng, J.Y.; Lin, C.G.; Zhang, J.W.; Wang, L.; Xu, F.L.; Zhou, J.; Duan, D.X.; Liu, H.H. Antifouling performance of surface microtopographies based on sea star luidia quinaria. Key Eng. Mater. 2013, 562–565, 1290–1295. [Google Scholar] [CrossRef]
  15. Scardino, A.J.; Guenther, J.; Nys, R.D. Attachment point theory revisited: The fouling response to a microtextured matrix. Biofouling 2008, 24, 45–53. [Google Scholar] [CrossRef]
  16. Long, C.J.; Schumacher, J.F.; Robinson, P.A.C.; Finlay, J.A.; Callow, M.E.; Callow, J.A.; Brennan, A.B. A model that predicts the attachment behavior of ulva linza zoospores on surface topography. Biofouling 2010, 26, 411–419. [Google Scholar] [CrossRef]
  17. Magin, C.M.; Long, C.J.; Cooper, S.P.; Ista, L.K.; Lopez, G.P.; Brennan, A.B. Engineered antifouling microtopographies: The role of Reynolds number in a model that predicts attachment of zoospores of ulva and cells of cobetia marina. Biofouling 2010, 26, 719–727. [Google Scholar] [CrossRef] [PubMed]
  18. Schumacher, J.F.; Long, C.J.; Callow, M.E.; Finlay, J.A.; Callow, J.A.; Brennan, A.B. Engineered nanoforce gradients for inhibition of settlement (attachment) of swimming algal spores. Langmuir 2008, 24, 4931–4937. [Google Scholar] [CrossRef] [PubMed]
  19. Decker, J.T.; Kirschner, C.M.; Long, C.J.; Finlay, J.A.; Callow, M.E.; Callow, J.A.; Brennan, A.B. Engineered Antifouling Microtopographies: An Energetic Model That Predicts Cell Attachment. Langmuir 2013, 29, 13023–13030. [Google Scholar] [CrossRef]
  20. Jian, Z.; Xin, H.Y.; Tu, S.-T. Lattice Boltzmann Simulation on Droplet Flow through 3D Metal Foam. Processes 2019, 7, 877. [Google Scholar] [CrossRef] [Green Version]
  21. Won, Y.J.; Jung, S.Y.; Jang, J.H.; Lee, J.W.; Chae, H.R.; Choi, D.C.; Hyun, A.K.; Lee, C.H.; Park, P.K. Correlation of membrane fouling with topography of patterned membranes for water treatment. J. Membr. Sci. 2016, 498, 14–19. [Google Scholar] [CrossRef]
  22. Jung, S.Y.; Hyun, A.K. Transport and deposition of colloidal particles on a patterned membrane surface: Effect of cross-flow velocity and the size ratio of particle to surface pattern. J. Membr. Sci. 2019, 572, 309–319. [Google Scholar] [CrossRef]
  23. Mohammed Ridha, B.A.F.; Felicia, W.Y.M.; Narayana, N.S.; Hosseini, F.M.; Eunice Phang, S.W.; Chua, B.L.; Chow, Y.H.; Yong, L.C.; Al-Obaidi, A.S.M. Comparisons of Flow Patterns over a Hierarchical and a Non-hierarchical Surface in Relation to Biofouling Control. USA MATEC Web Conf. 2018, 02014–02029. [Google Scholar] [CrossRef] [Green Version]
  24. Lee, Y.K.; Won, Y.J.; Yoo, J.H.; Ahn, K.H.; Lee, C.H. Flow analysis and fouling on the patterned membrane surface. J. Membr. Sci. 2013, 427, 320–325. [Google Scholar] [CrossRef]
  25. Darnton, N.C.; Turner, L.; Rojevsky, S.; Berg, H.C. Dynamics of bacterial swarming. Biophys. J. 2010, 98, 2082–2090. [Google Scholar] [CrossRef] [Green Version]
  26. Halder, P.; Nasabi, M.; Jayasuriya, N.; Shimeta, J.; Deighton, M.; Bhattacharya, S.; Mitchell, A.; Bhuiyan, M.A. An assessment of the dynamic stability of microorganisms on patterned surfaces in relation to biofouling control. Biofouling 2014, 30, 695–707. [Google Scholar] [CrossRef]
  27. Smayda, T.J. The suspension and sinking of phytoplankton in the sea. Oceanogr. Mar. Biol. Ann. Rev. 1970, 8, 353–414. [Google Scholar]
  28. Schwuchow, J.M.; Kern, V.D.; Wagner, T.; Sack, F.D. The density of apical cells of dark-grown protonemata of the moss Ceratodon purpureus. Protoplasma 2000, 211, 225–233. [Google Scholar] [CrossRef] [PubMed]
  29. Rosenhahn, A.; Sendra, G.H. Surface Sensing and Settlement Strategies of Marine Biofouling Organisms. Biointerphases 2012, 7, 63–75. [Google Scholar] [CrossRef]
Figure 1. Three-dimensional model of the microstructured surface with micropits.
Processes 09 00319 g001
Figure 2. (a) Microorganisms and microstructured surface grid; (b) Microorganisms and microstructured surface models.
Processes 09 00319 g002
Figure 3. Dimensionless pressure drop ratios at different inlet velocities.
Processes 09 00319 g003
Figure 4. LSCM images of microbial fouling experiment silicon wafers. (a) smooth surface; (b) Mp1 microstructured surface; (c) Mp5 microstructured surface.
Processes 09 00319 g004
Figure 5. Strain rate distribution of plain surface and Mp1 microstructured surface. (a) Strain rate of plain surface without microorganisms; (b) Strain rate of Mp1 microstructured surface without microorganisms; (c) Strain rate of plain surface distribution; (d) Strain rate of Mp1 microstructured surface.
Processes 09 00319 g005
Figure 6. (a) Average velocity distribution above six microstructures; (b) Velocity distribution at different measuring heights of two microstructures under the microorganism.
Processes 09 00319 g006
Figure 7. (a) Microbial location diagram; (b) The average velocity distribution of the microstructure surface of microorganisms at different heights d.
Processes 09 00319 g007
Figure 8. (a) Velocity distributions at different inlet velocities; (b) Vector diagram of the Mp1 micropit.
Processes 09 00319 g008
Figure 9. (a) Velocity distributions of different-sized micropits; (b) Velocity vector diagram of the Mp2 micropit.
Processes 09 00319 g009aProcesses 09 00319 g009b
Figure 10. Shear stress distribution on the microstructured surface and in micropits.
Processes 09 00319 g010
Figure 11. Shear stress distributions on the microstructured surface at different heights of microorganisms.
Processes 09 00319 g011
Figure 12. Shear stress gradients of the smooth surface and the five microstructured surfaces.
Processes 09 00319 g012
Figure 13. Shear stress distributions on the inner wall of (a) Mp1 and (b) Mp5 micropits in the downstream and countercurrent directions.
Processes 09 00319 g013
Table 1. Micropit size.
Micropit ParametersMp1Mp2Mp3Mp4Mp5
h (μm)22555
s (μm)255810
Table 2. Shear stresses at adjacent microridges.
Shear StressMr0Mr1Mr2Mr3Mr4
τ ¯ (d = 0.5 μm)1.4670.6510.6781.8841.468
τ max (d = 0.5 μm)2.0051.0590.9512.7682.005
τ ¯ (d = 5 μm)0.0610.1100.3080.2770.105
τ max (d = 5 μm)0.0750.1870.4460.2740.153
Table 3. Shear stresses gradients at adjacent microridges.
Shear Stress GradientsMr0Mr1Mr2Mr3Mr4
τ max (d = 0.5 μm)80.24058.89862.84696.83998.532
τ max (d = 5 μm)6.66219.53221.65810.7565.710
Table 4. Shear stress gradients of adjacent microridges.
Each Point at the RidgeA0B0A1C0D0C1
τ 60.461−65.82215.79517.186−19.47915.086
Table 5. Average shear stresses on micropit walls in the downstream and countercurrent directions.
Average Shear StressMp1Mp2Mp3Mp4Mp5
τ ¯ d , i n 0.1780.1250.0940.0840.069
τ ¯ d , o u t 0.1560.0620.0580.0400.035
τ ¯ c , i n 0.1170.1120.0890.0800.069
τ ¯ c , o u t 0.0960.0330.0530.0420.037
Publisher’s Note: MDPI stays neutral with regard to jurisdictional claims in published maps and institutional affiliations.

