Article

Effect of Surface Textures and Wettability on Droplet Impact on a Heated Surface

Department of Mechanical Systems Engineering, Tokyo Metropolitan University, 1-1 Minami-Osawa, Hachioji-shi, Tokyo 192-0397, Japan
*
Author to whom correspondence should be addressed.
Processes 2021, 9(2), 350; https://doi.org/10.3390/pr9020350
Submission received: 25 January 2021 / Revised: 5 February 2021 / Accepted: 10 February 2021 / Published: 14 February 2021
(This article belongs to the Special Issue Study on Bio-Thermofluid Dynamics)

Abstract

:
A liquid droplet can hover over a solid surface that is heated above the Leidenfrost point (LFP), at which an insulating vapor layer is formed that acts as a heat transfer barrier. Recent studies have reported that hierarchical micro- and nanoscale textures provide high wettability and significant LFP enhancement. However, such textures are often difficult and expensive to fabricate. Therefore, this study aimed to experimentally demonstrate LFP enhancement through the use of low-cost hierarchical textures. Surface textures were fabricated by coating SiO2 nanoparticles on stainless steel wire meshes. The droplet lifetime method was used to determine the LFP in a temperature range of 200 °C–490 °C. High-speed imaging (4000–23,000 fps) was performed for visualizing the impact behavior of a droplet. The LFP value of the nanocoated mesh surface was found to be greater than 490 °C. This enhanced LFP was 178 °C higher than that of a stainless steel surface and 38 °C higher than that of a single-layer textured surface. Furthermore, with respect to the LFP enhancement, the explosive impact behavior of a droplet can be observed on nanocoated mesh surfaces.

1. Introduction

Spray cooling, in which cooling is produced by the collision of refrigerant droplets, is an efficient method based on the phase change of droplets [1]. It is commonly used for cooling generators [2,3], heat-treating metals [4,5], and cooling electronic equipment [1,6]. The spray cooling efficiency is usually expressed by a droplet lifetime curve [7]. When the temperature of the solid exceeds the boiling point of the liquid, the droplet evaporates while forming steam bubbles in a process called nucleate boiling. If the temperature is increased gradually, the temperature of the solid reaches the critical heat flux (CHF) point, and the droplet evaporation time is minimized. As it is heated further, it undergoes transition boiling, reaches the Leidenfrost point (LFP), and finally undergoes film boiling. In this state, a vapor film is formed at the bottom of the droplet, the solid–liquid contact is cut off, and the droplet does not evaporate instantly, thereby sharply reducing the cooling efficiency. Therefore, the LFP is an important indicator that determines the operating limits of heat transfer equipment. In this light, achieving higher LFPs is a critical challenge in industrial processes.
Studies have investigated heat transfer surfaces with regular microstructures to clarify how surface textures affect the LFP. Kim et al. [8] used a heat transfer surface with 15-μm-tall micropillars and enhanced the LFP from 264 °C to 274 °C and from 290 °C to 325 °C with Au and SiO2 substrates, respectively. They also detected a partial solid–liquid contact on the surface with micropillars. They presumed that the pillars penetrated the vapor film. A comparison of the vapor film thickness e and the pillar height revealed that they were of the same order, and therefore, they concluded that the pillars penetrated the vapor film, restored the solid–liquid contact, and enhanced the LFP.
Kwon et al. [9] fabricated a heat transfer surface with micropillars (width a = 10   μ m ) synthesized on an Si substrate and clarified the impact of the interpillar space on the LFP. Specifically, as they increased the interpillar space b from 3.3 to 100 μm, the LFP was enhanced from 270 °C to 370 °C. However, according to the Young–Laplace equation, if b increases, the capillary force Δ P cap should decrease, resulting in a lower LFP. To explain this contradiction, Kwon et al. [9] proposed a model in which the capillary force Δ P cap and vapor pressure Δ P vap act at the solid–fluid interface. Feng [10] reported a similar experimental result of a lower LFP with reduced interpillar space. Geraldi et al. [11] set a wire mesh on a heat transfer surface and enhanced the LFP. The LFP correlated with the increase in wire spacing, which agrees with the trend found in other studies [9,10,11]. However, the LFP is not enhanced simply by increasing the interpillar space; in some cases, it may even decrease. For example, Park et al. [12] found that the LFP decreased as the interpillar space decreased and the pillar width increased. Similarly, Tran et al. [13] found that taller pillars resulted in a lower LFP.
Previous studies investigated the impacts of both micro- and nanostructures on the LFP. Takata et al. [14] produced a superhydrophilic heat transfer surface by sputtering SiO2 and TiO2 nanoparticles on it and exposing it to UV light. They reported that as the contact angle decreased, the wetting limit temperature (i.e., CHF) improved. Nair et al. [15] synthesized carbon nanofibers (CNFs) with fine pores with a height of 3.4–7.5 μm and an average size of 127 nm on a heat transfer surface and measured its LFP. As a result, the LFP was enhanced as the height of the CNFs increased. Kim et al. [16] fabricated a heat transfer surface with nanotubes (with 2.5-μm-tall and 20-nm-wide pores) by anodizing zirconium. As a result, the LFP was enhanced from 300 °C (on a smooth surface) to 370 °C. They attributed this to the stronger solid–liquid contact generated by the improved wettability and capillarity. They also reported that the bottoms of the droplets show an “explosive-like behavior.” In their experiment, this explosive-like behavior occurred when numerous fine pores on the heat transfer surface functioned as nucleation cavities and generated a large number of bubbles. To determine the Weber number dependency of this explosive-like behavior, Tong et al. [17] fabricated TiO2 nanotubes similar to those proposed by Kim et al. [16] with average pore height and width of 1.62 μm and 63 nm, respectively. Based on the impact behavior, they found that the explosive-like behavior occurs over a wide Weber number range and can be classified into four stages: 1st contact, 1st lift-off, 2nd contact, and 2nd lift-off. Liu et al. [18] investigated the impact dynamics of water droplets on heated nanostructured surfaces and showed that experimental data of LFP are consistent with a model prediction method proposed by balancing the droplet dynamic and vapor pressure.
The abovementioned results indicate that microstructures penetrate the vapor film while maintaining the solid–liquid contact and allowing the vapor to escape to the outside, whereas nanostructures change the wettability and strengthen the solid–liquid contact. Young′s formula is well known for the contact angle that governs this wettability [19]. Regarding the surface shape, Wenzel [20] clarified the effect of surface roughness, and Cassie et al. [21] clarified the effect of solid–liquid composite wall surface. Much research has also been conducted on wettability and solid–liquid contact [22,23,24,25].
More recent studies have effectively enhanced the LFP even further by forming combined micro-nano structures on the heat transfer surface. Kim et al. [8] coated SiO2 nanoparticles (diameter: 23 nm, thickness: 600 nm) on micropillars and enhanced the LFP from 264 °C to 453 °C. Kwon et al. [9] similarly enhanced the LFP to more than 400 °C. Farokhnia et al. [26] proposed a surface structure that combines an alumite film and micropillars to allow the vapor to escape through the micropillars while maintaining the solid–liquid contact through the strong capillarity produced by the fine 80-nm pores of the alumite film. If a model similar to that of Kwon et al. [9] is applied, Δ P cap > Δ P vap with practical temperatures and the transition to film boiling does not occur. Kwon et al. [9] experimentally demonstrated that the transition to film boiling also does not occur with Ts = 570 °C. These findings suggest that combined micro-nano structures are the most effective option for enhancing the LFP, although the mechanism through which they do so remains unclear. Further, this approach is not very practical because of the high cost and difficulty of producing such a structure. Therefore, this study aims to enhance the LFP using a micro-nanostructure that can be fabricated easily at a low cost. It also aims to clarify the LFP enhancement mechanism by observing the impact of a droplet on a heated surface. As far as we know, no research has improved the LFP at a highly inexpensive cost by creating a micro-nanostructure using a commercially available mesh as the microstructure.

2. Materials and Experimental Methods

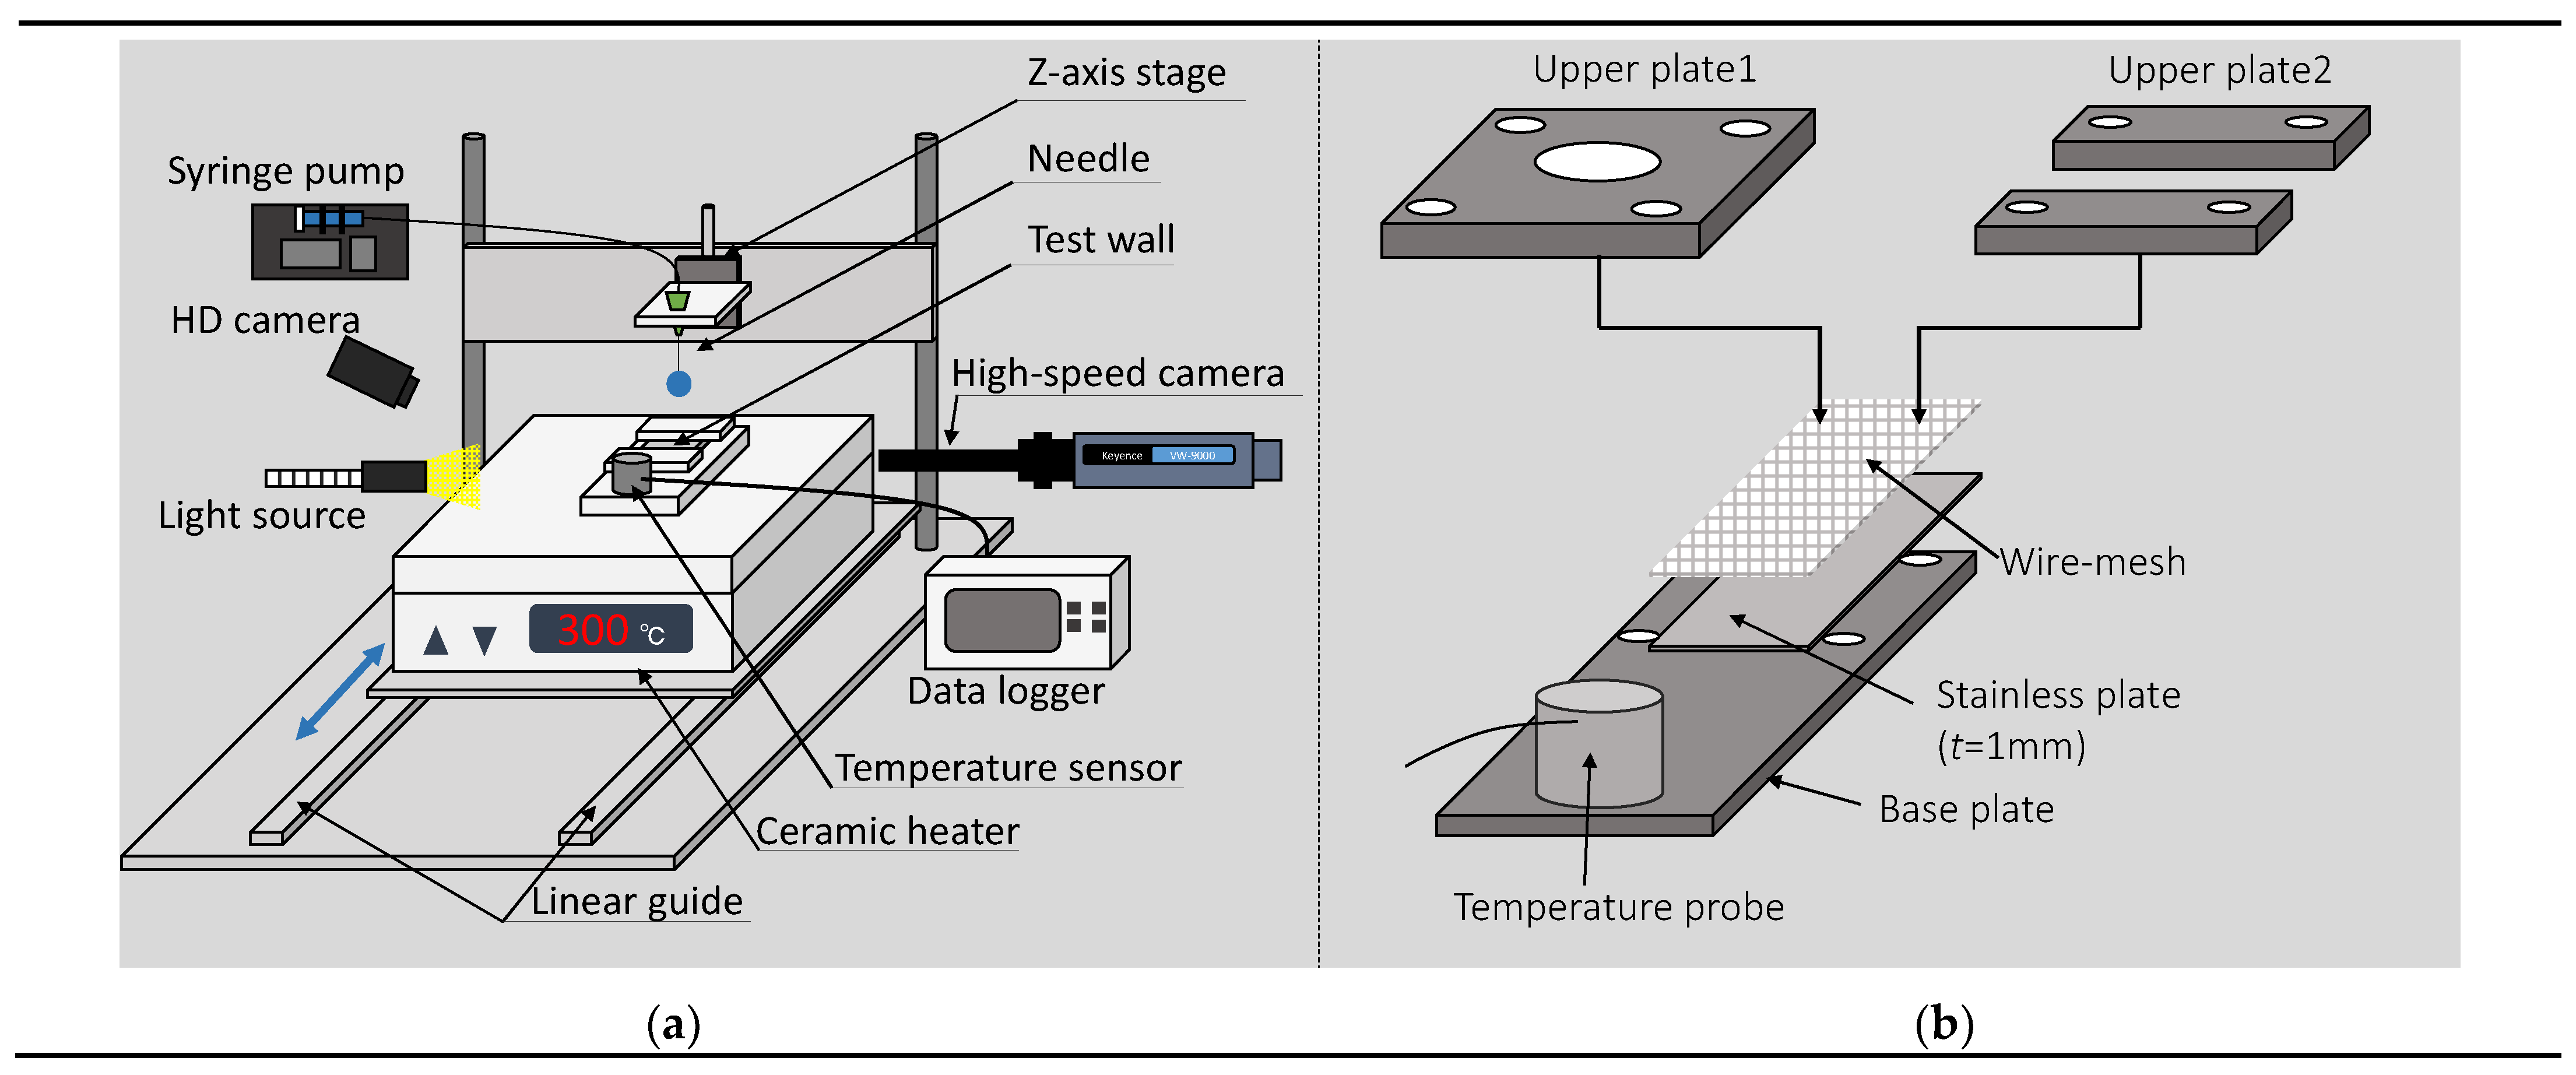
2.1. Experimental Setup

As shown in Figure 1a, the experimental setup consists of a drop system, a heating system, and an imaging system. The drop system can pump distilled water with a syringe pump at Q = 0.1 mL/min and generate droplets with a diameter (D0) of 1.9 mm with a needle (34G). The impact speed was adjusted to U0 = 0.24 m/s. The heating system uses a ceramic heater (CHP-170DF, AS ONE, Osaka, Japan) to heat the test wall to the desired temperature. The surface temperature was measured using a temperature sensor (WE-22K-GW1-ASP, Anritsu Meter, Tokyo, Japan). Finally, the imaging system can generate images of the droplet through a high-speed camera (VW-9000, KEYENCE, Osaka, Japan) and measure the evaporation time using a high-definition camera.

2.2. Hydrophilic Treatment

To make the test wall surface hydrophilic, we used a commercial coating agent (AD-Tech Coat, Trade Service Corporation, Osaka, Japan) containing SiO2 nanoparticles. A brush was used to coat this coating agent on the stainless steel surface. Further, the mesh surface was coated by fixing the mesh with a jig, coating 3 μL of the coating agent on it, and heating it at 80 °C with a ceramic heater and letting it dry. This process was repeated 10 times.

2.3. Test Wall and Jig

The test walls used were smooth stainless steel surfaces (flat), mesh surfaces (#60, #120, and #200), and hydrophilic surfaces (nano-flat, nano-#60, nano-#120, and nano-#200). The materials used were SUS304 and SUS316. The size of the mesh was 20 mm × 50 mm. The number following # indicates the number of meshes, that is, the number of pores per inch. Table 1 and Figure 2, respectively, show the dimensions and scanning electron microscopy (SEM) images of the test wall. Here, the wire diameter and wire spacing are denoted as d and s, respectively. Figure 2 shows that the nanocoated meshes have a nano order texture, thus forming a combined micro-nano structure.
In addition, to prevent the mesh surfaces from undergoing thermal expansion, they were fixed with the jig shown in Figure 1b. The jig consists of upper plates and a base plate, and the test walls can be fixed between them. Upper plate 1 was used for measuring the evaporation time, and upper plate 2 was used for high-speed imaging of the drop impact.

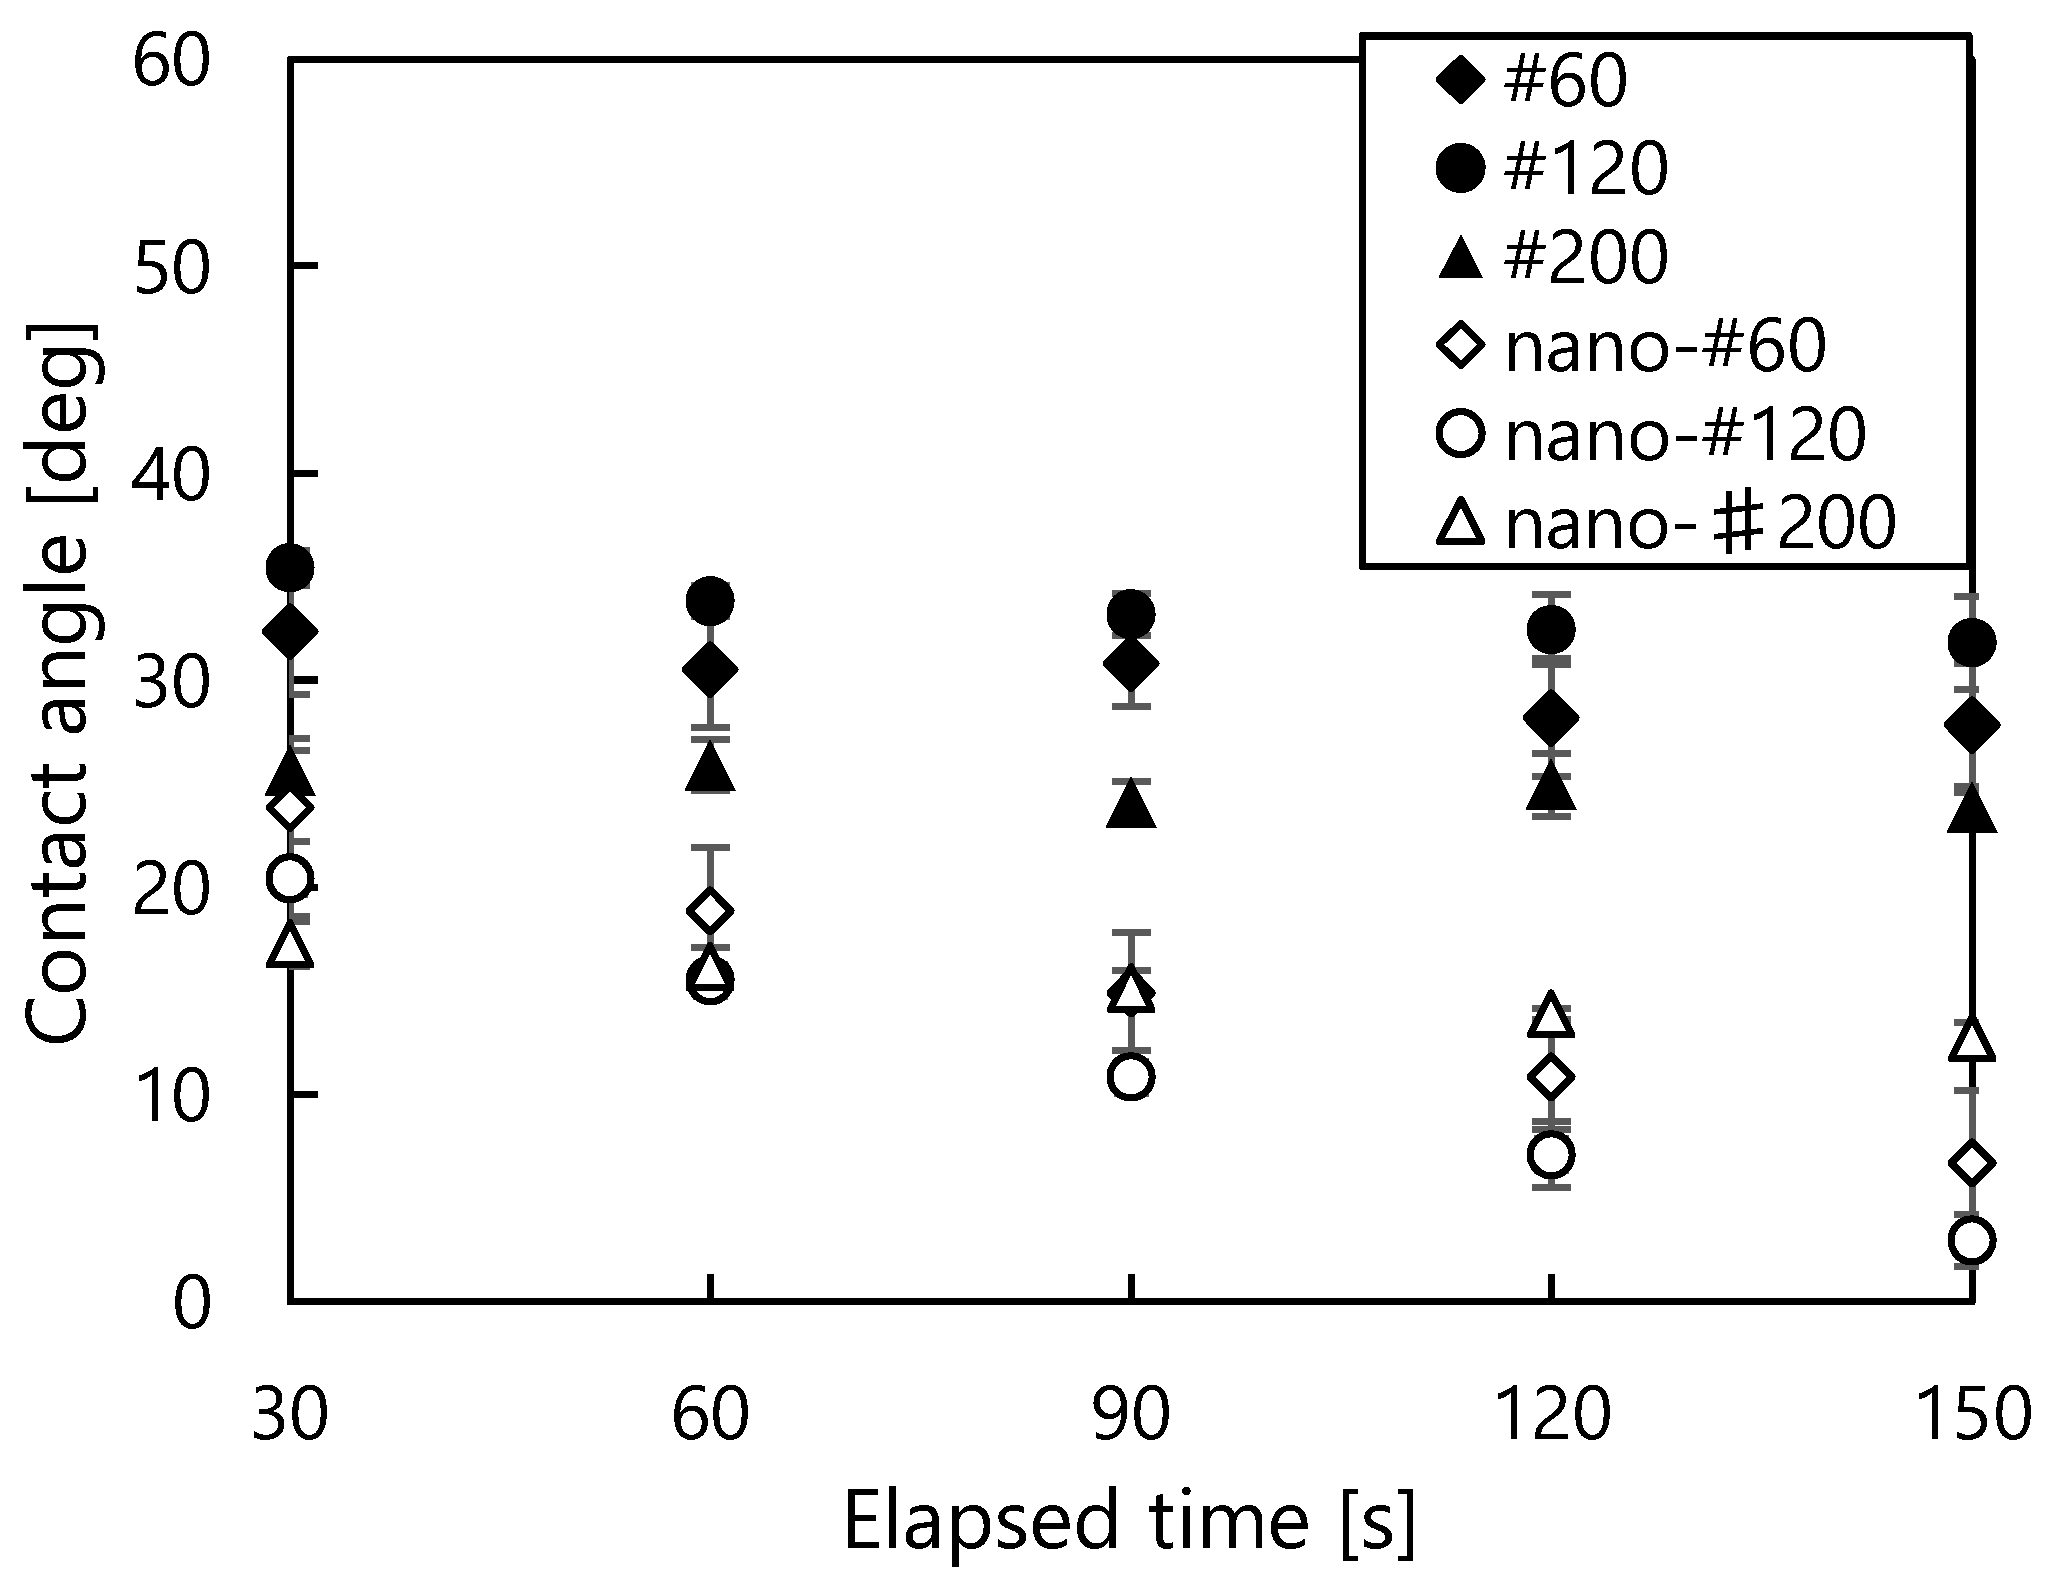
2.4. Contact Angle Measure

The contact angle of the test walls was measured using the θ / 2 method. The contact angles of the flat and nanoflat surfaces were θ = 18.5 ± 0.1° and θ = 5.5 ± 0.2°, respectively. Figure 3 shows the contact angle on the mesh surfaces. In the mesh surfaces, because water penetrates the mesh, we measured the contact angle as a function of the elapsed time.

2.5. Measurement of LFP

The LFP is normally defined as the surface temperature that maximizes evaporation time. The position of the LFP is indicated by an arrow in Figure 4. In this study, we determined the LFP by adjusting the surface temperature in 10 °C increments and measuring the evaporation time at each temperature. The temperature was measured by using a temperature sensor with an accuracy of ± 3.0 °C up to 400 °C and ± 3.8 °C up to 500 °C. It was considered that this temperature sensor could measure the temperature changes obtained in this study with sufficient accuracy.

2.6. Validation

To assess the validity of this experiment, preliminary experiments were conducted under the conditions shown in Table 2 for comparison with the results of conventional studies [16,27]. Table 2 also shows the conventional experimental conditions. The results of the preliminary experiment are shown in Figure 4. Here, τ 2 is the evaporation time considering the difference in the droplet sizes, and it is expressed as
τ 2 =   ( D 0 , present / D 0 , previous ) τ 1 ,
where τ 1 is the evaporation time before correction; D0,present, the droplet diameter in this study; and D0,previous, the droplet diameter in previous studies. Figure 4 shows that the experimental results of the present study agree well with the results of previous studies near the LFP [16,27].

3. Results and Discussion

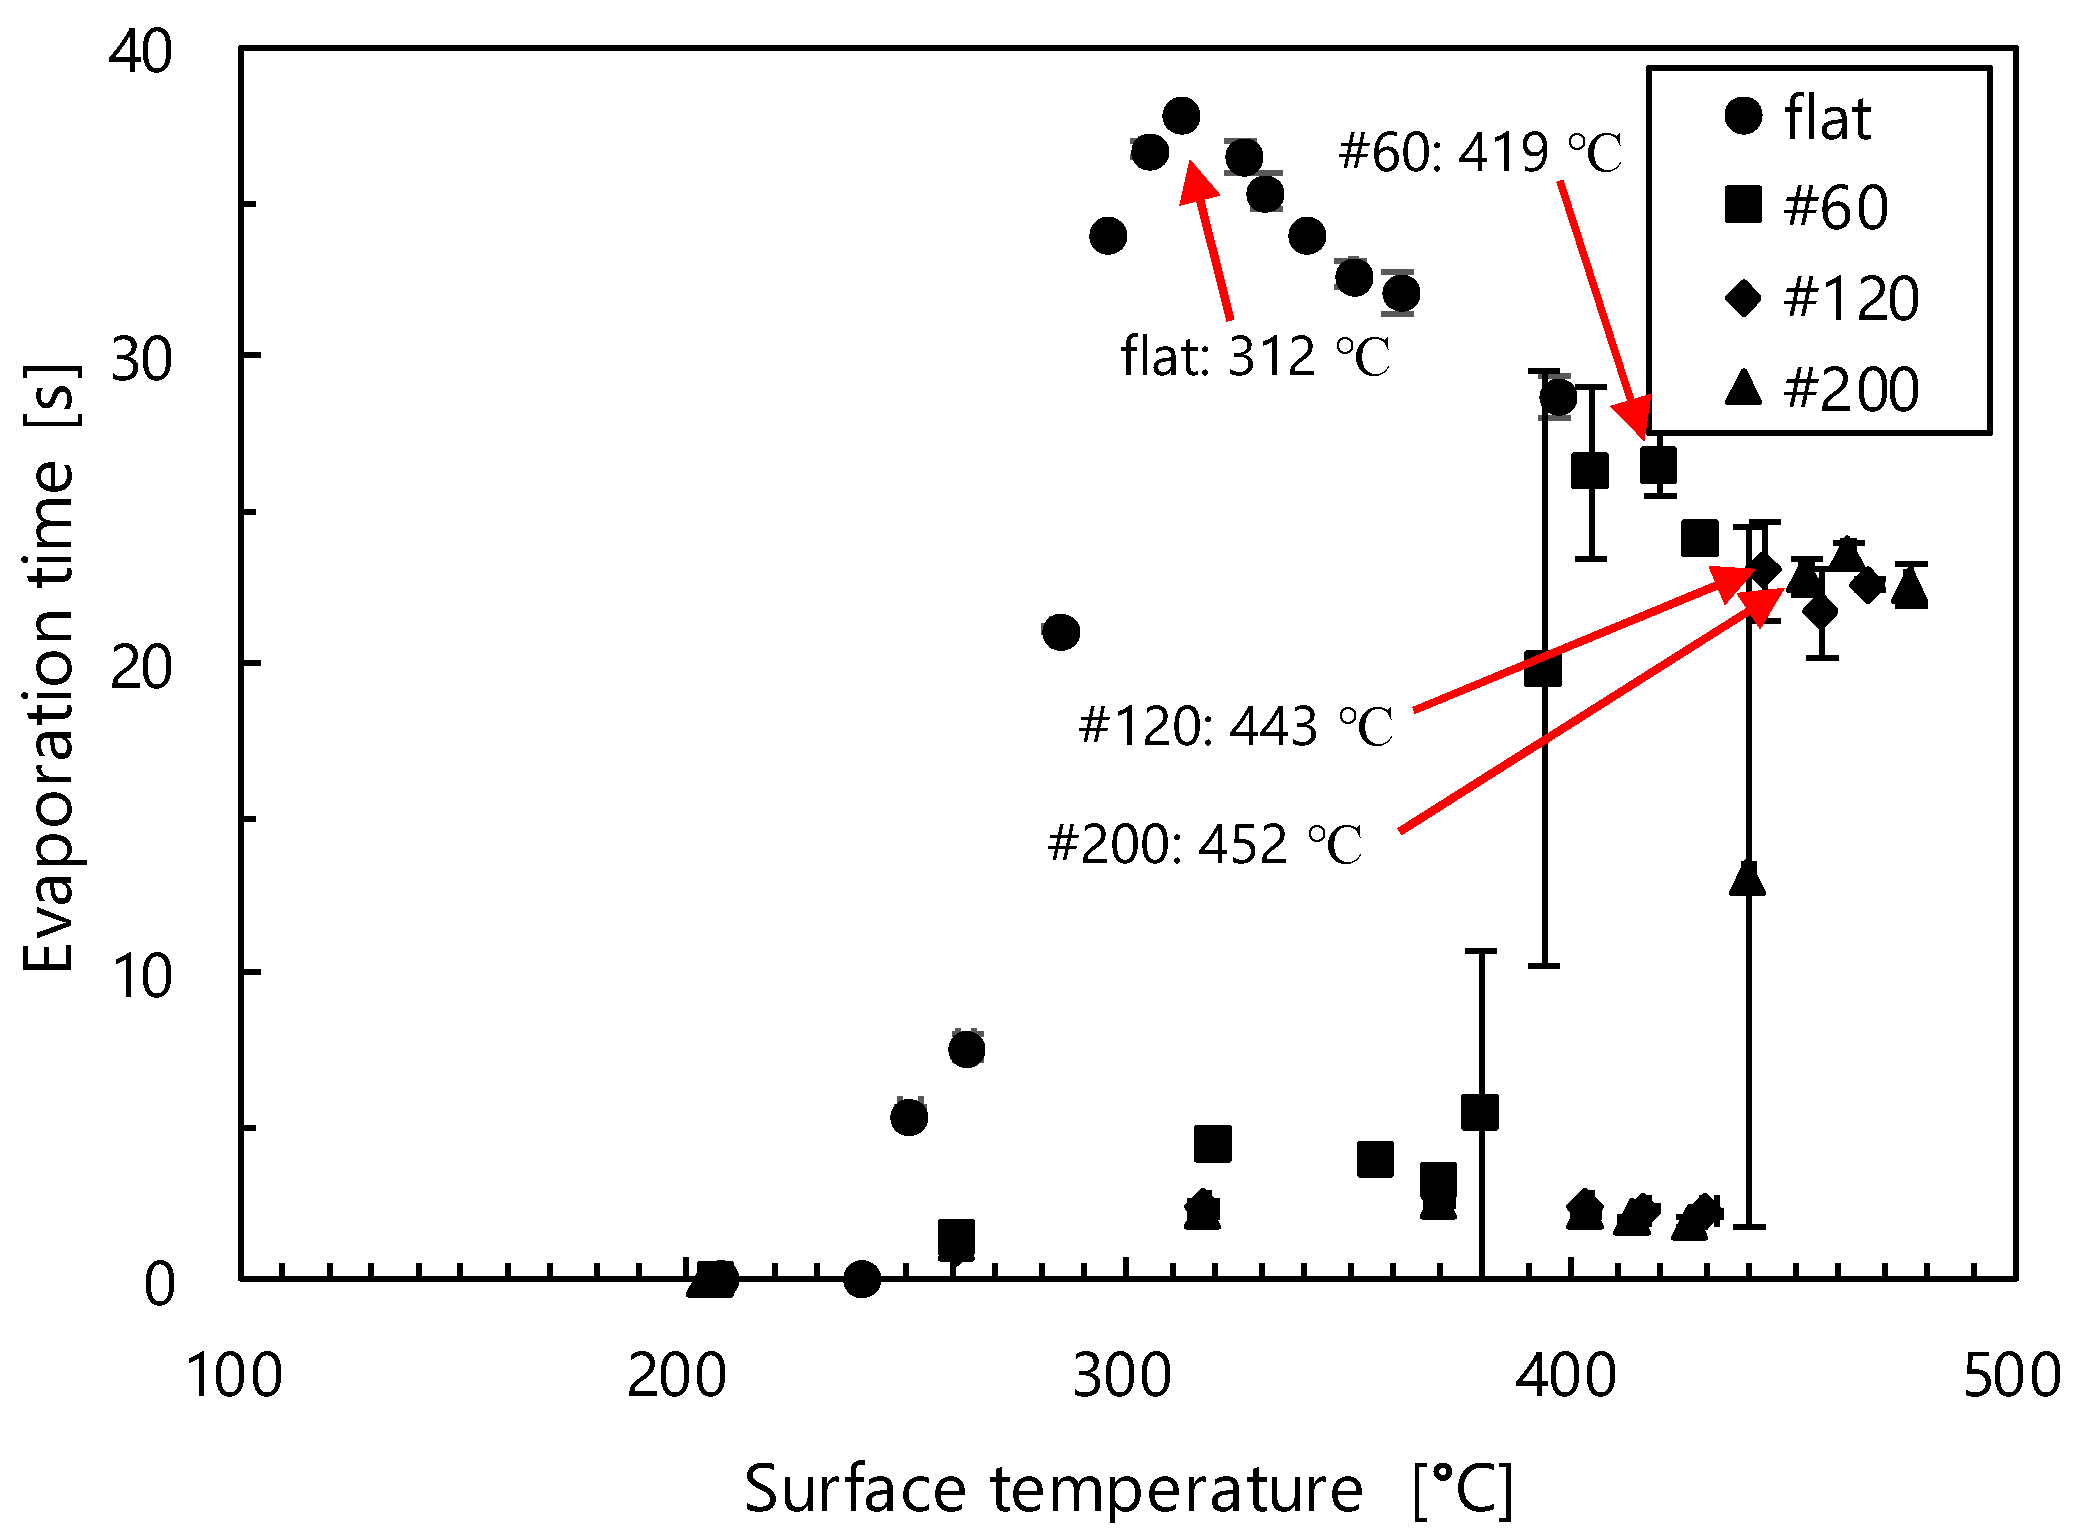
3.1. Droplet Evaporation Time and LFP

3.1.1. Stainless Surface/Nanocoated Stainless Surface

Figure 5 shows the droplet evaporation time on the stainless surface (flat) and nanocoated stainless surface (nanoflat). The LFP on the plane was 312 °C. On the other hand, the LFP on the nanoflat surface was 316 °C, and from this result, no effect of the hydrophilicity on the LFP was observed. We speculate that this is because the contact angle of the stainless steel surface was small from the start, thereby making the change in wettability before and after the hydrophilic treatment small as well.

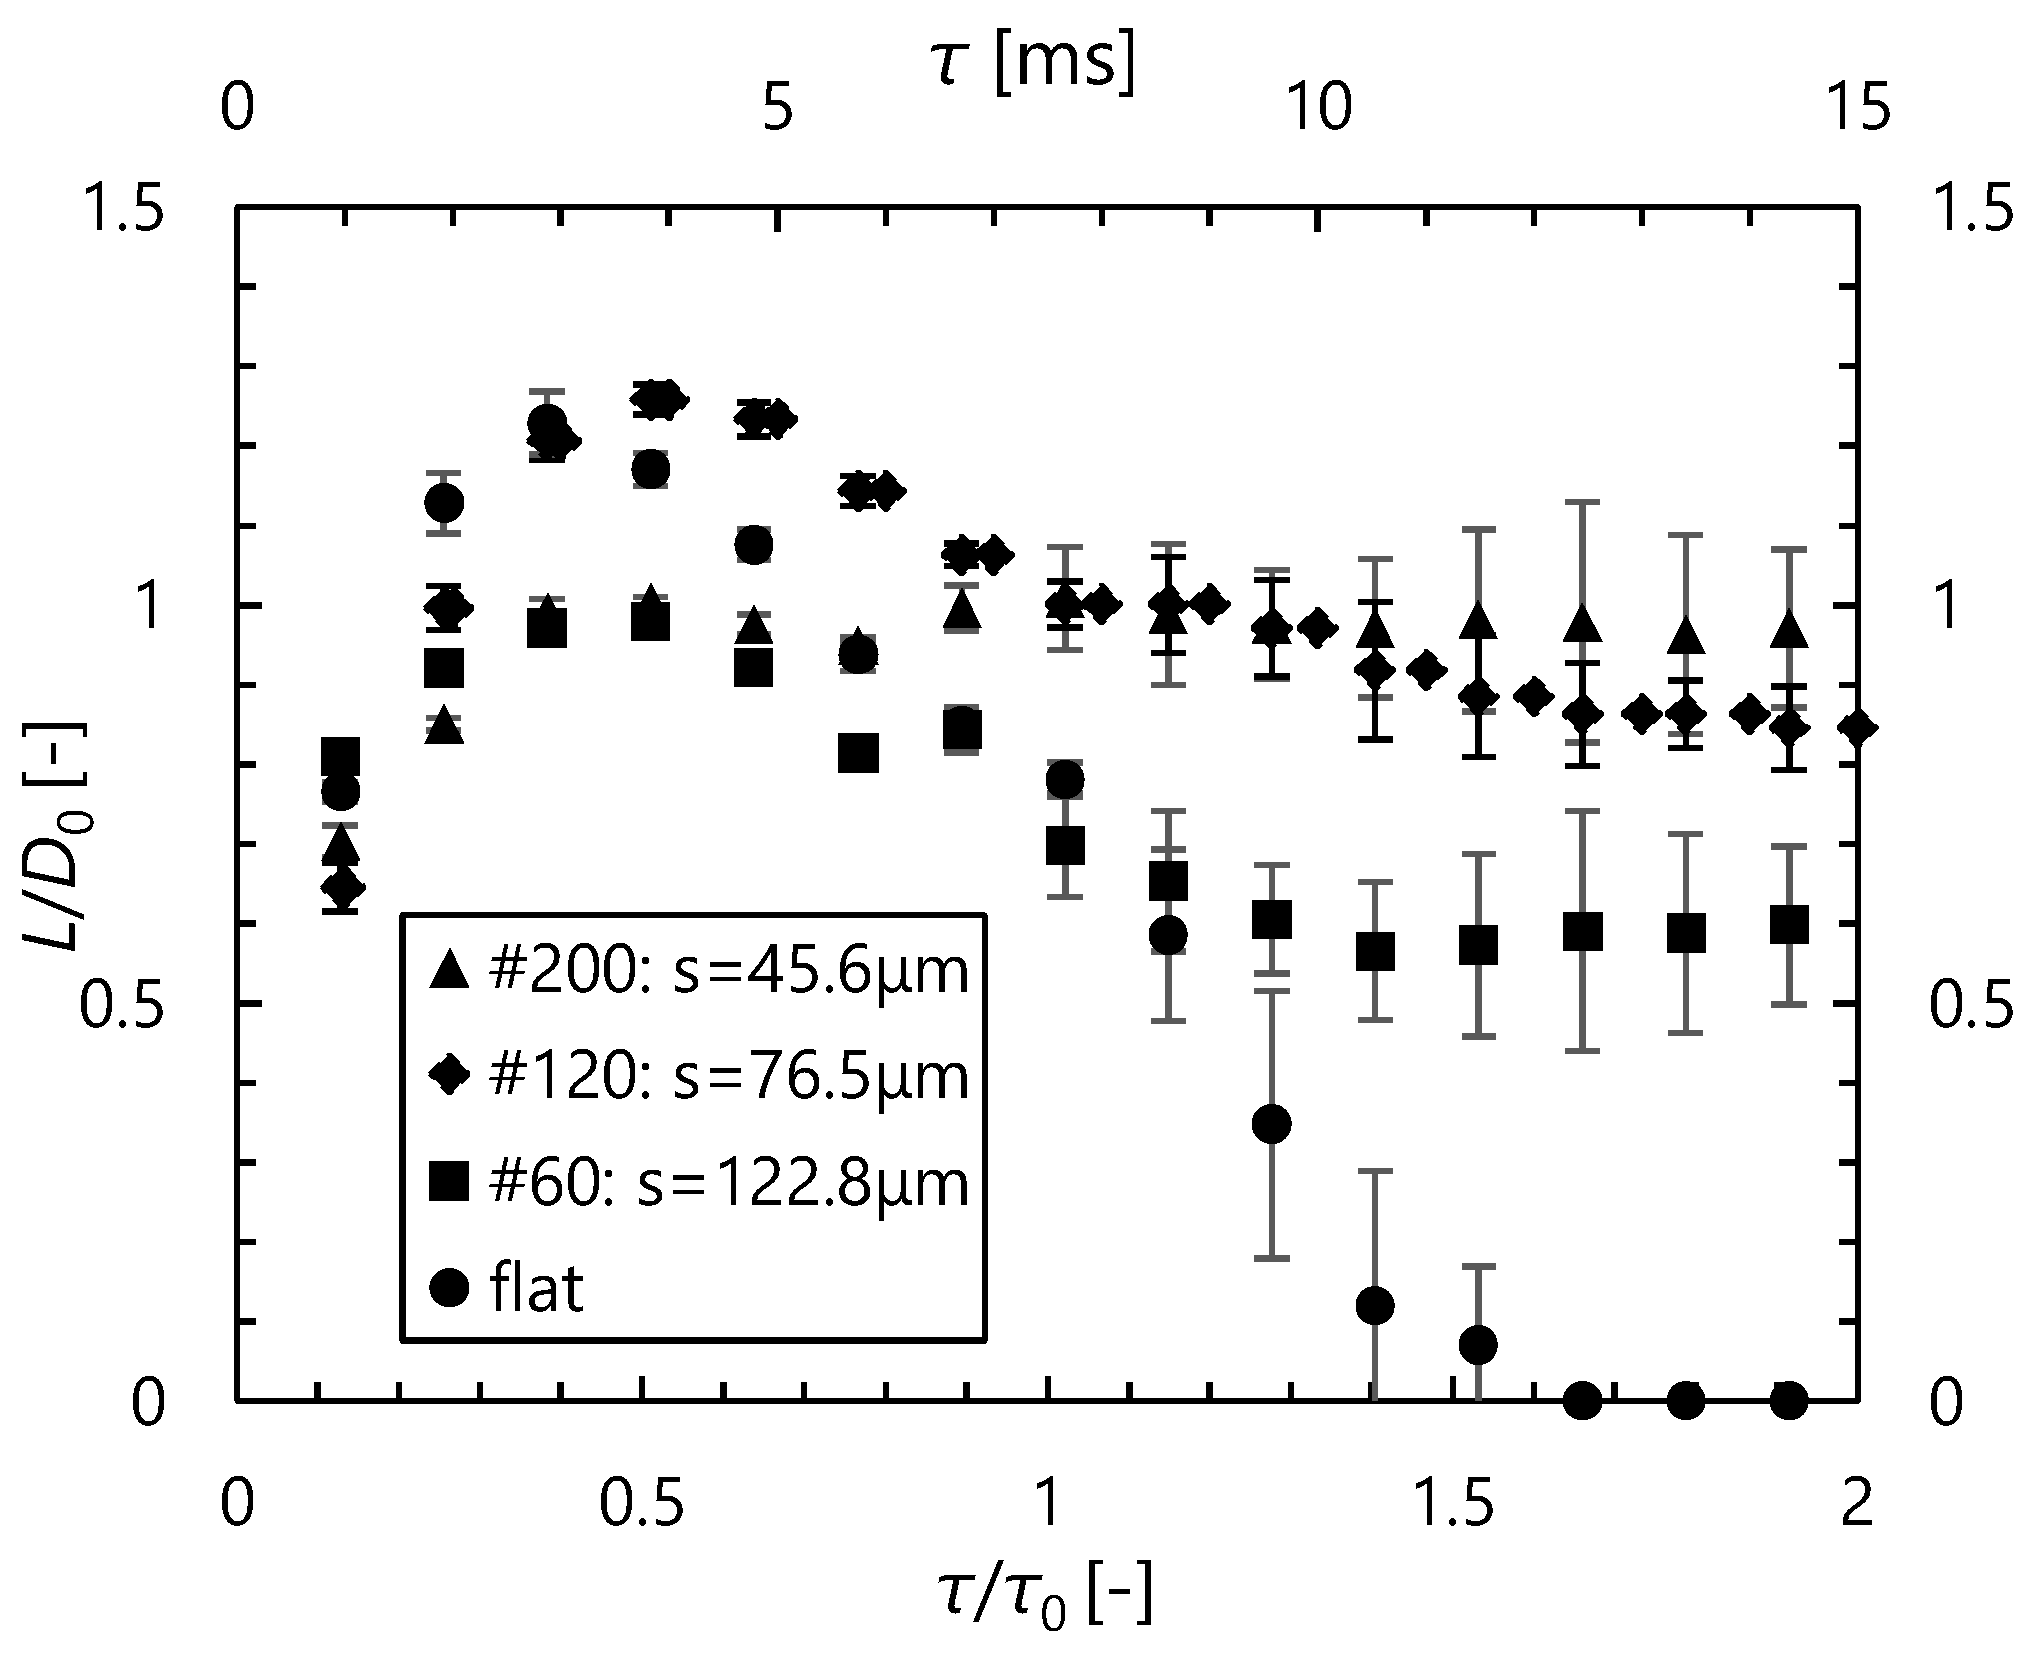
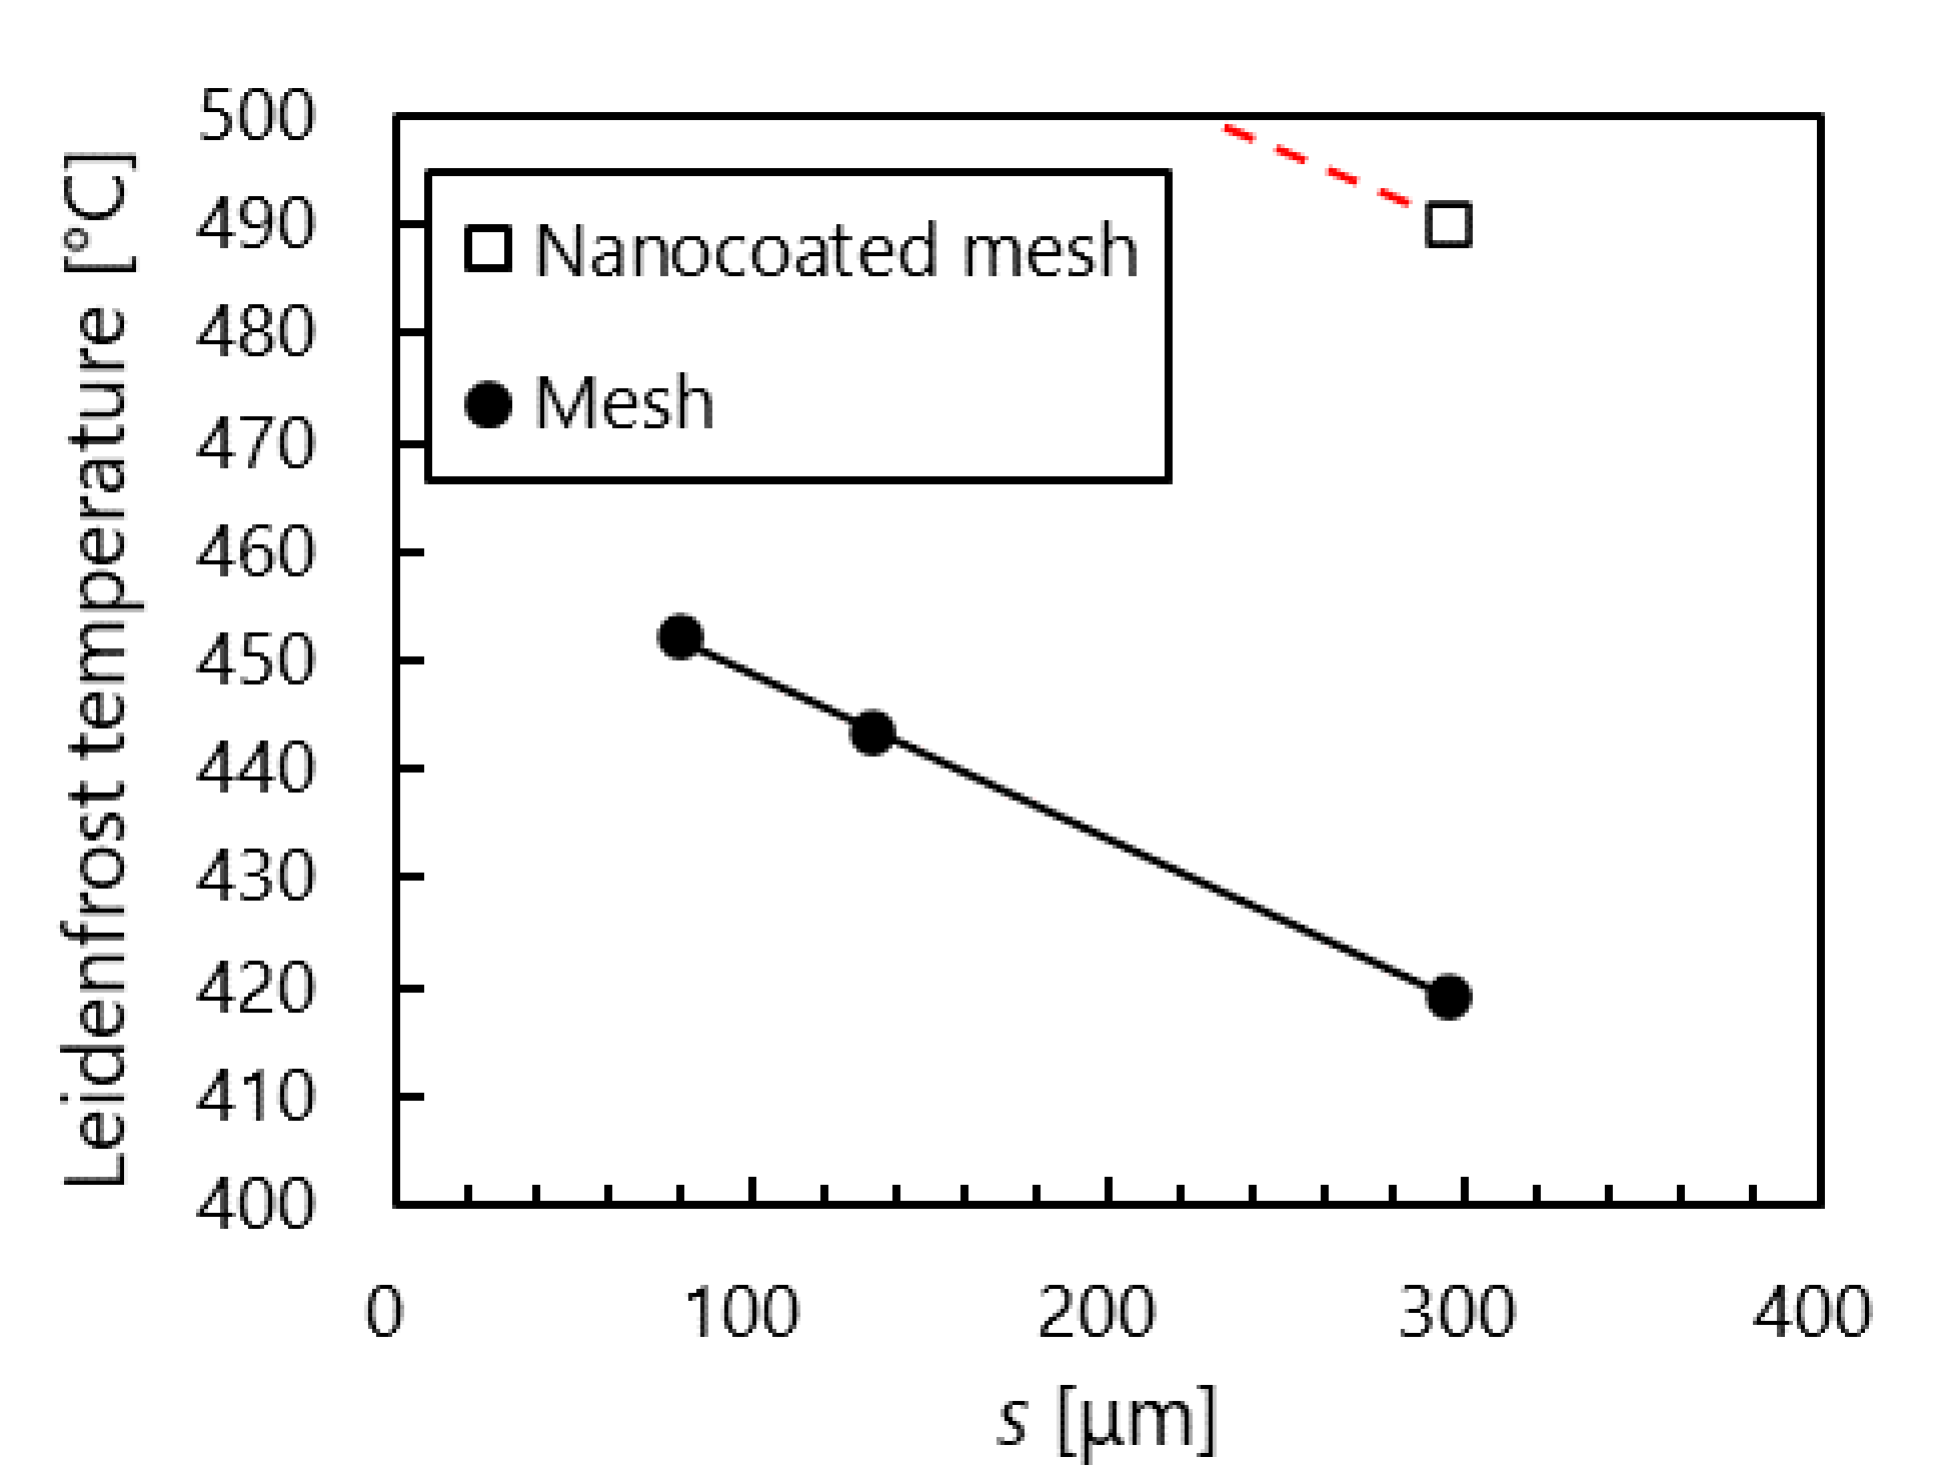
3.1.2. Mesh Surfaces

Figure 6 shows the evaporation time of the droplet on the mesh surfaces. The LFP was seen to be enhanced to 419 °C, 443 °C, and 452 °C on the #60, #120, and #200 mesh surfaces, respectively. In addition, the LFP was negatively correlated with the wire spacing s.

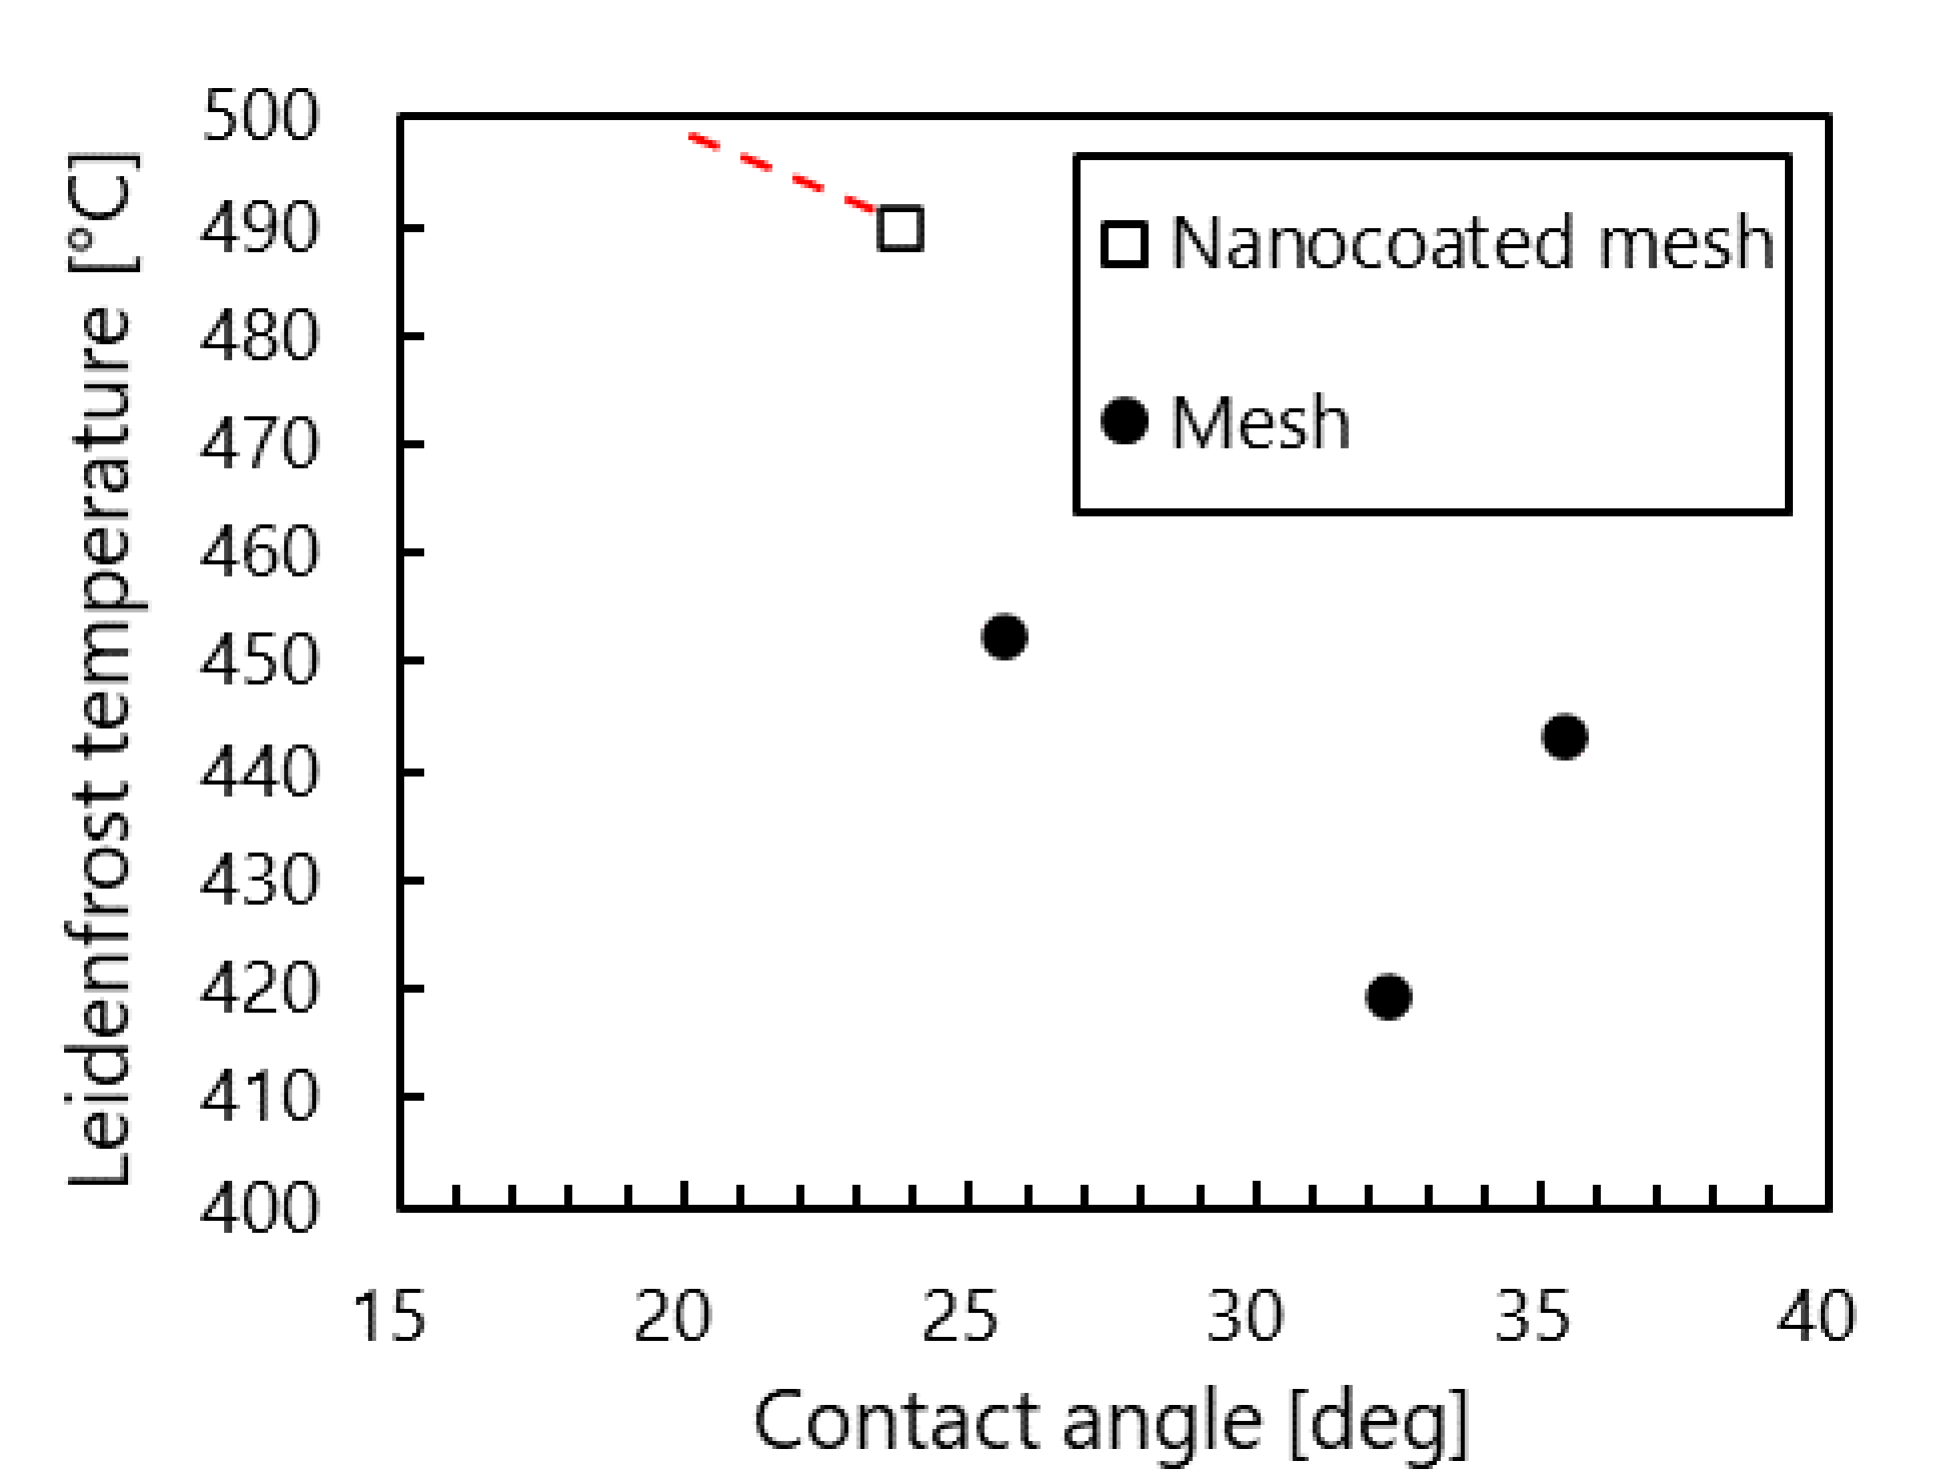
3.1.3. Nanocoated Mesh Surface

Figure 7 shows the droplet evaporation time on the nanocoated mesh surfaces. The nanocoated meshes showed no clear maximum evaporation time even when the temperature was increased to the limit of the experimental equipment (490 °C), indicating that the LFP on nanocoated meshes is higher than 490 °C.

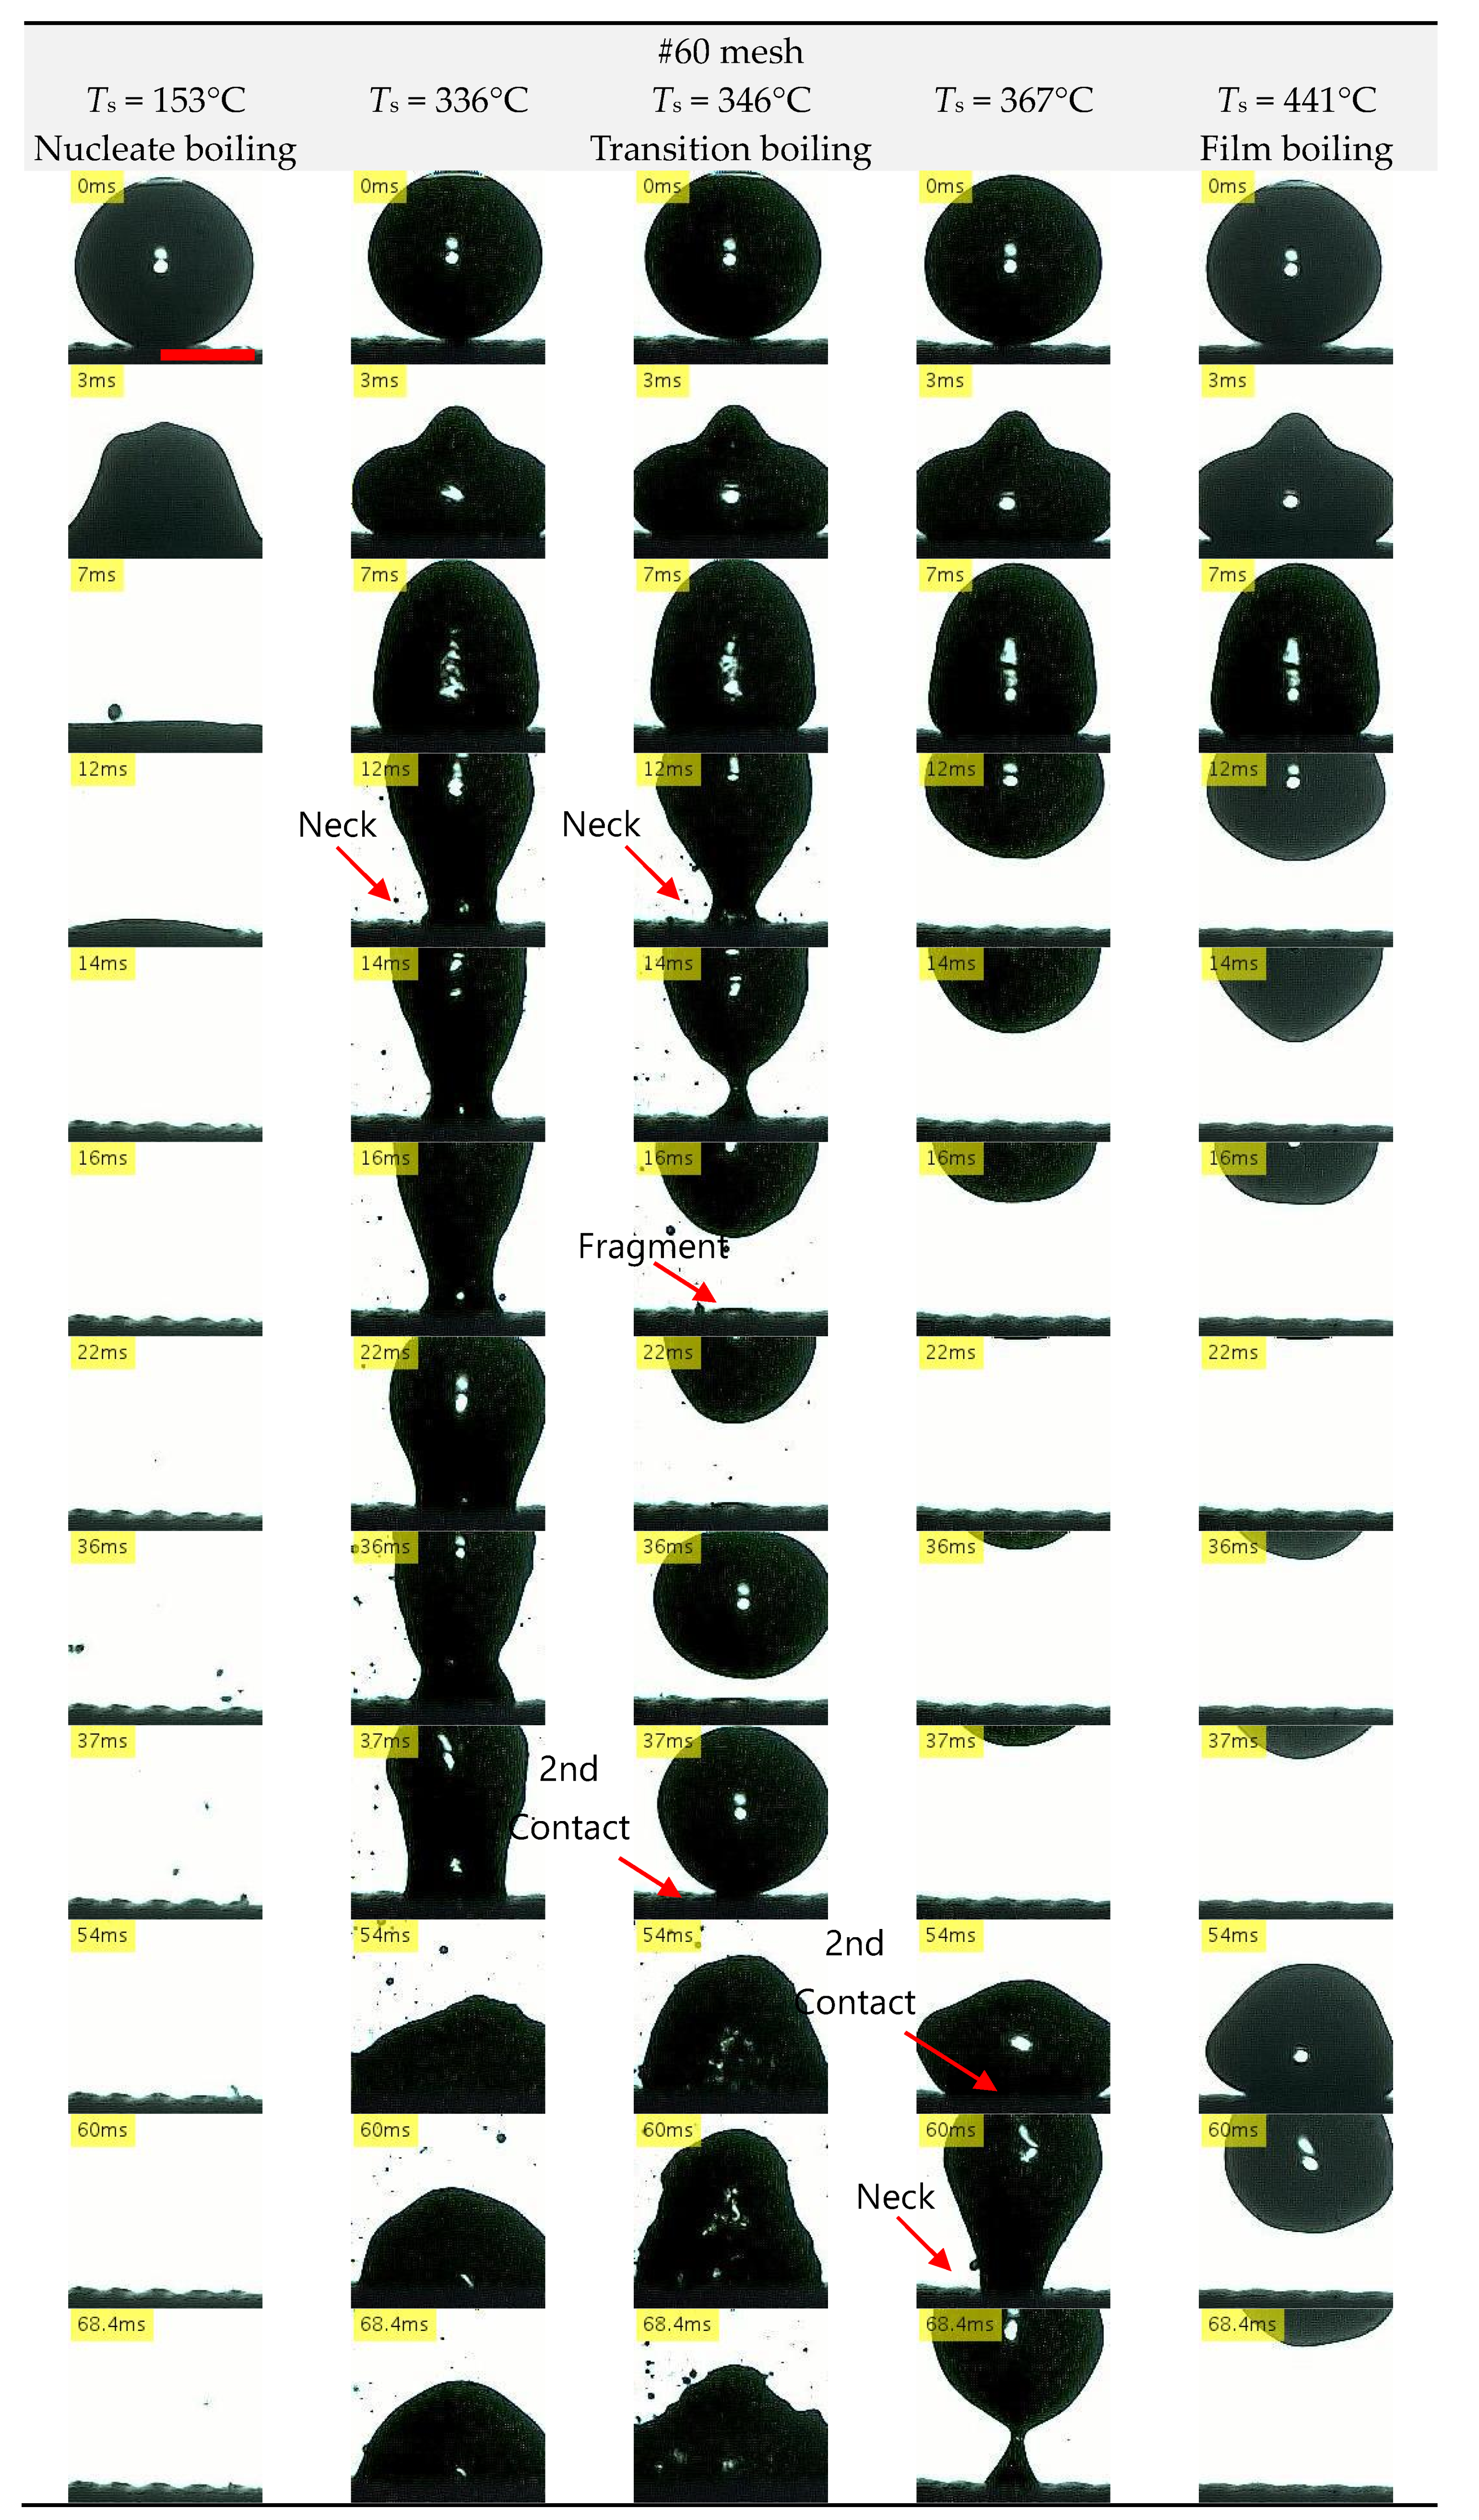
3.2. Droplet Impact Behavior

As mentioned above, the LFP on mesh surfaces and nanocoated surfaces is higher than that on stainless surfaces. Therefore, we captured the droplet impact behavior with a high-speed camera and examined the LFP enhancement mechanism. The time elapsed from the moment the droplet contacts the surface is defined as t.

3.2.1. Stainless Surface/Nanocoated Stainless Surface
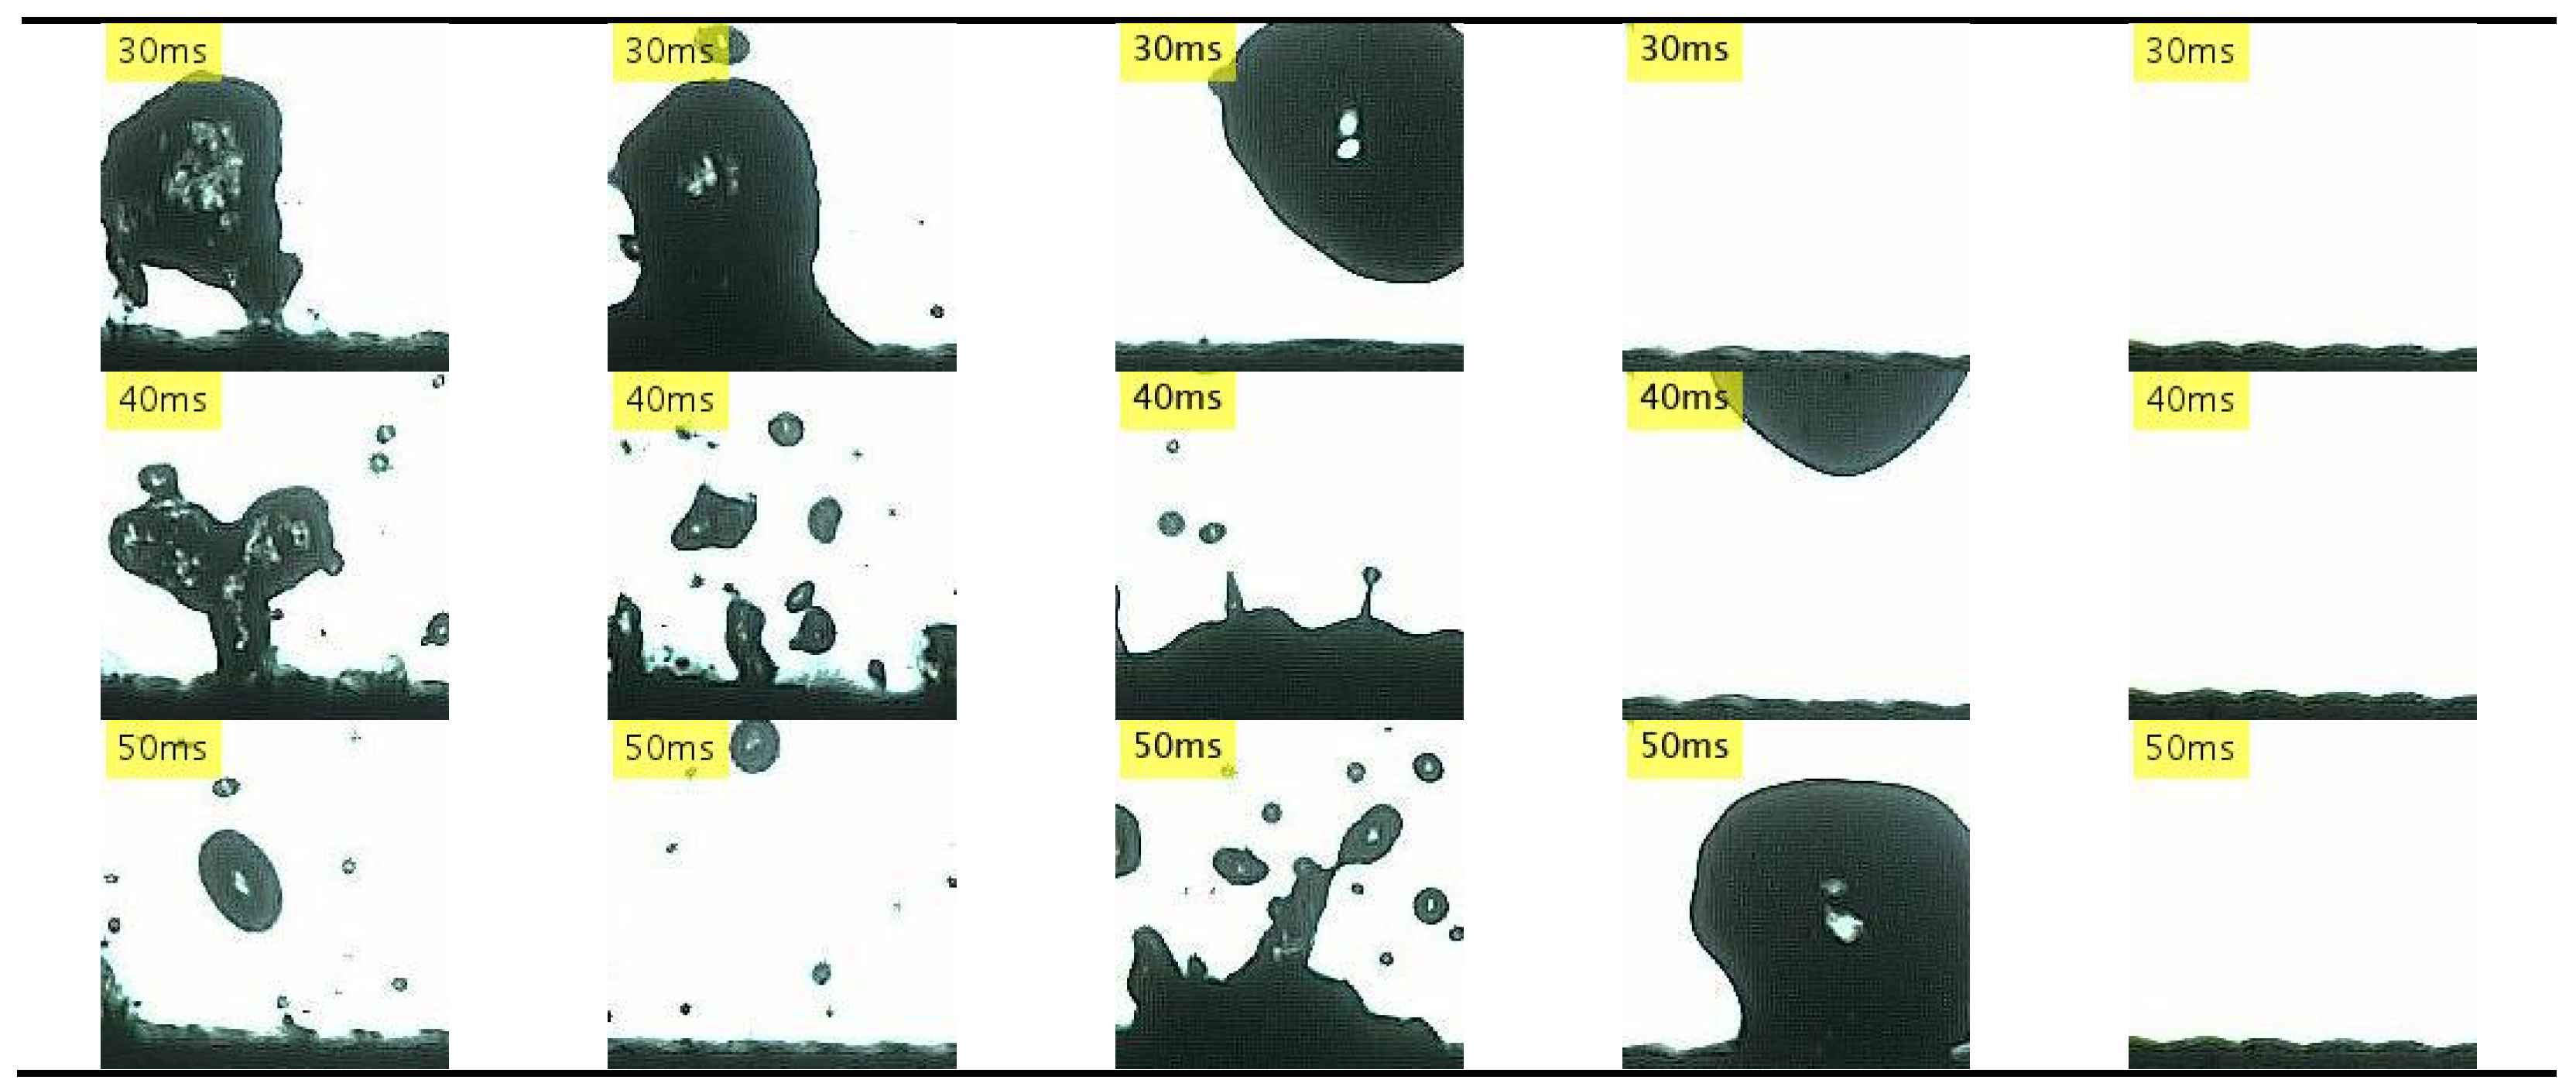
Figure 8 shows the droplet impact behavior on the stainless steel surface. Generally, the impact behavior can be classified into nucleate boiling, transition boiling, and film boiling. In nucleate boiling (Ts = 151 °C), the droplet spreads on the solid surface and evaporates. Upon further increasing the temperature to the transition boiling temperature (Ts = 249 °C, 284 °C), the droplet evaporates while producing secondary droplets (t = 0–21 ms) but also gradually losing solid–liquid contact (t = 21–51 ms) and bouncing on the surface (t = 99 ms). Finally, as the temperature is increased even further to the film boiling temperature (Ts = 336 °C, 443 °C), the droplet bounces without forming secondary droplets (t = 0–21 ms), and the solid–liquid contact is completely lost.

3.2.2. Mesh Surface

For mesh surfaces, we used the same classification of impact behavior as that for stainless steel surfaces—nucleate boiling, transition boiling, and film boiling. The droplet behavior in nucleate boiling and film boiling was the same as that on the stainless steel surfaces. However, in transition boiling, the mesh pulled the droplet and prevented it from bouncing. Therefore, we investigated the droplet behavior during transition boiling and determined the relationship between the mesh shape and the contact area.
Figure 9 shows the drop impact on the #60 mesh surface. In transition boiling, a neck-like connecting part is formed between the droplet and the mesh (Ts = 336 °C, t = 12 ms). Because this neck pulls the droplet into the mesh and prevents it from bouncing (t = 14–37 ms), the droplet evaporates steadily (t = 54 ms). When the surface temperature is increased, the neck of the droplet is cut off and the droplet bounces to the air (Ts = 346 °C, t = 12–16 ms). When this happens, a fragment of the droplet remains on the mesh (t = 16 ms), and when the bounced droplet hits the surface again (t = 37 ms), the droplet restores the solid–liquid contact with the mesh and evaporates.
When the surface temperature is increased further, the neck is not formed with the first impact (Ts = 367 °C, t = 7–12 ms) but is formed with the second impact (t = 54–60 ms), and a fragment remains on the mesh (t = 69 ms). Then, the solid–liquid contact is restored with the third impact (t = 73–75 ms). These findings indicate that the formation of a neck prevents the droplet from bouncing on the mesh surfaces. Similar behaviors were observed with #120 and #200 mesh surfaces. With #120, a neck was formed at Ts = 370 °C and t = 9 ms, and a fragment was formed at t = 10.3 ms. With #200, a neck was formed at Ts = 405 °C and t = 10 ms, and a fragment was formed at t = 11 ms.
Figure 10 shows the relationship between the mesh shape and the contact area in terms of the dimensionless contact length L/D0. We measured the contact length L between the droplet and the mesh every millisecond. Figure 10 indicates that L/D0 tends to increase as the wire spacing increases.
The abovementioned results indicate that the LFP is enhanced to 419–452 °C on mesh surfaces, the formation of a neck prevents the droplet from bouncing, and the solid–liquid contact area increases as the wire spacing increases. The effect of the wire spacing s on the LFP is shown in Figure 11. The dotted line represents the value estimated from Figure 7. From Figure 11, it can be seen that there is a negative correlation between the wire spacing s and LFP, and that the LFP increases as the wire spacing s decreases. According to the Young–Laplace equation (capillary force Δ P cap   =   4 σ / s ), the capillary force increases as s decreases, and because a stronger capillary force facilitates the solid–liquid contact between the droplet and the mesh, we believe that it prevents the bouncing of the droplet at even higher surface temperatures and thereby enhances the LFP. In addition, the solid–liquid contact area increased with the wire spacing; this matches the trend between the wire spacing and the LFP. This effect largely depends on the wire spacing and is considered to be independent of the shape between the wires. Therefore, we speculate that the pores on the mesh surface produced capillarity, thereby impeding the transition to film boiling and ultimately enhancing the LFP.

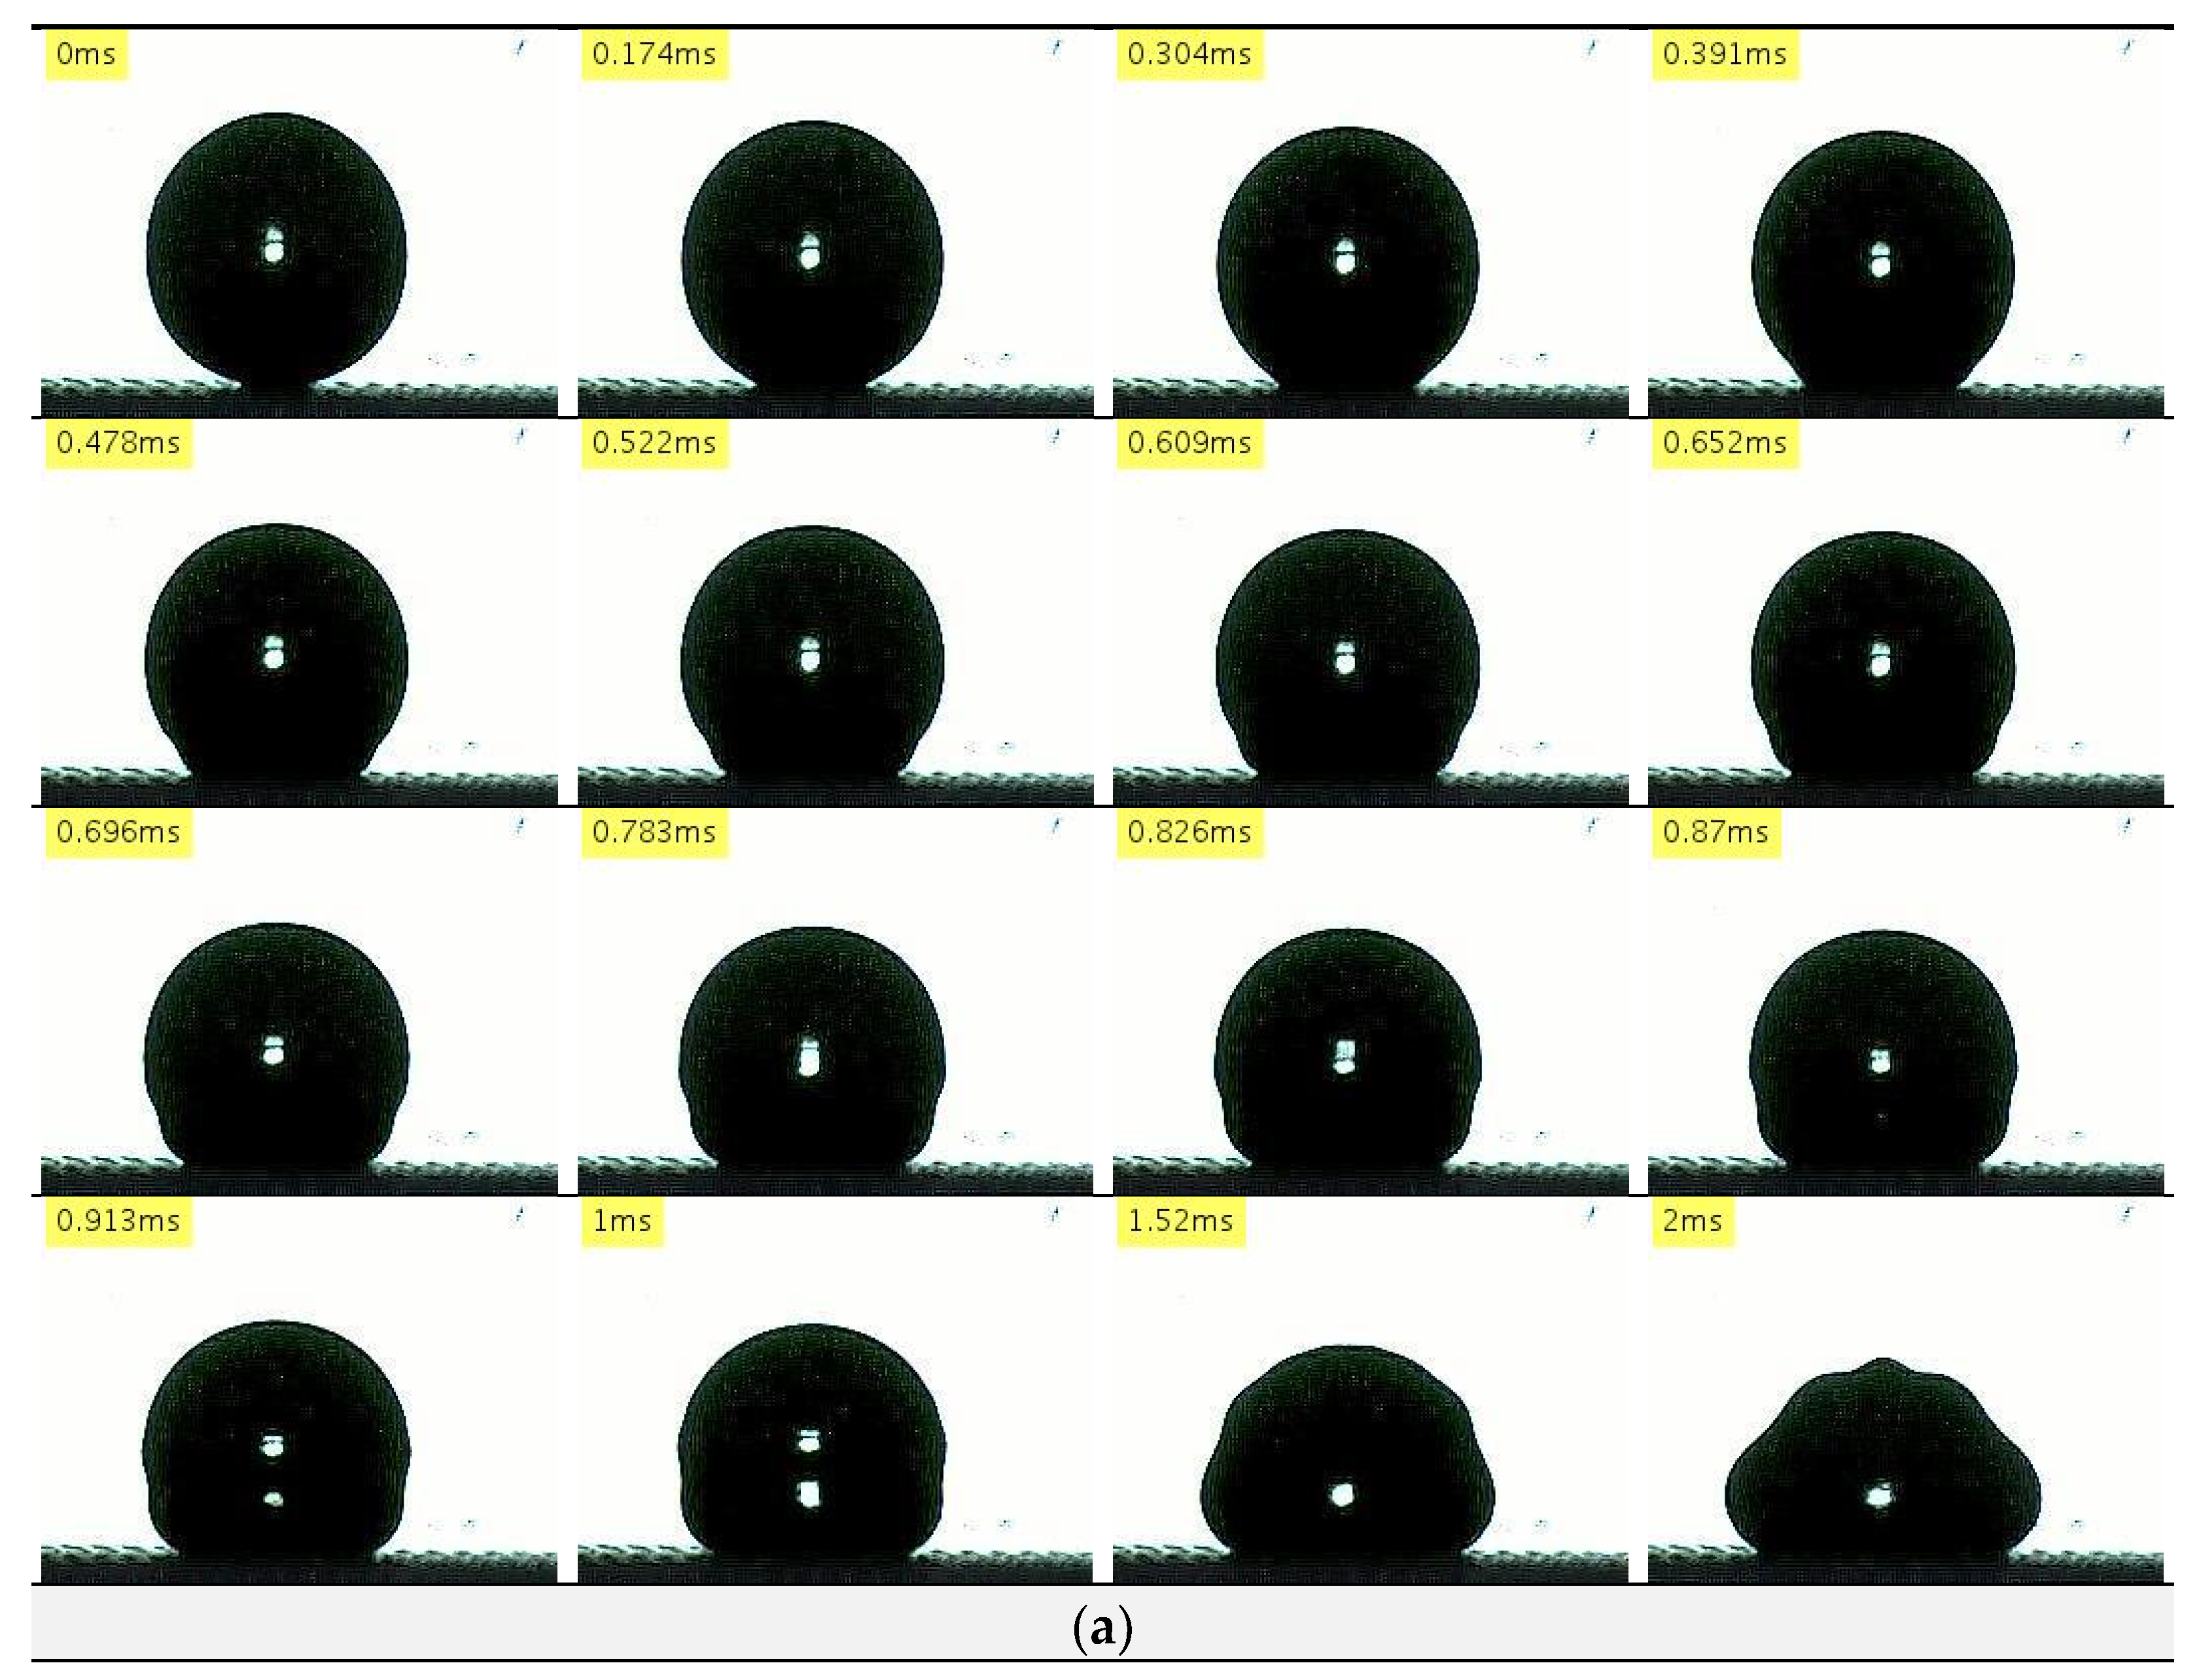
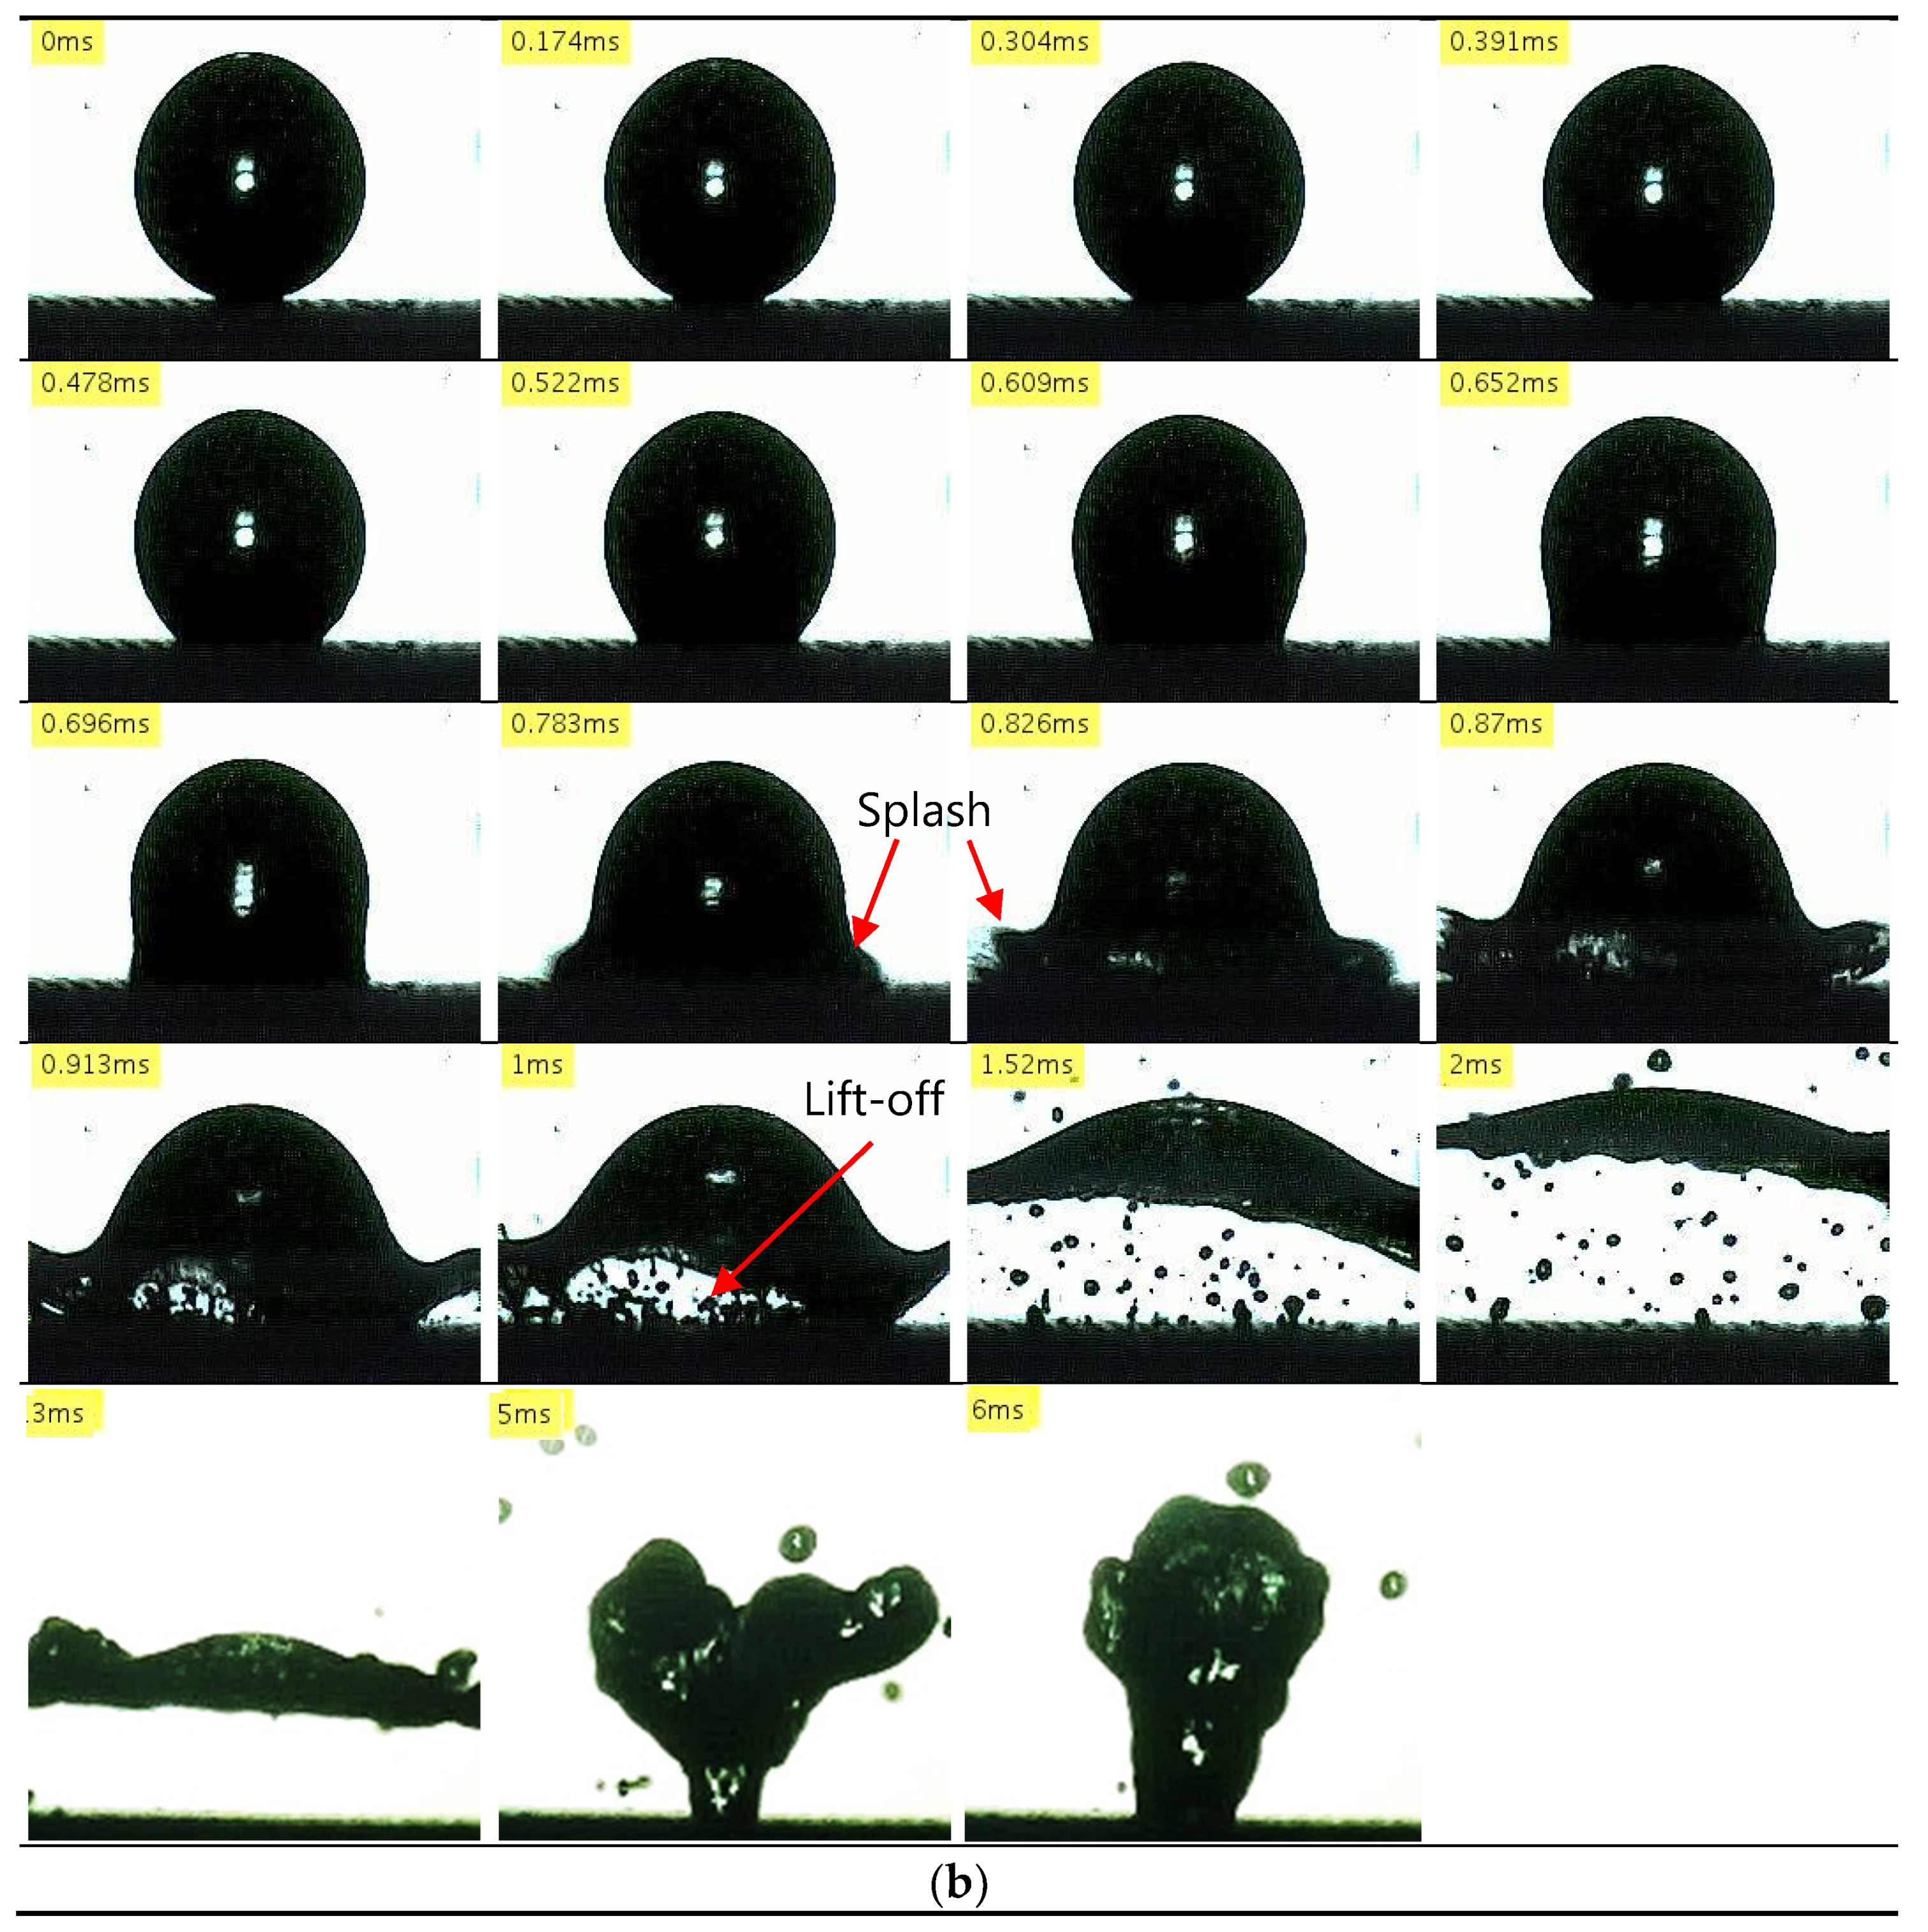
3.2.3. Nanocoated Mesh Surfaces

On nanocoated mesh surfaces, the bottom of the droplet was seen to “explode,” and the droplet bounced at a temperature lower than the LFP (i.e., it had an explosive-like behavior). This behavior occurred from 209 °C on nano-#60, from 242 °C on nano-#120, and from 198 °C on nano-#200. We defined the region where the explosive-like behavior occurred as transition boiling. This section describes the droplet behavior during transition boiling.
Figure 12 shows the drop impact on the nano-#60 mesh surface. As mentioned above, in transition boiling, the bottom of the droplet explodes (Ts = 250 °C, t = 2–2.5 ms) and the droplet bounces up while taking a disk shape (t = 2.5–4 ms). Then, the droplet contacts the mesh again (t = 7 ms) and evaporates while maintaining the solid–liquid contact. The same behavior was observed on nano-#120 and nano-#200 mesh surfaces; the droplet exploded, bounced, and deformed into a disk shape at t = 1–4 ms.
For performing more detailed observations, we filmed the droplet at the highest frame rate (23,000 fps) achievable using the experimental system (Figure 13). The images show that the droplet bounces through a two-stage process. In the first stage of the explosive-like behavior, the contact area increases rapidly between t = 0.522 and 0.696 ms. In the second stage, a splash occurs from the outer edge of the droplet at t = 0.783 ms. Immediately after this splash occurs (t = 0.826 ms), the droplet starts to bounce, and the explosive-like behavior finishes in less than approximately 1 ms after the impact.
The experimental results indicate that the LFP on nanocoated mesh surfaces is enhanced up to the equipment limit (490 °C); this value is higher than those achieved in previous studies [9,11,16]. In addition, an explosive-like behavior was observed immediately after the droplet hit the surface. In this explosive-like behavior, after a splash occurs from the bottom of the droplet, the droplet bounces and deforms into a disk shape. Thus, we investigated the causes of the explosive-like behavior and the LFP enhancement mechanism in consideration of the findings of previous studies.
With regard to the causes of the explosive-like behavior, Kim et al. [8] found that when nanostructures form steam bubbles as cavities, the droplets evaporate violently. When this happens, the quickly formed vapor pushes the droplet into the air with a force approximately four times larger than the gravitational force acting on the droplet [28]. We believe that, in this study, the explosive-like behavior occurred through the same mechanism.
With regard to why the LFP was enhanced despite the above-described bouncing behavior, Figure 13b shows that after the droplet bounces, it hits the surface again (t = 5 ms). When it does so, it maintains solid–liquid contact without (t = 6 ms) bouncing up. We believe that because of this behavior, the LFP is enhanced without an increase in the evaporation time even at higher surface temperatures. However, we could not conclusively determine why the droplet does not bounce when it hits the surface again. We formulate two hypotheses for the same, as described below, and aim to investigate them in a future study.
The first hypothesis is that the surface temperature reduces. When the first impact occurs, the surface may be cooled off to a temperature at which the explosive-like behavior does not occur. To investigate this hypothesis, the surface temperature must be measured at a high speed (t < 1 ms). However, because the data logger used in this study has a minimum sampling period of t = 100 ms, high-speed measurements cannot be performed. Therefore, this hypothesis could not be investigated.
The second hypothesis is that the droplet interface is disturbed. According to Kim et al. [8], the steam bubbles produced by nanocavities are produced faster than the critical speed that causes the Kelvin–Helmholtz instability, thus disturbing the droplet interface. Therefore, the disturbed droplet interface may cause intermittent solid–liquid contact [29], thus preventing the droplet from bouncing when it hits the surface again.
The relationship between the apparent contact angle (t = 30 s) measured in Figure 3 and the LFP is shown in Figure 14. From Figure 14, it can be seen that the LFP tends to increase as the apparent contact angle decreases. Comparing the mesh and nanocoated mesh with similar apparent contact angles, the LFP of the nanocoated mesh increased significantly. It is considered that this is because the contact angle of the flat and nanoflat surfaces are significantly different. That is, because the contact angle of the nanoflat surface is extremely small, the capillary force generated in the gap between the wires is increased; hence, the bounce of the droplet is suppressed and the LFP is increased.
We were able to improve the LFP at a very low cost using the nanocoated mesh surfaces. However, a major limitation of this study is that we did not measure the amount of improvement. Therefore, in the future, it will be necessary to improve the equipment and measure the LFP temperature quantitatively when using the nanocoated mesh surface. In addition, to further improve the LFP, it is necessary to enhance hydrophilicity further as well as to clarify why the droplet does not bounce when it hits the surface again, as described above.

4. Conclusions

This study aimed to enhance the LFP using a micro/nanostructure that can be easily fabricated at a low cost. It also aimed to clarify the LFP enhancement mechanism by observing the droplet impact behavior on a heated surface. The findings of this study are summarized as follows:
  • SEM observations confirmed that nanocoated mesh surfaces have a micro/nanostructure that combines fine pores of micrometer order and roughness of nanometer order.
  • Compared with stainless steel surfaces, the LFP on mesh surfaces was enhanced by 107 °C to 140 °C. Further, the LFP on mesh surfaces was negatively correlated with wire spacing. In addition, we captured images of a droplet hitting a mesh surface, which had not been done in previous studies. These images showed that the contact area between the mesh and the droplet decreased with the wire spacing. These findings suggest that the fine pores on the mesh surface produced capillarity that impeded the transition to film boiling and enhanced the LFP.
  • With nanocoated mesh surfaces, a maximum evaporation time was not observed even when the temperature was increased to the limit of the experimental system. This resulted in an LFP of least 490 °C, which is higher than those achieved in previous studies. In addition, sequential images of the drop impact revealed that after a splash occurs at the bottom of the droplet, it deforms into a disk shape and bounces. This so-called explosive-like behavior occurred in a very short interval after the impact (t < 1 ms). Previous studies attributed this explosive-like behavior to steam bubbles produced by nanostructures.

Author Contributions

S.O. and R.N. designed the experimental system and wrote the manuscript. S.O. reviewed the manuscript. R.N. carried out the experiments. All authors have read and agreed to the published version of the manuscript.

Funding

This research was funded by JSPS KAKENHI, grant numbers JP15K05801.

Institutional Review Board Statement

“Not applicable” for studies not involving humans or animals.

Informed Consent Statement

“Not applicable” for studies not involving humans.

Data Availability Statement

The data presented in this review are available from the corresponding author upon reasonable request.

Acknowledgments

We thank Kishimoto from the Trade Service Corporation for providing us with the hydrophilic coating agent and Nobuyuki Moronuki of this university for his valuable advice on the fabrication process of test walls.

Conflicts of Interest

The authors declare no conflict of interest.

References

  1. Kim, J. Spray cooling heat transfer: The state of the art. Int. J. Heat Fluid Flow 2007, 28, 753–767. [Google Scholar] [CrossRef]
  2. Murav’ev, V.P. Emergency cooling of nuclear power plant reactors with heat removal by a forced-draft cooling tower. Power Technol. Eng. 2016, 50, 176–179. [Google Scholar] [CrossRef]
  3. Yeh, H.C. An analysis of rewetting of a nuclear fuel rod in water reactor emergency core cooling. Nucl. Eng. Des. 1975, 34, 317–322. [Google Scholar] [CrossRef]
  4. Hall, D.D.; Mudawar, I.; Morgan, R.E.; Ehlers, S.L. Validation of a systematic approach to modeling spray quenching of aluminum alloy extrusions, composites, and continuous castings. J. Mater. Eng. Perform. 1997, 6, 77–92. [Google Scholar] [CrossRef]
  5. Liang, G.; Mudawar, I. Review of spray cooling—Part 2: High temperature boiling regimes and quenching applications. Int. J. Heat Mass Transf. 2017, 115, 1206–1222. [Google Scholar] [CrossRef]
  6. Kandlikar, S.G.; Bapat, A.V. Evaluation of jet impingement, spray and microchannel chip cooling options for high heat flux removal. Heat Transf. Eng. 2007, 28, 911–923. [Google Scholar] [CrossRef]
  7. Bernardin, J.D.; Mudawar, I. The Leidenfrost point: Experimental study and assessment of existing models. J. Heat Transf. 1999, 121, 894. [Google Scholar] [CrossRef]
  8. Kim, H.; Truong, B.; Buongiorno, J.; Hu, L.W. On the effect of surface roughness height, wettability, and nanoporosity on Leidenfrost phenomena. Appl. Phys. Lett. 2011, 98, 2011–2014. [Google Scholar] [CrossRef]
  9. Kwon, H.M.; Bird, J.C.; Varanasi, K.K. Increasing Leidenfrost point using micro-nano hierarchical surface structures. Appl. Phys. Lett. 2013, 103. [Google Scholar] [CrossRef] [Green Version]
  10. Feng, R.T.; Wu, X.D.; Xue, Q.J. Profile characterization and temperature dependence of droplet control on textured surfaces. Chin. Sci. Bull. 2011, 56, 1930–1934. [Google Scholar] [CrossRef] [Green Version]
  11. Geraldi, N.R.; McHale, G.; Xu, B.B.; Wells, G.G.; Dodd, L.E.; Wood, D.; Newton, M.I. Leidenfrost transition temperature for stainless steel meshes. Mater. Lett. 2016, 176, 205–208. [Google Scholar] [CrossRef] [Green Version]
  12. Park, I.W.; Fernandino, M.; Dorao, C.A. Effect of micropillar characteristics on Leidenfrost. ASME. Int. Conf. Nanochannels Microchannels Minichannels 2016, 1–8. [Google Scholar] [CrossRef]
  13. Tran, T.; Staat, H.J.J.; Susarrey-Arce, A.; Foertsch, T.C.; van Houselt, A.; Gardeniers, H.J.G.E.; Prosperetti, A.; Lohse, D.; Sun, C. Droplet impact on superheated microstructured surfaces. Soft Matter 2013, 9, 3272. [Google Scholar] [CrossRef]
  14. Takata, Y.; Hidaka, S.; Cao, J.M.; Nakamura, T.; Yamamoto, H.; Masuda, M.; Ito, T. Effect of surface wettability on boiling and evaporation. Energy 2005, 30, 209–220. [Google Scholar] [CrossRef]
  15. Nair, H.; Staat, H.J.; Tran, T.; van Houselt, A.; Prosperetti, A.; Lohse, D.; Sun, C. The Leidenfrost temperature increase for impacting droplets on carbon-nanofiber surfaces. Soft Matter 2014, 10, 2102–2109. [Google Scholar] [CrossRef] [PubMed] [Green Version]
  16. Kim, S.H.; Ahn, H.S.; Kim, J.; Kaviany, M.; Kim, M.H. Dynamics of water droplet on a heated nanotubes surface. Appl. Phys. Lett. 2013, 102. [Google Scholar] [CrossRef] [Green Version]
  17. Tong, W.; Qiu, L.; Jin, J.; Sun, L.; Duan, F. Unique lift-off of droplet impact on high temperature nanotube surfaces. Appl. Phys. Lett. 2017, 111. [Google Scholar] [CrossRef]
  18. Liu, L.; Cai, G.; Tsai, P.A. Drop impact on heated nanostructures. Langmuir 2020, 36, 10051. [Google Scholar] [CrossRef]
  19. Young, T. An essay on the cohesion of fluids. Philos. Trans. R. Soc. Lond. 1805, 95, 65–87. [Google Scholar]
  20. Wenzel, R.N. Resistance of solid surfaces to wetting by water. Ind. Eng. Chem. 1936, 28, 988–994. [Google Scholar] [CrossRef]
  21. Cassie, B.A.D.; Baxter, S. Wettability of porous surfaces. Trans. Faraday Soc. 1944, 40, 546–551. [Google Scholar] [CrossRef]
  22. Davarpanah, A. A feasible visual investigation for associative foam >\ polymer injectivity performances in the oil recovery enhancement. Eur. Polym. J. 2018, 105, 405–411. [Google Scholar] [CrossRef]
  23. Esfandyari, H.; Hoseini, A.H.; Shadizadeh, S.R.; Davarpanah, A. Simultaneous evaluation of capillary pressure and wettability alteration based on the USBM and imbibition tests on carbonate minerals. J. Petrol. Sci. Eng. 2020, 108285. [Google Scholar] [CrossRef]
  24. Pan, F.; Zhang, Z.; Zhang, X.; Davarpanah, A. Impact of anionic and cationic surfactants interfacial tension on the oil recovery enhancement. Powder Technol. 2020, 373, 93–98. [Google Scholar] [CrossRef]
  25. Esfandyari, H.; Shadizadeh, S.R.; Esmaeilzadeh, F.; Davarpanah, A. Implications of anionic and natural surfactants to measure wettability alteration in EOR. Fuel 2020, 278, 118392. [Google Scholar] [CrossRef]
  26. Farokhnia, N.; Sajadi, S.M.; Irajizad, P.; Ghasemi, H. Decoupled hierarchical structures for suppression of Leidenfrost phenomenon. Langmuir 2017, 33, 2541–2550. [Google Scholar] [CrossRef]
  27. Hassebrook, A.; Kruse, C.; Wilson, C.; Anderson, T.; Zuhlke, C.; Alexander, D.; Gogos, G.; Ndao, S. Effects of droplet diameter on the Leidenfrost temperature of laser processed multiscale structured surfaces. Thermomech. Phenom. Electron. Syst. Proc. Intersoc. Conf. 2014, 452–457. [Google Scholar] [CrossRef] [Green Version]
  28. Kim, S.H.; Ahn, H.S.; Kim, J.; Kim, M.H. Dynamics of a Water Droplet on the Heated Surface of Nano- and Microstructures. In Proceedings of the ASME 2012 10th International Conference on Nanochannels, Microchannels, and Minichannels Collo-cated with the ASME 2012 Heat Transfer Summer Conference and the ASME 2012 Fluids Engineering Division Summer Meeting, Rio Grande, Puerto Rico, USA, 8–12 July 2012; pp. 1–10. [Google Scholar]
  29. Ng, B.T.; Hung, Y.M.; Tan, M.K. Acoustically-controlled Leidenfrost droplets. J. Colloid Interface Sci. 2016, 465, 26–32. [Google Scholar] [CrossRef] [PubMed]
Figure 1. Schematic illustration of the (a) experimental setup and (b) details of the test section. Upper plate 1 is used for measuring evaporation time. Upper plate 2 is used for high-speed imaging of drop impact.
Processes 09 00350 g001
Figure 2. SEM images of test walls.
Processes 09 00350 g002
Figure 3. Contact angle as a function of elapsed time on mesh surfaces.
Processes 09 00350 g003
Figure 4. Comparison of evaporation time with those in previous studies [16,27].
Processes 09 00350 g004
Figure 5. Evaporation time as a function of surface temperature on flat and nanoflat surfaces.
Processes 09 00350 g005
Figure 6. Evaporation time as a function of surface temperature on flat and mesh surfaces.
Processes 09 00350 g006
Figure 7. Evaporation time as a function of surface temperature on flat and nanocoated mesh surfaces.
Processes 09 00350 g007
Figure 8. Sequential images of drop impact on flat surface. Scale bar is 2 mm.
Processes 09 00350 g008aProcesses 09 00350 g008b
Figure 9. Sequential images of drop impact on #60 mesh surface. Scale bar is 1 mm.
Processes 09 00350 g009aProcesses 09 00350 g009b
Figure 10. Contact length normalized by drop diameter corresponding to elapsed time normalized by period τ 0 = D 0 / U 0 . Surface temperature is Ts ≈ 335 °C.
Processes 09 00350 g010
Figure 11. Effect of wire spacing s on the Leidenfrost point (LFP).
Processes 09 00350 g011
Figure 12. Sequential images of drop impact on nano-#60 mesh surface. Scale bar is 1 mm.
Processes 09 00350 g012aProcesses 09 00350 g012b
Figure 13. Sequential images of drop impact on (a) #120 and (b) nano-#120 mesh surfaces at Ts ≈ 335 °C. Frame rate is 23,000 fps. Scale bar is 1 mm.
Processes 09 00350 g013aProcesses 09 00350 g013b
Figure 14. Relationship between contact angle and the LFP.
Processes 09 00350 g014
Table 1. Properties of mesh surfaces. d and s denote the wire diameter and wire spacing, respectively.
d [μm]s [μm] d [μm]s [μm] Processes 09 00350 i001
#60122.8 ± 0.8295.6 ± 0.8nano-#60129.4 ± 2.8293.8 ± 10.5
#12076.5 ± 2.1134.1 ± 2.8nano-#12071.1 ± 0.7132.5 ± 2.2
#20045.6 ± 1.280.2 ± 6.2nano-#20037.5 ± 2.587.2 ± 2.5
Table 2. Comparison of experimental conditions.
MaterialTest fluidD0 [mm]We [-]
Present studySUS304Water1.881.4
Hassebrook et al. [19]SUS304Water2.51.4
Kim et al. [16]ZirconiumWater2.253.27
Publisher’s Note: MDPI stays neutral with regard to jurisdictional claims in published maps and institutional affiliations.

