Article

Mechanism of the Absent Air Column in Three Products Hydrocyclone Screen (TPHS): Experiment and Simulation

1
State Key Laboratory of Mining Response and Disaster Prevention and Control in Deep Coal Mines, College of Material Science and Engineering, Anhui University of Science and Technology, Huainan 232001, Anhui, China
2
Department of Chemical Engineering, Monash University, Clayton, VIC 3800, Australia
*
Authors to whom correspondence should be addressed.
Processes 2021, 9(3), 431; https://doi.org/10.3390/pr9030431
Submission received: 29 January 2021 / Revised: 19 February 2021 / Accepted: 24 February 2021 / Published: 27 February 2021
(This article belongs to the Section Process Control and Monitoring)

Abstract

:
Three products hyrdrocyclone screen (TPHS) has been proposed for particle separation based on size. In TPHS, a cylindrical screen was embedded in a conventional hydrocyclone (CH) to combine the centrifugal classification and screening to particle separation based on size. The industrial application of TPHS indicates its better device performance than CH. Although, the earlier studies reveal some common understanding for TPHS, the information of the absent air column remains unknown. Hence, the combination of physical experiment and numerical simulation was considered involving a 75 mm TPHS for this knowledge gap. First, both the computational fluid dynamics (CFD) simulation with Reynolds stress mode and the physical experiment with a high-definition camera illustrate the development process details of a flow field in TPHS. That is, the water was imported along the tangential inlet into TPHS; then under the effects of the feed chamber wall and gravity, the liquid phase spiraled downward until the cylindrical screen passed through the sieve; as the liquid moved to the spigot, it could be discharged in time due to the small underflow port, thus the volume fraction of air rapidly reduced from 1 to 0; subsequently the water filled the TPHS and the absent air column could be observed. Furthermore, the distribution comparisons of air volume fraction and static pressure show that TPHS displayed the absent air core with the negative static pressure in the center region along the z-axis, while CH displayed the opposite features. In addition, despite the different inlet velocity, TPHS consistently presented the vanished air column which could be ascribed to the fact that the present cylindrical screen resulted in positive static pressure distribution inside TPHS.

1. Introduction

Cyclones are generally known as essential particle separation devices in the centrifugal force field [1]. The conventional hydrocyclone (CH) is usually composed by one tangential inlet steam (viz. feed) and two axial outlet steams (i.e., underflow and overflow) [2]. Due to the simple structure, high capacity and low operation cost [3], cyclone separation, like flotation [4] and magnetic separation [5], plays an important role in mineral processing. Thus, structure optimizations based on the CH have been considered to improve the device performance, and some achievements have been made. For instance, a JK (the abbreviation of Julius Kruttschnitt Mineral Research Centre) three-product cyclone is characterized by a second vortex finer to produce a second overflow in which the fine dense liberated particles can be selectively concentrated for further treatment [6]; or using a filtering cyclone by incorporating a permeable cone into a cyclone with a conventional structure [7].
Given this demand for a cyclone, the three products hydrocyclone screen (TPHS) as a derivative of cyclones has been proposed by our group for particle classification [8]. In general, the innovative cyclone, shown in Figure 1, can be considered as a cylindrical screen embedded in the CH [9]. The working principle of TPHS can be understood as the compound of centrifugal classification and screening. TPHS prevents the similar operation to CH, yet the new device generates an additional product stream named screen underflow besides overflow and underflow owing to the adding screen. The influencing parameters on particle classification based on grey system theory exposes the highest correlation degree between the aperture size and the TPHS performance [10]. Furthermore, TPHS generates three separation procedures including cylinder stratification, cylinder classification and cone classification, which are conducted for particle separation depending on size. Thus, the fine particles entrapped by coarse particles [11,12] or entrained by water [13] in the underflow have apparently been reduced, which results in the entire elimination of the fish-hook effect [9]. Both pilot and industrial experiments revealed the more reasonable cut size, lower imperfection and higher classification efficiency of TPHS than those of CH, which demonstrates the application potential of the former [9,14].
Analogous to other innovative cyclones [7,15], since TPHS is a derivative of a hydrocyclone, the characteristics of fluid flow should have a crucial impact on the particle classification. Afterwards, the advanced technology including the particle image velocimetry (PIV) test and the computational fluid dynamics (CFD) simulation have been used to explore the fluid flow of TPHS [16]. The result illustrates the lower tangential and higher radial velocity in TPHS than that in CH. Furthermore, TPHS presents an interesting phenomenon, namely the absent air column. The previous investigations also indicate that the occurrence of an air column drastically reduces the efficiency of separation [17,18], which can be attributed to the fact that the air core could lead to more energy consumption and ineffective particle separation, and thus some efforts were considered to eliminate the air core for better device performance [19,20,21]. Since TPHS can be considered as one kind of cyclone, the absent air core should promote particle separation [16]. The prior works exhibit some general understanding for TPHS, however, the details of the eliminated air column have not been yet explored and remain unknown. This is significant for the regulation and optimization of device performance. Therefore, based on the above discussion, the goals of this new study were to explore the mechanism of the absent air column for the aforesaid knowledge gap. To achieve this aim, the combination of physical experiment and numerical simulation was conducted involving a label-scale TPHS (75 mm). In particular, the objectives of the present research were to:
  • comprehensively describe the development process of flow field in TPHS using the simulation and experiment methods.
  • systematically explore the mechanism of the absent air column in the innovative cyclone through the numerical comparison between TPHS and CH.

2. Methodology

2.1. Experimental Facilities

Figure 2 exhibits the schematic diagram of the experimental setup adopted in this work. The main facilities include a 0.3 m³ feed tank, a 0–12 m³/h variable frequency pump, a lab-scale TPHS (see Table 1 in Section 2.1 for details) and a cube shell surrounding the TPHS. It is worth mentioning that the cube shell was filled with water to weaken the light refraction from the cylindrical column. Both the TPHS and the cube shell were made of Plexiglas with excellent optical transparency. Moreover, a manometer and a flow-meter were conducted to measure the pressure and mass-flow of the feed stream, respectively.
The experimental procedure for the detection of the air column in TPHS can be described as follows. Firstly, the high-definition camera (type: Dantec Flow Sense EO 4M, Dantec Dynamics A/S, Copenhagen, Denmark) was placed about 0.5 m in front of the cube shell, and then the lens was focused on the TPHS (see the red dotted rectangle in Figure 2) for clear camera shooting. The camera was equipped with a Nikon 50mm f/1.8 lens for the resolution of 2048 × 2048 pixels and maximum exposure frequency of 20 Hz. Afterwards, deionized water can be flowed to the TPHS at different feed throughout. However, in this research, the feed throughout was fixed as ~4.2 m3/h (i.e., the inlet velocity of 5 m/s) to compared with the numerical simulation under the same inlet velocity. Meanwhile, the underflow, overflow and screen underflow were produced. Finally, the evolution process of the air column in TPHS can be clearly recorded by the camera.

2.2. Numerical Model

In this research, the dimension of TPHS components in the CFD simulation was consistent with that in the aforesaid experiment. Meanwhile, the comparisons of numerical simulation were carried out in the 75 mm TPHS and CH under similar conditions. The dimensional details of TPHS and CH are summarized in Table 1. In this work, the ICEM software package (version 14.5, ANSYS, Inc. Pittsburgh, PA, USA) was adopted to model the geometry. Figure 3 presents the three-dimensional grid scheme (a) side and (b) vertical view of TPHS, while Figure 4a,b shows those of CH. From Figure 3, the hex mesh was considered for the TPHS model, which was divided into three independent blocks, viz. CH, cylindrical screen and cylindrical envelope. Then, the strategy of mesh interfaces in Fluent (a commercial CFD software belonging to the ANSYS software, ANSYS, Inc. Pittsburgh, PA, USA) was used to merge the overlaps between the adjacent blocks. In Figure 4 the unstructured mesh was used for the CH model. In TPHS and CH, the mesh size was less than 1 mm, while the initial mesh height was 0.1 mm. The total numbers of hexahedral grids of TPHS and CH were ~2.36 million and ~0.3 million, respectively. Both grids of the maximum cell skewness were below 0.8, which indicate the excellent grid quality. According to our investigation [16], the above grid regulations could create economical grid-independence.
In this investigation, the combination of volume of fluid (VOF) [22] and Reynolds stress model (RSM) [23,24,25] was used to describe the fluid flow in TPHS and CH, which has been proved to be an effective method in our previous work [16,26]. In detail, two-phase flow using water and air as fluid was modeled by the VOF method given as:
1 ρ q [ t ( α q ρ q ) + ( α q ρ q u q ) = p = 1 n ( m p q m q p ) ]
where the subscript p and q represent the phases, respectively, in fluid; m p q ( m q p ) is the mass transfer from phase p (q) to phase q (p); u q denotes the velocity vector (m/s); ρ q is the phase q density (kg/m3); α q indicates the volume fraction of phase q in the cell.
To describe the fluid flow, the continuity equation and motion equation are shown in the following expressions:
u i = u i ¯ + u i
ρ t + ρ x i ( ρ u i ) = 0
t ( ρ u i ) + x j ( ρ u i u j ) = p x i + x j [ μ ( u i x j + u j x i ) ] + x j ( ρ u i u j ¯ )
where the subscript i, j and k mean the x, y and z, respectively, components in Cartesian coordinate system; u i ¯ and u i represent the mean velocity component (m/s) and fluctuation velocity component (m/s), respectively; x i , x j and x k are the fluid position (m); ρ is the density (kg/m³).
Furthermore, the turbulence behavior of fluid was described by the Reynolds stress model (RSM), which is below:
t ( ρ u i u j ¯ ) + x k ( ρ u k u i u j ¯ ) = x k [ ρ u i u j u k ¯ + p ( δ k j u i + δ j k u j ) ¯ ] ρ ( u i u k ¯ u j x k + u j u k ¯ u i x k )         + p ( u i x j + u j x i ) ¯ 2 μ u i x k u i x k ¯
where δ refers to the Kronecker delta function and t denotes time (s).
In addition, the stand wall function was used to model the velocity in the near-wall region.
U P 0.09 1 / 4 k P 1 / 2 τ w / ρ = 1 0.4187 ln ( 9.793 ρ 0.09 1 / 4 k P 1 / 2 y P μ )
where U P represents the mean velocity of the fluid at the wall-adjacent cell centroid of p, τ w is the wall shear stress, k P is the turbulence kinetic energy at the wall-adjacent cell centroid of p, y P is the distance from the centroid of the wall-adjacent cell to the wall of p, μ is the dynamic viscosity (N·s/m2)
In the CFD simulation for TPHS and CH, the velocity inlet and pressure outlet were adopted as the boundary type of feed entrance and product exits, respectively. The inlet velocity was 5–15 m/s, while the pressure out was equal to 1 standard atmospheric pressure i.e., 101,325 Pascal. The SIMPLE (Semi-Implicit Method for Pressure Linked Equations) scheme based on the pressure-velocity coupling algorithm was chosen as the solution methods. The first order implicit algorithm was considered as the transient formulation, while the least squares cell-based PRESTO! and upwind difference algorithms were used for the spatial discretization. The air volume fraction of 1 in all zones was initialized based on the standard initialization. The size and number of time steps were 0.001 and 20,000 (viz. the physical time of 20 s), respectively. The max iterations step in each time step was 20. Following this setup, the details of the flow field development with the time can be calculated. All the numerical simulations were calculated by the commercial software ANSYS Fluent at a high-performance computer.

3. Results and Discussion

Prior to the research for the mechanism of the absent air column in TPHS, the development process of flow fields in TPHS were studied through the combination of simulation and experiment. Subsequently, the numerical comparisons between TPHS and CH were analyzed. The details are as follows.

3.1. Development Process of Flow Field in Three Products Hydrocyclone Screen (TPHS)

Figure 5 shows the contours of volume fraction of air at different CFD numerical moments with the inlet velocity of 5 m/s. Note that the closer the color is to red in the color map, the higher the volume fraction of air phase is and vice versa. The highest volume fraction of 1 announces an area filled with air. The air column fraction ranged between 0 and 1. The max and min values mean that this area is individually full of air and water, respectively, while the middle values represent the mixed phased of gas and liquid.
From Figure 5, the evolution process of flow field in the TPHS can be described as three stages namely the initial (0 s), forming (0–8 s) and stable (>8 s) periods. In detail, at 0 s, the volume fraction of the air phase was set to 1 in the numerical initialization (see the detailed setting in Section 2.2), thus TPHS is full of the air phase. Then the water phase was imported under velocity to the TPHS along the tangential inlet, and enforced by the wall of the feed chamber to move in a circle path. The feeding section was quickly occupied by the water phase, so the volume fraction of air in this part was reduced to 0 (see the blue area at 0.2 s). Also, due to the gravity acceleration along the negative direction of Z axis, the water spiraled downward. However, the liquid passed through the sieve according to the presence of cylindrical screen to generate the screen underflow. Afterwards, all parts of the TPHS were gradually occupied by the liquid phase, that is, the gas phase volume fraction distribution was less than 1 (see the green area at 0.5–5 s). Meanwhile, the underflow outlet of TPHS was too small to completely discharge the water (i.e., underflow) in time; hence the volume fraction of air rapidly decreased, and the water was discharged through the top port (namely overflow). However, with the continuous feeding of fluid from the tangential inlet, the air phase in TPHS was completely replaced by the liquid phase, that is the gas volume fraction decreased to 0, as shown at 8–15 s. Form 9 s to 15, the contours of air volume fraction remained unchanged, which indicates that the flow field in TPHS was stable. Furthermore, the distribution of air volume fraction with 0 along the z-axial direction illustrated the absent air column in TPHS.
Corresponding to the above CFD simulation, the inlet velocity was also 5 m/s (see the details of the experiment in Section 2.1) in the experiment. Figure 6 displays the development of fluid in the label-scale TPHS at different moments (a) 0 s, (b) 2 s, (c) 4 s, (d) 6 s and (e) 8 s, which are recorded by the high-definition camera. In Figure 6, it is apparent that at 0 s (Figure 6a), the water has not yet been pumped into the TPHS, thus the liquid does not exist inside the device. However, from the blue ellipse line in Figure 6b–d, it can be seen that the air phase gradually disappeared. This represents the fact that as the water was injected into TPHS, the liquid phase quickly occupied the field inside the equipment. Later, TPHS showed the absent air column in Figure 6e. Obviously, the tendency of air phase distribution in the experiment is absolutely consistent with that in the CFD simulation (in Figure 5), and likewise both the experiment (shown in Figure 5) and simulation (shown in Figure 6) exhibit the absent air column in TPHS. This result not only validates the accuracy of the numerical simulation, but also proves that there is no air column in TPHS.

3.2. Mechanism of the Absent Air Column in TPHS

During the operation of the CH separators, the air column is generally considered as having flow characteristics which largely affect the device’s performance [20,27]. The formation of air core can be attributed to the pressure drop which leads to the negative pressure region in the center of cyclone, i.e., the pressure difference the axial center of the hydrocyclone and the atmospheric pressure [17,20,28,29]. Hence, the air can be sucked through the outlets (in the open-to-air cyclone) [30,31] or released from the dissolved gas brought in from the feed inlet (in the sealed-air cyclone) [20,31] to create the air core. As mentioned (see Section introduction), the air core is at a disadvantage to the device performance, and thus some attempts to remove it have been carried out. Since TPHS is a derivative of the hydrocyclone, the absent air column should optimize the fluid flow for better device performance. Note that the details of flow feature including the velocity vector inside TPHS has been described in our previous study [16].
To explore the mechanism of the absent air core in the new cyclone, the comparison of pressure gradient distribution between the 75 mm-TPHS and 75 mm-CH was considered (see the dimension of device in Table 1) with the same inlet velocity of 5 m/s. Note that the below discussions are based on the simulation results averaged over the numerical time of 15–20 s (the information of the set up in the CFD simulation is illustrated in the last paragraph of Section 2.2).
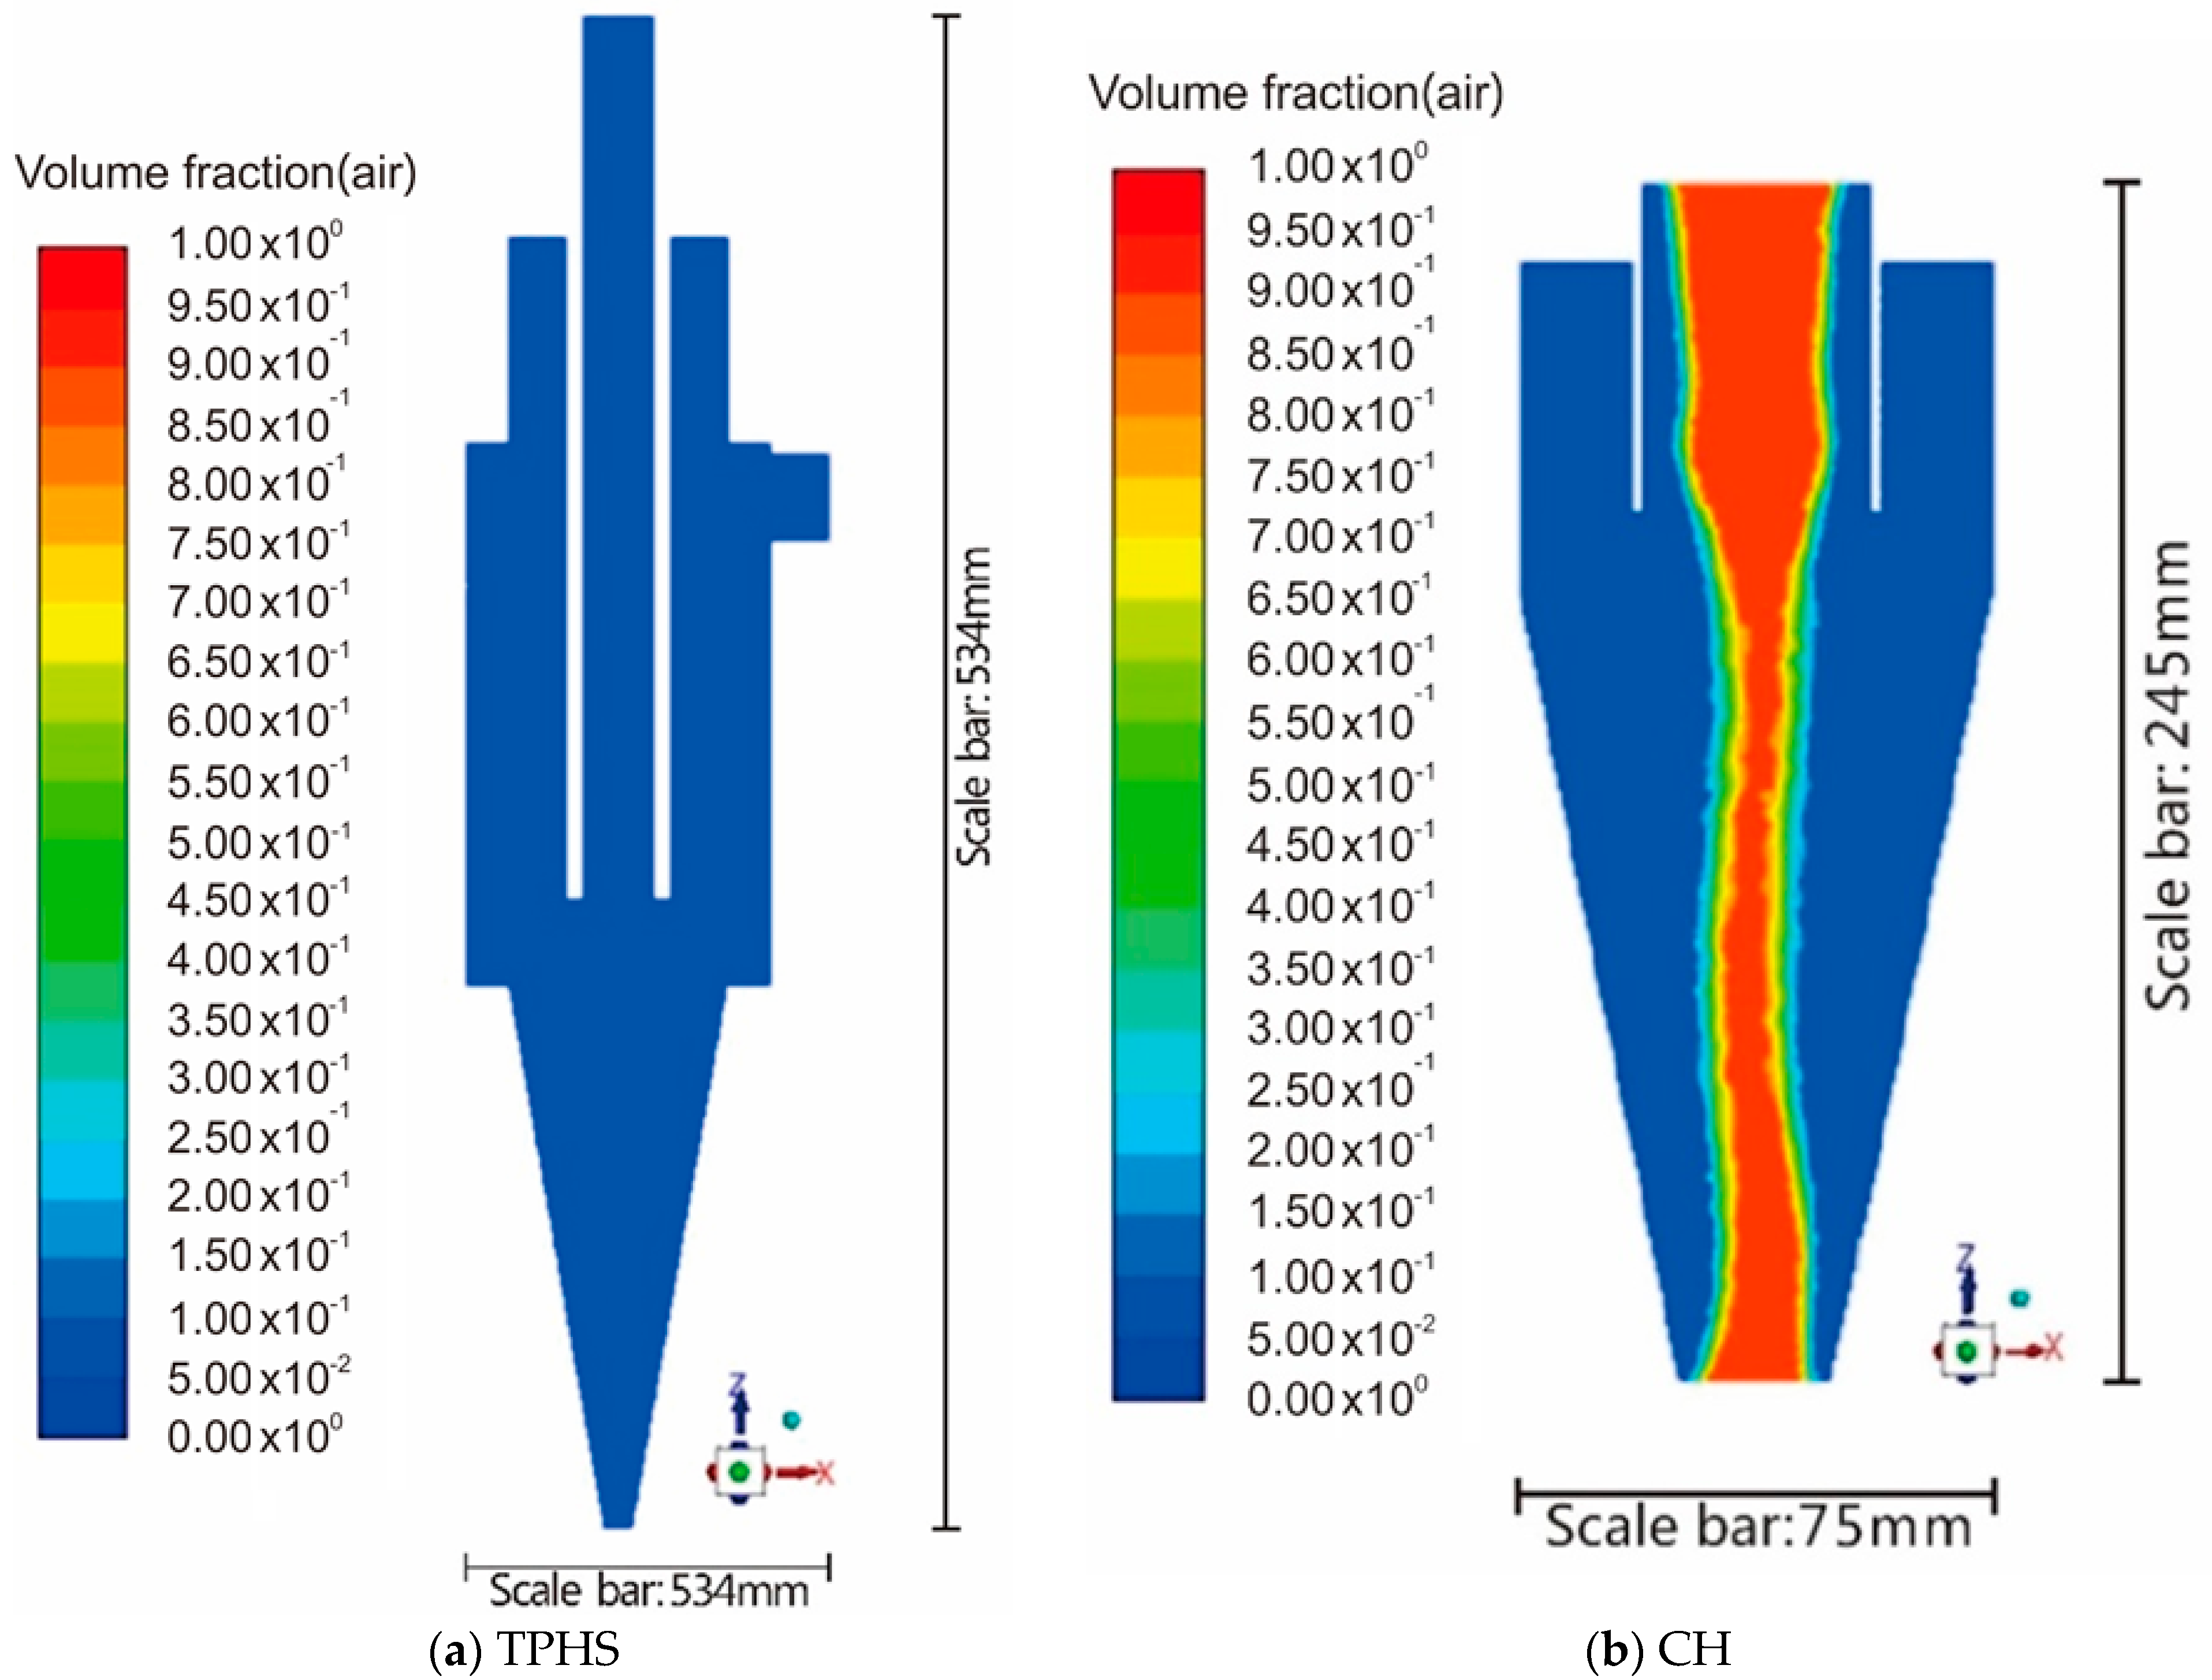
The contours of air volume fraction at plane y = 0 mm are exhibited in Figure 7a TPHS and 7b CH. The explanation of the color map refers to the first paragraph in Section 3.1. From Figure 7a, it is obvious that the air volume fraction inside TPHS was homogeneously equal to 0, which reveals that the water phase replaced the air to completely fill the device. However, CH exhibits the region with the air volume fraction of 1 (see the red area in Figure 7b) which shows that the air column was generated in the center of the hydrocyclone.
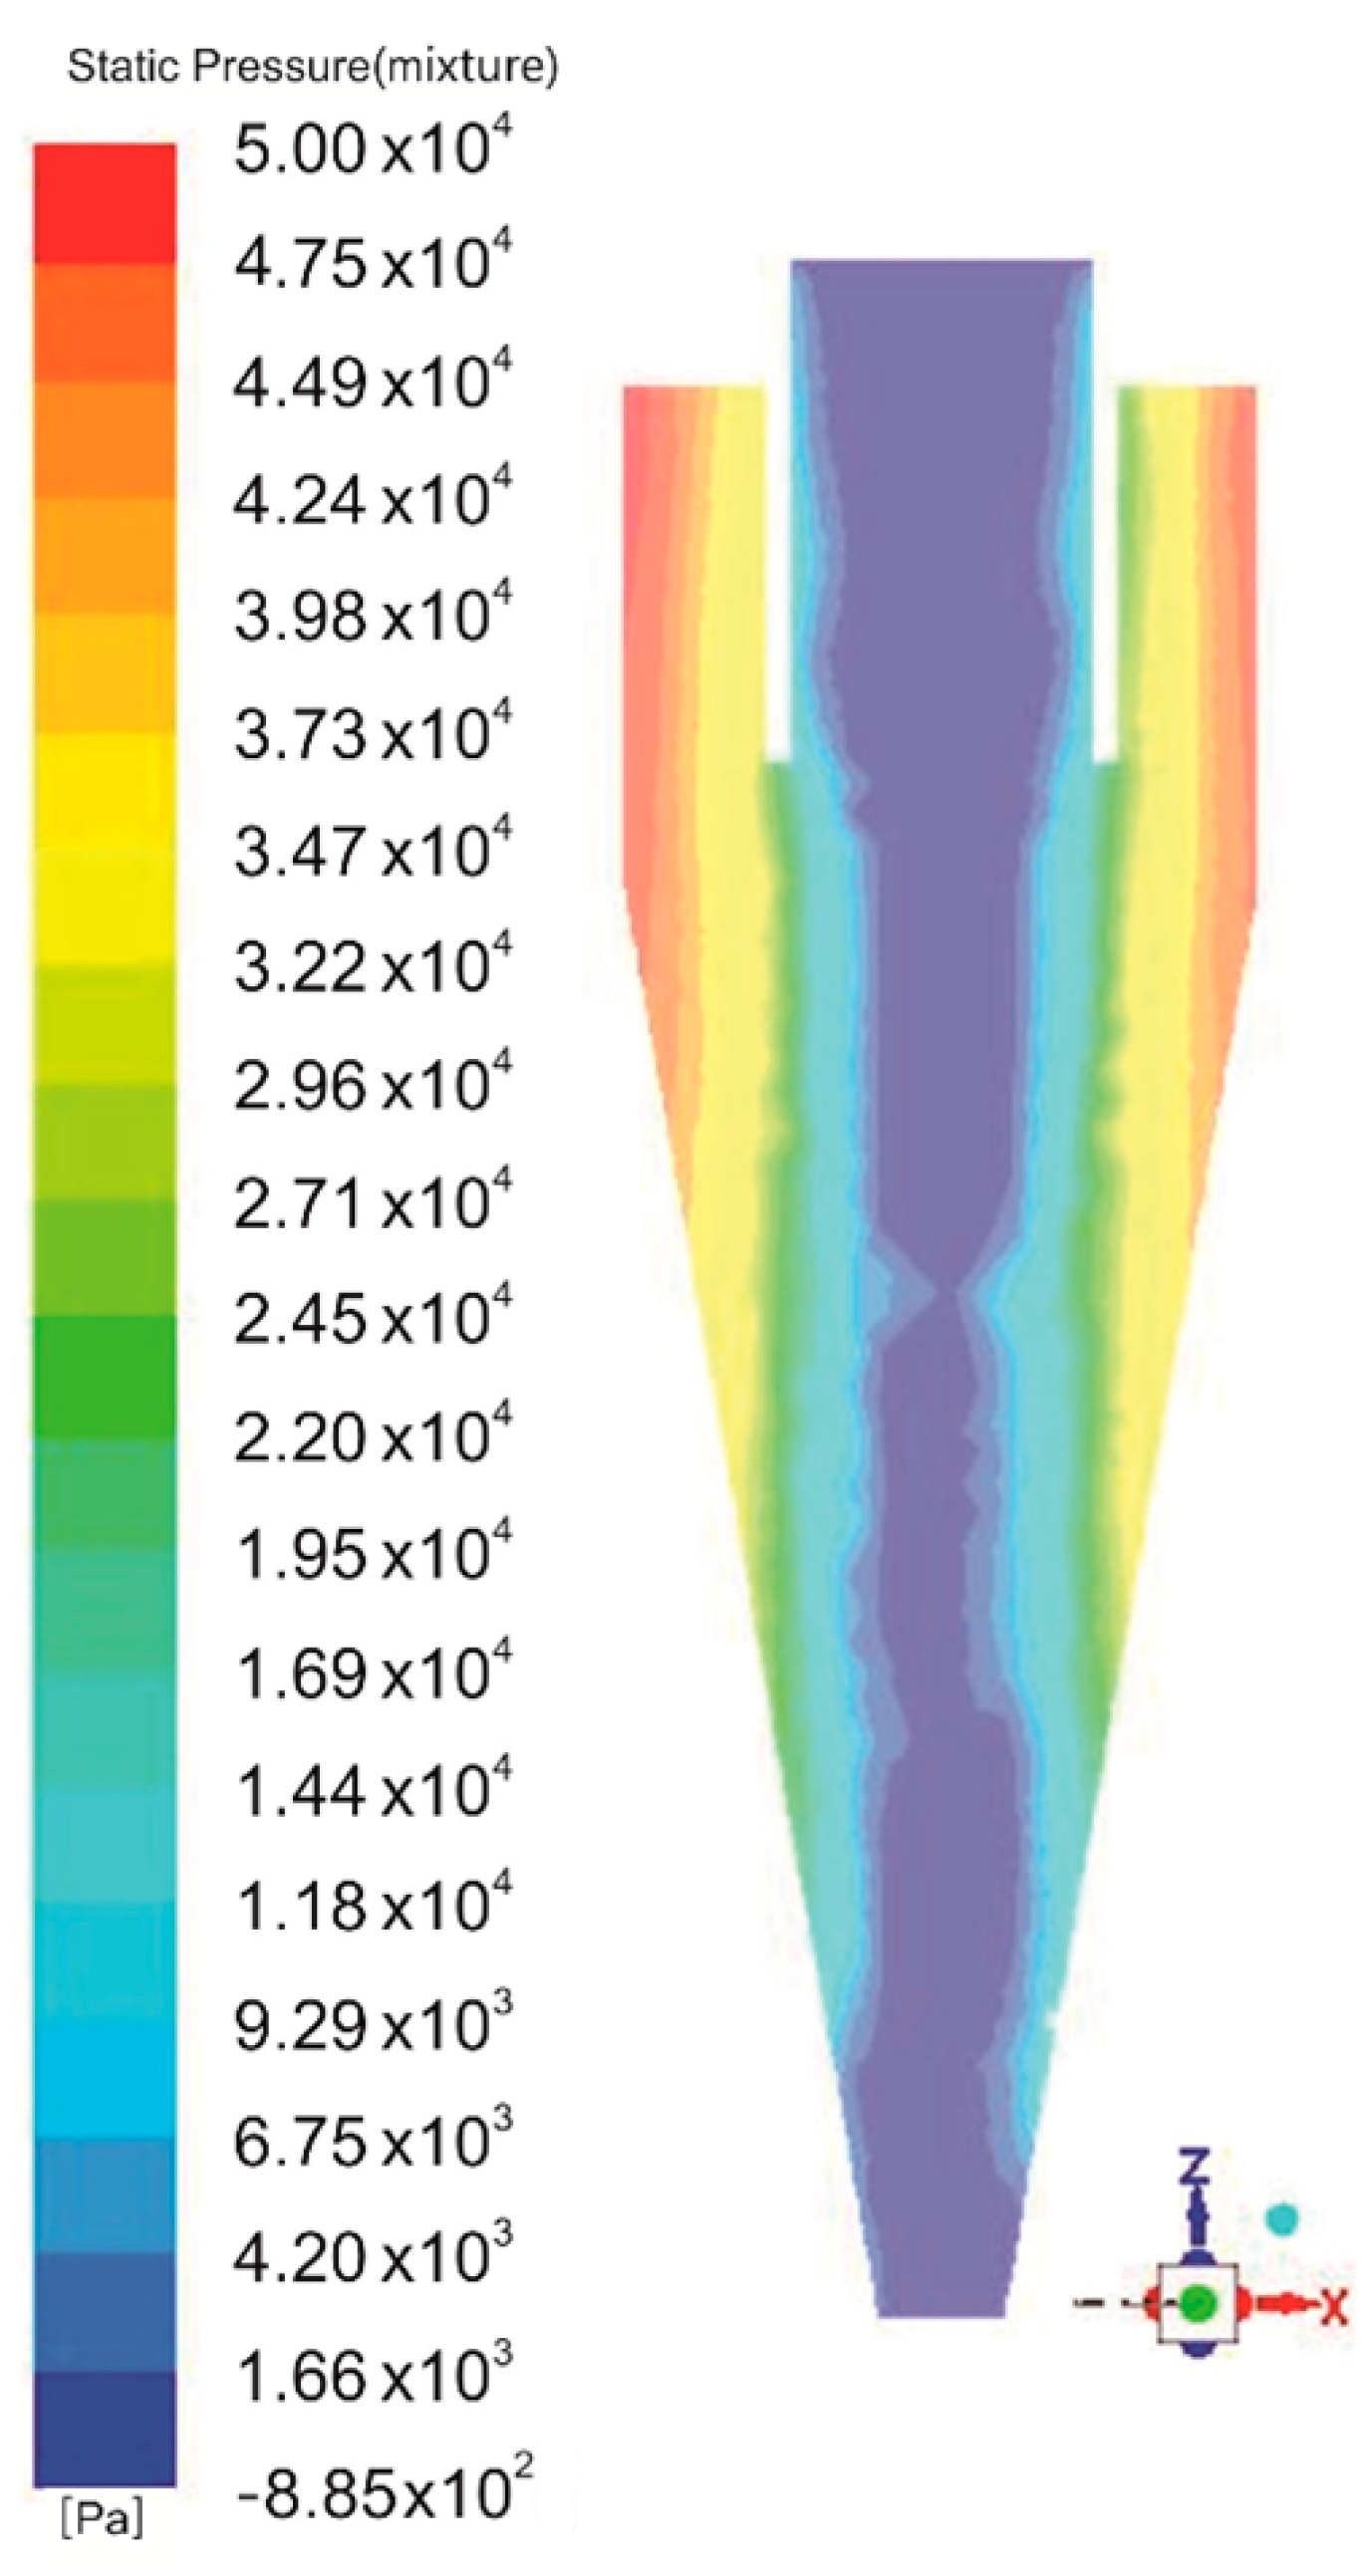
Furthermore, Figure 8 shows the (a) original and (b) narrowed contours of static pressure at plane y = 0 mm in TPHS, where the closer the color is to red in the color-map, the higher the static pressure is and vice versa. Note that the original contour means that all the pressure distribution (–500 to 6000 Pa) in the y = 0 plane are displayed, while the narrowed contour represents the partial pressure distribution (–500 to 3000 Pa) that is displayed. This is to highlight the pressure distribution at the outlets. In Figure 8a, it can be seen that the max pressure is located near the top of the feed chamber (see the red dotted line in figure). This is due to the present chamber wall that forced the fluid velocity to decrease rapidly to 0, and thus the dynamic pressure was quickly changed into static pressure. In addition, the other region exhibits the smaller static pressure. Here, in order to clearly describe the static pressure distribution, the range of static pressure in the contour was been narrowed, thus Figure 8a can be transferred to Figure 8b. From Figure 8b, it is clear that only the region near the screen outlet (see the blue dotted line in the figure) displays some local negative static pressure, while the other regions partially at the underflow and overflow outlets (see the blue dotted lines in figure) exhibit positive static pressure. Furthermore, Figure 9 presents the contours of static pressure at plane y = 0 mm in the TPHS. It is apparent that the max static pressure also located near the top of CH (see the red region in Figure), which is also due to the forcing effect of the wall on the liquid phase. However, the region along the axial direction shows dark blue distribution, namely negative static pressure. The above discussion demonstrates that despite the same feed inlet, TPHS and CH display positive and negative static pressure, respectively, in the center region along the z-axis. This result illustrates in the physical TPHS, compared to CH, that not only air cannot be sucked into the equipment through the outlet ports, but also the air dissolved in the liquid phase cannot be released. The absent air column and this pressure distribution in the TPHS can be ascribed to the distinctive structure i.e., the added cylindrical screen which optimized the flow field distribution inside the equipment.
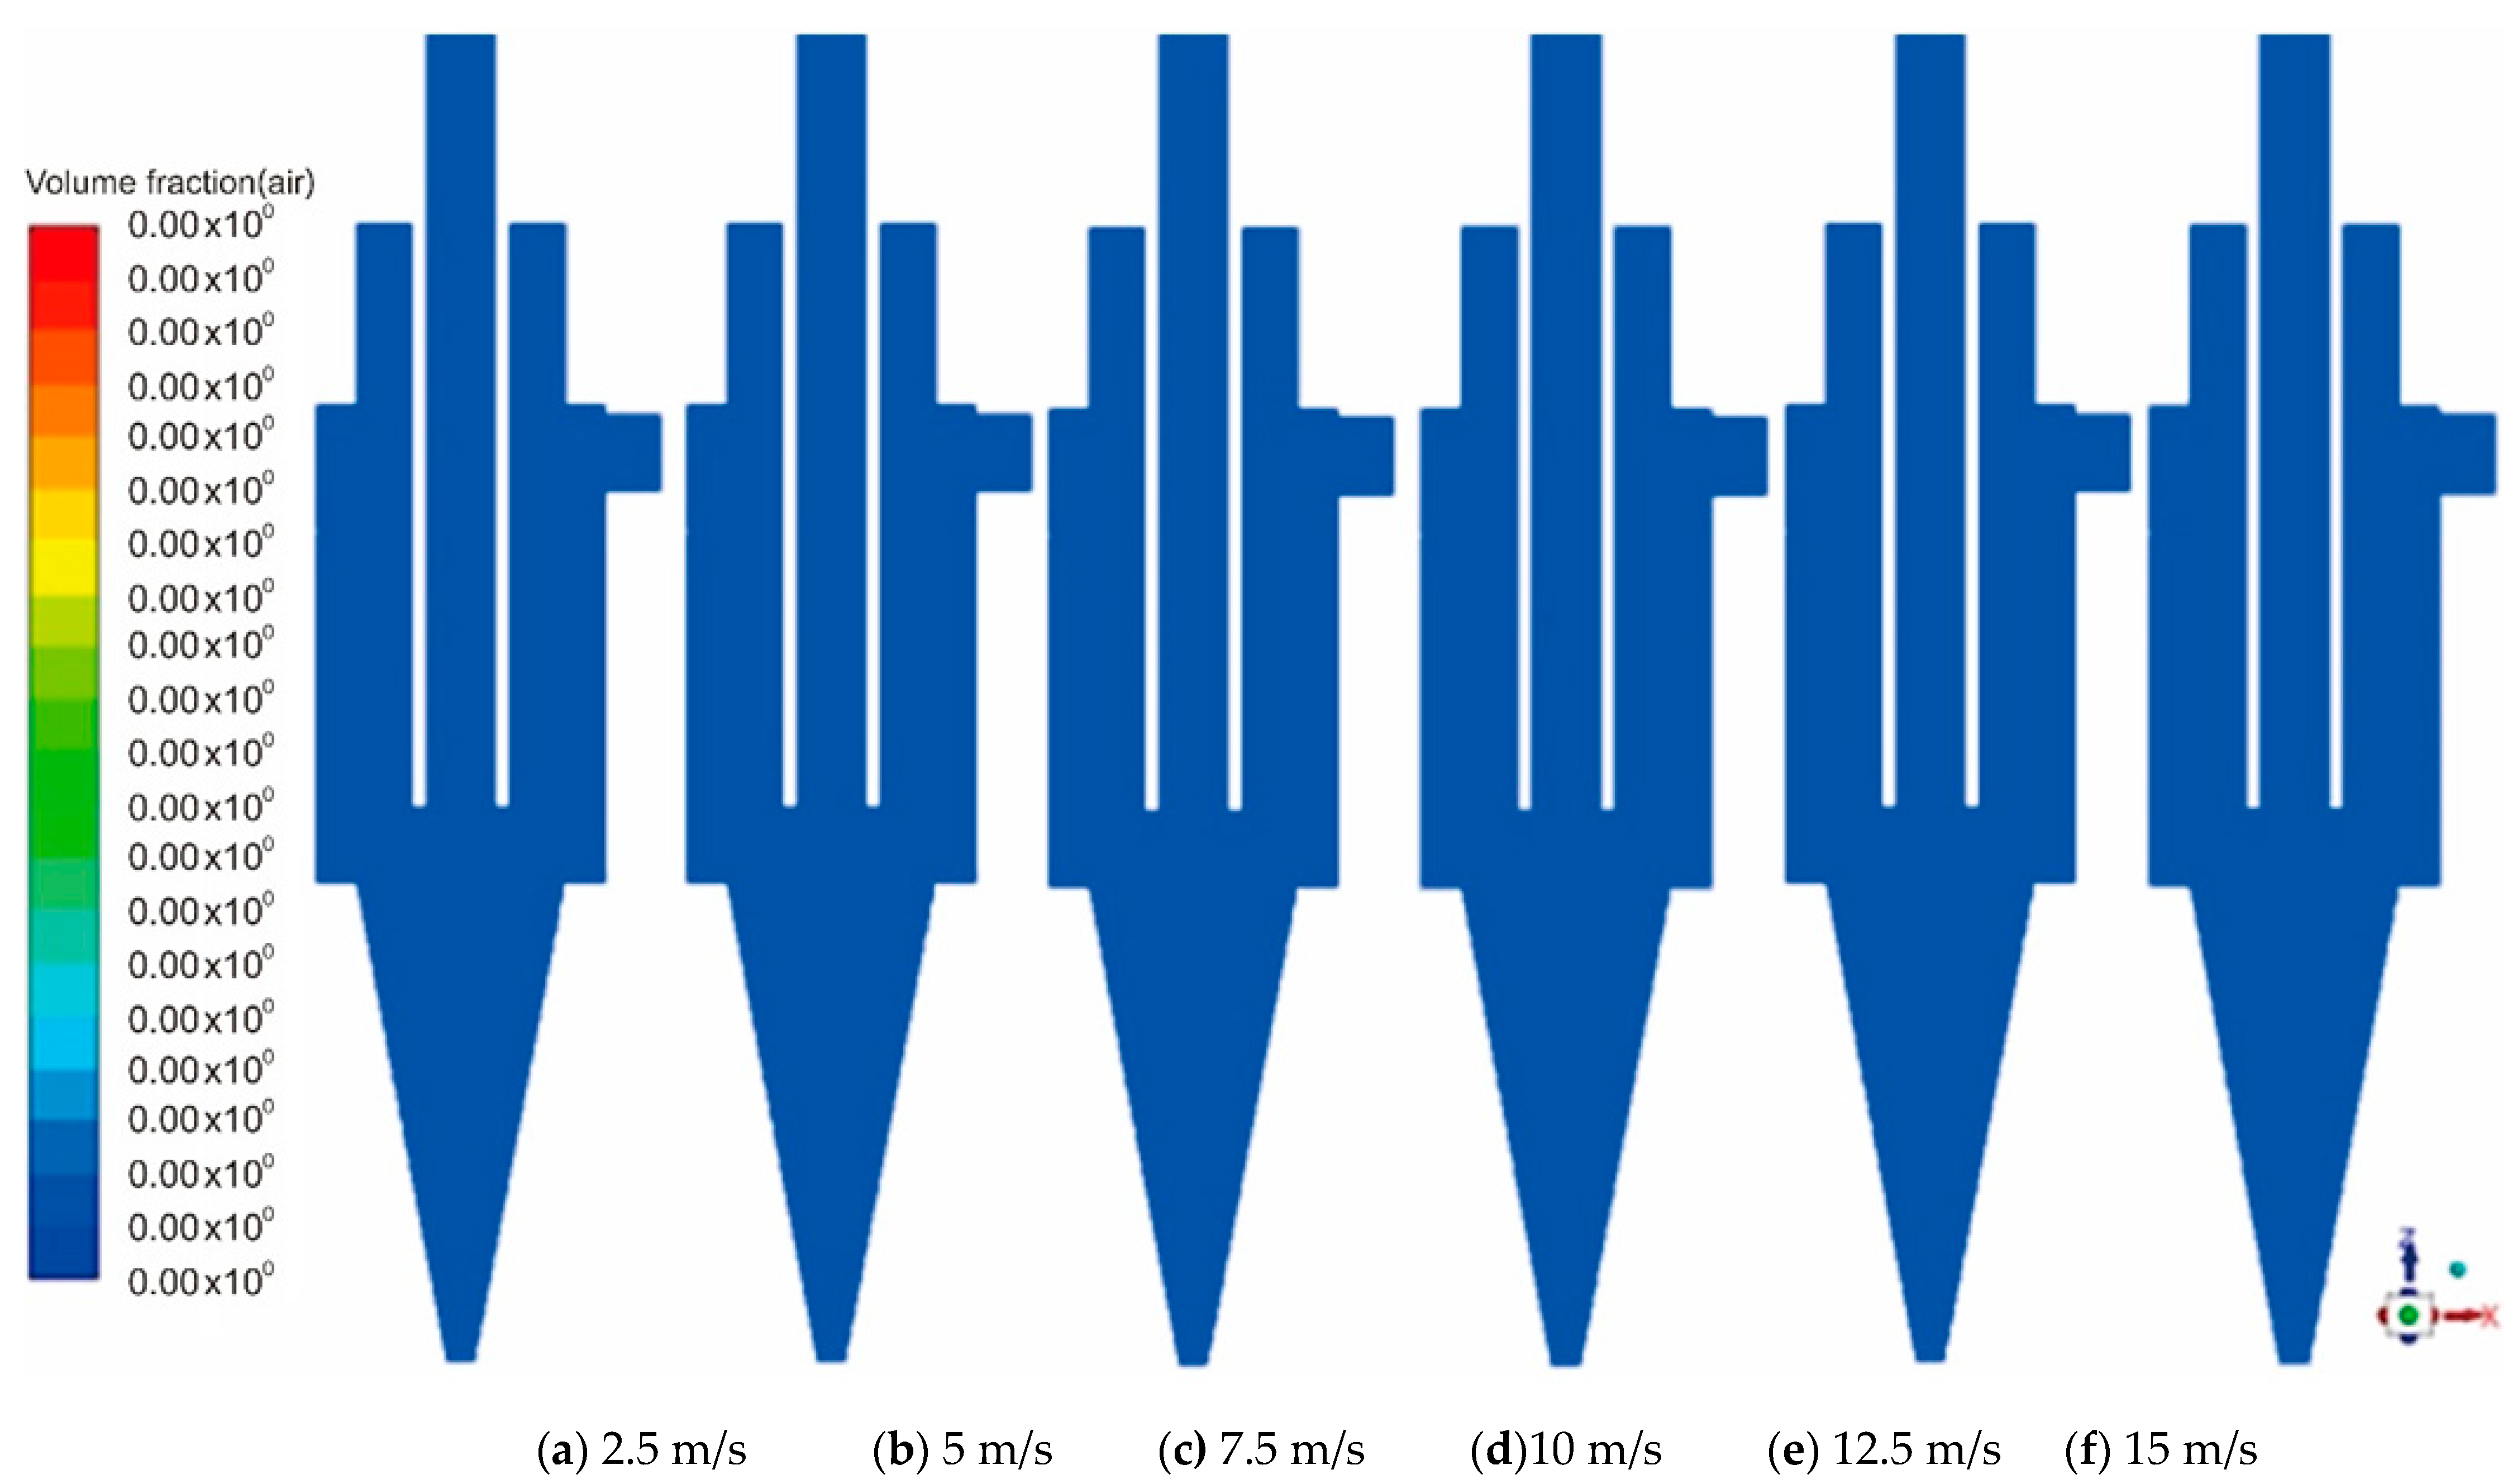
In addition, Figure 10 shows the contours of air column fraction in the plane y = 0 in TPHS under different inlet velocity of (a) 2.5 m/s, (b) 5 m/s, (c) 7.5 m/s, (d)10m/s, (e) 12.5 m/s and (f) 15 m/s. It is clear that even if the feed throughput is different, TPHS presents the same air phase fraction of 0. This phenomenon indicates that the air column was absent under different inlet conditions of TPHS. The distribution of static pressure at different axial position in the plane y = 0 mm is exhibited in Figure 11, which corresponds to the above different inlet velocity of TPHS in Figure 10. Note that the origin position (0, 0, 0) in the Cartesian coordinate system for TPHS is located at the center of the interface between the feed chamber and cylindrical envelope (see the green coordinate sketch in Figure 2). From Figure 11, it is clear that the static pressure of TPHS under different inlet velocity displays the analogous distribution. In detail, on the one hand, the static pressure in TPHS rose gradually with the increase of inlet velocity. On the other hand, under the same inlet velocity (take inlet velocity of 5 m/s as the example, see the brown line in Figure 11), as the axial depth increased from 200 mm to –400 mm the value of static pressure fluctuated. That is, it firstly regularly increased from ~0 Pa, then decreased to a local minimum ~300 Pa, afterwards grew fast to a local maximum 1000 Pa and kept stable, and finally dropped rapidly to 0 Pa. The local minimum and maximum appeared near the junction of cylinder and cone. The static pressure is 0 Pa at the ends of the TPHS along the axial direction, since the overflow and underflow port are connected to the atmosphere. Furthermore, each static pressure presents a positive value. This result reveals that the absent air core can be attributed to the positive static pressure distribution. Moreover, according to our previous research [16], the cylindrical screen creates a great influence on the flow field inside TPHS, namely it results in the more lower tangential velocity in TPHS than that in CH under the same boundary conditions. Hence, the lower-speed rotating fluid cannot form a negative pressure zone inside the TPHS.

4. Conclusions

In this study, the three products hydrocyclone screen (TPHS), which has a cylindrical screen embedded in a conventional hydrocyclone (CH), has been successfully investigated. Both the CFD simulation with the RSM model and the physical experiment with a high-definition camera were adopted involving a 75 mm TPHS to research the details of the absent air column inside this cyclone. Based on the detailed exploration of the flow field evolution in TPHS, the mechanism of the absent air column is systematically studied. According to the presented results and discussion, the conclusions below can be drawn:
(1)
both CFD simulation and physical experiment under same conditions display the coincident flow field evolution. As the water was introduced along the tangential direction into the TPHS, the liquid phase spiraled downward due to the effects of feed chamber wall and gravity acceleration; until the liquid fluid moved near the cylindrical screen, it passed through the sieves to generate the screen underflow; however, due to the small underflow, the air volume fraction inside the TPHS rapidly fell from 1 to 0; finally, the water phase filled the TPHS, which indicated the air column was entirely removed.
(2)
the distribution comparison of air volume fraction reveals that the air column can be clearly observed in CH, while the opposite tendency (via the absent air core) was obtained in TPHS; further, the distribution comparison of static pressure demonstrates that the positive and negative static pressure can be detected in TPHS and CH, respectively, in the center region along the z-axis; this means that in the TPHS the air cannot be sucked or released to form the air core; this trend is attributed to the added cylindrical screen which optimized the flow field distribution inside the TPHS.
(3)
the contours of air column fraction in the TPHS under different feed velocity represent the absent air core (i.e., the air phase fraction of 0), moreover the static pressure distribution with the increasing axial depth reveals that the absent air core can be attributed to the positive static pressure distribution.
In future, based on this study, attempts to explore the particle motion in TPHS will be carried out with the CFD–DEM method.

Author Contributions

Conceptualization, H.L.; Data curation, C.W. and Z.Z.; Formal analysis, C.W. and Z.Z.; Funding acquisition, M.S.K.; Investigation, C.W. and Z.Z.; Methodology, A.Y.; Project administration, M.S.K.; Software, C.W. and Z.Z.; Supervision, H.L. and M.S.K.; Writing–original draft, C.W. and A.Y.; Writing–review & editing, H.L. and M.S.K. All authors have read and agreed to the published version of the manuscript.

Funding

This work was supported by Anhui Provincial Natural Science Foundation (2008085QE272); Youth Program of National Natural Science Foundation of China (52004009); China Postdoctoral Science Foundation (2020M671837); Doctor foundation of Anhui University of science and technology; University-level key projects of Anhui University of science and technology.

Institutional Review Board Statement

Not applicable.

Informed Consent Statement

Not applicable.

Data Availability Statement

The data presented in this study are available on request from the corresponding author. The data are not publicly available due to the continuous research.

Conflicts of Interest

The authors declare no conflict of interest.

References

  1. Bradley, D. The Hydrocyclone: International Series of Monographs in Chemical Engineering; Elsevier: Amsterdam, The Netherlands, 2013. [Google Scholar]
  2. Razmi, H.; Goharrizi, A.S.; Mohebbi, A. CFD simulation of an industrial hydrocyclone based on multiphase particle in cell (MPPIC) method. Sep. Purif. Technol. 2018, 209, 851–862. [Google Scholar] [CrossRef]
  3. Ghodrat, M.; Qi, Z.; Kuang, S.; Ji, L.; Yu, A. Computational investigation of the effect of particle density on the multiphase flows and performance of hydrocyclone. Miner. Eng. 2016, 90, 55–69. [Google Scholar] [CrossRef]
  4. Feng, B.; Jiao, X.; Wang, H.; Peng, J.; Yang, G. Improving the separation of chalcopyrite and galena by surface oxidation using hydroxyethyl cellulose as depressant—ScienceDirect. Miner. Eng. 2021, 160, 106657. [Google Scholar]
  5. Chen, L.; Liu, W.; Zeng, J.; Ren, P. Quantitative investigation on magnetic capture of single wires in pulsating HGMS. Powder Technol. 2017, 313, 54–59. [Google Scholar] [CrossRef]
  6. Obeng, D.; Morrell, S. The JK three-product cyclone—performance and potential applications. Int. J. Miner Process. 2003, 69, 129–142. [Google Scholar] [CrossRef]
  7. Salvador, F.F.; Barrozo, M.A.; Vieira, L.G. Filtering cylindrical–conical hydrocyclone. Particuology 2019, 47, 54–62. [Google Scholar] [CrossRef]
  8. Jianzhong, C.; Lijuan, S.; Chuanzhen, W. Desliming performance of the three-product cyclone classification screen. J. China Univ. Min. Technol. 2016, 45, 807–813. [Google Scholar]
  9. Wang, C.; Chen, J.; Shen, L.; Hoque, M.M.; Ge, L.; Evans, G.M. Inclusion of screening to remove fish-hook effect in the three products hydro-cyclone screen (TPHS). Miner. Eng. 2018, 122, 156–164. [Google Scholar] [CrossRef]
  10. Wang, C.; Sun, X.; Shen, L.; Wang, G. Analysis and Prediction of Influencing Parameters on the Coal Classification Performance of a Novel Three Products Hydrocyclone Screen (TPHS) Based on Grey System Theory. Processes 2020, 8, 974. [Google Scholar] [CrossRef]
  11. Kraipech, W.; Nowakowski, A.; Dyakowski, T.; Suksangpanomrung, A. An investigation of the effect of the particle-fluid and particle-particle interactions on the flow within a hydrocyclone. Chem. Eng. J. 2005, 111, 189–197. [Google Scholar] [CrossRef]
  12. Majumder, A.; Shah, H.; Shukla, P.; Barnwal, J. Effect of operating variables on shape of “fish-hook” curves in cyclones. Miner. Eng. 2007, 20, 204–206. [Google Scholar] [CrossRef]
  13. Wang, B.; Chu, K.W.; Yu, A.B.; Vince, A. Computational investigation of the mechanisms of the "breakaway" effect in a dense medium cyclone. Miner. Eng. 2014, 62, 111–119. [Google Scholar]
  14. Zhu, X.-B.; Xu, N.-X.; Liu, L.-H. Application of three-product cyclone sizing screen in classification and thickening of slime in Xuehu coal preparation plant. Coal Prep. Technol. 2012, 1, 12. [Google Scholar]
  15. Li, Q.; Wang, J.; Jin, Y. Performance evaluation of a new cyclone separator—Part II simulation results. Sep. Purif. Technol. 2016, 160, 112–116. [Google Scholar]
  16. Wang, C.; Chen, J.; Shen, L.; Ge, L. Study of flow behaviour in a three products hydrocyclone screen: Numerical simulation and experimental validation. Physicochem. Probl. Miner Process 2019, 55, 879–895. [Google Scholar]
  17. Zou, J.; Wang, C.X.; Ji, C. Experimental study on the air core in a hydrocyclone. Dry. Technol. 2016, 34, 854–860. [Google Scholar] [CrossRef]
  18. Chu, L.-Y.; Yu, W.; Wang, G.-J.; Zhou, X.-T.; Chen, W.-M.; Dai, G.-Q. Enhancement of hydrocyclone separation performance by eliminating the air core. Chem. Eng. Process. Process Intensif. 2004, 43, 1441–1448. [Google Scholar] [CrossRef]
  19. Chu, L.Y.; Chen, W.M.; Lee, X.Z. Enhancement of hydrocyclone performance by controlling the inside turbulence structure. Chem. Eng. Sci. 2002, 57, 207–212. [Google Scholar] [CrossRef]
  20. Ke, R.; Shingote, C.; Kadambi, J.R.; Furlan, J.; Visintainer, R. Experimental and Numerical Investigations of the Fluid Flow in a Hydroclyclone with an Air Core. Min. Metall. Explor. 2019, 37, 277–286. [Google Scholar] [CrossRef]
  21. Jirun, X.; Qian, L.; Jicun, Q. Studying the flow field in a hydrocyclone with no forced vortex: Part I: Average velocity. Filtr. Sep. 1990, 27, 276–278. [Google Scholar] [CrossRef]
  22. Hirt, C.W.; Nichols, B.D. Volume of fluid (VOF) method for the dynamics of free boundaries. J. Comput. Phys. 1981, 39, 201–225. [Google Scholar] [CrossRef]
  23. Gibson, M.; Launder, B. Ground effects on pressure fluctuations in the atmospheric boundary layer. J. Fluid Mech. 1978, 86, 491–511. [Google Scholar] [CrossRef]
  24. Launder, B.; Reece, G.J.; Rodi, W. Progress in the development of a Reynolds-stress turbulence closure. J. Fluid Mech. 1975, 68, 537–566. [Google Scholar] [CrossRef] [Green Version]
  25. Launder, B.E. Second-moment closure: Present… and future? Int. J. Heat Fluid Flow 1989, 10, 282–300. [Google Scholar] [CrossRef]
  26. Yan, X.; Wang, L.; Cao, Y.; Liu, J. Effect of cone angles on single-phase flow of a laboratory cyclonic-static micro-bubble flotation column: PIV measurement and CFD simulations. Sep. Purif. Technol. 2015, 149, 308–314. [Google Scholar]
  27. Dyakowski, T.; Williams, R.A. Prediction of Air-Core Size and Shape in a Hydrocyclone. Int. J. Miner. Process. 1995, 43, 1–14. [Google Scholar] [CrossRef]
  28. Nowakowski, A.F.; Cullivan, J.C.; Williams, R.A.; Dyakowski, T. Application of CFD to modelling of the flow in hydrocyclones. Is this a realizable option or still a research challenge? Miner. Eng. 2004, 17, 661–669. [Google Scholar] [CrossRef]
  29. Doby, M.J.; Nowakowski, A.F.; Yiu, I.; Dyakowski, T. Understanding air core formation in hydrocyclones by studying pressure distribution as a function of viscosity. Int. J. Miner. Process. 2008, 86, 18–25. [Google Scholar] [CrossRef]
  30. Cullivan, J.C.; Williams, R.A.; Dyakowski, T.; Cross, C.R. New understanding of a hydrocyclone flow field and separation mechanism from computational fluid dynamics. Miner. Eng. 2004, 17, 651–660. [Google Scholar] [CrossRef]
  31. Neesse, T.; Dueck, J. Air core formation in the hydrocyclone. Miner. Eng. 2007, 20, 349–354. [Google Scholar] [CrossRef]
Figure 1. Schematic diagram of the three products hydrocyclone (TPHS).
Processes 09 00431 g001
Figure 2. Schematic diagram of experimental rig.
Processes 09 00431 g002
Figure 3. Mesh profile of TPHS: (a) side view, (b) vertical view.
Processes 09 00431 g003
Figure 4. Mesh profile of conventional hydrocyclone (CH): (a) side view, (b) vertical view.
Processes 09 00431 g004
Figure 5. Contours of air volume fraction at different time inside TPHS with the inlet velocity of 5 m/s.
Processes 09 00431 g005
Figure 6. Photograph of the development of flow field at the in TPHS experiment with the inlet velocity of 5 m/s: (a) 0 s, (b) 2 s, (c) 4 s, (d) 6 s and (e) 8 s.
Processes 09 00431 g006
Figure 7. Contours of air volume fraction at plane y = 0 mm with the inlet velocity of 5 m/s at the simulation time of 10 s: (a) TPHS, (b) CH.
Processes 09 00431 g007
Figure 8. Contours of static pressure at plane y = 0 mm in TPHS with the inlet velocity of 5 m/s at the simulation time of 10 s: (a) Original (−500–6000 Pa), (b) Narrowed (−500–2000 Pa).
Processes 09 00431 g008
Figure 9. Contours of static pressure at plane y = 0 mm in CH with the inlet velocity of 5 m/s at the simulation time of 10 s.
Processes 09 00431 g009
Figure 10. Contours of air column in the plane y = 0 mm inside the TPHS with different inlet velocity at the simulation time of 10 s: (a) 2.5 m/s, (b) 5 m/s, (c) 7.5 m/s, (d)10m/s, (e) 12.5 m/s and (f) 15 m/s.
Processes 09 00431 g010
Figure 11. Static pressure distribution with the increasing axial depth in the plane y = 0 mm inside the TPHS under different inlet velocity.
Processes 09 00431 g011
Table 1. Comparison between TPHS and CH in computational fluid dynamics (CFD) simulation.
Items75-mm TPHS75-mm CH
Diameter of cylindrical screen75 mmN/A
Diameter of cylindrical envelope105 mm75 mm
Aperture size0.65 mmN/A
Thickness of screen bar5 mmN/A
Width of screen bar3.25 mmN/A
Hydraulic diameter of inlet12.54 mm21 mm
Length of feed chamber70 mmN/A
Length of cylindrical envelope185 mm60 mm
Length of vortex finder300 mm60 mm
Insertion length of overflow pipe18545 mm
Diameter of vortex finder25 mm36 mm
Diameter of screen underflow outlet30 mmN/A
Angle of cone20°20°
Diameter of underflow10 mm15 mm
Publisher’s Note: MDPI stays neutral with regard to jurisdictional claims in published maps and institutional affiliations.