Article

Techno-Economic Analysis of a Process for the Aqueous Conversion of Corn Stover into Lactic and Levulinic Acid through Sn-Beta Catalysis

1
Department of Chemical and Biological Engineering, Iowa State University, Ames, IA 50011, USA
2
Department of Chemical Engineering, University of North Dakota, Grand Forks, ND 58202, USA
*
Author to whom correspondence should be addressed.
Processes 2021, 9(3), 436; https://doi.org/10.3390/pr9030436
Submission received: 3 February 2021 / Revised: 19 February 2021 / Accepted: 23 February 2021 / Published: 28 February 2021

Abstract

:
A readily available source for renewable fuels and chemicals is corn stover, which consists of the leftover stalks, leaves, husks, and cobs from the corn plant and makes up nearly half of the yield of a corn crop. Common practice is to pretreat it with sulfuric acid to break down the hemicellulose, releasing xylose, followed by enzymatic hydrolysis to convert the cellulose into glucose. Using a Sn-Beta catalyst, it is possible to convert these monomeric sugars into lactic, levulinic, formic, and acetic acids. This paper presents the results of a techno-economic analysis (TEA) of the commercial feasibility of producing these acids from corn stover. Two preliminary process designs were evaluated which represent two separate reaction yields: a balanced yield of both lactic and levulinic acids and the yields from a co-catalysis with CaSO4 to produce primarily lactic acid. Both process designs are scaled to process 230,000 MT/year of corn stover. An AACS Class 4 factored broad capital cost estimate and comparable estimates of operating costs and revenues were used to generate cash flow sheets to evaluate the economic feasibility of both options. The balanced product process has an estimated NPV@20% = $3.3 million ± 40%, while the CaSO4-facilited process has an NPV@20% = $110 million ± 40% (January 2019 basis). A major hurdle for both processes is the demand for levulinic acid. The balanced product process will produce 135% of the expected global demand and the CaSO4-facilitated alternative will meet 31% of the demand. For the demand to meet production, advances in levulinic acid applications are needed. However, the attractive economics suggest that these technologies warrant further development towards commercialization.

1. Introduction

Changes to the global environment have resulted in a concerted effort to transition away from petroleum as a feedstock for fuel and chemical production. Lignocellulosic biomass is a desirable alternative carbon source, as the world’s ability to produce lignocellulosic biomass is substantial. One of the most readily available sources in the United State is corn stover, which consists of the leftover stalks, leaves, husks, and cobs from the corn plant and makes up nearly half of the yield of a corn crop. These components are rich in structural carbohydrates, comprising about 60% of the dry weight (35.1% glucan and 19.5% xylan) [1]. The structural nature of corn stover makes it difficult to break down into sugars which can be used to produce renewable fuels and chemicals. Common practice for lignocellulosic materials such as corn stover is to pretreat them with sulfuric acid [2]. The acid breaks down the hemicellulose, releasing xylose, and makes the rest of the carbohydrates more accessible. Enzymes are then utilized to break apart the cellulose, releasing glucose [1].
Using a Sn-Beta catalyst, it is possible to convert the monomeric sugars (glucose and xylose) to more lucrative products such as lactic and levulinic acid as well as by-products such as formic and acetic acid [3,4,5,6]. The reaction of glucose follows one of two reaction pathways. The first is retro-aldol condensation, which splits the six-carbon sugar in the presence of a Lewis acid [7]. This produces two three-carbon trioses, which can both be isomerized to lactic acid [7]. As a side reaction, these trioses can decompose to acetic and formic acids [8]. Glucose can also triple dehydrate in the presence of a Brønsted acid into 5-hydoxymethylfurfural (5-HMF) [9]. In the presence of water, a 5-HMF molecule can rehydrate and form a five-carbon levulinic acid molecule and a one-carbon formic acid molecule [9]. Xylose, a pentose, is stoichiometrically limited to one lactic acid through retro-aldol condensation. Additionally, when dehydrated, xylose transforms into five-carbon furfural.
Lactic acid is a renewable chemical that can serve as an alternative to fossil fuel derivatives. It serves as a platform chemical in applications across a wide-range of industries including cosmetics, food, pharmaceuticals, and, most prominently, biodegradable plastics [10,11,12,13]. Traditional synthesis methods through fermentation have proven costly, making it difficult for its subsequent products to economically compete. More economical production can be achieved by chemical pathways, instead of biological. This is not optimal for its main application, polylactic acid (PLA), as it produces a racemic mixture of lactic acid. However, this mixture can still be used in biodegradable polymer production through intermediate conversion to acrylic acid or propylene glycol [12].
Initial studies found that optimum lactic acid yield was achieved using methanol as the reaction solvent [14,15]. This results in the formation of ester derivatives of the target products (i.e., methyl lactate instead of lactic acid). Production of these derivatives would require alternative uses for the end-products or subsequent conversion of the esters to carboxylic acids. An additional drawback of this pathway is that sugars are hydrolyzed from biomass in aqueous solutions. Thus, energy-intensive steps would be required to extract the sugars out of their water solution so they can be transferred to methanol, as well as to extract the methyl ester forms of the product acids out of the methanol solvent for use as products.
Our recent work [16] found that the addition of CaSO4 to aqueous reactions mixtures can result in lactic acid yields comparable to those achieved in methanol. This is due to sulfate ions present in the solution that help to neutralize Brønsted acid sites present on the surface of Sn-Beta. The loss of these sites suppresses the production of dehydration side-products. Additionally, calcium ions act as a second Lewis acid, acting in tandem with tin to improve the yield of the retro-aldol pathway. This results in a lactic acid yield of 68 wt% of the inlet carbon, significantly closer to the 75% yield obtained in methanol [15].
Levulinic acid has been a chemical of interest for many years due to its potential to be converted into valuable products such as γ-valerolactone (GVL), which can be used as a liquid solvent or as a transition chemical to other products. GVL has potential as a fuel additive, as it has shown similar properties to ethanol when mixed with octane [17]. Its chemical and physical properties give it applications as a green solvent since it is renewable, non-toxic, and biodegradable [18].
An industrial scale process was developed by Biofine Renewables to produce levulinic acid using the cellulose and hemicellulose in agricultural residues [19]. However, as with many chemical intermediates, the economics for large-scale production of levulinic acid as a primary product appear challenging. It may be more economical to produce levulinic acid as a co-product with another chemical product, such as lactic acid, that can generate a higher revenue stream. In our recent work [16], a balanced product suite consisting of 12 wt% lactic acid and 15 wt% levulinic acid (inlet carbon basis) was produced from a model corn stover-derived sugars solution using Sn-Beta for the catalytic sugar reactions. These data formed the basis for the work presented in this study.
This paper presents the results of a techno-economic analysis (TEA) of the commercial feasibility to utilize Sn-Beta-facilitated reactions to produce biorenewable chemicals from corn stover. Although extensive work has gone into understanding and optimizing the yield from Sn-Beta, the economics of the current state of the technology have not been evaluated [3,4,5,6,14,15,16]. Herein, two process designs are evaluated which represent the two separate reaction yields from Sn-Beta described above. The first uses optimized reaction conditions that produce a balanced yield of both lactic and levulinic acids. The second uses the co-catalysis of Sn-Beta and CaSO4 to almost exclusively produce lactic acid. Details on both reactions can be found in Kohler et. al. 2020 [16]. Both process designs are scaled to utilize 30 wt% of the corn stover produced from the quantity of corn fed to a typical corn ethanol plant located in the Upper Midwest of the U.S. The remaining 70 wt% of the harvested corn stover is typically recycled back into the soil for quality preservation [1]. This equates to about 230,000 metric tons (MT) of corn stover per year as feed to the process for both alternatives.

2. Materials and Methods

2.1. Reactive Extraction

To aid in designing the process’s separation steps, lab-scale reactive extraction experiments were conducted. Extraction used trioctylamine (TOA, 98% purity, EMD Millipore, Billerica, MA, USA) as the reactive extractant. It works by creating an ion-pair with the target organic acids. Isoamyl alcohol (98% purity, TCI America, Portland, OR, USA) or 1-octanol (99% purity, Fisher Scientific, Waltham, MA, USA) were used as active diluents to solvate the carboxylic acid-amine ion-pairs.
Each extraction experiment utilized 5.00 g of a carboxylic acid solution containing lactic, levulinic, acetic, and formic acids in water in a test tube. Acid concentrations were altered by mixing or diluting available solutions to meet the intended concentration. Trioctylamine was then added with either isoamyl alcohol or 1-octanol as the diluent to meet the intended extractant concentration and organic-to-aqueous phase ratio. Test tubes were then placed on an Innova model 40 shaker table (New Brunswick, Edison, USA) for the intended extraction time. The table was enclosed and the temperature closely controlled. After extraction, the solution was allowed to settle and separate. If the phases took more than ten minutes to separate, the sample was centrifuged for five minutes. The organic layer was then removed using a syringe.
Initial and final acid concentrations of the aqueous phase were quantified using high performance liquid chromatography (HPLC; Agilent Technologies 1200 series, Santa Clara, CA, USA). Separation occurred using an Agilent Hi-Plex H organic acid column with a mobile phase of 5 mM H2SO4. The HPLC operated at a mobile phase flow of 0.6 mL/min at 40 °C. A refractive index detector (G1362A: Agilent Technologies, Santa Clara, CA, USA) was used and measured each analyte for up to 75 min.
Extraction factors such as aqueous/organic phase ratio, initial acid composition, extractant concentration, extraction time, and extraction temperature were screened using a six factor, half factorial design (Resolution VI). Solvent loading, extractant concentration, and initial acid composition were found to have a statistically significant effect on distribution coefficients for the target acids and were further optimized using a central composite design of experiments. Relative effects of each variable for both designs were analyzed using Minitab™ software (NIST, v.18).

2.2. Design

A preliminary design for each process was created by identifying and approximating, using preliminary design techniques, the necessary process steps to transform corn stover into the target organic acids and the subsequent separation steps to obtain saleable purities. Temperature and pressure profiles were developed to estimate heat transfer and motive force requirements. Equipment sizing was estimated using Ulrich [20] and the ChemCadTM process simulation application. Corn stover hydrolysis design was based on current and target yields specified by the National Renewable Laboratory (NREL) [1,21]. In addition to equipment sizing, utilities and chemical requirements were also estimated. The process design was summarized and depicted in process flow diagrams.

2.3. Economic Analysis

A broad capital cost estimate was developed using an Association for the Advancement of Cost Engineers (AACS) Class 4 factored estimating method [22] at an accuracy of ±40%. Vendor estimates were obtained for compressors and rotary vacuum filters. All other equipment costs plus all of the estimating factors were estimated using cost charts in Ulrich [20] and used to calculate a total bare module cost. Contingency and fees of 18% of the total bare module cost were added to produce the total module cost. To account for building costs, site preparation, and offsite areas, an auxiliary factor of 30% of the total module cost was included to yield the fixed capital investment (FCI). The costs for the initial charge of solvents and catalysts and working capital (15% of FCI) were added to the FCI to yield a total capital investment (TCI).
In addition, revenues and operating costs were estimated at an equivalent level of accuracy. The unit prices of all products, raw materials, chemicals, and catalysts were calculated based on their historical price trend at the basis date of January 2019. When price history was unavailable, spot prices were used. The following additional operating expenses were estimated: operating labor, maintenance, utilities, wastewater treatment, and general allocated expenses. Utility costs were calculated for steam, cooling, and boiler feed water from prices estimated with correlations based on capacity and fuel cost found in Ulrich [20].
Profitability was calculated using a cash flow sheet method with an assumed facility operating life of 20 years. The fixed capital investment was spread across the preliminary project development schedule (Years −2 to 0). Initial solvent and catalyst expenses and working capital were applied immediately before operation (Year 0) and the working capital was recovered in the final year of operation (Year 20). Income tax requirements were estimated by calculating the gross profit (revenue less the operating costs). Depreciation based on a 17-year modified accelerated cost recovery system (MACRS) (full year convention) of the fixed capital investment was subtracted from the gross profit for each year of operation, yielding the federal taxable profit. Federal taxes were applied at the 2019 rate of 21%. State taxable profit was calculated as the federal taxable profit less the federal income tax. State tax was applied at the 2019 North Dakota rate of 4.31% [23]. Net profit after process commissioning (Years 1–20) was calculated as gross profit minus federal and state taxes. Annual net profits were discounted to year 0 using a hurdle rate (discount factor) of 20%. The NPV@20% was calculated as the sum of the discounted net profit of each year and the DCFROR was calculated by finding the hurdle rate at which the NPV@DCFROR = $0 (USD, United States Dollars).

2.4. Process Design Assumptions

  • Processes were designed as grassroot plants with a 20 year lifespan.
  • Designed processes have an operating factor of 95%.
  • Corn stover is available pre-milled at a mean size 5 mm and a density of 560 kg/m3.
  • Corn stover has an initial composition (dry wt%) of 35.1% glucan, 19.5% xylan, 15.8% lignin, 4.9% ash, 3.1% protein, 2.4% arabinan, 1.8% acetate, 1.4% galactan, 0.8% sucrose, 0.6% mannan, and 14.7% extractives [21]. The extractives component is a general term used to sum the initial composition of corn stover to 100% [21].
  • Deacetylation requires a sodium hydroxide loading of 17 mg/g dry biomass [21]. Sodium hydroxide is available in a 0.4 wt% solution with water [21].
  • Deacetylation removes 100% of water-soluble extractives, 88% of acetate, 75% of ash, 20% of lignin, and 2% of xylan from the initial corn stover [21].
  • Solids leaving the deacetylation reactor are assumed to be 20 wt% liquid and all are removed from the screw and recycled back to the reactor [21].
  • Acid hydrolysis requires a sulfuric acid loading of 9 mg/g of dry biomass. Sulfuric acid is diluted to 0.3 wt% in water [21].
  • At 160 °C and 560 kPa for 5 min, the acid hydrolysis reactor has a xylan conversion of 90 wt% to xylose, 5 wt% to furfural, and 2.4 wt% to xylose oligomers. The rates of glucan conversion are 9.9 wt% glucose, 3 wt% glucose oligomers, and 3 wt% HMF. Meanwhile, 100 wt% of the remaining acetate is converted to acetic acid.
  • Corn stover has a heat capacity of 1300 J/(kg-K) [24].
  • Heats of formation used are −1271 kJ/mol for glucose, −973 kJ/mol xylose, −484.5 kJ/mol for acetic acid, −425 kJ/mol for formic acid, −590 kJ/mol for lactic acid, −581 kJ/mol for levulinic acid, and −286 kJ/mol for water [25].
  • Enzymatic hydrolysis requires an enzyme loading of 10 mg/g of cellulose and operates at a residence time of 84 h [21].
  • Enzymatic hydrolysis has glucan conversions of 91.2 wt% to glucose and 4 wt% to glucose oligomers [21].
  • Since HMF is an intermediate of levulinic acid formation, it is assumed that all HMF produced from acid hydrolysis is converted to levulinic acid and formic acid with Sn-Beta.
  • Glucose and xylose are assumed to have 100% conversion in the Sn-Beta reactor. Sugars that are not converted into organic acid products are assumed to be hydrochar [26].
  • Hydrochar can be calcined off the catalyst using compressed air at 260 °C and 1800 kPa.
  • The target efficiencies of reactive extraction for both TOA and trimethylamine (TMA) extractors were 99% for all product acids.

2.5. Equipment Design Assumptions

  • Conveyors anticipated to stay within one process area were 15 m long. Conveyors anticipated to go between process areas were sized at 150 m in length. All conveyors were 0.61 m wide.
  • Pumps operate at 65% efficiency.
  • Compressors have a polytrophic efficiency of 75%.
  • Hold up time in a reflux drum is 450 s.
  • The height-to-diameter ratio used for reflux and hold up drums sizing was 2.
  • The liquid residence time for hold up drums is 5 min and the total drum volume is double the liquid space.
  • The liquid residence time for mixers is 5 min with a height to diameter ratio of 2.
  • Distillation columns were sized with sieve trays at a spacing of 0.61 m.
  • A 20 kPa pressure drop was assumed across all units with an additional 14 kPa for an anticipated control valve and 20 kPa for a mist eliminator.
  • A 70 kPa pressure drop was assumed for every 4 m of catalyst packing.
  • Trayed columns have pressure changes of 0.7 kPa per tray, with pressure decreasing with increased height. Other pressure drops for distillation columns include 100 kPa for feed above 9 m and 1 kPa for thermosyphon reboilers.
  • Interstage cooling systems for multistage compressors have a 14 kPa pressure drop across a heat exchanger and 7 kPa across a knockout drum.

2.6. Utility Assumptions

  • Steam grades produced in the auxiliary facilities include: low pressure steam at 148 °C and 450 kPa, medium-low pressure steam at 175 °C and 900 kPa, moderate pressure steam at 204 °C and 1700 kPa, medium-high pressure steam at 239 °C and 3300 kPa, and high pressure steam at 400 °C and 4500 kPa. All grades of steam are rated at their saturation pressures except for high pressure steam which is superheated.
  • Cooling and boiler feed water are produced in the auxiliary facilities at 30 °C and 310 kPa.

2.7. Economic Assumptions

  • Economic estimates were brought to a basis date of January of 2019 using CEPCI values of 400 and 616 for January 2004 and January 2019, respectively.
  • Annual maintenance costs were estimated as 4% of the fixed capital investment.
  • The fixed capital investment was depreciated over 17 years using the modified accelerated cost recovery system (MACRS).
  • Income tax rates were applied as 21% for Federal and 4.31% for State (North Dakota) [23].
  • A rough project completion schedule was estimated using a 30% design, 40% procurement, and 30% implementation rule of thumb. Procurement was based on the longest equipment lead time (14 months) with no overlap of project phases, yielding a total schedule of 36 months.
  • No royalties or patent fees are required for the process
  • Recycled solvents are replaced at a rate of 15% per year while solid catalysts and sorbents are replaced at a rate of 5% per year.
  • Solid catalysts and sorbents are completely changed-out every 4 years.
  • The loaded cost of an operator in a chemical plant in North Dakota is $30/h [27].
  • A natural gas price of $4.4/GJ was used in utility cost correlations [28].
  • The price of electricity was assumed to be the 2019 industrial rate in North Dakota, $0.0619/kWh [29]
  • The project hurdle rate (minimum acceptable rate of return) is 20%.

3. Results and Discussion

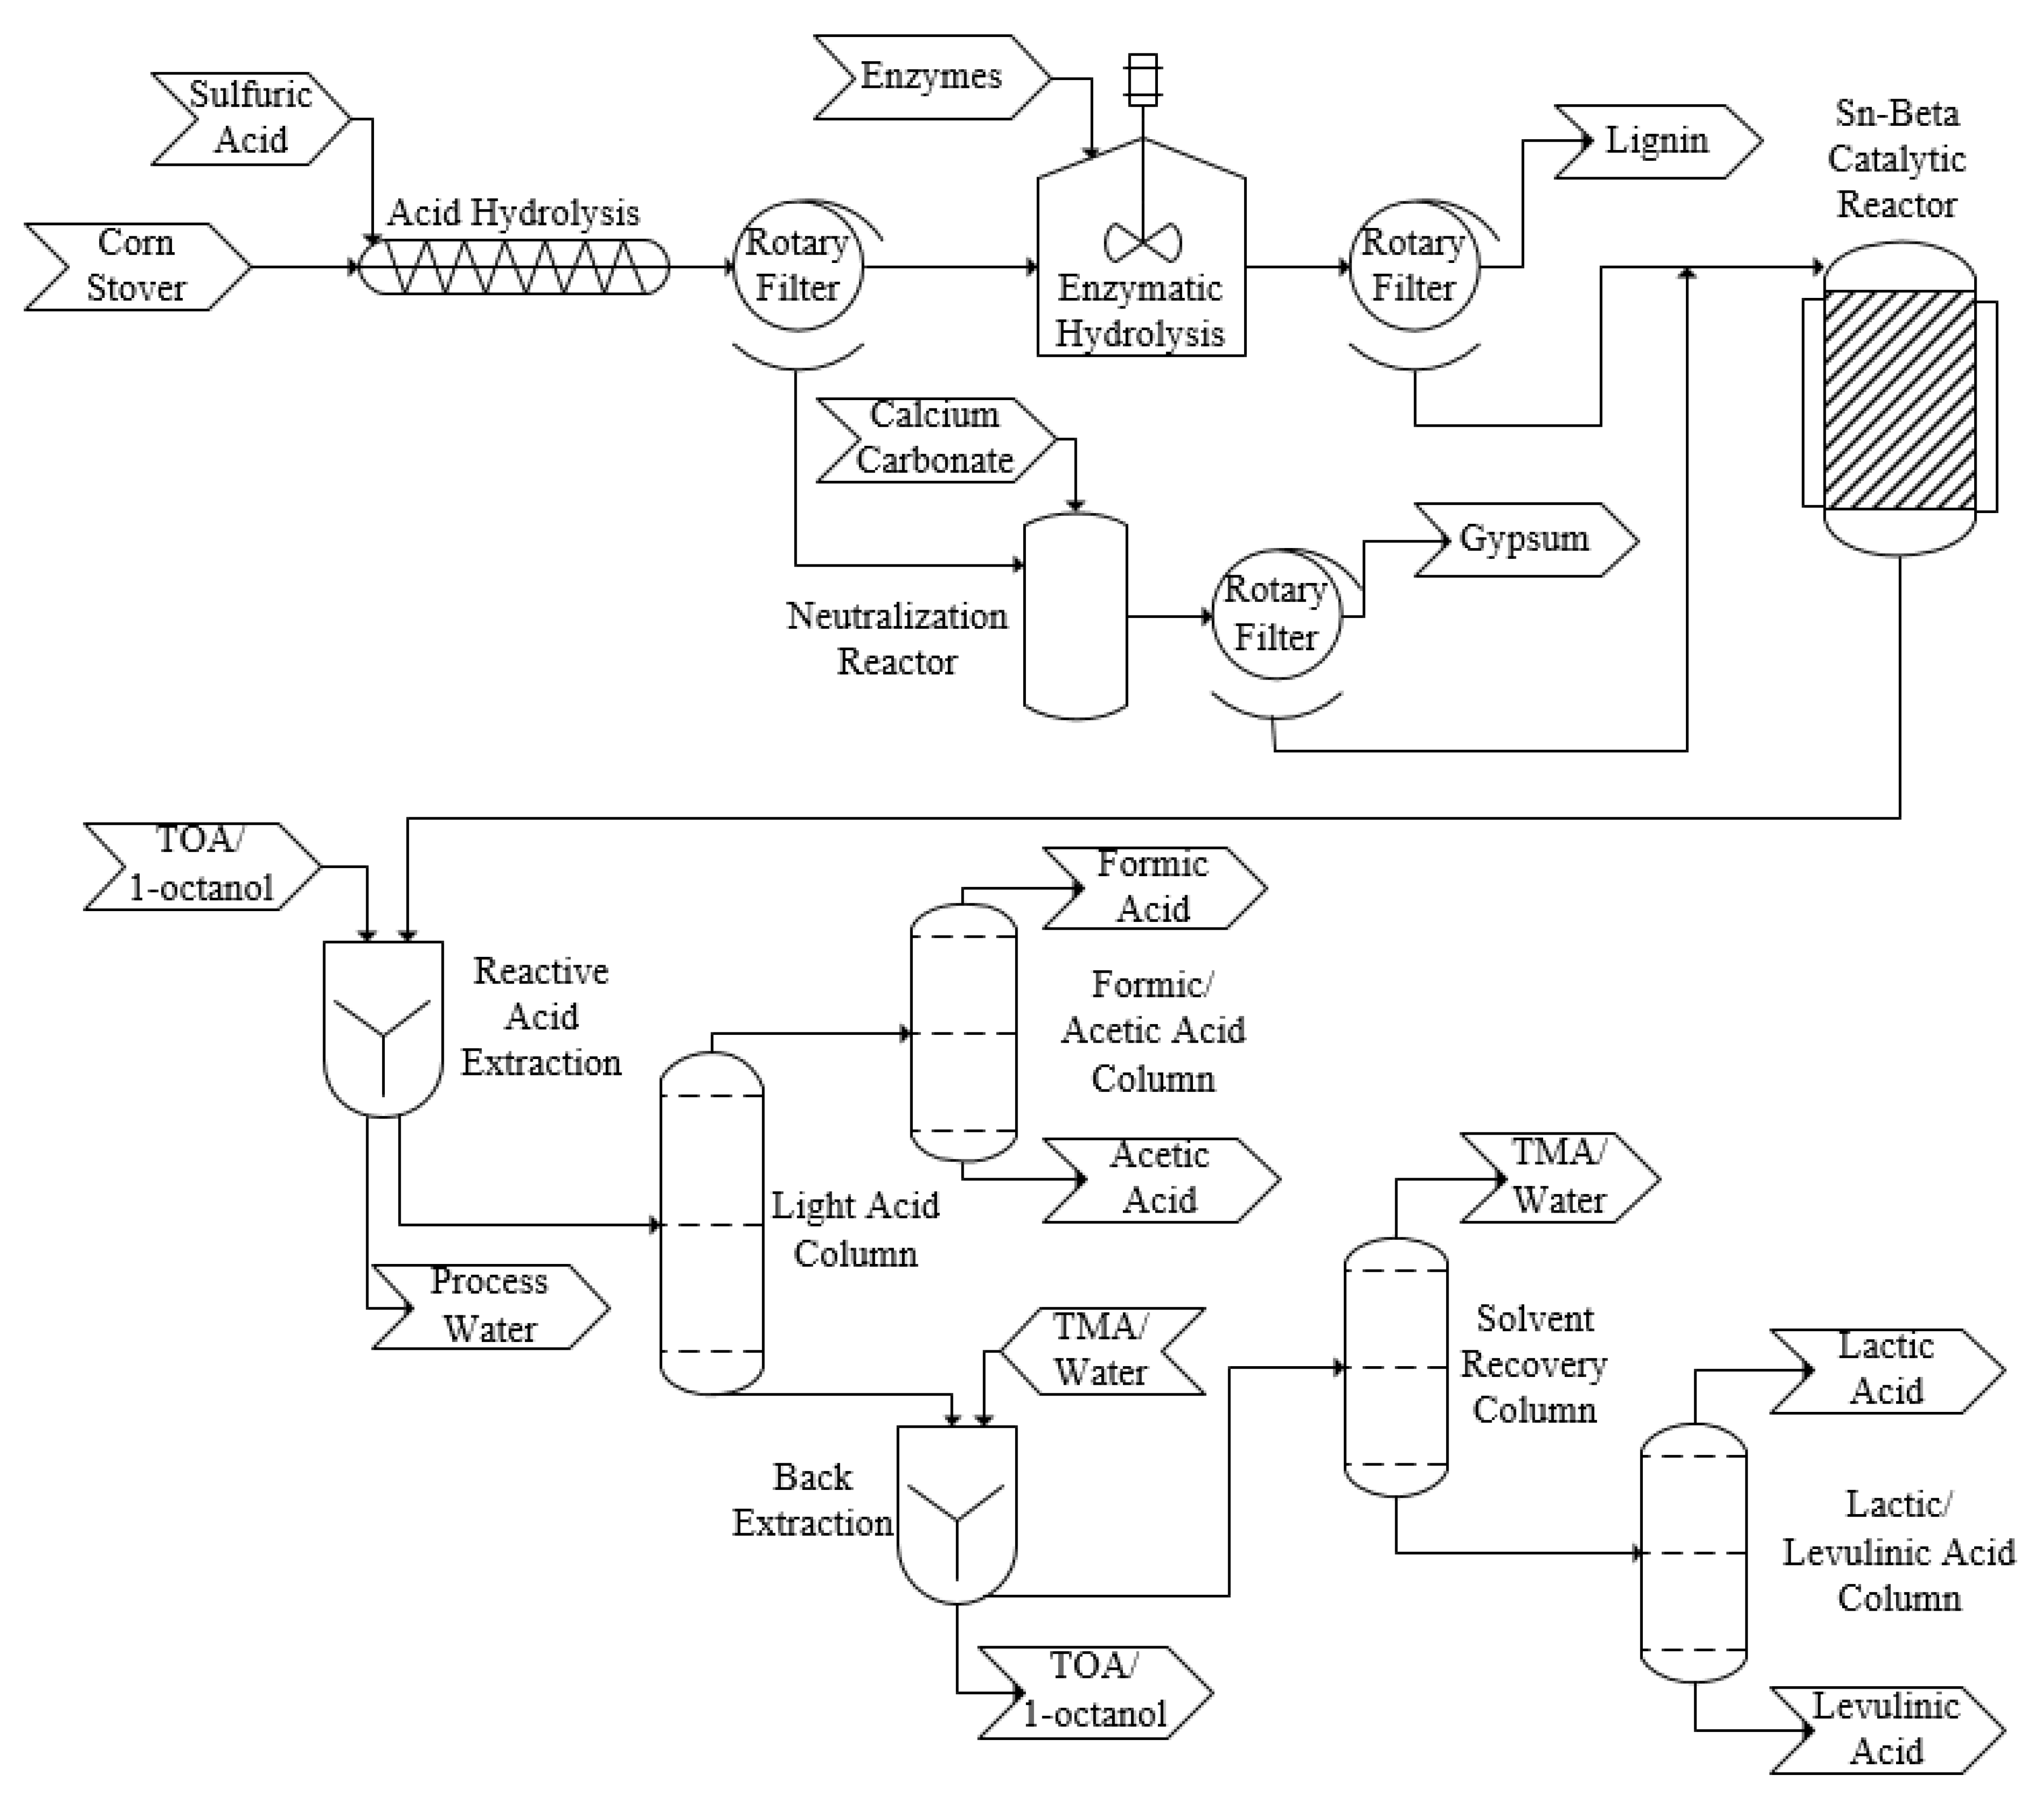
3.1. Process Design—Sugar Recovery and Conversion

The design was formulated using various data generated previously. The technology readiness levels for the various sections of the process are as follows:
  • Areas 01 and 02: Corn stover extraction, TRL 7—the technology has been demonstrated at the pilot scale level by the US DOE National Renewable Energy Laboratory (NREL).
  • Area 03: Catalytic reactions to convert corn stover, TRL 2—this design is based on novel research results from a recent study on reaction conditions in a lab-scale batch reactor.
  • Areas 04/05: Separation and purification, TRL 3—this design is based on new experimental data related to the solvent extraction steps.
Both processes were scaled to utilize the corn stover generated by farmers who sell their corn to a typical bioethanol plant in the US Midwest Corn Belt. This would allow for the utilization of existing distribution networks, ensuring proper supply of the raw material. A single bushel of corn (about 25 kg) produces about 10.6 L of ethanol [30] and every kg of harvested corn produces about 1.0 kg of corn stover [1]. Not all corn stover is usable, however, since 70% of it is required to remain in the soil for erosion control [1]. In North Dakota, the average nameplate capacity of a corn ethanol bio-refinery is about 360 million liters per year [31], making a process feed of about 230,000 MTs of corn stover per year.
An overview of both process alternatives can be seen in Figure 1. Both alternatives were split into five process areas. Process area 01 is the corn stover pretreatment area. Process area 02 is the glucose recovery area. Process area 03 is the Sn-Beta catalytic reaction area. Process area 04 is the acetic and formic acid purification area and process area 05 is the lactic and levulinic acid purification area. Complete process flow diagrams (PFDs) with more detailed information on both designs are provided in Supplementary Materials.
Equipment requirements for both process alternatives were similar, with the only functional difference originating in the addition of calcium sulfate before the catalytic reactor in the Sn-Beta + CaSO4 alternative. This addition significantly shifts the selectivity of the reaction to almost exclusively produce lactic acid. Reaction yields applied to both processes can be seen in Table 1 and were based on the experimental work described in Kohler et. al., 2020 [16]. Subsequent separation units in both process alternatives have identical functionality and are scaled to fit the differing reaction yields.
Process areas 01 and 02 are identical for both processes and are focused on the extraction and recovery of glucose and xylose from corn stover. Before being transferred on site, corn stover is assumed to be dried and milled to a mean size of 4–5.8 mm for efficient transportation (not shown). In process area 01, corn stover is fed into the process and initially treated with a 0.4 wt% sodium hydroxide solution [1]. This treatment acts primarily to remove acetate groups that are mostly included in the hemicellulose portion of the biomass. Removal of the acetate groups allows for easier access to the xylan in the subsequent acid hydrolysis step [2]. The xylan in the hemicellulose is then depolymerized with 0.3 wt% sulfuric acid in the acid hydrolysis reactor to produce xylose. The remaining corn stover solids are then removed and rinsed with process water in a rotary vacuum filter. The filtered acid hydrolysate is then neutralized with calcium carbonate, producing calcium sulfate.
The corn stover solids remaining after acid hydrolysis are routed to process area 02. Here, the corn stover solids are mixed with cellulase enzymes, which react with the cellulose portion of the solids, liberating glucose. This enzymatic hydrolysis occurs at a solids loading of 20 wt%, which is too high for the solution to be pumped. Therefore, the reaction is performed in a vertical continuous reactor allowing mixture transport by gravity. At a residence time of 24 h, the enzymes break down the solids enough for them to be pumped to a batch reactor. The remainder of the enzymatic reaction occurs in this reactor for an additional 60 h. This results in an overall 95 wt% conversion of inlet cellulose to glucose. The design for the first two process areas is consistent with target sugars yields from corn stover outlined by NREL for the catalytic conversion of sugars into hydrocarbons [21].
The sugars extracted by acid and enzymatic hydrolysis in process areas 01 and 02 are then combined in process area 03. For the Sn-Beta + CaSO4 alternative, calcium sulfate is added at this point to produce a saturated solution. The sugar solutions are then fed to multiple parallel Sn-Beta reactors where competing retro-aldol condensation and dehydration reactions produce lactic, levulinic, acetic, and formic acids. The reactors are designed for a reaction temperature of 200 °C and a residence time of 2 h.
It is of note that in our experimental work we observed a decreased product yield from biomass derived feeds when compared to model solutions at the same catalyst-to-sugars ratio in the reactor [16]. We hypothesize that this was due to the presence of ash from the biomass, which led to catalyst deactivation [32]. Therefore, we assumed (design assumption 6, noted above) that 75% of the ash is solubilized in the initial washing step in process area 01 [21], significantly mitigating this issue.
The balance of the carbon not specified in the reaction yields on Table 1 is assumed to be converted into hydrocar as a result of intra- and intermolecular dehydration of the sugars [26]. It is assumed that the hydrochar can be calcined off the catalyst with compressed air at 260 °C. To accomplish this, 2 of the 18 available reactors are offline at any time, allowing for continual catalyst regeneration. For a reactor to go offline, its outlet lactic acid concentration would have to drop below an acceptable standard, indicating subpar catalyst activity. Once this occurs, the reactor is then drained and fed with compressed air. The hydrochar on the catalyst is then calcined to carbon dioxide until completely removed. The reactor will then be reactivated once a separate reactor reached the minimum reaction conversion.
Also in process area 03, furfural generated as a side product through acid hydrolysis is removed from the process stream. This is accomplished through liquid-liquid extraction where furfural is extracted with toluene, which does not have any affinity for the produced carboxylic acids [33].

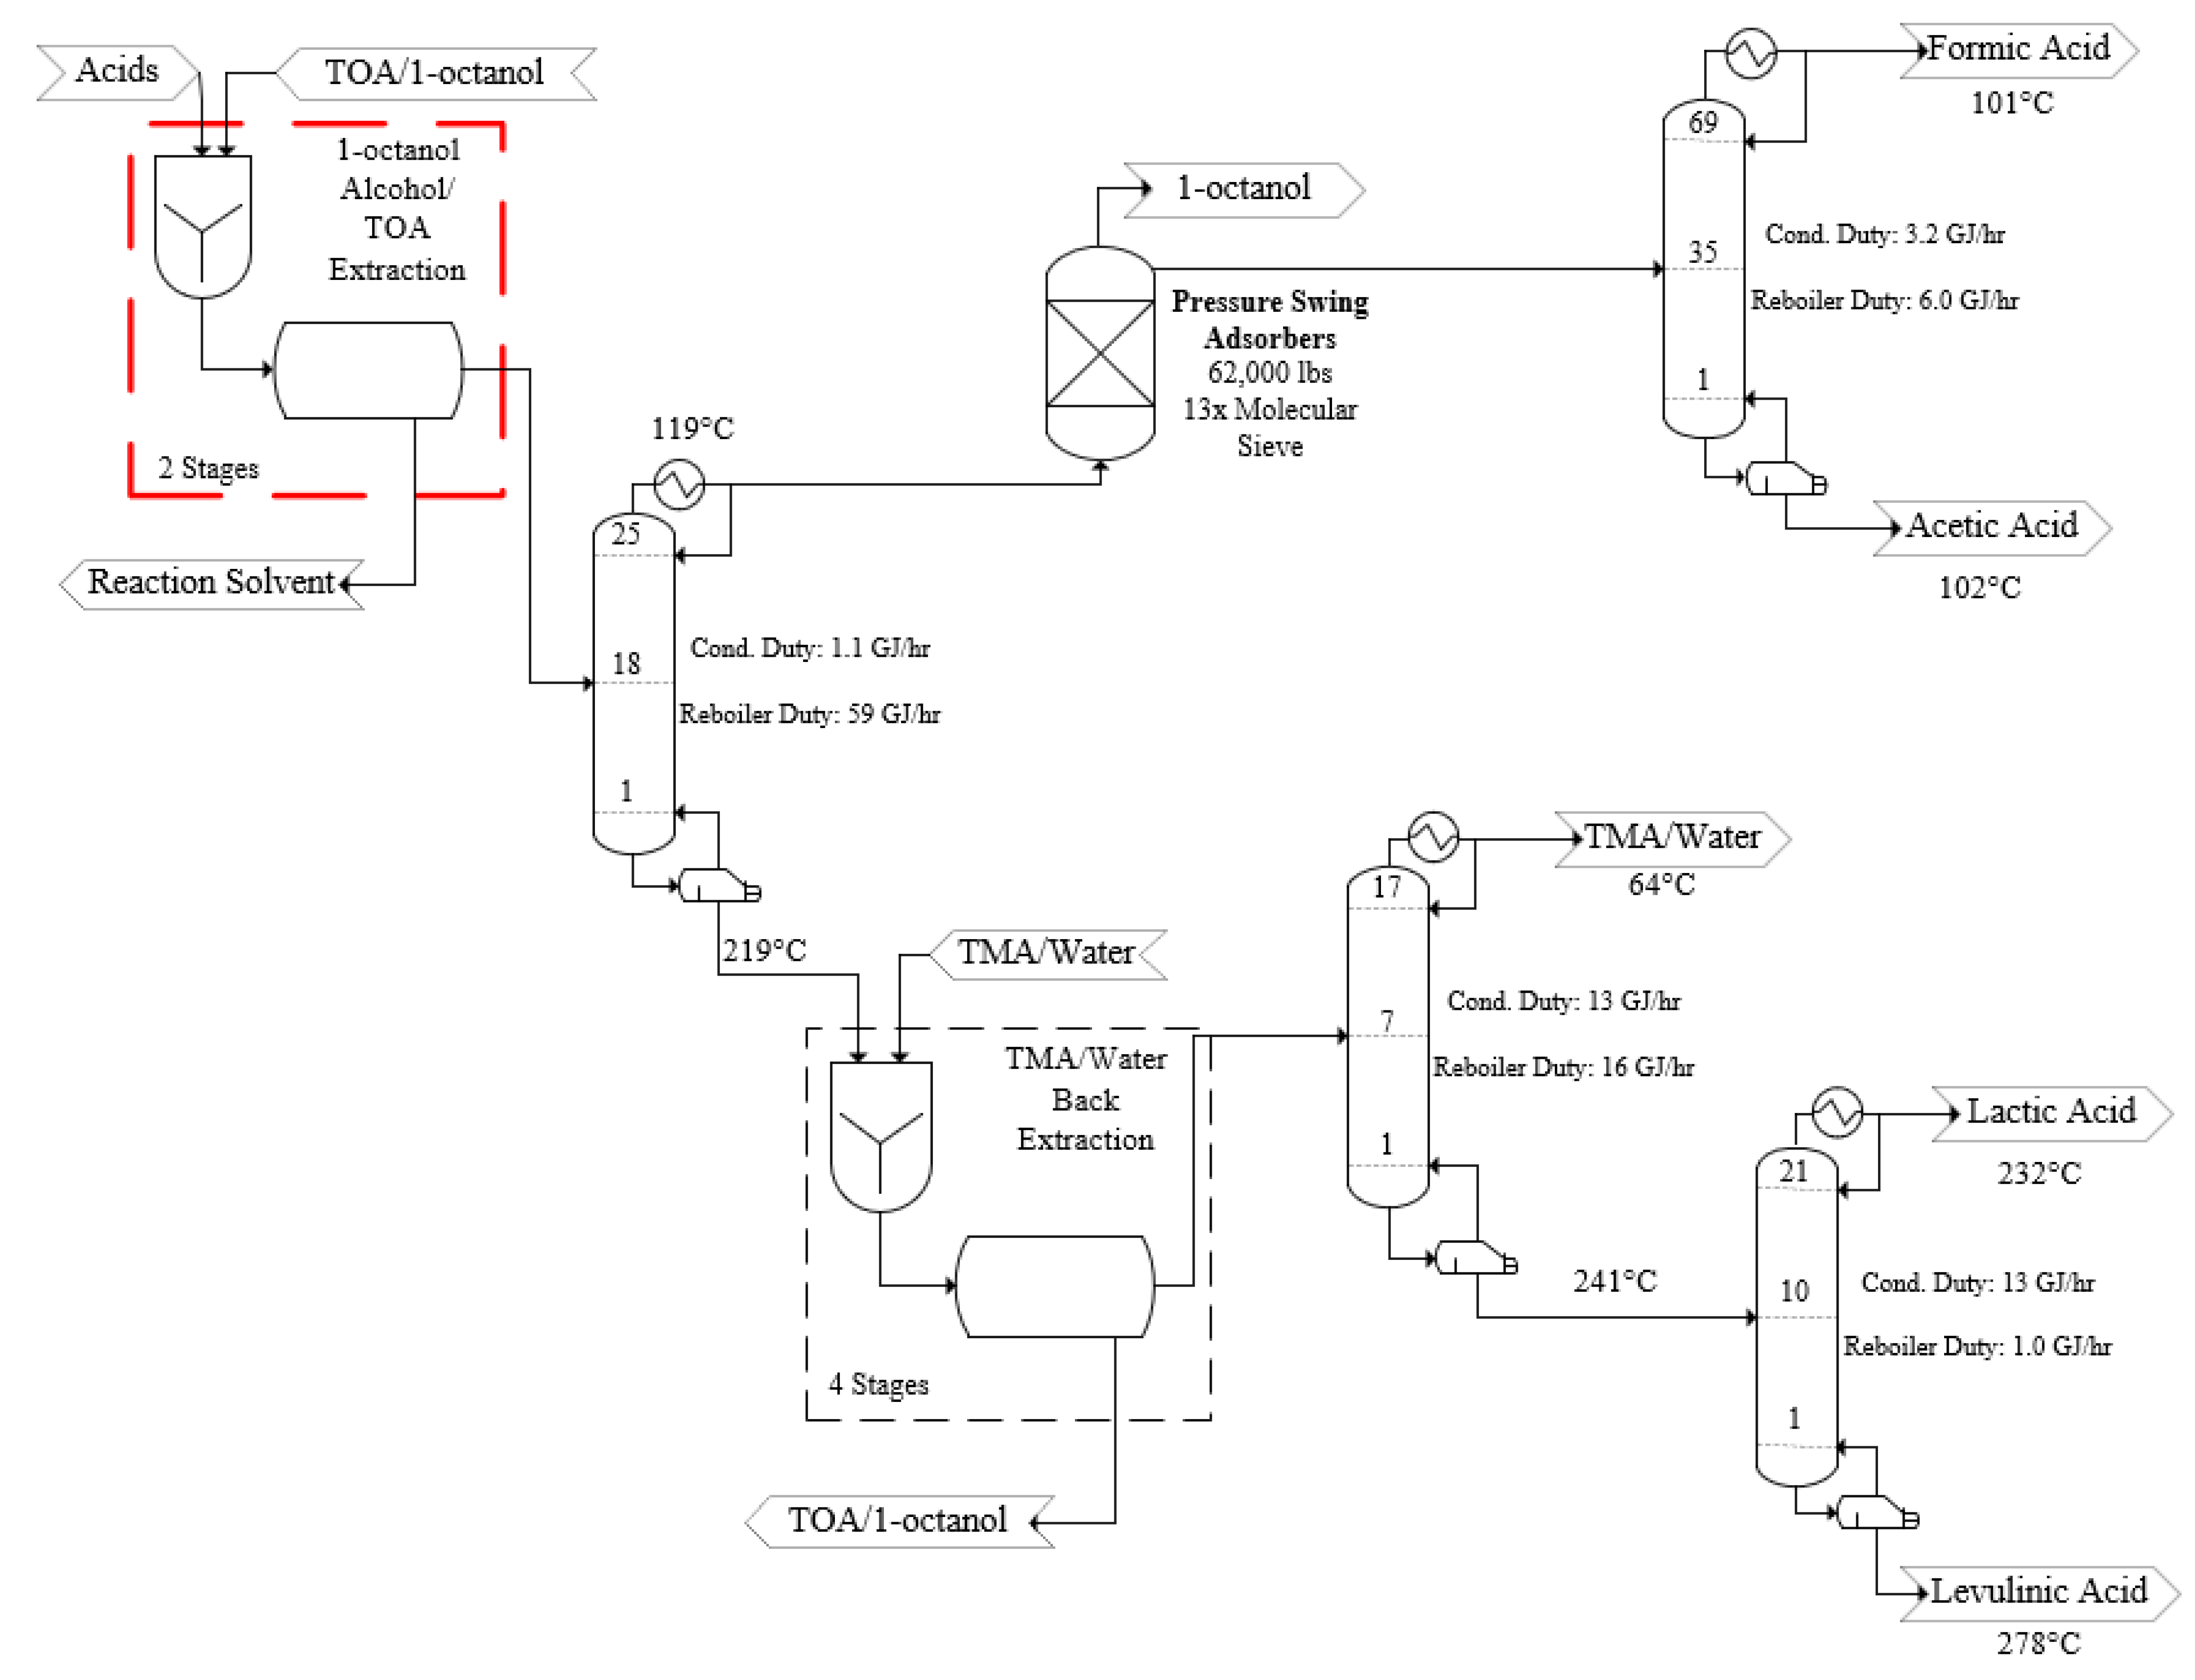
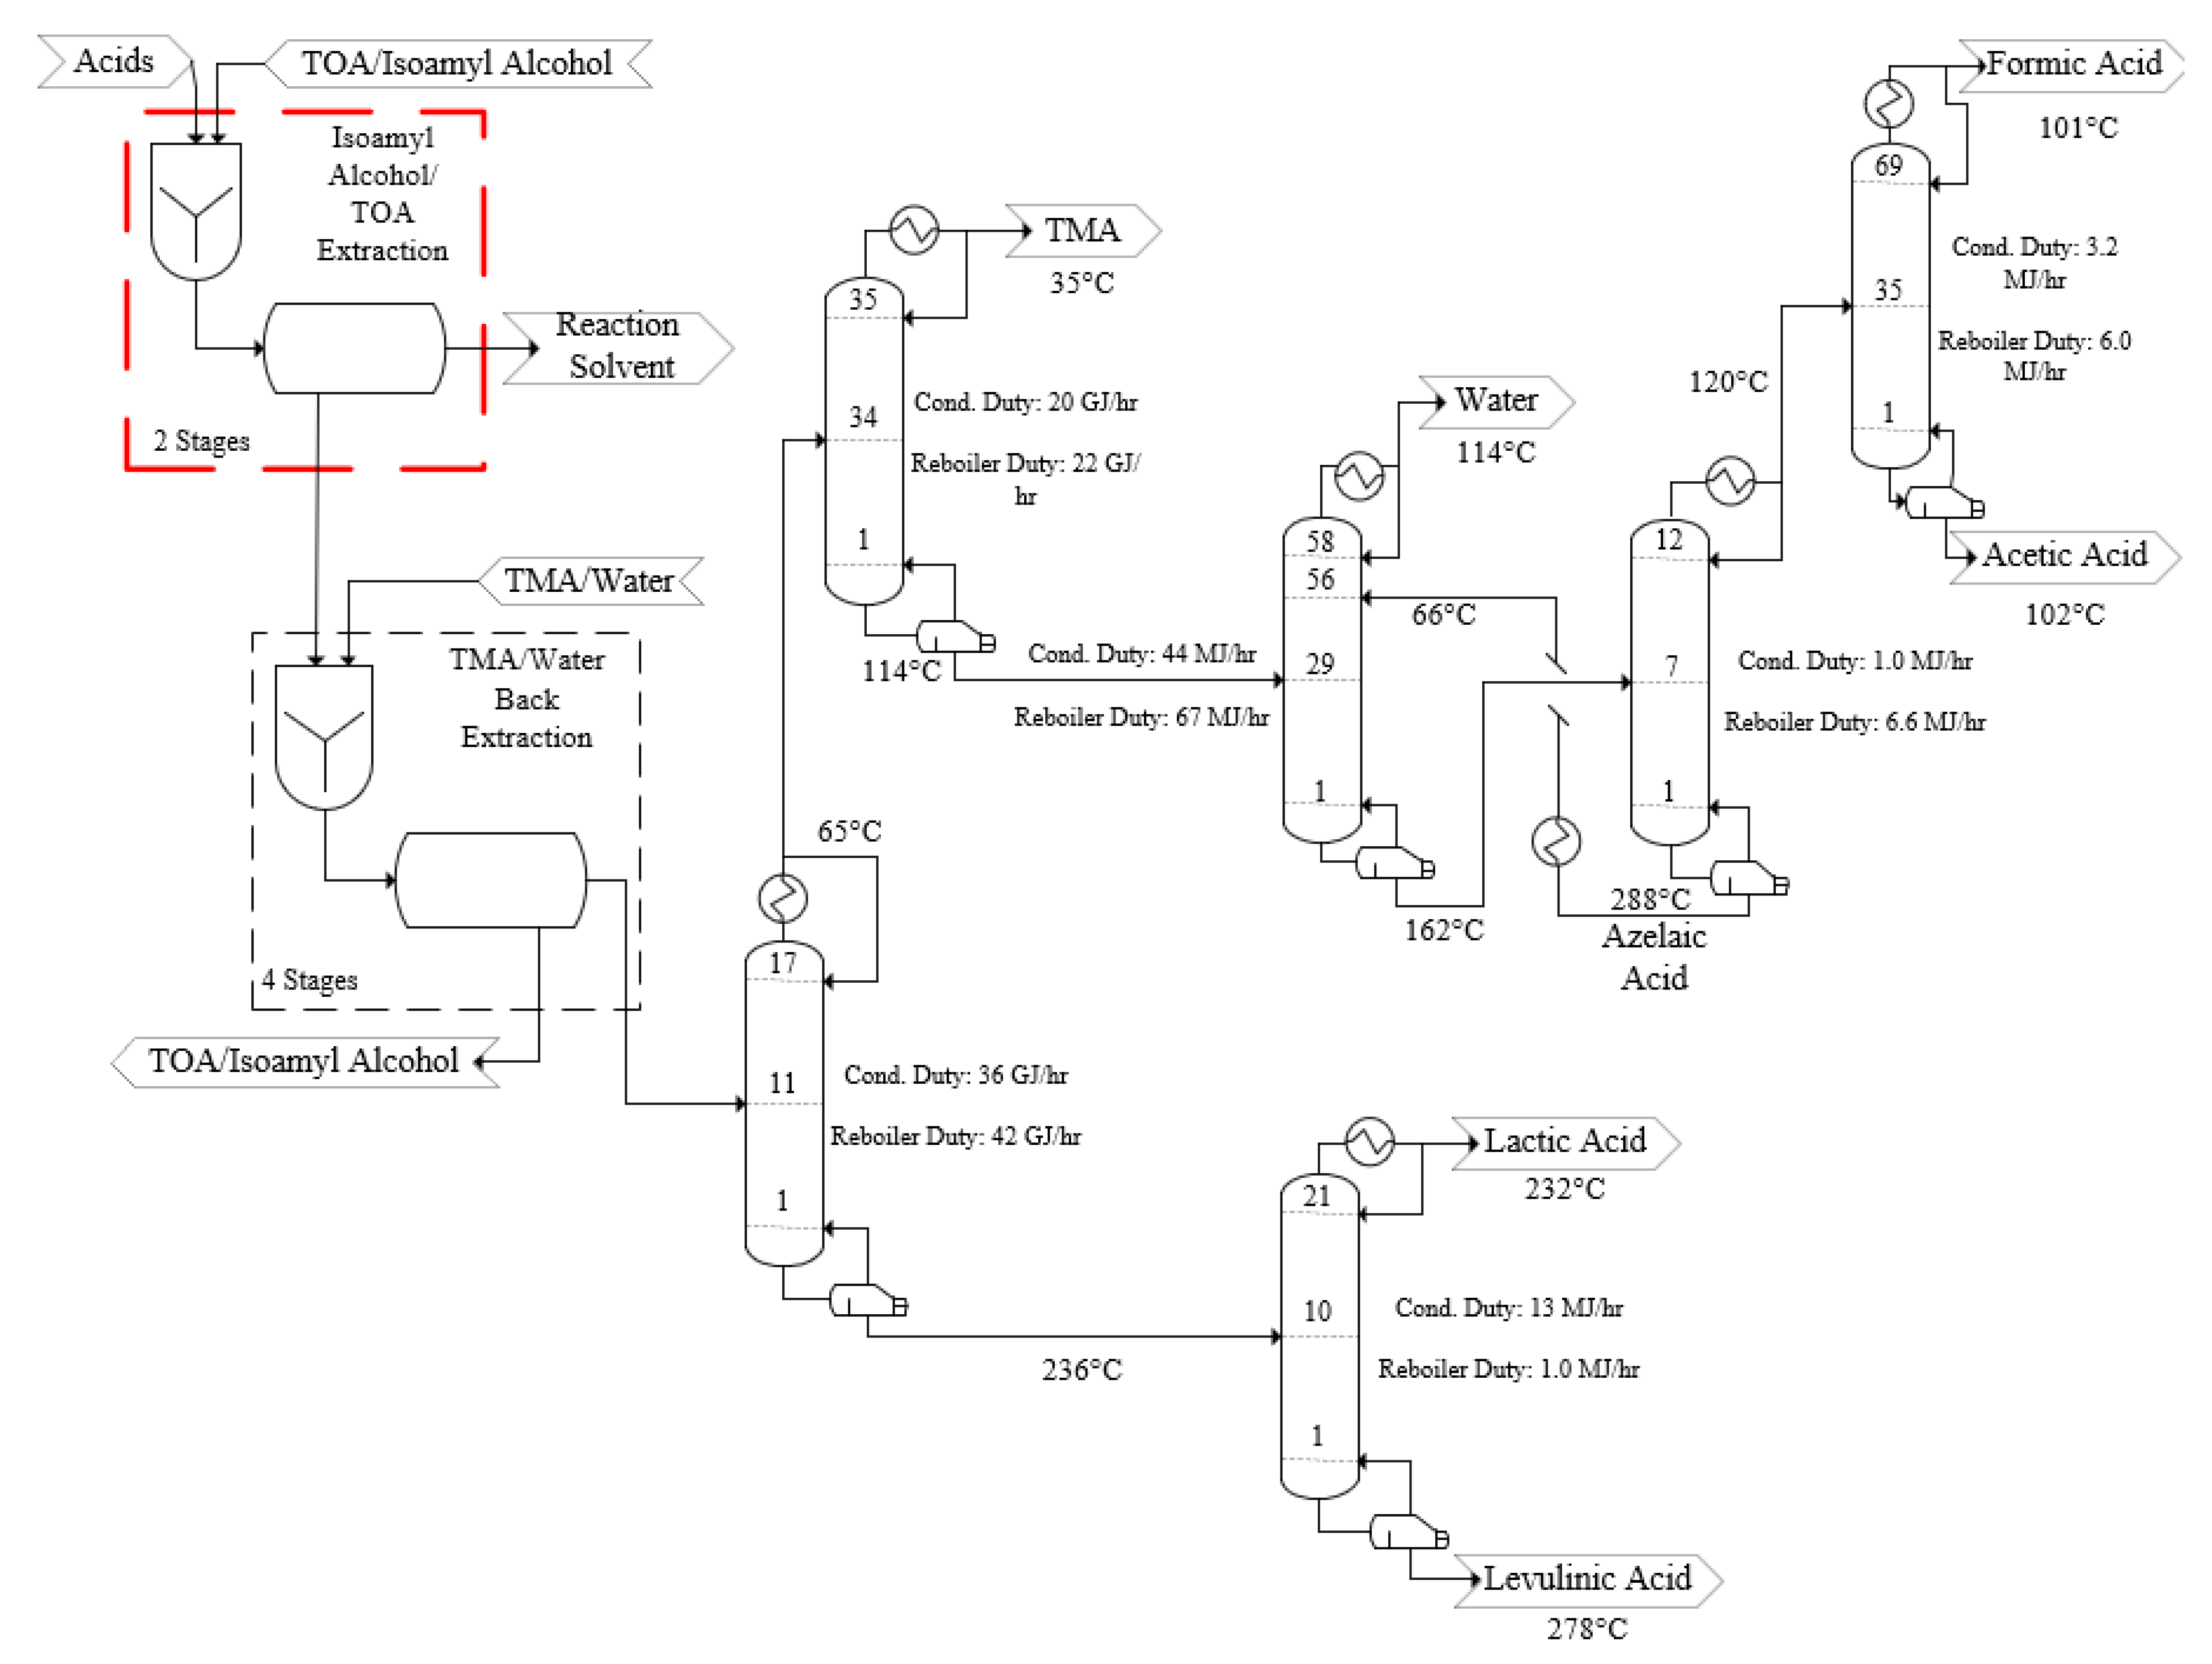
3.2. Process Design—Acid Recovery and Purification

In both alternatives, process areas 04 and 05 were designed to recover and purify the target acid products. The initial hurdle in product purification is to remove the water from the dilute acid stream (acid concentration is ~4 wt%). This can be done by reactive extraction where a basic tertiary amine can react with the carboxylic acids, yielding a non-polar ion pair [34,35,36]. The high viscosity and tension of these amines create transport limitations when used on an industrial scale [37]. To mitigate these limitations, a diluent can be added to improve its physical properties and aid in separation [37]. Though there is a general consensus on which amine extractant (trioctylamine, TOA) and diluents (C5–C10 alcohols) are most effective for extraction of these acids, consistent conditions for their co-extraction are not available [33,34,38,39].
To account for this lack of data, lab scale extraction experiments were conducted to determine the optimum conditions for co-extraction of lactic, levulinic, acetic, and formic acids in TOA diluted by one of two diluents, 1-octanol or isoamyl alcohol. Initially, four factors were screened for their effect on extraction: aqueous/organic phase ratio, extractant concentration, extraction time, and extraction temperature. Acid composition (specified as the lactic/levulinic acid ratio) was also screened to determine the effect of selectivity from the prior reaction on extraction effectiveness.
Based on the distribution coefficients (KD) of the acids, it was determined by the screening experiments that the most influential factors were: aqueous/organic phase ratio, extractant concentration, and acid composition. For diluents, isoamyl alcohol was significantly more efficient than 1-octanol. However, the high solubility of isoamyl alcohol in water, along with the similarity in boiling points of isoamyl alcohol and formic acid, raise downstream processing concerns. Thus, it was determined to study both diluents in further tests.
Optimization of the most influential factors occurred using two identical central composite designs. These designs were created to determine the conditions which yielded optimum co-extraction of the acids with 1-octanol and isoamyl alcohol as diluents, respectively. For co-extraction, more weight was given to the harder to extract acids (levulinic and acetic) when determining optimum conditions. The resulting conditions and distribution coefficients can be seen in Table 2.
Operating conditions for isoamyl alcohol as the diluent resulted in marginally better distribution coefficients and 25% lower organic phase requirements compared to 1-octanol. However, downstream separation would be much more challenging with isoamyl alcohol compared to 1-octanol. Simple process designs for both diluents, seen in Figure 2 and Figure 3, were created to weigh the economic costs of using each diluent as applied to the Sn-Beta + CaSO4 process alternative.
For both diluent processes, the extracted carboxylic acids are back extracted out of the non-polar amine mixture into a more volatile polar solvent for easier recovery. This can be accomplished by using a trimethylamine (TMA) in water mixture as the back extractant. TMA forms polar ion-pairs with the acids. One drawback of using a TMA/water mixture as the back extractant is that water forms azeotropes with both acetic and formic acid. When 1-octanol is used as the diluent for TOA in the initial extraction, acetic and formic acids can be distilled out of the non-polar acid-rich mixture prior back extraction, which is then only used to recover lactic and levulinic acid. Due to a formic acid/1-octanol azeotrope (98.5 mol% formic acid), size exclusion adsorption using a 13× molecular sieve can be used to remove any trace quantities of 1-octanol from the distillate product of this recovery step.
This separation is more complicated for isoamyl alcohol as it hindered by: (1) a more significant azeotrope with formic acid at atmospheric conditions (89.2 mol% at 98.2 °C) than 1-octanol and (2) a higher volatility than acetic acid. To ensure that TOA remains in the diluent, the acetic acid can be back extracted into TMA/water along with the lactic and levulinic acid. However, further purification is then hindered by an acetic acid/water azeotrope. To simplify this separation, the pre-extraction distillation step used in the 1-octanol alternative was eliminated so that both acetic and formic acids were back extracted to the TMA/water along with the other two acids. The ensuing azeotropes between these acids and water can then be broken through extractive distillation using azelaic acid.
The economic cost of these two processes was measured by the NPV@20%, which weighs the annual operating expenses and total capital investment over a 20-year life cycle (Table 3). The primary economic difference between the two processes was the investment required for the extractive distillation columns and their associated heat exchangers in the isoamyl process. This resulted in an incremental NPV@20% of $6.5 million in favor of the 1-octanol process.
Screening and optimization experiments occurred in carboxylic acid solutions that did not contain any calcium sulfate. The presence of calcium sulfate would decrease the acidity of the solution, and in turn, decrease the equilibrium constant for ion-pair formation. To account for these conditions, a cursory experiment was conducted to extract carboxylic acids produced using the Sn-Beta in a CaSO4 solution (Table 4). Doing so significantly lowered the distribution coefficients of all the target acids. The most significant drop occurred with lactic acid, which is likely due to a significant increase in its formation from the more favorable reaction conditions. The higher concentration coupled with lower solution acidity worked to reduce the equilibrium of ion-pair formation with TOA.
Applying this to the design of the Sn-Beta and Sn-Beta + CaSO4 processes, reactive extraction with TOA/1-octanol was utilized in process area 04 with the distribution coefficients specified in Table 4. Within that area, both acetic and formic acids are separated from the extract through distillation. The resulting acetic/formic acid distillate is then further distilled to reach the respective product grades. The remaining TOA/1-octanol extract is sent to process area 05 where lactic and levulinic acids are back extracted into TMA/water. Both solvents are regenerated and lactic and levulinic purified through distillation in the final process area.

3.3. Capital Cost Estimates

An AACE category 4 factored broad estimate [22] of capital costs was conducted based on equipment required for the process of pump size or larger. The condensed estimated capital costs can be seen in Table 5 and Table 6. These tables are condensed based on unit classification. The broadest of these classifications is process vessels which includes distillation columns and trays, drums, and mixing vessels. Table 5 and Table 6 also include the additional investments required as a part of the total capital investment at a basis date of January 2019. More detailed capital cost information can be seen in Tables S3 and S4 provided in Supplementary Materials.
Vendor estimates were obtained for compressors and rotary vacuum filters. Costs for the remaining capital equipment were estimated utilizing cost charts published by Ulrich [20]. These cost charts provided estimates at a basis date of 2004. To bring these estimates to a January 2019 basis, CEPCI values of 400 and 616 were used for 2004 and 2019, respectively.
Equipment requirements for the two process alternatives were nearly identical. Any differences were due to differences in product capacity due to the catalytic reaction yield. A major sizing difference that occurred between the two alternatives was for the catalyst calcination compressor due to increased hydrochar formation in the base Sn-Beta processes. Additional mixers and settlers were required for the Sn-Beta + CaSO4 process, since lower efficiency in the reactive extraction step requires three additional extraction stages. The fixed capital investment was estimated at $120 million ± 40% for base Sn-Beta and $130 million ± 40% for Sn-Beta + CaSO4.
Additional capital costs included working capital and the initial inventory of chemicals and catalysts. As a rule of thumb, the working capital was estimated to be 15% of the FCI. Costs were included for the initial inventories of 1-octanol, TOA, TMA, toluene, Sn-Beta, 13× molecular sieves, and water. Vendor quotes were obtained for TOA, TMA and 1-octanol, being valued at $8.49/kg, $2.64/kg, and $1.54/kg, respectively. Toluene was estimated to be priced at $1.17/kg [40]. Water was priced as demineralized water through Ulrich [20]. Based on the plant capacity for demineralized water, that price was estimated to be $0.55 per 100 kg [20]. Sn-Beta and 13× molecular sieves were priced as Silica/Alumina doped catalysts and zeolites in Ulrich, respectively [20]. Sn-Beta were then priced as $12.30/kg and 13× molecular sieves as $10.80/kg. The capital costs for the initial inventory of all chemicals and catalysts was valued at $2.1 million and $2.4 million for the base Sn-Beta and Sn-Beta + CaSO4 processes, respectively.
This slight difference is due to a higher acid product concentration in the Sn-Beta + CaSO4 process, resulting in a larger solvent requirement. Adding in working capital and the initial chemical and catalyst costs to the FCI, yielded a total capital investment (TCI) of $140 million ± 40% for base Sn-Beta and $150 million ± 40% for Sn-Beta + CaSO4.

3.4. Operating Cost Estimates

Annual operating costs can be seen in Table 7. This table provides a breakdown of the primary expenses that would be incurred for both process alternatives. Those expenses include: raw material costs, makeup chemical and catalyst costs, operating labor costs, maintenance costs, the costs for utilities and waste disposal, and other factors (R&D charges plus marketing and distribution charges). The average annual operating costs were estimated at $79 million and $80 million for the base Sn-Beta and Sn-Beta + CaSO4 processes, respectively, on a January 2019 basis.
This process utilizes one raw material: corn stover. Corn stover prices are currently around $64 per dry MT [21]. However, if corn stover were to be adopted as a commodity chemical for agricultural processing, NREL expects the price to increase to $88 per dry MT [21], which was the price used in this analysis. This cost is broken down to $38/MT attributed to collection, milling, storing, and transportation to the plant and $50/MT as a grower payment [1,21]. This results in a corn stover cost about $0.09/kg and an overall raw material cost of $21 million per year for both process alternatives.
Consumable chemicals and catalysts used for by both processes include sulfuric acid, calcium carbonate, cellulase enzymes, sodium hydroxide, and make-up amounts for the reusable chemicals and catalysts purchased as part of the TCI. Prices of sulfuric acid and calcium carbonate were estimated at spot prices of $0.33/kg and $0.11/kg, respectively. The cellulase enzymes used for enzymatic hydrolysis were estimated to cost about $3.52/kg. Sodium hydroxide was valued at $0.40/kg [40]. As a rule of thumb, all recycled chemicals were assumed to experience a yearly depletion of 15% via losses and/or degradation. These included 1-octanol, TOA, TMA, toluene and water, which were priced at $1.54/kg, $8.49/kg, $2.64/kg, $1.17/kg and $0.25/m3, respectively. Similar to the chemicals being recycled, catalysts and solid sorbents were assumed to have yearly losses of 5%. This loss is applicable to both Sn-Beta and 13× molecular sieves at $12.30/kg and 10.80/kg, respectively. Since the base material of both of these are zeolites, a total change out was forecast to be required every four years. For the base Sn-Beta process alternative, the total price for consumable chemicals and catalysts in a typical year was $4.5 million, with $660,000 of that being spent on make-up materials each year. The Sn-Beta + CaSO4 process alternative required $4.6 million in consumable chemicals a year with $700,000 required for make-up. This difference is due to the increased solvent requirement for product extraction in the Sn-Beta + CaSO4 process.
Operating labor requirements were based on the number and type of unit operations required for each process. Due to similar unit operation requirements, both processes were estimated to require 90 operators split between 4.5 shifts to provide for 24/7 coverage. A detailed explanation of this estimation can be found in Supplementary Materials. The loaded pay rate for a plant operator in North Dakota of $33.30 per hour was used [27]. Using a 40 h work week basis, the labor cost of this project was estimated at $7.2 million per year. This includes an extra 15% to account for supervisory wages.
Maintenance costs for both alternatives were estimated to be 4% of the FCI. This results in a yearly cost of $5.1 million for the base Sn-Beta process alternative and $5.2 million for the Sn-Beta + CaSO4 process alternative.
Utility requirements were calculated based on the usage of cooling water, boiler-feed water, process steam, and electricity throughout each process alternative. To minimize energy consumption, energy generated in the system was recycled as generated steam or heated water when possible. Additionally, all distillation columns were designed to minimize condenser and reboiler duties while maintaining an operable number of trays for the column. Unit costs of cooling water, boiler-feed water, and process steam were calculated using equations from Ulrich [20]. Each utility equation is based on a combination of the price of energy and capital requirements for utility production. Utility costs were estimated using the Wahpeton, North Dakota industrial rates of electricity, $0.062/kWh [29], and natural gas, $4.4/GJ [28]. The requirements of each utility can be found in Table 8 and sample cost calculations can be found in Supplementary Materials. Though used throughout both process alternatives, low (148 °C, 450 kPa) and medium low (175 °C, 900 kPa) pressure steam is not included in this table. This is because an excess of the two grades is produced through the vaporization of boiler-feed water used for cooling applications in many of the heat exchangers.
Between the two process alternatives, the biggest difference in utility costs results from differences in electricity requirements. This is due to higher hydrochar production in the base Sn-Beta alternative. As a result, more compressed air is required for catalyst calcination, leading to a larger compressor duty and subsequent higher use of compressor motor power. An additional difference is that the Sn-Beta + CaSO4 alternative requires more than double the high-pressure steam than the base Sn-Beta alternative. This is due to an increase in lactic acid, resulting in a higher reboiler duty for the TMA/water recovery column. Since the reboiler operates higher than the condensation point of high-pressure steam, the cooled utility is then used as medium-high-pressure steam, lowering its production requirement. Overall, the annual utility requirements were estimated to be $29 million for both process alternatives.
Black liquor wastewater produced through deacetylation needs to be treated before it is released. To do so, the stream will be treated through filtration and activated sludge. The sludge will be used to remove the carbonaceous matter (acetate and lignin) extracted from the corn stover. Based on the estimation equation from Ulrich [20] the processing of 120,000 kg/h of wastewater will be charged at a rate of $0.26/m3, totaling $280,000 per year. Due to the calcium sulfate dissolved in the reaction solvent, this solvent is also treated after the acid extraction step. Since both processes have calcium and sulfate concentrations exceeding emission standards, and these salts are not biodegradable, tertiary treatment is required [20]. For the base Sn-Beta process, 150,000 kg/h of water is estimated to require treatment at a cost of around $990,000 per year. For the Sn-Beta + CaSO4 process, part of this solvent is recycled to the catalytic reactor, resulting in only 130,000 kg/h being treated at $880,000 per year.
Other operating expenses include research and development, marketing and distribution, and general administration. Research and development expenses were estimated at 5% of the total operating expenses (including raw materials, chemicals and catalysts, operating labor, maintenance, and utilities). This resulted in a cost of $3.4 million for both process alternatives. Marketing and distribution fees were similarly calculated as 10% of the total operating expenses, resulting in $6.7 million and $6.8 million for base Sn-Beta and Sn-Beta + CaSO4 alternatives, respectively. General administration costs were estimated to be 25% of the overhead. Overhead is defined as 60% of the operating labor and maintenance expenses. General administration was estimated as $1.8 million for the base Sn-Beta alternative and $1.9 million for the Sn-Beta + CaSO4 alternative.

3.5. Revenues

Revenues for both process alternatives (Table 9) were generated by the sale of the produced organic acids and side-products as well as through recovered energy. Spot prices were applied to all six saleable products. These include lactic acid at $1.48/kg, acetic acid at $0.67/kg, formic acid at $0.68/kg, furfural at $1.65/kg, and gypsum at $0.04/kg [41,42,43,44]. Data obtained from a market study [43] indicated that the selling price for levulinic acid is $7.08/kg with a maximum global market demand of 11,000 kg/year. Since both processes would produce a significant portion of the global demand, the selling price of levulinic acid was reduced to $5.00/kg to match the anticipated flooding of the market. Sales of products are expected to produce $123 million and $191 million in annual revenue for the Sn-Beta and Sn-Beta + CaSO4, respectively.
In addition to revenue from the products, two operating credits also generate significant revenue. The first is the saturated water credit. This credit is available because both process designs produce more low-pressure steam than is consumed in the process. To avoid the production of useless steam, it was decided to use boiler-feed water rather than cooling water to cool the process stream before furfural extraction and to then heat it to just below its saturation point with the excess steam. The saturated water is then sent to the utility boiler to produce the grades of steam that are not in excess. Heating the water to its saturation point consumes about 21% of the energy required to make this steam. This energy recovery saves $3.2 million and $3.5 million per year for the two respective process alternatives in steam production costs and is represented as a revenue instead of just reducing the steam utility costs.
The other credit is the lignin energy credit. After corn stover hydrolysis, a lignin-rich stream is produced. Instead of disposing of the lignin, it is sent to the utility boiler to generate heat in place of natural gas. By burning 5500 kg/h of lignin, over 110 GJ/h is produced. Since natural gas costs $4.4/GJ, lignin energy generation saves about $4.2 million per year for both process alternatives. Sample calculations for both of these operating credits can be seen in Supplementary Materials. Including the credits, the total annual revenue is $140 million and $200 million for the Sn-Beta and Sn-Beta + CaSO4 alternatives, respectively.

3.6. Overall Profitability

Cash flow sheets for the two process alternatives can be seen in Table 10 and Table 11 and indicate the overall process profitability of each. On the basis of a 20-year projected operating life, the base Sn-Beta process alternative has an estimated NPV@20% = $3.3 million ± 40%, while the Sn-Beta + CaSO4 process alternative is projected to be valued at an NPV@20% = $110 million ± 40% at a January 2019 basis date. An NPV@20% greater than $0 indicates that the process exceeds the minimum discounted rate of return of 20%.
The primary difference between the two alternatives is the amount of revenue generated annually. The Sn-Beta + CaSO4 alternative is estimated to produce $33 million/year more in revenue than the base Sn-Beta alternative. This difference is directly related to the efficiency of the Sn-Beta catalytic reaction, where the Sn-Beta + CaSO4 converts almost twice as much carbon into saleable products than the base Sn-Beta (72% to 37%). This difference is partially offset by the higher selling price of levulinic acid, though its annual revenue is capped by a lower market demand.

3.7. Sensitivity Analysis

The largest source of economic variability for both processes is the gross margin. In this case, the gross margin is defined as the difference between the revenue generated from products and the cost of the raw material. Based on product yields and spot prices (specified in Section 3.6), the basis gross margin is $0.42 and $0.56 per kilogram of corn stover processed for the base Sn-Beta and Sn-Beta + CaSO4 alternatives, respectively. For the base Sn-Beta case, the process would no longer be profitable if the gross margin decreased by 1% to $0.41/kg of corn stover. As seen in Figure 4, a 20% decrease in the gross margin to $0.45/kg of corn stover would be required for the Sn-Beta + CaSO4 alternative to no longer be profitable. Since both processes break even within the ±40% accuracy of the economic analysis, the basis gross margin represents a relevant economic risk that should be explored via a marketing study if either of these process pathways is developed further.
The economic sensitivity of two other economic variables, fixed capital investment (FCI) and natural gas price (representing the cost for utility energy sources), were also evaluated for both processes. An increase in the FCI for the base Sn-Beta case by 3% from $124 million to $127 million results in a negative NPV@20%. However, for the Sn-Beta + CaSO4 alternative, a 72% increase in the basis FCI, which is outside of the range of most probable uncertainty (40%), would be required for the process to no longer breakeven. The price of natural gas was varied as a reflection of utility production costs. A positive NPV@20% was estimated for the entire region of uncertainty for both process alternatives, indicating that utility costs are not an economic risk to this investment.

4. Summary and Conclusions

The objective of this study was to determine the feasibility of catalytically transforming corn stover-derived sugars into lactic acid or both lactic and levulinic acids as primary products. While previous studies on Sn-Beta-facilitated conversion have documented reaction conditions, the economics of a process based on this technology has not been previously evaluated. Two separate process alternatives were examined. We first evaluated the conversion of extracted sugars to carboxylic acids solely through the use of Sn-Beta. This resulted in the co-production of lactic and levulinic acid as major products. The second process included calcium sulfate as part of the reaction mixture, significantly increasing the reaction selectivity towards lactic acid. Both process alternatives produced other valuable by-products that are worth purifying to a sellable grade, such as formic and acetic acid, calcium sulfate, and furfural. Process plant throughput was determined by feeding the corn stover equivalent to corn kernel feed in a typical bioethanol plant. This set the input of both processes at 250,000 tons of corn stover per year.
Process separation steps utilized reactive extraction to remove carboxylic acids from the reaction solutions. To define optimal conditions for the co-extraction of lactic, levulinic, acetic, and formic acids, both screening and optimization experiments were conducted. Based on the screening experiments, it was determined that the most significant factors are the aqueous/organic phase ratio, extractant concentration, acid composition, and diluent type. Optimal conditions for both examined diluents, 1-octanol and isoamyl, were determined using a central composite design. Based on these conditions, it was determined that extraction with a 1-octanol diluent was more economical based on the simpler downstream separation requirements.
It was found that both processes were profitable with the base Sn-Beta design being valued at an NPV@20% of $3.3 million while the Sn-Beta + CaSO4 design reached an NPV@20% of $110 million. The lower profitability of the base case is due to the lower carbon conversion of carbohydrates to saleable carboxylic acid products. For the base case to be more profitable, levulinic acid would need to be sold at a price $5.39/kg higher than that of lactic acid. The economics for both alternatives are sensitive to the gross profit margin, and the base case is also sensitive to the capital investment. Neither alternative was sensitive to utility production costs.
A major hurdle for both processes is market demand for the levulinic acid co-product. Though global demand for levulinic acid is expected to increase in the coming years, the global demand in 2020 was expected to be only 7300 MTs with growth up to 11,000 by 2025 [43]. The base Sn-Beta alternative will produce 135% of the expected global demand in 2025 and the Sn-Beta + CaSO4 alternative will meet 31% of the demand. For demand to meet projected future production based on the technologies evaluated in this work, advances in levulinic acid applications are needed. One potential application is to convert levulinic acid into other intermediate chemicals with greater market demand [45].

Supplementary Materials

The following are available online at https://www.mdpi.com/2227-9717/9/3/436/s1, Table S1: Major Equipment List for the Base Sn-Beta Process, Table S2: Equipment for the Sn-Beta + CaSO4 Process, Figure S1: Base Sn-Beta Process Drawing, Figure S2: Process Drawings for the Sn-Beta + CaSO4 Alternative, Table S3: Capital Cost Summary for Base Sn-Beta Process, Table S4: Capital Cost Summary for Sn-Beta + CaSO4 Process. Contains supplementary material that provides additional detail for the economic analyses summarized in the body of the paper.

Author Contributions

A.K. contributed to the initial techno-economic analysis, performed all experimental and analytical work, updated the techno-economic analysis based on the experimental work, and was the primary writer of this paper. W.S. provided overall management and review of all work leading to this article and assisted in the writing of the text. C.S., C.B. and J.D. contributed to the initial techno-economic analysis. All authors have read and agreed to the published version of the manuscript.

Funding

This research was funded by the North Dakota Corn Council under UND grant number UND-0023576.

Acknowledgments

The authors would like to thank Dave Hirschmann for his support of the experimental work activities and Ian Foerster for provided advice and guidance for all aspects of the project.

Conflicts of Interest

The authors declare no conflict of interest.

References

  1. Humbird, D.; Davis, R.; Tao, L.; Kinchin, C.; Hsu, D.; Aden, A.; Shoen, P.; Lukas, J.; Olthof, B.; Worley, M.; et al. Process Design and Economics for Biochemical Conversion of Lignocellulosic Biomass to Ethanol (Report No. TP-5100-62498); National Renewable Energy Laboratory and Harris Group Inc.: Golden, CO, USA, 2011. [Google Scholar] [CrossRef] [Green Version]
  2. Lloyd, T.A.; Wyman, C.E. Combined sugar yields for dilute sulfuric acid pretreatment of corn stover followed by enzymatic hydrolysis of the remaining solids. Bioresour. Technol. 2005, 96, 1967–1977. [Google Scholar] [CrossRef]
  3. Hammond, C.; Conrad, S.; Hermans, I. Simple and Scalable Preparation of Highly Active Lewis Acidic Sn-beta. Angew. Chem. Int. Ed. 2012, 51, 11736–11739. [Google Scholar] [CrossRef]
  4. Holm, M.S.; Saravanamurugan, S.; Taarning, E. Conversion of Sugars to Lactic Acid Derivatives Using Heterogeneous Zeotype Catalysts. Science 2010, 328, 602–605. [Google Scholar] [CrossRef] [Green Version]
  5. Sun, Y.; Shi, L.; Wang, H.; Miao, G.; Kong, L.; Li, S.; Sun, Y. Efficient production of lactic acid from sugars over Sn-Beta zeolite in water: Catalytic performance and mechanistic insights. Sustain. Energy Fuels 2019, 3, 1163–1171. [Google Scholar] [CrossRef]
  6. Yang, X.; Zhang, Y.; Zhou, L.; Gao, B.; Lu, T.; Su, Y.; Xu, J. Production of lactic acid derivatives from sugars over post-synthesized Sn-Beta zeolite promoted by WO3. Food Chem. 2019, 289, 285–291. [Google Scholar] [CrossRef]
  7. Taarning, E.; Saravanamurugan, S.; Holm, M.S.; Xiong, J.M.; West, R.M.; Christensen, C.H. Zeolite-Catalyzed Isomerization of Triose Sugars [Article]. ChemSusChem 2009, 2, 625–627. [Google Scholar] [CrossRef]
  8. Xia, M.; Dong, W.J.; Gu, M.Y.; Chang, C.; Shen, Z.; Zhang, Y.L. Synergetic effects of bimetals in modified beta zeolite for lactic acid synthesis from biomass-derived carbohydrates. RSC Adv. 2018, 8, 8965–8975. [Google Scholar] [CrossRef]
  9. Acharjee, T.C.; Lee, Y.Y. Production of Levulinic Acid from Glucose by Dual Solid-Acid Catalysts. Environ. Prog. Sustain. Energy 2018, 37, 471–480. [Google Scholar] [CrossRef]
  10. Conn, R.E.; Kolstad, J.J.; Borzelleca, J.F.; Dixler, D.S.; Filer, L.J.; Ladu, B.N.; Pariza, M.W. Safety assessment of polylactide (pla) for use as a food-contact polymer. Food Chem. Toxicol. 1995, 33, 273–283. [Google Scholar] [CrossRef]
  11. Datta, R.; Henry, M. Lactic acid: Recent advances in products, processes and technologies—A review. J. Chem. Technol. Biotechnol. 2006, 81, 1119–1129. [Google Scholar] [CrossRef]
  12. Hara, M.; Nakajima, K.; Kamata, K. Recent progress in the development of solid catalysts for biomass conversion into high value-added chemicals. Sci. Technol. Adv. Mater. 2015, 16, 034903. [Google Scholar] [CrossRef]
  13. Lim, L.T.; Cink, K.; Vanyo, T. Processing of Poly(Lactic Acid). In Poly(Lactic Acid): Synthesis, Structures, Properties, Processing, and Applications; Auras, R., Lim, L.T., Selke, S.E.M., Tsuji, H., Eds.; John Wiley & Sons: Hoboken, NJ, USA, 2010. [Google Scholar] [CrossRef]
  14. Holm, M.S.; Pagan-Torres, Y.J.; Saravanamurugan, S.; Riisager, A.; Dumesic, J.A.; Taarning, E. Sn-Beta catalysed conversion of hemicellulosic sugars. Green Chem. 2012, 14, 702–706. [Google Scholar] [CrossRef]
  15. Tolborg, S.; Sadaba, I.; Osmundsen, C.M.; Fristrup, P.; Holm, M.S.; Taarning, E. Tin-containing Silicates: Alkali Salts Improve Methyl Lactate Yield from Sugars. Chemsuschem 2015, 8, 613–617. [Google Scholar] [CrossRef] [PubMed]
  16. Kohler, A.; Seames, W.; Foerster, I.; Kadrmas, C. Catalytic Formation of Lactic and Levulinic Acids from Biomass Derived Monosaccarides through Sn-Beta Formed by Impregnation. Catalysts 2020, 10, 1219. [Google Scholar] [CrossRef]
  17. Horvarth, I.T.; Mehdi, H.; Fabos, V.; Boda, L.; Mika, L.T. Gamma-Valerolactone—A sustainable liquid for energy and carbon-based chemicals. Green Chem. 2008, 10, 238–242. [Google Scholar] [CrossRef]
  18. Fegyverneki, D.; Orha, L.; Lang, G.; Horvath, I.T. Gamma-valerolactone-based solvents. Tetrahedron 2010, 66, 1078–1081. [Google Scholar] [CrossRef]
  19. Gallezot, P. Conversion of biomass to selected chemical products. Chem. Soc. Rev. 2012, 41, 1538–1558. [Google Scholar] [CrossRef]
  20. Ulrich, G.D.; Vasudevan, P.T. Capital Cost Estimation. In Chemical Engineering—Process Design and Economics, A Practical Guide, 2nd ed.; Process Publishing: Durham, NH, USA, 2004. [Google Scholar]
  21. Davis, R.; Tao, L.; Scarlata, C.; Tan, E.C.D.; Ross, J.; Lukas, J.; Sexton, D. Process Design and Economics for the Conversion of Lignocellulosic Biomass to Hydrocarbons-Dilute-Acid and Enzymatic Deconstruction of Biomass to Sugars and Catalytic Conversion of Sugars to Hydrocarbons (Report No. TP-5100-62498); National Renewable Energy Laboratory and Harris Group Inc.: Golden, CO, USA, 2015. [Google Scholar] [CrossRef]
  22. AACE Intl. Cost Estimate Classification System—As Applied in Engineering, Procurement, and Construction for the Process Industries; AACE International Recommended Practice No. 18R-97; AACE Intl: Morgantown, WV, USA, 2005. [Google Scholar]
  23. North Dakota Office of the Tax Commissioner. Corporate Income Tax. 2019. Available online: https://www.nd.gov/tax/user/businesses/formspublications/corporate-income-tax (accessed on 27 March 2019).
  24. Popovic, M.; Woodfield, B.F.; Hansen, L.D. Thermodynamics of hydrolysis of cellulose to glucose from 0 to 100 degrees C: Cellulosic biofuel applications and climate change implications. J. Chem. Thermodyn. 2019, 128, 244–250. [Google Scholar] [CrossRef]
  25. Cheméo—Chemical & Physical Properties by Cheméo. 2016. Available online: www.chemeo.com (accessed on 12 February 2019).
  26. Sevilla, M.; Fuertes, A.B. Chemical and Structural Properties of Carbonaceous Products Obtained by Hydrothermal Carbonization of Saccharides. Chem. A Eur. J. 2009, 15, 4195–4203. [Google Scholar] [CrossRef]
  27. Southwest Information Office. Employer Costs for Employee Compensation for the Regions—December 2018. 2018. Available online: https://www.bls.gov/regions/southwest/news-release/employercostsforemployeecompensation_regions.htm (accessed on 20 March 2019).
  28. Energy Information Administration. North Dakota Natural Gas Industrial Price (Dollars per Thousand Cubic Feet). 2019. Available online: https://www.eia.gov/dnav/ng/hist/n3035nd3m.htm (accessed on 23 March 2019).
  29. Electricity Local. Wahpeton Electricity Rates. Available online: www.electricitylocal.com/states/minnesota/minnesota-city (accessed on 23 March 2019).
  30. Urbanchuk, J. Current State of the U.S. Ethanol Industry (Report No. 02-5025); U.S. Department of Energy: Washington, DC, USA, 2010. [CrossRef] [Green Version]
  31. Jansky, D. Ethanol Facilities Capacity by State and Plant. Nebraska Energy Office. 2018. Available online: https://neo.ne.gov/programs/stats/inf/122.htm (accessed on 31 January 2019).
  32. Lange, J.P. Renewable Feedstocks: The Problem of Catalyst Deactivation and its Mitigation. Angew. Chem.-Int. Ed. 2015, 54, 13186–13197. [Google Scholar] [CrossRef] [PubMed]
  33. Brouwer, T.; Blahusiak, M.; Babic, K.; Schuur, B. Reactive extraction and recovery of levulinic acid, formic acid and furfural from aqueous solutions containing sulphuric acid. Sep. Purif. Technol. 2017, 185, 186–195. [Google Scholar] [CrossRef]
  34. Choudhury, B.; Basha, A.; Swaminathan, T. Study of lactic acid extraction with higher molecular weight aliphatic amines. J. Chem. Technol. Biotechnol. 1998, 72, 111–116. [Google Scholar] [CrossRef]
  35. Eda, S.; Borra, A.; Parthasarathy, R.; Bankupalli, S.; Bhargava, S.; Thella, P.K. Recovery of levulinic acid by reactive extraction using tri-n-octylamine in methyl isobutyl ketone: Equilibrium and thermodynamic studies and optimization using Taguchi multivariate approach. Sep. Purif. Technol. 2018, 197, 314–324. [Google Scholar] [CrossRef]
  36. Sprakel LM, J.; Schuur, B. Solvent developments for liquid-liquid extraction of carboxylic acids in perspective. Sep. Purif. Technol. 2019, 211, 935–957. [Google Scholar] [CrossRef]
  37. Komesu, A.; Maciel, M.R.W.; Maciel, R. Separation and Purification Technologies for Lactic Acid—A Brief Review. Bioresources 2017, 12, 6885–6901. [Google Scholar] [CrossRef]
  38. Qin, W.; Li, Z.Y.; Dai, Y.Y. Extraction of monocarboxylic acids with trioctylamine: Equilibria and correlation of apparent reactive equilibrium constant. Ind. Eng. Chem. Res. 2003, 42, 6196–6204. [Google Scholar] [CrossRef]
  39. Wasewar, K.L.; Heesink, A.B.M.; Versteeg, G.F.; Pangarkar, V.G. Reactive extraction of lactic acid using alamine 336 in MIBK: Equilibria and kinetics. J. Biotechnol. 2002, 97, 59–68. [Google Scholar] [CrossRef] [Green Version]
  40. Solutions, I. Caustic Soda Price History. 2019. Available online: www.intratec.us/chemical-markets/caustic-soda-prices (accessed on 23 March 2019).
  41. CCM: China’s Market Price of Furfural Bounces Back in April 05-18-2016 4648. CCM—Data and Business Intelligence. 2016. Available online: www.cnchemicals.com/Press/86385-CCM (accessed on 29 March 2019).
  42. China CN: Market Price: Monthly Avg: Organic Chemical Material: Formic acid 94%. CEIC. 2018. Available online: https://www.ceicdata.com/en/china/china-petroleum--chemical-industry-association-petrochemical-price-organic-chemical-material/cn-market-price-monthly-avg-organic-chemical-material-formic-acid-94> (accessed on 31 January 2019).
  43. Global Bio-Based Platform Chemical Market—Market Research Report, Cumulative Impact of COVID-19; 360iResearch: Pune, Maharashtra, India, 2020.
  44. Global Gypsum Market Set for 9.9% Growth. Smithers Apex. 2016. Available online: www.smithersapex.com/news/2016/february/global-gypsum-market-set-for-growth (accessed on 29 March 2019).
  45. Shao, Y.W.; Sun, K.; Li, Q.Y.; Liu, Q.H.; Zhang, S.; Liu QHu, G.Z.; Hu, X. Copper-based catalysts with tunable acidic and basic sites for the selective conversion of levulinic acid/ester to gamma-valerolactone or 1,4-pentanediol. Green Chem. 2019, 21, 4499–4511. [Google Scholar] [CrossRef]
Figure 1. Major unit operation requirements for Sn-Beta and Sn-Beta + CaSO4 process designs.
Processes 09 00436 g001
Figure 2. Remaining separation process steps for carboxylic acid extraction with 1-octanol.
Processes 09 00436 g002
Figure 3. Remaining separation process steps for carboxylic acid extraction with isoamyl alcohol.
Processes 09 00436 g003
Figure 4. Sensitivity of NPV@20% to the gross margin for base Sn-Beta (triangles) and Sn-Beta + CaSO4 (solid circles) processes. Circled values indicate basis values, and the boxes indicate regions of most probable uncertainty, defined as ±40% of the basis gross margin.
Processes 09 00436 g004
Table 1. Reaction yields for both evaluated process alternatives (wt% of Inlet Carbon) from Kohler et al. [16].
AlternativeSugarLactic AcidLevulinic AcidAcetic AcidFormic Acid
Sn-BetaGlucose11%20%2.4%8.0%
Sn-BetaXylose19%1.8%2.4%7.4%
Sn-Beta + CaSO4Glucose68%2.0%3.6%3.2%
Sn-Beta + CaSO4Xylose50%2.5%5.2%5.4%
Table 2. Optimized reactive extraction conditions and acid distribution coefficients from a TOA/diluent mixture for two diluents.
Diluent
ConditionIsoamyl Alcohol1-octanol
Organic/Aqueous Ratio0.470.65
Extractant Concentration (wt%)1322
Lactic/Levulinic Acid Ratio1.30.69
Lactic Acid KD5835
Levulinic Acid KD3321
Acetic Acid KD2932
Formic Acid KD97102
Table 3. An economic comparison of isoamyl and 1-octanol carboxylic acid separation steps applied to Sn-Beta + CaSO4 process. The estimate was conducted using a January 2019 basis and 20-year project life cycle and is reported in USD ($).
Measure1-octanolIsoamyl
Average Annual Operating Costs$10.1 million/year$10.3 million/year
Total Capital Investment$13.2 million$18.1 million
Net Present Value @ 20% ($51.5 million)($57.6 million)
Table 4. Distribution coefficients at optimum 1-octanol/TOA reactive extraction conditions for carboxylic acid solutions produced using Sn-Beta and Sn-Beta + CaSO4.
Sn-BetaSn-Beta + CaSO4
Lactic Acid KD351.9
Levulinic Acid KD216.4
Acetic Acid KD322.3
Formic Acid KD1023.4
Table 5. Capital Investment for the Base Sn-Beta Reaction Process Alternative.
Equipment Type# of UnitsPEC ($2019) A Total BMC ($) B
Process Vessels2213,300,000 19,000,000
Heat Exchangers513,100,000 11,000,000
Tanks274,000 260,000
Compressors72,500,000 3,800,000
Filters112,600,000 11,000,000
Conveyors361,200,000 2,600,000
Pumps74860,000 3,400,000
Mixers234,900,000 10,000,000
Reactors363,300,000 19,000,000
Total Bare Modular Cost CTBM C » 81,000,000
Contingency and Fees CTBM A * 0.18 =15,000,000
Total Module Cost CTM D » 95,000,000
Auxiliary FacilitiesCAUX E CTM B * 0.30 =29,000,000
Fixed Capital Investment FCI F » 120,000,000
Working CapitalCWC G »FCI D * 0.15 =19,000,000
Initial Charge of Chemicals and Catalysts 2,100,000
Total Capital Investment TCI H » 140,000,000
A. PEC—Purchased equipment cost at basis date. B. BMC—Bare module cost. C. CTBM—Total bare module cost. D. CTM—Total module cost. E. CAUX—Auxiliary facilities cost. F. FCI—Fixed capital investment. G. CWC—Working capital. H. TCI—Total capital investment.
Table 6. Capital investment for the Sn-Beta + CaSO4 reaction process alternative a.
Equipment Type# of UnitsPEC ($2019)Total BMC ($)
Process Vessels2273,900,00023,000,000
Heat Exchangers513,300,00013,000,000
Tanks274,000260,000
Compressors71,400,0002,200,000
Filters112,600,00011,000,000
Conveyors361,200,0002,600,000
Pumps74930,0003,700,000
Mixers235,200,00011,000,000
Reactors363,300,00019,000,000
Total Bare Modular Cost CTBM » 86,000,000
Contingency and Fees CTBM A * 0.18 =15,000,000
Total Module Cost CTM » 100,000,000
Auxiliary FacilitiesCAUXCTM B * 0.30 =30,000,000
Fixed Capital Investment FCI » 130,000,000
Working CapitalCWC »FCI D * 0.15 =20,000,000
Initial Charge of Chemicals and Catalysts 2,400,000
Total Capital Investment TCI » 150,000,000
a. Terms in this table are defined in Table 5.
Table 7. Breakdown of annual operating expenses for each process (all values in USD, $).
Process
Alternative
YearRaw MaterialsChemicals and CatalystsOperating LaborMaintenanceUtilitiesWaste DisposalOther ExpensesTotal
Base Sn-Beta1–2021,000,0004,600,0007,200,0005,100,00029,000,0001,300,00012,000,00079,000,000
Sn-Beta + CaSO41–2021,000,0004,900,0007,200,0005,200,00029,000,0001,200,00012,000,00080,000,000
Table 8. Utility requirements for each process.
Base Sn-Beta AlternativeSn-Beta +CaSO4 Alternative
Utility DescriptionAnnual Cost ($/year)RequirementAnnual Cost ($/year)Requirement
Electricity5,600,000Amount: 90 million kWh/year3,600,000Amount: 59 million kWh/year
Cooling Water660,000Amount: 3.4 billion kg/year
Temperature: 30 °C
Pressure: 300 kPa
710,000Amount: 4.4 billion kg/year
Temperature: 30 °C
Pressure: 300 kPa
Boiler Feed Water6,700,000Amount: 1.8 billion kg/year
Temperature: 30 °C
Pressure: 450 kPa
7,600,000Amount: 2.0 billion kg/year
Temperature: 30 °C
Pressure: 450 kPa
Medium-High Pressure Steam9,100,000Amount: 480 million kg/year
Temperature: 239 °C
Pressure: 3300 kPa
3,400,000Amount: 160 million kg/year
Temperature: 239 °C
Pressure: 3300 kPa
High Pressure Steam6,400,000Amount: 320 million kg/year
Temperature: 400 °C
Pressure: 4500 kPa
14,000,000Amount: 730 million kg/year
Temperature: 400 °C
Pressure: 4500 kPa
Total29 million/year 29 million/year
Table 9. Revenue projections for base Sn-Beta and Sn-Beta + CaSO4 alternatives.
Base Sn-Beta AlternativeSn-Beta + CaSO4 Alternative
Products$/kgAmount (kg/year)Revenue ($/year)Amount (kg/year)Revenue ($/year)
Lactic Acid1.4818,000,00026,000,00078,000,000150,000,000
Levulinic Acid5.0015,000,00075,000,0003,400,00017,000,000
Acetic Acid0.673,000,0002,100,0009,600,0006,600,000
Formic Acid0.6815,000,00010,000,0009,800,0006,700,000
Furfural1.651,600,0002,600,0001,600,0002,600,000
Gypsum0.042,100,000 USD 75,000----
Saturated Water Credit----3,100,000--3,500,000
Lignin Energy Credit----4,200,000 4,200,000
TOTALS USD 123,000,000 191,000,000
Table 10. Economic cash flow sheet for the base Sn-Beta process Alternative ($ millions); location: Southeast, Fargo, ND, USA; basis date: January 2019.
YearRevenuesOperating CostsGross ProfitDepreciationFederal Taxable ProfitFederal Income TaxState Taxable ProfitState Income TaxNontaxable ChargesNet ProfitPresent Value @ 20%
−2 (41)(41)(59)
−1 (41)(41)(50)
0 (62)(62)(62)
1120(79)44 15 29 (6.1)23 (1.0) 37 31
2120(79)44 13 32 (6.6)25 (1.1) 37 25
3120(79)44 11 33 (6.9)26 (1.1) 36 21
4120(79)44 10 34 (7.2)27 (1.2) 36 17
5120(80)43 8.8 34 (7.1)27 (1.2) 35 14
6120(79)44 7.7 37 (7.7)29 (1.2) 35 12
7120(79)44 6.8 37 (7.9)30 (1.3) 35 10
8120(79)44 6.0 38 (8.0)30 (1.3) 35 8.0
9120(80)43 5.3 37 (7.9)30 (1.3) 34 7.0
10120(79)44 5.0 39 (8.2)31 (1.3) 35 5.6
11120(79)44 5.0 39 (8.2)31 (1.3) 35 4.7
12120(79)44 5.0 39 (8.2)31 (1.3) 35 3.9
13120(80)43 5.0 38 (7.9)30 (1.3) 34 3.1
14120(79)44 5.0 39 (8.2)31 (1.3) 35 2.7
15120(79)44 5.0 39 (8.2)31 (1.3) 35 2.3
16120(79)44 5.0 39 (8.2)31 (1.3) 35 1.9
17120(80)43 5.0 38 (7.9)30 (1.3) 34 1.5
18120(79)44 44 (9.3)35 (1.5) 34 1.3
19120(79)44 44 (9.3)35 (1.5) 34 1.0
20120(79)44 44 (9.3)35 (1.5)19 52 1.4
Note: Numbers in parentheses represent negative values NPV@20%3.3
DCFROR20%
Table 11. Economic Cash Flow Sheet for the Sn-Beta + CaSO4 Process Alternative ($ millions); Location: Southeast, Fargo, ND, USA; Basis Date: January 2019.
YearRevenuesOperating CostsGross ProfitDepreciationFederal Taxable ProfitFederal Income TaxState Taxable ProfitState Income TaxNontaxable ChargesNet ProfitPresent Value @ 20%
−2 (44)(44)(63)
−1 (44)(44)(53)
0 (66)(66)(66)
1160(80)751659(12)46(2.0) 6151
2160(80)751461(13)49(2.1) 6042
3160(80)751263(13)50(2.1) 6034
4160(80)751164(14)51(2.2) 5929
5160(82)749.364(13)51(2.2) 5823
6160(80)758.267(14)53(2.3) 5920
7160(80)757.268(14)54(2.3) 5816
8160(80)756.469(14)54(2.3) 5814
9160(82)745.668(14)54(2.3) 5711
10160(80)755.370(15)55(2.4) 589.4
11160(80)755.370(15)55(2.4) 587.8
12160(80)755.370(15)55(2.4) 586.5
13160(82)745.368(14)54(2.3) 575.3
14160(80)755.370(15)55(2.4) 584.5
15160(80)755.370(15)55(2.4) 583.8
16160(80)755.370(15)55(2.4) 583.1
17160(82)745.368(14)54(2.3) 572.6
18160(80)75 75(16)59(2.6) 572.1
19160(80)75 75(16)59(2.6) 571.8
20160(80)75 75(16)59(2.6)20762.0
Note: Numbers in parentheses represent negative values NPV@20%110
DCFROR30%
Publisher’s Note: MDPI stays neutral with regard to jurisdictional claims in published maps and institutional affiliations.

