Article

The Development of a Liquid Chromatography High-Resolution Mass Spectrometric Method for Apixaban Quantification in Dried Plasma Spots in Parallel Reaction Monitoring Mode

by
Alexander Chernonosov
1,*,
Liliya Aksenova
1,2 and
Vladimir Koval
1,2
1
Institute of Chemical Biology and Fundamental Medicine SB RAS, 630090 Novosibirsk, Russia
2
Department of Natural Sciences, Novosibirsk State University, 630090 Novosibirsk, Russia
*
Author to whom correspondence should be addressed.
Processes 2021, 9(3), 450; https://doi.org/10.3390/pr9030450
Submission received: 26 January 2021 / Revised: 23 February 2021 / Accepted: 25 February 2021 / Published: 2 March 2021
(This article belongs to the Special Issue Pharmaceutical and Biomedical Analysis)

Abstract

:
This work aimed at developing and validating a rapid, sensitive, and robust method of liquid chromatography with high-resolution mass spectrometry (LC–HRMS) in parallel reaction monitoring (PRM) mode for apixaban quantification in dried plasma spots (DPSs) with a simple extraction procedure. A 25 µL sample of human plasma was placed onto Whatman 903 Protein Saver Cards and allowed to dry; 3.2 mm diameter disks were cut out from DPSs using a puncher, and 100 µL of a working internal standard solution was added to each sample. After this, they were vortexed on a shaker for 15 min at 800 rpm and 40 °C and quick centrifugation (10,000× g, 10 s), and then the extracts were transferred into a 300 µL vial for LC–HRMS. Data were acquired in PRM mode via detection of all target product ions with 10 ppm tolerance. Total analysis time was 5 min. The LC–HRMS method was validated for the 10–400 ng/mL range with R2 > 0.99. Within this range, intra- and interday variability of precision and accuracy was <10%, and recovery was 69.7–85.1%. Apixaban was stable after brief storage at room temperature, and at 4 °C for up to a month. The method development and validation results proved that this LC–HRMS assay of apixaban in DPSs is selective and robust.

1. Introduction

Apixaban is a new-generation oral anticoagulant drug [1]. It is used to prevent ischemic stroke and venous thromboembolism in patients with nonvalvular atrial fibrillation [2,3]. Apixaban is a direct inhibitor of the active site of factor Xa with high selectivity vis-à-vis other coagulation proteases and structurally linked enzymes involved in fibrinolysis and digestion [4]. Apixaban has no direct effect on platelet congestion but indirectly inhibits platelet congestion caused by thrombin. By inhibiting factor Xa, apixaban prevents thrombin formation and thrombus growth [5]. Apixaban is also a substrate for P-glycoprotein and may engage in drug interactions [6]. How this drug can be optimally used in specific clinical situations is not clear [7]. Identification of its therapeutic range where bleeding and thrombosis are minimized is important for general and personalized treatments. An effective and efficient assay of apixaban may help to control the concentration of this drug, especially in rare cases of clinically significant drug interactions or in other special situations [8]. Human plasma is the most commonly used biological fluid for drug assays, and several methods have been developed for apixaban quantitation in human plasma by tandem mass spectrometry with liquid chromatography (LC–MS/MS) [6,9,10,11,12,13,14,15].
Dried blood spots enable minimally invasive sampling, for example, via a finger or heel prick, with a smaller sample volume (as a rule <100 μL for 3–4 spots) [16,17]. These methods have a number of advantages over existing techniques of venous blood sampling—patients can collect samples at home without special training; monitoring can be implemented at any time; because the samples are spots of dried blood, there are no biosafety requirements, and thus the samples can even be mailed in sealed packages to a designated laboratory, thereby minimizing costs; and sample stability is higher for a dried blood spot than for venous blood [18,19]. Nonetheless, patients often fail to collect blood samples correctly, resulting in incorrect processing of data in 19% of cases [20]. The proportion of unsatisfactory samples can reach 30% [20,21]; therefore, sampling in laboratory settings is preferable. During the processing of the sample, a fixed area of the spot is usually cut out for extraction and analysis. This approach is based on the assumption that blood initially spreads evenly on filter paper and yields a constant spot area for a given sample volume. The most important parameter influencing the accuracy of this approach is blood hematocrit, which affects blood viscosity, thereby causing size variation of dried blood spots for a given volume [16]. To eliminate the potential hematocrit effect in our work, we used dried plasma spots (DPSs). On the other hand, the limited amount of a sample increases the difficulty with quantifying analytes on DPS cards, and therefore LC–MS/MS is often employed to analyze drug concentrations in DPSs, owing to high sensitivity, selectivity, and flexibility [17,18,22].
Several instrumental approaches are applied to substance quantification depending on the mass spectrometer in question [23,24]. Triple-quadrupole mass spectrometers allow for detection of a precursor ion of a whole molecule as well as product ions of molecular fragments in multiple reaction monitoring (MRM) mode, also known as selected reaction monitoring mode [25,26]. Transitions “whole molecule → fragment” can also help to determine or confirm the structure of a molecule. The transition with the highest intensity is used for the quantitation, while others, usually one or two, for additional confirmation of the analyzed substance. The advantage of high-resolution mass spectrometry (HRMS) is the detection of analytes by means of accurate mass, with a measurement error of 10 ppm or less. Therefore, HRMS can be utilized for different assays in many fields, e.g., Yan et al. [27] proposed the use of HRMS for the quantification of xenobiotics in biological samples, whereas Ponzetto et al. [28] employed ultra-high-performance liquid chromatography (UHPLC)–HRMS for steroid profiling in serum. An enhancement of HRMS allowed us to include a method of parallel reaction monitoring (PRM) [29], primarily developed for targeted proteomics [30,31]. In PRM mode, all target product ions are detected during one mass analysis, thus allowing a “fingerprint” of a studied substance at high resolution to be obtained. The benefit of PRM is the ability to summarize signals from different fragments to increase the intensity of the resulting peak. This ability is important when researchers work with low concentrations of substances and small amounts of samples, as is the case for DPSs. To date, investigators have used LC−MS/MS to measure apixaban concentrations in dried blood spots in only three studies, and all of them utilized MRM [8,16,32]. Therefore, the purpose of the present study was to develop and validate a rapid and robust liquid chromatography with high-resolution mass spectrometry (LC–HRMS) assay in PRM mode for apixaban quantification in DPSs with a simple extraction procedure.

2. Materials and Methods

2.1. Materials

Apixaban (98% purity) and edoxaban (97% purity) were acquired from AChemBlock, Inc. (Burlingame, CA, USA). Their structures are shown in Figure 1. Acetonitrile (ACN) and methanol (MeOH) of LC–MS-grade were purchased from AppliChem Panreac (Barcelona, Spain), whereas formic acid (FA) was purchased from Sigma-Aldrich (St. Louis, MO, USA). Water for the assay was produced by means of a Milli-Q system from Millipore Corp. (Bedford, MA, USA). Whatman 903 Protein Saver Cards were purchased from Bio-Sciences Corp. (Westborough, MA, USA). Human plasma was obtained from healthy volunteers with approval by the Human Ethics Committee of the Institute of Chemical Biology and Fundamental Medicine.

2.2. Mass Spectrometry

The LC–HRMS system consisted of a DIONEX UltiMate 3000 chromatograph (Thermo Fisher Scientific, Inc., Waltham, MA, USA) coupled to a Q Exactive HF Orbitrap mass spectrometer (Thermo Fisher Scientific, Inc., Waltham, MA, USA). The analysis was performed on a ProntoSil-120-3-C18 (2 × 75 mm, 3 µm) analytical column (EcoNova, Russia) at 25 °C, and sample injection volume was 5 µL. Total run time of the analysis was 5 min. The mobile phase consisted of water (eluent A) and of MeOH (eluent B), both containing 0.1% of FA. Initial eluent composition was 5% B and increased to 55% by the end of minute 2, further increased to 95% from minute 2 second 40 to minute 4 second 50 at a flow rate of 200 µL/min, next to 97% from minute 4 second 50 to minute 4 second 51, and then returned to 5% at a flow rate of 300 µL/min. Data acquisition and quantification were performed in Xcalibur 4.2.47 software (Thermo Fisher Scientific, Inc., Waltham, MA, USA).
The optimal MS parameters were as follows: spray voltage of 4200 V; sheath and auxiliary gas pressure of 9 and 0 arbitrary units, respectively; and capillary temperature of 320 °C. The analytes were detected in PRM mode as positively charged ions. General parameters of PRM were set as follows: in-source collision-induced dissociation (CID), 0.0 eV; polarity, positive; default charge, 2; and dynamic RT and inclusion, “on.” Full MS/MS scans were acquired with an automatic gain control (AGC) target value of 2E5, resolution of 30,000, normalized collision energies (NCE) of 35 eV, and a maximum ion injection time of 100 ms. Each target was monitored with an isolation window of m/z 4. The inclusion list consisted of 2 lines with the following settings: m/z 460.1975 (≈1 ppm error relative to theoretical mass) with NCE 40 eV for apixaban and m/z 548.1841 (less than 1 ppm error relative to theoretical mass with NCE 30 eV) for edoxaban, serving as an internal standard (IS). Customized tolerance for both compounds was 10 ppm. Several fragment ion m/z values were selected for detection and quantification: 199.0856 and 461.1795 for apixaban and 152.1063, 276.1150, 349.1669, and 366.1937 for the IS.

2.3. Experimental Procedures

2.3.1. Preparation of Calibration Standards and Validation Samples

To prepare a stock solution, we dissolved several milligrams of apixaban in 1 mL of MeOH, followed by dilution to 1 mg/mL. Working solutions were made up by serial dilution of the stock solution in MeOH to the following concentrations: 4000, 3500, 3000, 2500, 2000, 1500, 1000, 500, 250, 400, and 100 ng/mL. The calibration standards of apixaban were prepared by 10-fold dilution of the respective working solutions in human plasma in 1.5 mL Eppendorf tubes to attain final concentrations of 400, 350, 300, 250, 200, 150, 100, 50, 25, and 10 ng/mL.
A stock solution of the IS (1 mg/mL) was prepared by dissolving 8 mg of the drug in 800 µL of a solution of can/0.1% aqueous FA (50:50, v/v). The IS working solution had the final drug concentration of 2.5 ng/mL in can/H2O (90:10, v/v). The stock solutions were kept at −22 °C, and the working solutions were prepared immediately before use.
By 10-fold dilution of the respective working solutions of apixaban in human plasma, we prepared quality control (QC) solutions at 3 concentrations: 350, 200, and 40 ng/mL (or 30 ng/mL for stability tests). Solutions of QCs were also prepared in MeOH to measure the recovery of apixaban.

2.3.2. Sample Preparation and Extraction Procedures

To prepare plasma spots, we gently applied 25 μL of each plasma sample to Whatman 903 cards in the center of the preprinted circle, which were allowed to dry for at least 3 h at room temperature, protected from light and moisture. After this, 3.2 mm diameter disks were cut out from the DPSs using a puncher and placed into 1.5 mL Eppendorf tubes, and 100 µL of the working IS solution was added onto each disk. These samples were incubated on a TS-100C shaker (BioSan, Latvia) at 800 rpm for 15 min at 40 °C. After centrifugation for 10 s at 10,000× g, the extracts were transferred into a 300 µL vial for subsequent LC–HRMS analysis.
The preparation and extraction of spots for the measurement of apixaban recovery were different from the standard procedures. In this case, 5 µL of plasma-containing QC solutions was spotted onto Whatman 903 cards. The whole spot was punched out into 1.5 mL Eppendorf tubes and extracted with 200 µL of the working IS solution. The other steps of extraction were carried out as described above.
To evaluate the matrix effect, we spotted 5 µL of pure plasma onto Whatman 903 cards, punched whole spots out into 1.5 mL Eppendorf tubes, and added 200 µL of the working IS solution; then, the procedure was continued as described above.

2.4. Assay Validation

2.4.1. Linearity

The linearity of the newly developed method was evaluated by construction of a calibration curve with 11 concentrations (400, 350, 300, 250, 200, 150, 100, 50, 25, and 10 ng/mL), performed in 4 biological and 2 technical replicates each. Finally, a plot of the peak area ratio (apixaban/IS) against analyte concentration was built.

2.4.2. Accuracy

The bias and precision of the newly developed method were determined by the analysis of DPS samples at 3 analyte levels: low (LQC), medium (MQC), and high (HQC) quality control levels (40, 200, and 350 ng/mL, respectively). Intraday bias and precision were calculated during a single day using 12 replicates at each concentration. Interday bias and precision were computed from 6 replicates at each concentration for 3 consecutive days.

2.4.3. Recovery and the Matrix Effect

To measure analyte recovery and the matrix effect, we employed apixaban at each concentration in equal amounts (5 µL) to prepare a MeOH solution and DPS.
To determine extraction procedure efficiency, we analyzed 3 quality control levels (LQC, MQC, and HQC) in 6 biological replicates with 2 technical replicates each. For recovery evaluation, results obtained from the extraction of fully cut out spots of 5 µL plasma were compared with those of standard solutions in MeOH, which represented the absolute recovery.
To quantify the matrix effect, we spiked the extracts of fully cut out spots from 5 µL of pure plasma with 5 µL of apixaban at each concentration. The obtained peak areas were compared with standard solutions in MeOH, which represented the absolute recovery.

2.4.4. Stability

A series of DPSs was prepared with apixaban at 30, 200, and 350 ng/mL, and the samples were divided into 2 parts. One part was stored at room temperature in a postal envelope for a bench top stability test, and the other was kept in an identical envelope at 4 °C for a refrigeration stability test. The samples were extracted and analyzed on days 7, 21, and 35, as described above. To assess short-term stability, we left the extracted samples in the autosampler at 4 °C and analyzed them after 5, 24, and 48 h.

3. Results

3.1. The HRMS Method

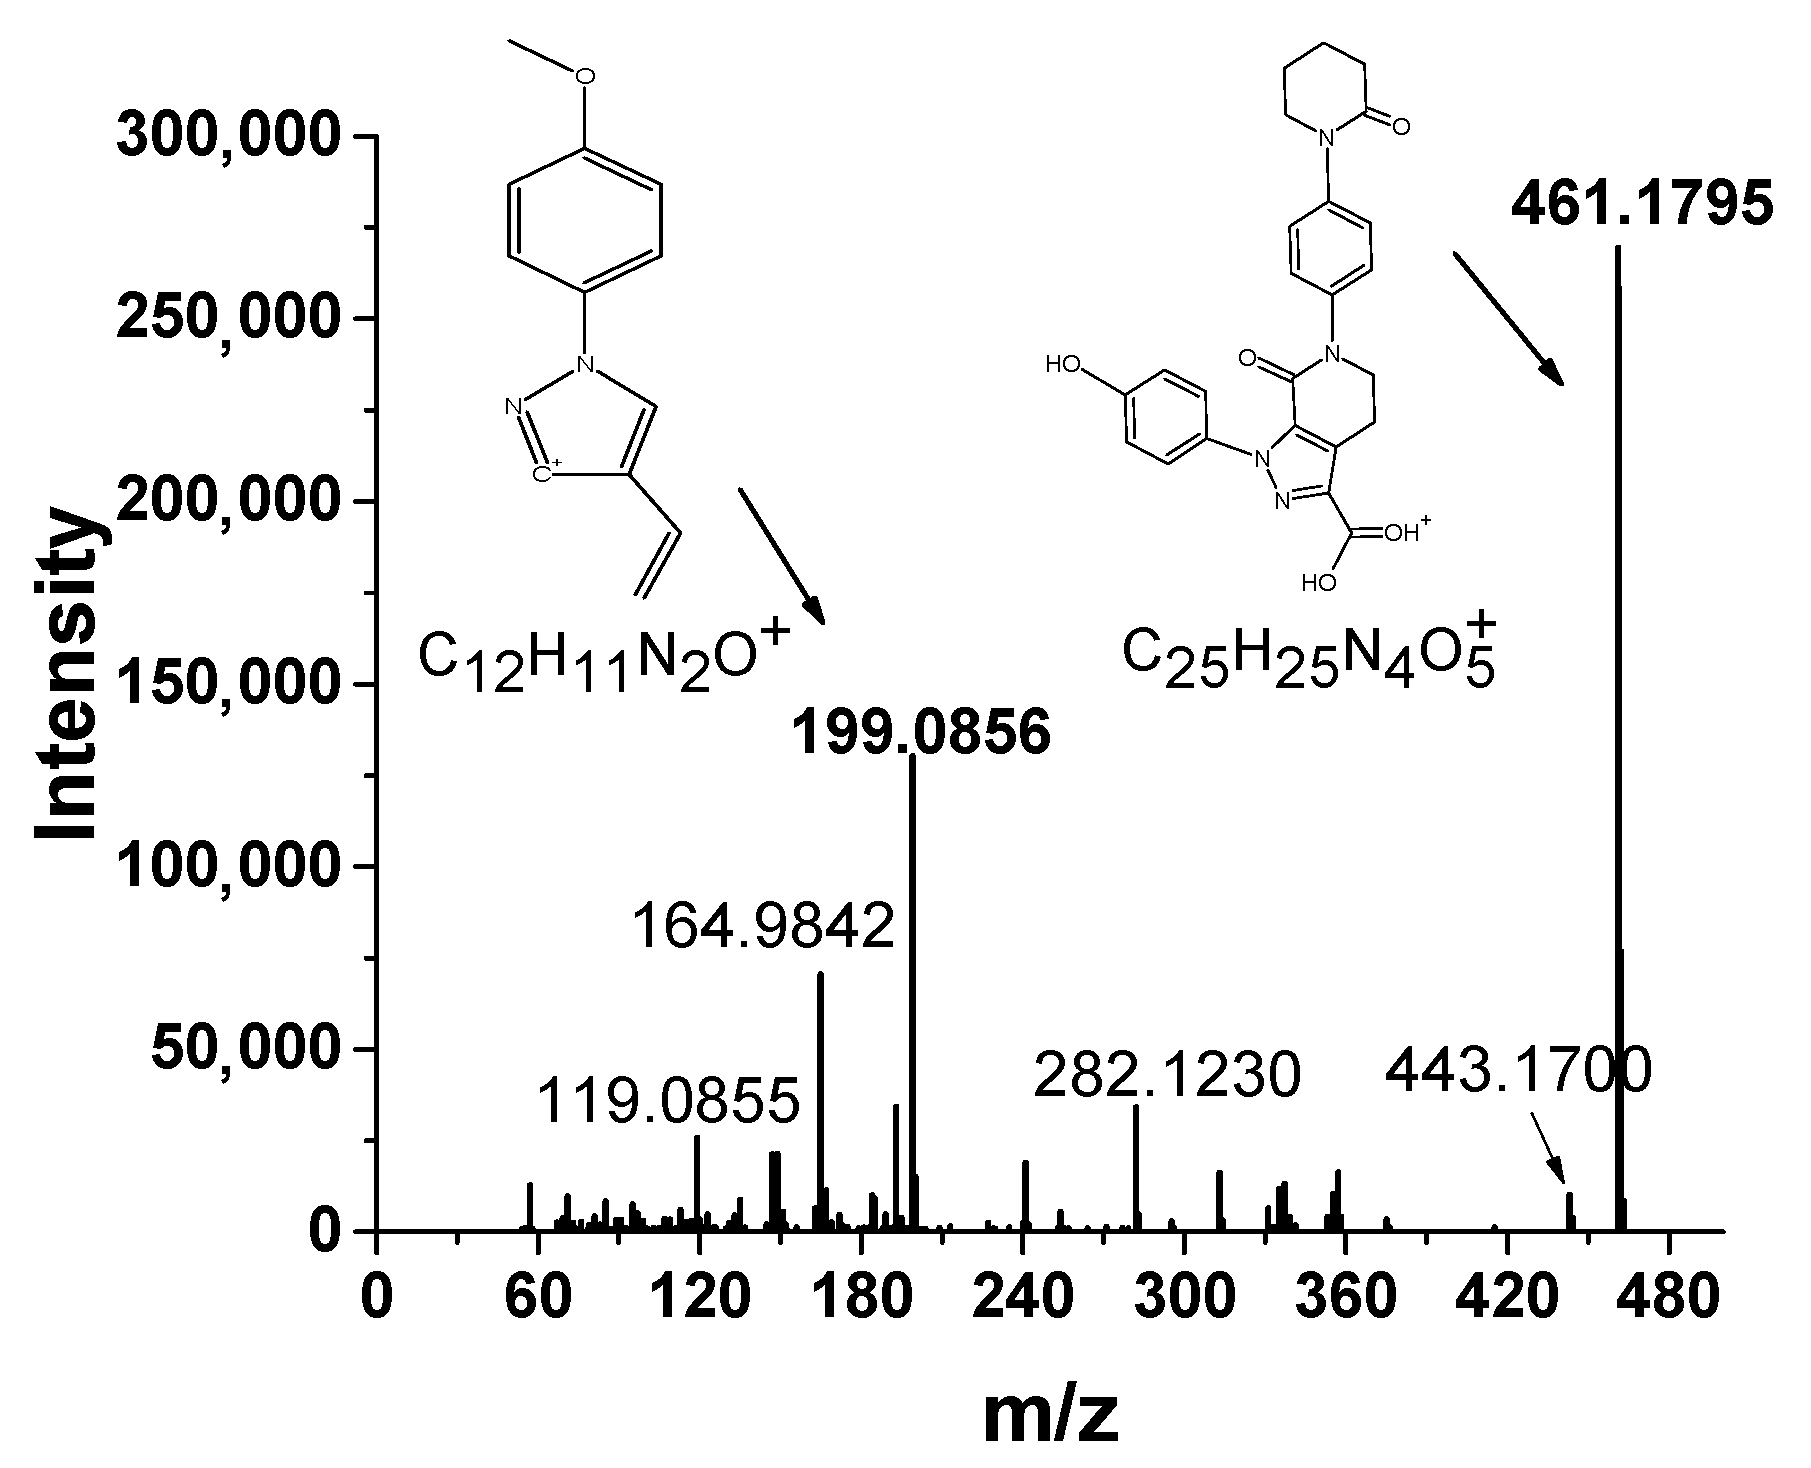
The PRM mode was chosen to assay apixaban by the HRMS technique. The exact masses of apixaban and IS were added to the inclusion list with an accuracy of 10 ppm for this purpose. During the assay, molecules of the specified masses were fragmented with subsequent detection of all product ions. In this way, both the parent ions and fragment ions were simultaneously detected with the given accuracy. The use of several product ions in PRM mode for quantitation allowed both for the determination of the structure of the analyzed molecules and the summing up of the peak areas to increase the signal. For the quantitation of apixaban, m/z 461.1795 and 199.0856 were selected [2,33,34]. The former can be formed by hydrolysis, affording a carboxylate derivative, whereas the latter may be produced from the former through a loss of H2O, of a 216 Da moiety, and of CO [34]. The situation is unusual with the first product ion when its mass (461.1795) is greater than precursor ion mass (460.1975). The mass of this product ion increases as a result of the loss of NH3 and attachment of H2O [34]. For the IS, several fragments were chosen: m/z 152.1063, 276.1150, 349.1669, and 366.1937 [33]. The mass spectra and chemical structures of apixaban and IS are presented in Figure 2 and Figure 3.

3.2. The Extraction Procedure

To extract apixaban from blood plasma, one can use different solvents: MeOH [2,6], ethyl acetate:methyl tertiary butyl ether (70:30, v/v) with preprocessing in orthophosphoric acid/FA (v/v at 1:1) [5], ACN [12], or ACN:H2O (v/v at 50:50) [13]. For extraction from dry blood spots, researchers have also used several solvents: MeOH/H2O (v/v at 100:1 and 70:30), ACN/H2O (v/v at 100:1 and 70:30), and ACN/0.1% aqueous FA (70:30, v/v) [8]; ethyl acetate/hexane (v/v at 70:30) [16]; and MeOH/H2O (v/v at 95:5) [32]. In our previous work [35], the optimal parameters for apixaban extraction from DPSs were found: incubation time 15 min, temperature 40 °C, volume and type of solvent 100 µL of ACN/H2O (90:10, v/v). Therefore, these parameters were selected for apixaban extraction during the method validation in the present work.

3.3. Linearity

The linearity of the newly developed assay was evaluated by means of a standard calibration curve with 11 concentrations analyzed in 4 biological and 2 technical replicates. A plot of the peak area ratio against analyte concentration was constructed. These calibration standards met the specified acceptance criteria (±15%, except for the lowest concentration, where the tolerance should be ±20% of the nominal value), while the linearity was excellent: y = 0.0894 + 0.0397x, with coefficient of determination (R2) of 0.9936 for the studied range from 10 to 400 ng/mL. Weighting coefficient 1/x was chosen as the most suitable.
Representative chromatograms of a blank DPS, of a DPS at the limit of quantitation (LOQ), and of the IS are shown in Figure 4.

3.4. Accuracy

To assess intraday and interday accuracy and precision, we employed three QC levels (40, 200, and 350 ng/mL). Interday accuracy and precision were determined by repeated analyses performed on three consecutive days. The precision within and between days was calculated as percent relative standard deviation (% RSD), while accuracy was calculated as % bias. The results were within the predicted range for both inter- and intraday analysis; accuracy and precision were less than 10% at all data points, as illustrated in Table 1.

3.5. Recovery and the Matrix Effect

The extraction recovery and matrix effect for apixaban ranged from 69.7% to 85.1% and from 89.3% to 102.2%, respectively. Process efficiency was satisfactory and reproducible across the concentration range (Table 2).

3.6. Stability

Short-term stability was estimated via a comparison of extraction solutions obtained from freshly prepared, apixaban-containing DPSs kept in the autosampler at 4 °C for 5, 24, and 48 h. As shown in Table 3, the samples were stable for at least 48 h. To investigate long-term stability, we kept apixaban-containing DPSs at room temperature and in a refrigerator at 4 °C for 7, 21, and 35 days, and then compared them with fresh DPSs. The data in Table 4 indicate that the DPS samples were stable during this storage period, except for the high concentration at the last time point (35 days). When stored in the refrigerator, the lower concentration yielded an overestimate. This was probably due to heightened humidity.

4. Discussion

This work describes the validation of an assay of apixaban in DPSs by the PRM method. To the best of our knowledge, the development of methods for apixaban measurement in dried blood spots has been described only in three articles [8,16,32], and in all cases, the analysis was carried out in MRM mode. The PRM technique is associated with HRMS and yields accurate masses of both whole-molecule ions and fragments. This feature enables more accurate quantitation of analytes. Increasing the sensitivity of the PRM method through the addition of signals from different fragments allows this technique to compete with MRM. Nevertheless, this approach also requires efficient extraction of the analyte from samples because a disk corresponding to a very small volume of plasma or blood is taken from the dried spot for the assay. In this study, extraction was performed in one step using 100 μL of ACN/H2O (90:10, v/v) and 15 min incubation at 40 °C, thereby permitting validation of the method in the range of 10–400 ng/mL.
In another work [16], in order to achieve calibration in the range 0.5–500 ng/mL, the authors applied liquid–liquid extraction with ethyl acetate/hexane (70:30, v/v). High sensitivity in that work was achieved by a more complicated extraction technique with the highly volatile solvent ethyl acetate as well as sample evaporation and reconstitution steps [16]. In other studies, reversed-phase solid-phase extraction was performed with MeOH/H2O (v/v at 95:5) [32] or ACN/0.1% FA (v/v at 70:30) [8], and also included sample evaporation and reconstitution steps. Thus, in the current work, the simplest (only 15 min) extraction was used as compared to extraction lasting at least 30–40 min [8], ≈1 h [32], or more than 1 h [16]. Although the LOQ was the same as that in the present work (10–800 ng/mL) [8] or below (2.5–750 ng/mL) [32], those authors used disks with a diameter of 6.2 mm [8,16], thus utilizing almost fourfold more of the analyte for their assay as compared to the present study.
HRMS was applied by Gous et al. for apixaban detection in human plasma [11]. The method was validated in the range 1–500 ng/mL in full-scan mode with single data-dependent fragmentation (MS2) scans. To compare sensitivity between our method and the assay described in [11], one should calculate the amount of the analyte used for the determination of the LOQ. Gous et al. analyzed 100 µL of human plasma and used a 100 µL aliquot (one-third volume of the supernatant). Therefore, the 100 µL of human plasma at 1 ng/mL drug concentration gives 0.1 ng of apixaban. Accordingly, using one-third volume of the supernatant for the aliquot, Gous et al. employed 33 pg of the drug to determine the LOQ.
In the current project, a 3.2 mm disk was used, corresponding to 1.7 µL of plasma [36], and only 5 µL (1/20 volume of the supernatant) was subjected to MS. Consequently, 1.7 µL of human plasma with 10 ng/mL drug gave 0.017 ng (17 pg) of apixaban; this amount is already less than the apixaban amount taken for the analysis by Gous et al. By using the 5 µL aliquot (1/20 volume of the supernatant), we decreased the analyte amount (by 20-fold down to 0.85 pg) that was employed to determine the LOQ. Accordingly, the proposed method allows for quantification of small amounts of apixaban in DPSs using HRMS in PRM mode.
To evaluate the possible practical application of the proposed method, we reviewed the literature, finding that it has been reported that blood concentration of apixaban varies in the range from ≈10 to 300 ng/mL among patients undergoing treatment (n = 115) [8]. The blood concentration of apixaban decreases to 6–7 ng/mL by 24 h after oral administration [16]. Therefore, the LOQ of 10 ng/mL is suitable for at least in clinical or pharmacokinetic studies. If necessary, an LOQ less than 10 ng/mL may be achieved through a minor modification of the proposed method, for example, by using a 6.2 mm disk.

5. Conclusions

We describe the development and full validation of an accurate and sensitive HRMS assay of apixaban in human DPSs in PRM mode. Accuracy and precision are within 15% in the 10–400 ng/mL concentration range. The stability of apixaban in DPSs at room temperature was found to be at least 21 days, which should facilitate sample storage and transportation. This method should be convenient for preclinical or clinical pharmacokinetic studies.

Author Contributions

Conceptualization, A.C. and V.K.; methodology, A.C.; validation, A.C. and L.A.; formal analysis, A.C.; investigation, L.A.; resources, V.K.; data curation, V.K.; writing—original draft preparation, L.A.; writing—review and editing, A.C. and V.K.; visualization, L.A.; supervision, A.C.; project administration, A.C. and V.K.; funding acquisition, V.K. All authors have read and agreed to the published version of the manuscript.

Funding

The work was supported by a Russian government-funded project for ICBFM SB RAS (no. AAAA-A17-117020210025-5).

Institutional Review Board Statement

The study was conducted according to the guidelines of the Declaration of Helsinki, and approved by the Local Medical Ethics Committee of Institute of Chemical Biology and Fundamental Medicine SB RAS (protocol code 10 of 26 December 2019).

Informed Consent Statement

Informed consent was obtained from all subjects involved in the study. Written informed consent has been obtained from the patient to publish this paper.

Data Availability Statement

Data are available on request, owing to privacy and ethical restrictions.

Conflicts of Interest

The authors declare no conflict of interest.

References

  1. Wieland, E.; Shipkova, M. Pharmacokinetic and Pharmacodynamic Drug Monitoring of Direct-Acting Oral Anticoagulants: Where Do We Stand? Ther. Drug Monit. 2019, 41, 180–191. [Google Scholar] [CrossRef]
  2. Jeong, H.-C.; Kim, T.-E.; Shin, K.-H. Quantification of apixaban in human plasma using ultra performance liquid chromatography coupled with tandem mass spectrometry. Transl. Clin. Pharmacol. 2019, 27, 33–41. [Google Scholar] [CrossRef] [PubMed]
  3. Wolf, P.A.; Abbott, R.D.; Kannel, W.B. Atrial fibrillation as an independent risk factor for Stroke: The Framingham Study. Stroke 1991, 22, 983–988. [Google Scholar] [CrossRef] [Green Version]
  4. Pursley, J.; Shen, J.X.; Schuster, A.; Dang, O.T.; Lehman, J.; Buonarati, M.H.; Song, Y.; Aubry, A.-F.; Arnold, M.E. LC-MS/MS determination of apixaban (BMS-562247) and its major metabolite in human plasma: An application of polarity switching and monolithic HPLC column. Bioanalysis 2014, 6, 2071–2082. [Google Scholar] [CrossRef]
  5. Layeeq, M.; Baig, A.; Ali, S.A. A Validated LC-MS/MS Method for the Estimation of Apixaban in Human Plasma. J. App. Pharma. Sci. 2017, 44–52. [Google Scholar] [CrossRef] [Green Version]
  6. Delavenne, X.; Mismetti, P.; Basset, T. Rapid determination of apixaban concentration in human plasma by liquid chromatography/tandem mass spectrometry: Application to pharmacokinetic study. J. Pharm. Biomed. Anal. 2013, 78–79, 150–153. [Google Scholar] [CrossRef]
  7. Steffel, J.; Verhamme, P.; Potpara, T.S.; Albaladejo, P.; Antz, M.; Desteghe, L.; Haeusler, K.G.; Oldgren, J.; Reinecke, H.; Roldan-Schilling, V.; et al. The 2018 European Heart Rhythm Association Practical Guide on the use of non-vitamin K antagonist oral anticoagulants in patients with atrial fibrillation. Eur. Heart J. 2018, 39, 1330–1393. [Google Scholar] [CrossRef] [PubMed] [Green Version]
  8. Jhang, R.-S.; Lin, S.-Y.; Peng, Y.-F.; Chao, H.-C.; Tsai, I.-L.; Lin, Y.-T.; Liao, H.-W.; Tang, S.-C.; Kuo, C.-H.; Jeng, J.-S. Using the PCI-IS Method to Simultaneously Estimate Blood Volume and Quantify Nonvitamin K Antagonist Oral Anticoagulant Concentrations in Dried Blood Spots. Anal. Chem. 2020, 92, 2511–2518. [Google Scholar] [CrossRef] [PubMed]
  9. Zhang, W.-L.; Lou, D.; Zhang, D.-T.; Zhang, Y.; Huang, H.-J. Determination of rivaroxaban, apixaban and edoxaban in rat plasma by UPLC-MS/MS method. J. Thromb. Thrombolysis 2016, 42, 205–211. [Google Scholar] [CrossRef]
  10. Baldelli, S.; Cattaneo, D.; Pignatelli, P.; Perrone, V.; Pastori, D.; Radice, S.; Violi, F.; Clementi, E. Validation of an LC-MS/MS method for the simultaneous quantification of dabigatran, rivaroxaban and apixaban in human plasma. Bioanalysis 2016, 8, 275–283. [Google Scholar] [CrossRef]
  11. Gous, T.; Couchman, L.; Patel, J.P.; Paradzai, C.; Arya, R.; Flanagan, R.J. Measurement of the Direct Oral Anticoagulants Apixaban, Dabigatran, Edoxaban, and Rivaroxaban in Human Plasma Using Turbulent Flow Liquid Chromatography With High-Resolution Mass Spectrometry. Ther. Drug Monit. 2014, 36, 597–605. [Google Scholar] [CrossRef]
  12. Atmakuri, C.K.; Prasad, C.; Patil, R.S.; Dharani, K. Method development and validation of selective and highly sensitive method for determination of apixaban in human plasma using liquid chromatography-tandem mass spectrometry. Int. J. Pharm. Pharm. Sci. 2019, 39–45. [Google Scholar] [CrossRef]
  13. Foerster, K.I.; Huppertz, A.; Müller, O.J.; Rizos, T.; Tilemann, L.; Haefeli, W.E.; Burhenne, J. Simultaneous quantification of direct oral anticoagulants currently used in anticoagulation therapy. J. Pharm. Biomed. Anal. 2018, 148, 238–244. [Google Scholar] [CrossRef]
  14. Wiesen, M.H.J.; Blaich, C.; Streichert, T.; Michels, G.; Müller, C. Paramagnetic micro-particles as a tool for rapid quantification of apixaban, dabigatran, edoxaban and rivaroxaban in human plasma by UHPLC-MS/MS. Clin. Chem. Lab. Med. 2017, 55, 1349–1359. [Google Scholar] [CrossRef]
  15. Slavik, L.; Jacova, J.; Friedecky, D.; Ulehlova, J.; Tauber, Z.; Prochazkova, J.; Hlusi, A.; Palova, M. Evaluation of the DOAC-Stop Procedure by LC-MS/MS Assays for Determining the Residual Activity of Dabigatran, Rivaroxaban, and Apixaban. Clin. Appl. Thromb. Hemost. 2019, 25, 1076029619872556. [Google Scholar] [CrossRef]
  16. Zheng, N.; Yuan, L.; Ji, Q.C.; Mangus, H.; Song, Y.; Frost, C.; Zeng, J.; Aubry, A.-F.; Arnold, M.E. “Center punch” and “whole spot” Bioanalysis of apixaban in human dried blood spot samples by UHPLC-MS/MS. J. Chromatogr. B Analyt. Technol. Biomed. Life Sci. 2015, 988, 66–74. [Google Scholar] [CrossRef] [PubMed]
  17. Spooner, N.; Lad, R.; Barfield, M. Dried blood spots as a sample collection technique for the determination of pharmacokinetics in clinical studies: Considerations for the validation of a quantitative bioanalytical method. Anal. Chem. 2009, 81, 1557–1563. [Google Scholar] [CrossRef] [PubMed]
  18. Li, W.; Tse, F.L.S. Dried blood spot sampling in combination with LC-MS/MS for quantitative analysis of small molecules. Biomed. Chromatogr. 2010, 24, 49–65. [Google Scholar] [CrossRef] [PubMed]
  19. Kim, H.M.; Park, J.-H.; Long, N.P.; Kim, D.-D.; Kwon, S.W. Simultaneous determination of cardiovascular drugs in dried blood spot by liquid chromatography-tandem mass spectrometry. J. Food Drug Anal. 2019, 27, 906–914. [Google Scholar] [CrossRef] [PubMed] [Green Version]
  20. Dennis Bernieh, S.T. LC-HRMS Analysis of Dried Blood Spot Samples For Assessing Adherence to Cardiovascular Medications. J. Bioanal. Biomed. 2015, 7. [Google Scholar] [CrossRef] [Green Version]
  21. Panchal, T.; Spooner, N.; Barfield, M. Ensuring the collection of high-quality dried blood spot samples across multisite clinical studies. Bioanalysis 2017, 9, 209–213. [Google Scholar] [CrossRef]
  22. Edelbroek, P.M.; van der Heijden, J.; Stolk, L.M.L. Dried blood spot methods in therapeutic drug monitoring: Methods, assays, and pitfalls. Ther. Drug Monit. 2009, 31, 327–336. [Google Scholar] [CrossRef]
  23. Rockwood, A.L.; Kushnir, M.M.; Clarke, N.J. Mass Spectrometry. In Principles and Applications of Clinical Mass Spectrometry: Small Molecules, Peptides, and Pathogens Edited by Nader Rifai, A. Rita Horvath, Carl T. Wittwer, Andy Hoofnagle; Rifai, N., Horvath, A.R., Wittwer, C., Hoofnagle, A., Eds.; Elsevier: Amsterdam, The Netherlands, 2018; pp. 33–65. ISBN 9780128160633. [Google Scholar]
  24. Lee, M.S.; Kerns, E.H. LC/MS applications in drug development. Mass Spectrom. Rev. 1999, 18, 187–279. [Google Scholar] [CrossRef]
  25. Hopfgartner, G.; Varesio, E.; Tschäppät, V.; Grivet, C.; Bourgogne, E.; Leuthold, L.A. Triple quadrupole linear ion trap mass spectrometer for the analysis of small molecules and macromolecules. J. Mass Spectrom. 2004, 39, 845–855. [Google Scholar] [CrossRef]
  26. Stahl-Zeng, J.; Lange, V.; Ossola, R.; Eckhardt, K.; Krek, W.; Aebersold, R.; Domon, B. High sensitivity detection of plasma proteins by multiple reaction monitoring of N-glycosites. Mol. Cell. Proteom. 2007, 6, 1809–1817. [Google Scholar] [CrossRef] [PubMed] [Green Version]
  27. Yan, Y.; Du, Z.; Jiang, H. HRMS for the quantification of xenobiotics in biological samples. Bioanalysis 2017, 9, 1939–1941. [Google Scholar] [CrossRef] [PubMed]
  28. Ponzetto, F.; Boccard, J.; Nicoli, R.; Kuuranne, T.; Saugy, M.; Rudaz, S. UHPLC-HRMS Analysis for Steroid Profiling in Serum (Steroidomics). Methods Mol. Biol. 2018, 1738, 261–278. [Google Scholar] [CrossRef] [PubMed]
  29. Rauniyar, N. Parallel Reaction Monitoring: A Targeted Experiment Performed Using High Resolution and High Mass Accuracy Mass Spectrometry. Int. J. Mol. Sci. 2015, 16, 28566–28581. [Google Scholar] [CrossRef] [PubMed] [Green Version]
  30. Peterson, A.C.; Russell, J.D.; Bailey, D.J.; Westphall, M.S.; Coon, J.J. Parallel reaction monitoring for high resolution and high mass accuracy quantitative, targeted proteomics. Mol. Cell. Proteom. 2012, 11, 1475–1488. [Google Scholar] [CrossRef] [PubMed] [Green Version]
  31. Hu, A.; Noble, W.S.; Wolf-Yadlin, A. Technical advances in proteomics: New developments in data-independent acquisition. F1000. Fac. Res. 2016, 5. [Google Scholar] [CrossRef] [Green Version]
  32. Foerster, K.I.; Huppertz, A.; Meid, A.D.; Müller, O.J.; Rizos, T.; Tilemann, L.; Haefeli, W.E.; Burhenne, J. Dried-Blood-Spot Technique to Monitor Direct Oral Anticoagulants: Clinical Validation of a UPLC-MS/MS-Based Assay. Anal. Chem. 2018, 90, 9395–9402. [Google Scholar] [CrossRef] [PubMed]
  33. Lindahl, S.; Dyrkorn, R.; Spigset, O.; Hegstad, S. Quantification of Apixaban, Dabigatran, Edoxaban, and Rivaroxaban in Human Serum by UHPLC-MS/MS-Method Development, Validation, and Application. Ther. Drug Monit. 2018, 40, 369–376. [Google Scholar] [CrossRef]
  34. Secrétan, P.-H.; Sadou-Yayé, H.; Aymes-Chodur, C.; Bernard, M.; Solgadi, A.; Amrani, F.; Yagoubi, N.; Do, B. A comprehensive study of apixaban’s degradation pathways under stress conditions using liquid chromatography coupled to multistage mass spectrometry. RSC Adv. 2015, 5, 35586–35597. [Google Scholar] [CrossRef]
  35. Aksenova, L.V.; Koval, V.V.; Chernonosov, A.A. Optimization of the Extraction Procedure of Apixaban from Dried Rat Plasma Spots. JPRI 2020, 6–14. [Google Scholar] [CrossRef]
  36. Chernonosov, A.A. Quantification of Warfarin in Dried Rat Plasma Spots by High-Performance Liquid Chromatography with Tandem Mass Spectrometry. J. Pharm. 2016, 2016, 6053295. [Google Scholar] [CrossRef] [PubMed] [Green Version]
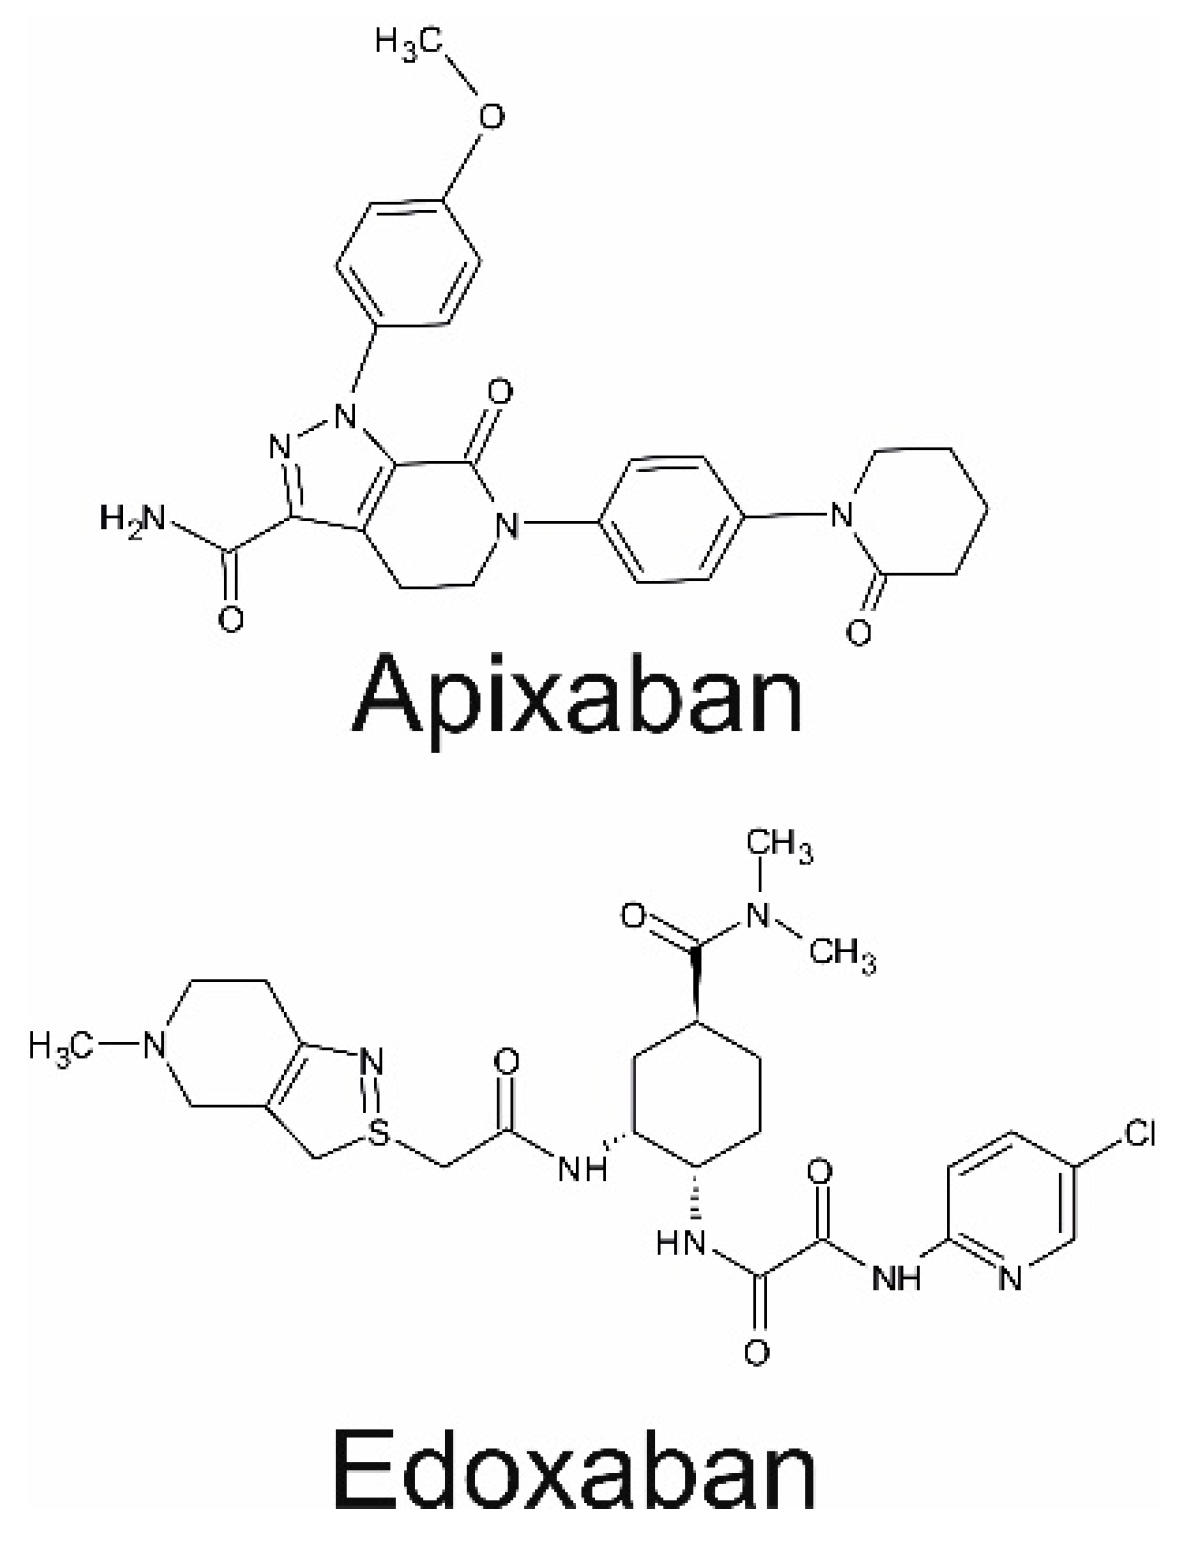
Figure 1. Structures of apixaban and edoxaban.
Processes 09 00450 g001
Figure 2. The mass spectrum of apixaban registered in parallel reaction monitoring (PRM) mode. Masses of fragment ions of apixaban are pointed out. The fragment ions used for the quantification are highlighted in bold and are assigned chemical structures.
Processes 09 00450 g002
Figure 3. The mass spectrum of the internal standard (IS) registered in PRM mode. Masses of the fragment ions of the IS used in the work are pointed out and are boldfaced.
Processes 09 00450 g003
Figure 4. Liquid chromatography with high-resolution mass spectrometry (LC–HRMS) chromatograms of (a) a blank dried plasma spots (DPS), (b) the limit of quantitation (LOQ) of apixaban (10 ng/mL), and (c) the IS (2.5 ng/mL) with the corresponding retention time (RT) and signal-to-noise ratio (S/N).
Processes 09 00450 g004
Table 1. Intraday and interday accuracy and precision.
Concentration, ng/mLInterday (n = 18)Intraday (n = 12)
% bias% RSD% bias% RSD
405.09.66.13.0
2003.45.95.75.2
3508.34.47.13.9
Table 2. Extraction recovery and the matrix effect.
Concentration, ng/mLRecovery, %Matrix Effect, %Efficiency, %
4069.799.369.2
20073.589.365.6
35085.1102.287.0
Table 3. Stability of apixaban in the autosampler.
Concentration, ng/mL0 h5 h24 h48 h
% bias% RSD% bias% RSD% bias% RSD% bias% RSD
3011.013.23.210.510.915.411.817.2
200−2.66.6−1.87.4−2.07.9−5.96.7
35010.18.66.812.77.19.88.38.8
Table 4. Stability of apixaban in DPSs at 4 and 20 °C.
Concentration, ng/mL1 day7 days21 days35 days
% bias% RSD% bias% RSD% bias% RSD% bias% RSD
20 °C
30−5.54.69.613.03.69.6−6.224.1
200−7.04.9−6.75.9−5.210.8−11.35.7
350−7.38.3−11.311.0−8.87.3−34.48.5
4 °C
30−5.54.6−62.420.1−53.317.0−29.613.5
200−7.04.9−16.13.8−10.46.7−16.612.9
350−7.38.33.99.410.910.9−3.12.3
Publisher’s Note: MDPI stays neutral with regard to jurisdictional claims in published maps and institutional affiliations.