Article

Quantitative Determination of Vitamins A and E in Ointments Using Raman Spectroscopy

Laboratory of Chemometrics and Applied Spectroscopy, Department of Chemistry, University of Wrocław, 14 F. Joliot-Curie, 50-383 Wrocław, Poland
*
Authors to whom correspondence should be addressed.
Processes 2021, 9(1), 8; https://doi.org/10.3390/pr9010008
Submission received: 4 December 2020 / Revised: 18 December 2020 / Accepted: 21 December 2020 / Published: 23 December 2020
(This article belongs to the Special Issue Pharmaceutical and Biomedical Analysis)

Abstract

:
A quantitative analysis of vitamins A and E in commercial ointments containing 0.044% and 0.8% (w/w) of active pharmaceutical ingredients, respectively, was performed using partial least squares models based on FT Raman spectra. Separate calibration systems were prepared to determine the amount of vitamin A in a petrolatum base ointment and to quantify vitamins A and E in a eucerin base one. Compositions of the laboratory-prepared and commercial samples were controlled through a principal component analysis. Relative standard errors of prediction were calculated to compare the predictive ability of the obtained regression models. For vitamin A determination, these errors were found to be in the 3.8–5.0% and 5.7–5.9% ranges for the calibration and validation data sets, respectively. In the case of vitamin E modeling, these errors amounted to 3.7% and 4.4%. On the basis of elaborated models, vitamins A and E were successfully quantified in two commercial products with recoveries in the 99–104% range. The obtained data indicate that the Raman technique allows for accurate analysis of the composition of semisolid formulations in their native state, including low dose preparations.

Graphical Abstract

1. Introduction

Vitamins A and E, belonging to the group of a lipid-soluble active compounds, are essential nutrients that humans can only acquire through diet. Vitamin A, 3,7-dimethyl-9-(2,6,6-trimethyl-1-cyclohexen-1-yl)-2,4,6,8-nonatetraen-1-ol, is one of some 50 compounds found in nature called retinoids. In the animal world, retinol (Figure 1) and its derivatives dominate, while in plant products, carotenoids are present. Vitamin A plays an essential role in growth, development, immune functions, vision and reproduction [1]. Vitamin E can also be present in a variety of forms, including the most common, tocopherol (Figure 1). It exhibits antioxidant properties by scavenging free radicals that can attack DNA or may cause oxidation of polyunsaturated fatty acids [2]. Both vitamins are ingredients in a number of medicines and diet supplements, usually in the form of drops, capsules and tablets, used to prevent vitamin deficiency. Retinoid derivatives, retinyl acetate, retinyl palmitate and beta-carotene (provitamin A), are frequently used as food additives. In the case of vitamin E, the α-, β-, γ- and δ- forms of tocopherol, known as E306–E309 additives, are approved for use in the food industry. They can also be found in creams and ointments intended to protect skin against aging and the harmful effects of external factors. The official monographs of these vitamins’ quantification include a spectrophotometric method and reversed-phase high-performance liquid chromatography (RP-HPLC) with UV or fluorescence detection, preceded by compound extraction using various solvents [3].
Raman spectroscopy belongs to the group of vibrational spectroscopy techniques. It can be used to determine the structure of chemical compounds. Bands present in characteristic ranges of spectra allow the identification of functional groups and distinguishing of unique structural moieties of the molecules being analyzed [4]. This type of spectroscopy can support analysis of pure chemical substances and enables identification of compounds of interest in more complex systems, which makes Raman spectroscopy a very useful technique in analysis of pharmaceutical, cosmetic, food and natural products. In the case of industrial applications, this method can be adopted to monitor various stages of the production process, starting from raw material and semi-products analysis through the supervision of production steps and the analysis of the final products [5,6].
Raman spectroscopy is particularly suitable for the analysis of pharmaceutical products containing high doses of Active Pharmaceutical Ingredients (APIs) [7]. In conjunction with chemometric treatment of spectral data, it enables a detailed qualitative and quantitative examination of the studied product [8]. One of the important advantages of this technique is related to its capability to analyze various types of pharmaceuticals, including tablets, suppositories, ointments, gels, solutions and suspensions, in their native form, often with little or no pre-treatment [7,9,10,11]. Application of chemometric techniques to data processing allows analysis of medicines containing a very small amount of APIs, making Raman spectroscopy a convenient tool of analysis for a wide range of pharmaceutical products. Additionally, it enables quantification of a number of compounds present in the studied formulations, which is usually impossible when chromatographic, electrochemical or wet chemistry methods are used. Applying appropriate calibration models, both APIs and additives, including their polymorphic forms, can be quantitatively determined simultaneously based on a single Raman spectrum of the sample. Another advantage of this method is its capability to analyze pharmaceutical products in their original packaging. This makes Raman spectroscopy an excellent analytical tool that is increasingly used in various fields. It is particularly useful in the pharmaceutical industry for production process supervision.
The applicability of Raman spectroscopy for retinol quantification was first demonstrated by Hancewicz et al. [12] who observed a linear relation between API content in a sorbitan monooleate base vehicle and the intensity of Raman bands in isopropanol extracts. This technique was also used to quantify time-dependent retinol damages in cosmetic formulations due to UV irradiation [13]. In the case of biological systems, distribution of vitamin A in liver tissue was analyzed by confocal Raman spectroscopy [14] and the CARS technique [15], while cytoplasmic accumulation of retinoids in nematodes through Raman spectra was studied as well [16]. Raman spectroscopy was utilized to quantify α-tocopherol in oil-water emulsions [17] and to determine its content in vegetable oils [18]. To analyze distribution of α-tocopherol in biological samples, Raman mapping was applied [19].
Herein, we present the results of simultaneous vitamin A and E quantification in commercial ointments. The composition of the base present in medicines was reconstructed and a set of laboratory-made samples containing the studied APIs was prepared. Then, partial least squares (PLS) regression models based on FT Raman spectra were built and validated. Applying the elaborated models, medicines containing 0.044% and 0.8% (w/w) of vitamins A and E, respectively, were successfully quantified.

2. Materials and Methods

2.1. Apparatus

FT Raman spectra were recorded using a Raman accessory (Thermo Nicolet, Madison, WI, USA) attached to a Magna 860 FTIR (Thermo Nicolet) spectrometer. A CaF2 beamsplitter and indium gallium arsenide (InGaAs) detector were utilized. Analyzed samples in NMR glass tubes were rotated at a constant speed of an approximately 200 rpm. They were illuminated by an Nd:YVO4 laser line at 1.064 µm with a power of 180 mW at the sample. The converging lens was removed from the optical path and backscattered radiation was collected. Interferograms were averaged over 400 scans, then Happ-Genzel apodized and Fourier transformed using a zero filling factor of 2 to obtain spectra at a resolution of 8 cm−1 in the 100–3700 cm−1 range.

2.2. Chemicals

The substances used for the preparation of calibration samples, namely commercial drops containing vitamins A and E (Medana Pharma, Sieradz, Poland), eucerin (PF Ziołolek, Poznań, Poland), white petrolatum (FL Coel, Kraków, Poland) and DMG 0291 emulsifier (Palsgaard, Juelsminde, Denmark) were of pharmacopoeial purity. Vitamin A drops, consisted of retinyl palmitate (50,000 IU/mL), macrogolglycerol ricinoleate, purified water and minute amounts of sucrose, sodium benzoate, sodium salicylate and citric acid as additives. In the case of vitamin E drops, all-rac-α-tocopheryl acetate (300 mg/mL) was dissolved in arachis oil carrier. Samples were prepared using purified water (Merck Millipore, Darmstadt, Germany) characterized by a resistivity of 18.2 MΩ cm at 25 °C. Two commercial ointments, one with retinyl palmitate (800 IU/g of vitamin A) and the other containing retinyl palmitate (800 IU/g of vitamin A) and tocopheryl acetate (8 mg/g of vitamin E) were purchased in a local pharmacy.

2.3. Sample Preparation

To build calibration models, two separate sets of samples were prepared, one by mixing petrolatum with vitamin A drops and the second, containing eucerin and vitamins A and E. Due to very low concentrations of APIs in the studied medicines, first, stock mixtures of vitamins with suitable vehicles were prepared. Mixing portions of stock mixtures with bases resulted in 35 ointment samples prepared for each of the studied systems. The content of vitamin A was in the 0.01–0.08% range in the petrolatum base ointments, while in the eucerin base, concentrations of vitamins A and E were maintained in the 0.01–0.08% and 0.19–1.42% ranges, respectively. For samples containing both vitamins, the composition of samples was optimized to avoid collinearity between API concentrations. No significant correlation between vitamin A and E content was observed (R2 = 0.15). Prepared samples were transferred to the NMR tube with a syringe and Raman spectra were recorded.

2.4. Modeling and Spectral Data Treatment

Partial least squares (PLS) regression is the most popular chemometric tool used for quantitative modeling of the multidimensional data [20]. This technique uses statistically significant orthogonal factors to build a regression model establishing linear relationships between the dependent variables (Y), which in this analysis are concentrations of the components, and the independent variable (X), in our case Raman spectra of samples, according to the formula:
Y = XB + E
where B is a matrix of regression coefficients and E represents the error not accounted by the model. PLS method is based on matrix decomposition procedure. The variables are transformed into new ones that are linear combinations of the original. They are obtained in such a way that the covariance between factors obtained during decomposition of independent and dependent data blocks:
X = TPT + EX
and
Y = UQT + EY
is maximized, where T and U are the scores and P and Q are the loadings matrices. This way of data treatment makes that PLS models are characterized by a higher prediction ability than classical least squares (CLS), inverse least squares (ILS) or principal component regression (PCR) calibration methods.
PCA was performed with the help of PLS-Toolbox (ver. 6.2, Eigenvector Research, Wenatchee, WA, USA) in Matlab (ver. 7.10, MathWorks, Natwick, MA, USA) environment. TurboQuant Analyst (ver. 9.7, Thermo Scientific, Madison, WI, USA) was used to construct calibration models and quantify vitamins in the studied ointments. All spectral data were mean centered. For both studied systems, applying PCA score plots, eight samples were selected for external validation and the remaining 27 were used for modeling purposes. The predicted residual sum of squares (PRESS) was calculated to find an optimal number of PLS factors. To characterize the predictive ability of the models, relative standard errors of prediction were calculated according to the equation:
R S E P ( % ) = i = 1 n ( C i C i A ) 2 i = 1 n C i A 2 × 100 ,
where CA is the actual component content, C is the concentration found from spectral data analysis, and n is the number of samples for calibration (RSEPcal) and validation (RSEPval) sets.

3. Results

Figure 1 illustrates molecular structures of retinol and α-tocopherol, while Raman spectra of drops containing ~2.8% of the studied APIs and of one of the analyzed commercial ointment with an eucerin base are presented in Figure 2. As the concentrations of APIs are very low, their spectral features can hardly be detected in the Raman spectra of the analyzed pharmaceutical products. Only the strongest band of vitamin A, associated with C = C stretching vibration of the aliphatic skeleton with a maximum at 1591 cm−1, can be visible in the spectra of calibration samples containing higher retinol concentrations. In the case of vitamin E, spectral features with maxima at 2929, 1654, 1439 and 1304 cm−1 present in the spectrum of the concentrated preparation, covered by eucerin and retinol bands, are not detectable.

3.1. Preparation of the Ointment Base
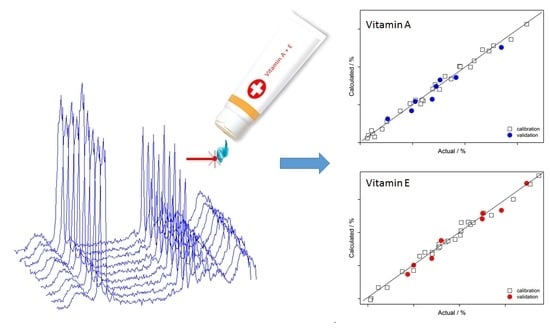
A semisolid form of ointment allows easy penetration of dissolved API into tissue and makes it appropriate for topical treatment. Various ointment bases have specific physicochemical characteristics that influence their therapeutic uses. Because retinol, tocopherol and their derivatives are oil soluble, petrolatum and eucerin are typical bases for ointments containing these substances. In our studies, we prepared a set of laboratory samples reflecting real product composition as closely as possible. Compatibility of the laboratory-prepared and real samples was controlled using PCA analysis. Figure 3 shows scores plots of PCA decomposition of the Raman intensity matrix of laboratory prepared samples (Figure S1 in Supplementary Materials). Distribution of real samples in the variability space of the three first principal components (Figure S2 in Supplementary Materials) confirms that the spectra of calibration mixtures reflect spectral variability characteristic for the studied ointments. Loadings of the first three PCs are shown in Figure S2 in Supplementary Materials. It is worth noting that an important issue during sample preparation was related to adjusting the concentration of water in them.

3.2. PLS Modeling

Raman spectra recorded for the analyzed ointments (Figure S1 in Supplementary Materials) were characterized by moderate values of the signal-to-noise (S/N) ratio (~106), which, in combination with a low intensity of observed Raman signals from APIs, related to their low concentration, prevented the use of univariate modeling methods.
Calibration models were constructed separately for each API in the two analyzed ointments utilizing a PLS algorithm. Selected spectral ranges were applied: 200–390, 600–840, 1500–1900 and 2860–2920 cm−1. Four PLS factors were used for retinol and five for α-tocopherol modeling. The obtained prediction curves were characterized by determination coefficient (R2) values in the 0.98–0.99 range (Figure 4 and Table 1). The plots of reggresion coefficients and VIP scores for the obtained models are presented in Figure S3 in Supplementary Materials. Internal validation of the models was performed using the leave-one-out method, resulting in RCV values exceeding 0.81. RSEPcal errors for vitamin A were found to be in the 3.8–5.0% range, while RSEPval errors amounted to 5.7–5.9%. In the case of vitamin E, they were found to be 3.7% and 4.4% (Table 1). It is evident that in spite of a 20-fold lower concentration of retinol in comparison to α-tocopherol in the eucerin-containing ointments, the obtained model parameters are comparable.
An extraordinarily high Raman cross-section of retinol makes spectral variability of this compound clearly distinguishable by chemometric methods, even if its concentration in the analyzed ointments does not exceed 0.05%.
Using the developed models two commercial ointments, one containing 800 IU of vitamin A and the other with 800 IU of vitamin A and 8 mg/g of vitamin E (i.e., 0.044% and 0.8%, respectively), were quantified on the basis of their Raman spectra. Results of their quantification (n = 8) are presented in Table 1. The obtained values show that both vitamins can be reliably quantified with 98.8–104.3% recovery. It is possible to improve the prediction ability of respective models, as their quality depends on the S/N for the registered Raman spectra, but it would require a longer measurement time [21].

4. Conclusions

The obtained results confirm the high potential of Raman spectroscopy as a fast, reliable and economic technique that can be applied for quantification of compounds important in pharmaceutical industry, independently on the physical state of the product being analyzed. Processing of the most common forms of pharmaceutical products, i.e., tablets, capsules, powders and granules may require grinding as the only step before Raman analysis. Quantification of API’s in ointments and gels can be performed for intact products. Additionally, in the case of the latter products, in typical official protocols of API analysis, sample dissolution or compound extraction is required [22]. These steps are not needed during Raman analysis, which significantly simplifies the analysis and makes it faster and cheaper. Additionally, this type of analysis is environmentally friendly, as no solvents or chemical reagents are necessary. Therefore the developed procedure can be reliable alternative to the official pharmacopoeial methods of ointments analysis.
Summarizing, commercial ointments containing 0.044% vitamin A and 0.8% vitamin E were successfully quantified with recoveries in the 99–104% range using Raman spectroscopy and PLS modeling. Even at very small concentrations of the studied vitamins, it is possible to perform direct API analysis in semisolid formulations based on the Raman spectra of carefully prepared calibration systems.

Supplementary Materials

The following are available online at https://www.mdpi.com/2227-9717/9/1/8/s1, Figure S1: Raman spectra of calibration samples for eucerin base system; Figure S2: Loadings’ plots for the first three PCs for eucerin base system; Figure S3: Regression coefficients and VIP scores for modeling of vitamin A and vitamin E.

Author Contributions

Conceptualization, S.M. and R.S.; investigation, S.M., K.P. and R.S.; supervision, S.M. and R.S.; writing—original draft preparation, S.M.; writing—review and editing, R.S. All authors have read and agreed to the published version of the manuscript.

Funding

This research received no external funding.

Institutional Review Board Statement

Not applicable.

Informed Consent Statement

Not applicable.

Data Availability Statement

Data is contained within the article.

Conflicts of Interest

The authors declare no conflict of interest.

References

  1. Lane, M.A. Retinoic acid–Independent actions of the naturally occuring retinoids: Retinol, the retroretinoids, and 4-oxoretinol. In Vitamin A: New Research; Loessing, I.T., Ed.; Nova Biomdical Books: New York, NY, USA, 2007; pp. 25–38. ISBN 9781600216688. [Google Scholar]
  2. Tomasetti, M.; Alleva, R.; Wang, X.; Neuzil, J. Vitamin E analogs and potentation of cancer therapy. In Vitamin E: New Research; Braunstein, M.H., Ed.; Nova Science Publishers: New York, NY, USA, 2006; pp. 21–38. ISBN 9781594549700. [Google Scholar]
  3. USP29-NF. Vitamin A Monograph, Vitamin E Monograph; US Pharmacopeial Convention: Rockville, MD, USA, 2006; pp. 2258,2260. ISBN 1889788392/9781889788395. [Google Scholar]
  4. Pelletier, M.J. Introduction to applied Raman spectroscopy. In Analytical Applications of Raman Spectroscopy; Pelletier, M.J., Ed.; Blackwell Science: Oxford, UK, 1999; pp. 1–52. ISBN 9780632053056. [Google Scholar]
  5. Paudel, A.; Raijada, D.; Rantanen, J. Raman spectroscopy in pharmaceutical product design. Adv. Drug Deliv. Rev. 2015, 89, 3–20. [Google Scholar] [CrossRef] [PubMed] [Green Version]
  6. Esmonde-White, K.A.; Cuellar, M.; Uerpmann, C.; Lenain, B.; Lewis, I.R. Raman spectroscopy as a process analytical technology for pharmaceutical manufacturing and bioprocessing. Anal. Bioanal. Chem. 2017, 409, 637–649. [Google Scholar] [CrossRef] [PubMed] [Green Version]
  7. Vankeirsbilck, T.; Vercauteren, A.; Baeyens, W.; Van der Weken, G.; Verpoort, F.; Vergote, G.; Remon, J.P. Applications of Raman spectroscopy in pharmaceutical analysis. TrAC Trends Anal. Chem. 2002, 21, 869–877. [Google Scholar] [CrossRef]
  8. Biancolillo, A.; Marini, F. Chemometric Methods for Spectroscopy-Based Pharmaceutical Analysis. Front. Chem. 2018, 6, 14. [Google Scholar] [CrossRef] [PubMed]
  9. Mazurek, S.; Szostak, R. Quantitative analysis of topical gels and ointments by FT-Raman spectroscopy. Vib. Spectrosc. 2016, 83, 1–7. [Google Scholar] [CrossRef]
  10. Mazurek, S.; Szostak, R. Quantification of active ingredients in pharmaceutical suspensions by FT Raman spectroscopy. Vib. Spectrosc. 2017, 93, 57–64. [Google Scholar] [CrossRef]
  11. Szostak, R.; Mazurek, S. Quantification of active ingredients in suppositories by FT-Raman spectroscopy. Drug Test. Anal. 2013, 5, 126–129. [Google Scholar] [CrossRef] [PubMed]
  12. Hancewicz, T.M.; Petty, C. Quantitative analysis of vitamin A using Fourier transform Raman spectroscopy. Spectrochim. Acta A 1995, 51, 2193–2198. [Google Scholar] [CrossRef]
  13. Failloux, N.; Bonnet, I.; Baron, M.H.; Perrier, E. Quantitative analysis of vitamin A degradation by Raman spectroscopy. Appl. Spectrosc. 2003, 57, 1117–1122. [Google Scholar] [CrossRef] [PubMed]
  14. Kochan, K.; Marzec, K.M.; Maslak, E.; Chlopicki, S.; Baranska, M. Raman spectroscopic studies of vitamin A content in the liver: A biomarker of healthy liver. Analyst 2015, 140, 2074–2079. [Google Scholar] [CrossRef] [PubMed]
  15. Legesse, F.B.; Heuke, S.; Galler, K.; Hoffmann, P.; Schmitt, M.; Neugebauer, U.; Bauer, M.; Popp, J. Hepatic Vitamin A Content Investigation Using Coherent Anti-Stokes Raman Scattering Microscopy. Chem. Phys. Chem. 2016, 17, 4043–4051. [Google Scholar] [CrossRef] [PubMed]
  16. Chen, A.J.; Li, J.J.; Jannasch, A.; Mutlu, A.S.; Wang, M.C.; Cheng, J.X. Fingerprint Stimulated Raman Scattering Imaging Reveals Retinoid Coupling Lipid Metabolism and Survival. Chem. Phys. Chem. 2018, 19, 2500–2506. [Google Scholar] [CrossRef] [PubMed]
  17. Wang, K.Q.; Sun, D.W.; Wei, Q.Y.; Pu, H.B. Quantification and visualization of alpha-tocopherol in oil-in-water emulsion based delivery systems by Raman microspectroscopy. LWT Food Sci. Technol. 2018, 96, 66–74. [Google Scholar] [CrossRef]
  18. Feng, S.L.; Gao, F.; Chen, Z.W.; Grant, E.; Kitts, D.D.; Wang, S.; Lu, X.N. Determination of alpha-tocopherol in vegetable oils using a molecularly imprinted polymers-surface-enhanced Raman spectroscopic biosensor. J. Agric. Food. Chem. 2013, 61, 10467–10475. [Google Scholar] [CrossRef] [PubMed]
  19. Beattie, J.R.; Maguire, C.; Gilchrist, S.; Barrett, L.J.; Cross, C.E.; Possmayer, F.; Ennis, M.; Elborn, J.S.; Curry, W.J.; McGarvey, J.J.; et al. The use of Raman microscopy to determine and localize vitamin E in biological samples. FASEB J. 2007, 21, 766–776. [Google Scholar] [CrossRef] [PubMed]
  20. Geladi, P.; Kowalski, B.R. Partial least-squares regression–A tutorial. Anal. Chim. Acta 1986, 185, 1–17. [Google Scholar] [CrossRef]
  21. Li, B.; Calvet, A.; Casamayou-Boucau, Y.; Morris, C.; Ryder, A.G. Low-Content Quantification in Powders Using Raman Spectroscopy: A Facile Chemometric Approach to Sub 0.1% Limits of Detection. Anal. Chem. 2015, 87, 3419–3428. [Google Scholar] [CrossRef] [PubMed] [Green Version]
  22. Nickerson, B.; Scrivens, G. Sample prepartion for solid oral dosage forms. In Sample Preparation of Pharmaceutical Dosage Forms; Nickerson, B., Ed.; Springer: New York, NY, USA, 2011; pp. 145–178. [Google Scholar] [CrossRef]
Figure 1. Molecular structure of retinol and α-tocopherol.
Processes 09 00008 g001
Figure 2. Raman spectra of commercial ointment, vitamin A and vitamin E drops, eucerin base and water; spectra were shifted for clarity.
Processes 09 00008 g002
Figure 3. PCA score plots of Raman intensity matrix for petrolatum-(top) and eucerin-based (bottom) ointments; PC1/PC2 (left panel) and PC1/PC3 (right panel), circles–calibration samples, triangles–commercial products.
Processes 09 00008 g003aProcesses 09 00008 g003b
Figure 4. Prediction plots (left panel) and relative errors (right panel) for vitamins A (top) and E (bottom) content in eucerin-based ointment obtained using PLS models based on Raman spectra.
Processes 09 00008 g004
Table 1. Parameters of PLS models and results of API determination in commercial ointments (n = 8).
Ointment Base SystemPetrolatumEucerin
APIVitamin AVitamin AVitamin E
Concentration range (%)0.016–0.0790.022–0.0840.317–1.419
R20.9800.9900.988
RCV0.8360.8530.817
RSEPcal (%)4.963.833.71
RSEPval (%)5.915.694.38
Number of LV445
Determined content (%)0.046 ± 0.0030.045 ± 0.0020.78 ± 0.02
Recovery (%)104.3102.898.8
Publisher’s Note: MDPI stays neutral with regard to jurisdictional claims in published maps and institutional affiliations.

