Article

Hydroponic Farm Wastewater Treatment Using an Indigenous Consortium

by
Florian Delrue
1,*,
Matheus Ribeiro de Jesus Cerqueira
1,
Ana Compadre
1,
Pablo Alvarez
1,
Gatien Fleury
1,
Camille Escoffier
2 and
Jean-François Sassi
1
1
MicroAlgae Processes Platform, CEA, CEA Tech Région Sud-Provence-Alpes Côte d’Azur, F-13108 Saint Paul lez Durance, France
2
ADEQUABIO, 139 Rue Philippe de Girard, F-84120 Pertuis, France
*
Author to whom correspondence should be addressed.
Processes 2021, 9(3), 519; https://doi.org/10.3390/pr9030519
Submission received: 18 January 2021 / Revised: 7 March 2021 / Accepted: 10 March 2021 / Published: 13 March 2021
(This article belongs to the Special Issue Sustainable Development of Waste towards Green Growth)

Abstract

:
Hydroponic farms produce wastewater that need to be treated before being released into the environment. A three-step screening process (microplate, batch, and semi-continuous flasks experiments) initially designed to select an efficient microalgae strain allowed the isolation of a consortium that naturally developed in the hydroponic farm wastewater. During the non-optimized semi-continuous experiments, the best performing microalgae strain, Scenedesmus obliquus UTEX393 and the wastewater-born consortium cultures achieved good average linear growth rate (0.186 and 0.198/d, respectively) and high average nitrogen removal rates (23.5 mgN/L/d and 21.9 mgN/L/d, respectively). Phosphorus removal was very high probably due to precipitation. An integrated process was designed to treat the hydroponic farm wastewater using the wastewater-born consortium. Despite relatively low coagulation efficiencies in the preliminary tests, when integrated in a continuous process, chitosan was efficient to harvest the naturally wastewater-born consortium. The process was also efficient for removing nitrate and phosphate in less than seven days (average removal of 98.2 and 87.1% for nitrate and phosphate, respectively). These very promising results will help to define a pre-industrial pilot process.

1. Introduction

Agriculture is producing large amount of wastewaters that contains high levels of pollutants such as nitrogen, phosphorus, and organic matter [1,2].
Hydroponic or soilless culture is a method where the plants are grown without soil under a greenhouse. These systems are effective in removing the problem of soil-borne pathogens, increasing the crop yield and the quality of the product, and improving the nutrient and water usage, especially in closed system where the nutrition water is recycled [3].
These closed systems are nowadays the standard for hydroponic farms. However, in these systems, some of the recycled water need to be discharged due to the increase in salinity and to the remaining ions that are not assimilated by plants [4]. These hydroponic farm wastewaters (HFWW) are rich in mineral pollutants (nitrate, phosphate, and sulfate) and poor in organic matter [5].
Microalgae have the capability to depollute wastewaters from their mineral pollutants, especially nitrate and phosphate [6]. In this context, the growth of microalgae on HFWW can benefit both agriculture and the microalgae industry in a win-win association. On one hand, microalgae can help HFWW to reach the concentration limits allowing its discharge in the environment according to the regulation (for example in France, Article R211-48 of the “Code de l’Environnement”). On the other hand, microalgae can find in HFWW most of their needed nutrients which normally represents a large part of the cost of microalgae grown on artificial medium [7].
In this study, we have investigated the potential of microalgae to treat HFWW while producing a valuable biomass. A three-step screening procedure was designed. First, the capability of four microalgae and one consortia to grow on HFWW was tested in microplates then in flasks for the second test. In these preliminary experiments, an indigenous consortium was isolated from the HFWW. It was then used alongside the four other microalgae cultures in semi-continuous experiments to test their capacity to treat HFWW on the longer term as the third and last step of the screening procedure. Finally, an integrated continuous process is proposed for removing nitrate and phosphate from HFWW using the isolated indigenous consortium and a harvesting process using chitosan.

2. Materials and Methods

2.1. Strains, Medium, and Effluent

Four microalgae strains (Chlorella vulgaris NIES227, Parachlorella kessleri NIES2152, Scenedesmus obliquus UTEX393, Scenedesmus quadricauda UTEXB614), and one consortia isolated from ponds that are depolluting phytosanitary effluents (the Phytobarre system from the ADEQUABIO company (Pertuis, France), https://www.adequabio.fr/ (accessed on 7 March 2021)) named consortium B1 (micrograph in Appendix A) were selected for this study for their fast-growing potential and their ability to assimilate mineral nutrients. The strains are maintained on agar plates (2% w/w agar) with Fresh-Water Medium (FWM).
FWM was designed to provide enough nutrients (N, P and S) for producing 4 g/L of biomass for a chlorophycea-type strain. The calculations were made based on elemental analyses of biomass of Parachlorella kessleri NIES 2152 (data not shown). The FWM composition is: 1459 mg/L of NaNO3, 102 mg/L of NH4Cl, 233 mg/L of KH2PO4, 143 mg/L of MgSO4, 7H2O, 1.5 mg/L of CaCl2, 2H2O and trace elements as 1 mL/L of the Hutner solution [8] as follows (final concentrations): 50 mg/L of EDTA, 11.4 mg/L of H3BO3, 22 mg/L of ZnSO4, 7H2O, 5.06 mg/L of MnCl2, 4H2O, 4.99 mg/l of FeSO4, 7H2O, 1.61 mg/L of CoCl2, 6H2O, 1.57 mg/L of CuSO4, 5H2O and 1.1 mg/L of Mo7O24(NH4)6, 4H2O. The pH was adjusted from 7.2 to 7.4 with 1 M KOH (approximately 7 mL/L) before being sterilized in an autoclave at 121 °C for 20 min.
HFWW was produced in a pilot-scale greenhouse cultivating hydroponic tomatoes at CTIFL Balandran (France). It consists in the run-off of the hydroponic tomato culture that is fed with a nutritive solution. Four different samples (from 2 to 5 L) were taken in the collection tank where the gullies are discharging the run-off. This discharging zone was manually mixed before sampling to ensure a homogenous and fresh effluent.

2.2. Culture Conditions

Pre-cultures were grown in FWM from agar plates. Aliquots from the pre-cultures were used as inoculums in 125 mL flasks. Microalgae were grown in triplicates in HT Multitron Pro incubators (Infors HT, Switzerland) at 25 °C, under an incident photosynthetic photon flux density (PPFD) of 80 μmol/m2/s, in a photoperiod of 20 h light: 4 h dark cycles. Agitation was kept at 130 rpm and air was enriched with 2% CO2. These conditions were applied for all the experiments except for the tests in 24-well microplates (10 mL, round bottom, Whatman UNIPLATE, GE, Boston, MA, USA) that were conducted on shakers. These conditions are detailed in their corresponding Section.

2.3. Analytical Techniques

Biomass production measurements involved centrifuging culture aliquots (5 or 10 mL) at 4500 RPM (4700 G) in an Allegra X15R (Beckman Coulters, Brea, CA, USA), replacing the supernatant with distilled water, centrifuging again in the same condition, discarding of the resulting supernatant, and transferring the pellet in pre-weighted aluminum weighing dishes using distilled water. The dishes were placed overnight at 105 °C in a dry oven. The dry cell weight (DCW), illustrating the biomass concentration in g/L, is given by the ratio between the weight difference between empty and dried dishes, and the volume filtered.
Biomass productivity was calculated using Equation (1) with DCWt at a given growth time t.
Biomass   Productivity = DCW t 2 - DCW t 1 t 2 - t 1
Biomass growth was also determined by optical density (OD) measurements at 880 nm in 1 mL cuvettes with a UV–Vis Epoch2 spectrophotometer (BioTek Instruments, Winooski, VT, USA).
Ions were determined using a 940 Professional Ion Chromatography from Metrohm (Herisau, Switzerland). A Metrosep C4 was used for cation (ammonium, magnesium, potassium, and sodium) with an elution solution made of nitric and dipicolonic acids at 34 mM. A Metrosep A column was used for anion (acetate, chloride, nitrate, phosphate, and sulfate) with an elution solution made of sodium carbonate at 72 mM. Chemical Oxygen Demand (COD) was measured using kits LCK314 from HACH (Düsseldorf, Germany). Nitrate removal rates were calculated as the difference of nitrate concentrations between the final day and the day 1 of the experiment divided by the number of days.

2.4. Chitosan Coagulation Experiments

The coagulation experiments were performed in an automated jar tester apparatus (model JTL 6, Velp Scientifica, Italy) consisting of six 500-mL beakers with a common agitation camshaft allowing the simultaneous dosage of six different coagulant doses. During the coagulation experiments, the samples were agitated at 200 rpm for 2 min in order to completely incorporate the coagulant into the algal solution. The agitation speed was then reduced to 70 rpm for 10 min to help aggregate the floc. Chitosan (CAS 9012-76-4, from Sigma Aldrich, St. Louis, MO, USA) used for these tests was diluted in acetic acid (0.1 mol/L) under constant agitation using the method detailed in [9]. Coagulation efficiency was calculated as indicated in Equation (2).
Coagulation   efficiency   ( in   % ) =   ( OD culture OD supernatant   from   flocculation ) ( OD culture OD supernatant   from   centrifugation ) × 100

3. Results

3.1. Effluent Characterization

In hydroponic farms, the nutritive solution passes through the plants roots and is then collected by gullies. This collected water that has been used to feed the plants is thereafter called HFWW.
HFWW characteristics varied greatly between the four batches (Table 1). These differences come from the change in the nutritive solution. Its composition is adapted throughout the tomato culture as plants needs are evolving. Effluent 1 was used in the first and second tests of the screening procedure (Section 3.2.1 and Section 3.2.2). The semi-continuous experiments (Section 3.2.3) was performed on effluent 2. The preliminary and continuous tests of the integrated process experiments were run on effluents 3 and 4 respectively (Section 3.3).
The N/P ratio of the HFWW varied between 0.8 and 2.4, meaning that phosphorus is in large excess in terms of microalgae needs. Optimal N/P ratios are generally varying from 9 to 13 [10]. Similarly, sulfur is in excess since the N/S ratio varied between 1.7 and 4.0, while they are generally over 100 for artificial media [11]. In addition, high sulfate concentrations can be detrimental to microalgae growth as a concentration of 96 mgS/L was found to inhibit the growth of Chlamydomonas moewusii [12].

3.2. Three-Step Screening Process

The screening procedure included three steps. First the ability for microalgae strains to grow in the presence of HFWW was evaluated in 24-well microplates filled with 5 mL of culture. Then the bioremediation potential of these strains was tested in 25 mL flasks. Finally, their long term tolerance to HFWW was investigated in semi-continuous experiments in 125 mL flasks.

3.2.1. Ability to Grow with HFWW in Microplates

The ability of the selected microalgae strains to grow in the presence of the HFWW was first tested in 24-well microplates half-filled with 5 mL of culture (each well has a working volume of 10 mL), on a shaker working at 800 rpm and 30 °C under a LED lighting around 30 µmol/m2/s. Each well was daily refilled with distilled water to counter-balance evaporation. OD was difficult to follow since settling of microalgae occurred for many strains. After five days, the triplicates were merged and the DCW measured. Table 2 shows that the four strains and the consortium were able to grow in a 50/50 mixture of FWM and HFWW, and in pure HFWW. The final DCW was even higher in the case of pure HFWW than for pure FWM. FWM is not a medium that has been optimized for growth. Nevertheless, HFWW being a better medium for microalgae growth than FWM is a strong argument in favor of microalgae to treat HFWWC. This might be due to the presence of micronutrients in a form that is better assimilated by microalgae (such as iron in the form of Fe-EDDHA).

3.2.2. Microalgae Bioremediation Potential of HFWW in Flasks

Cultures in pure HFWW of the four strains and the consortium B1 were started in 25 mL flasks in triplicates at an initial DCW of 0.39 ± 0.15 g/L in the conditions described in Section 2.1. The variability in the initial DCW was due to difficulties in OD measurements (rapid settling of the biomass and coagulation). The results in term of final DCW after five days and biomass productivity (in g/L/d) are shown on Figure 1. Three flasks filled with only pure HFWW were put in the incubator. In these conditions, a consortium of photosynthetic microorganisms naturally developed as shown in Figure 1. This natural hydroponic farm wastewater consortium (HFWWC) was then also tested in the rest of the work as a new candidate for HFWW bioremediation (micrograph in Appendix A).
Table 3 shows the potential of bioremediation of HFWW by the four strains and the consortium B1. For that, the supernatant of the triplicates were pooled and analyzed. The nitrate concentration of the HFWW could be reduced by up to 74.4% in these first experiments in flasks. These preliminary results are encouraging since the process was running in a non-optimized batch mode.
Phosphate was found to be completely removed in every case except for NIES227. Since the initial P content of the HFWW was high, the diminution of the phosphate concentration in the culture cannot be accounted by the biological needs of the microalgae alone. Due to the growth of the microalgae, the pH of the cultures is around 7.0–7.5 while the pH of HFWW is much lower (see Table 1). At this pH level, the phosphate must have precipitated in the form of calcium phosphate [5]. Sulfate was more difficult to eliminate since it is also in excess in comparison to nitrogen, but contrary to phosphate, it does not precipitate.

3.2.3. Microalgae Bioremediation Potential of HFWW in Semi-Continuous Operation

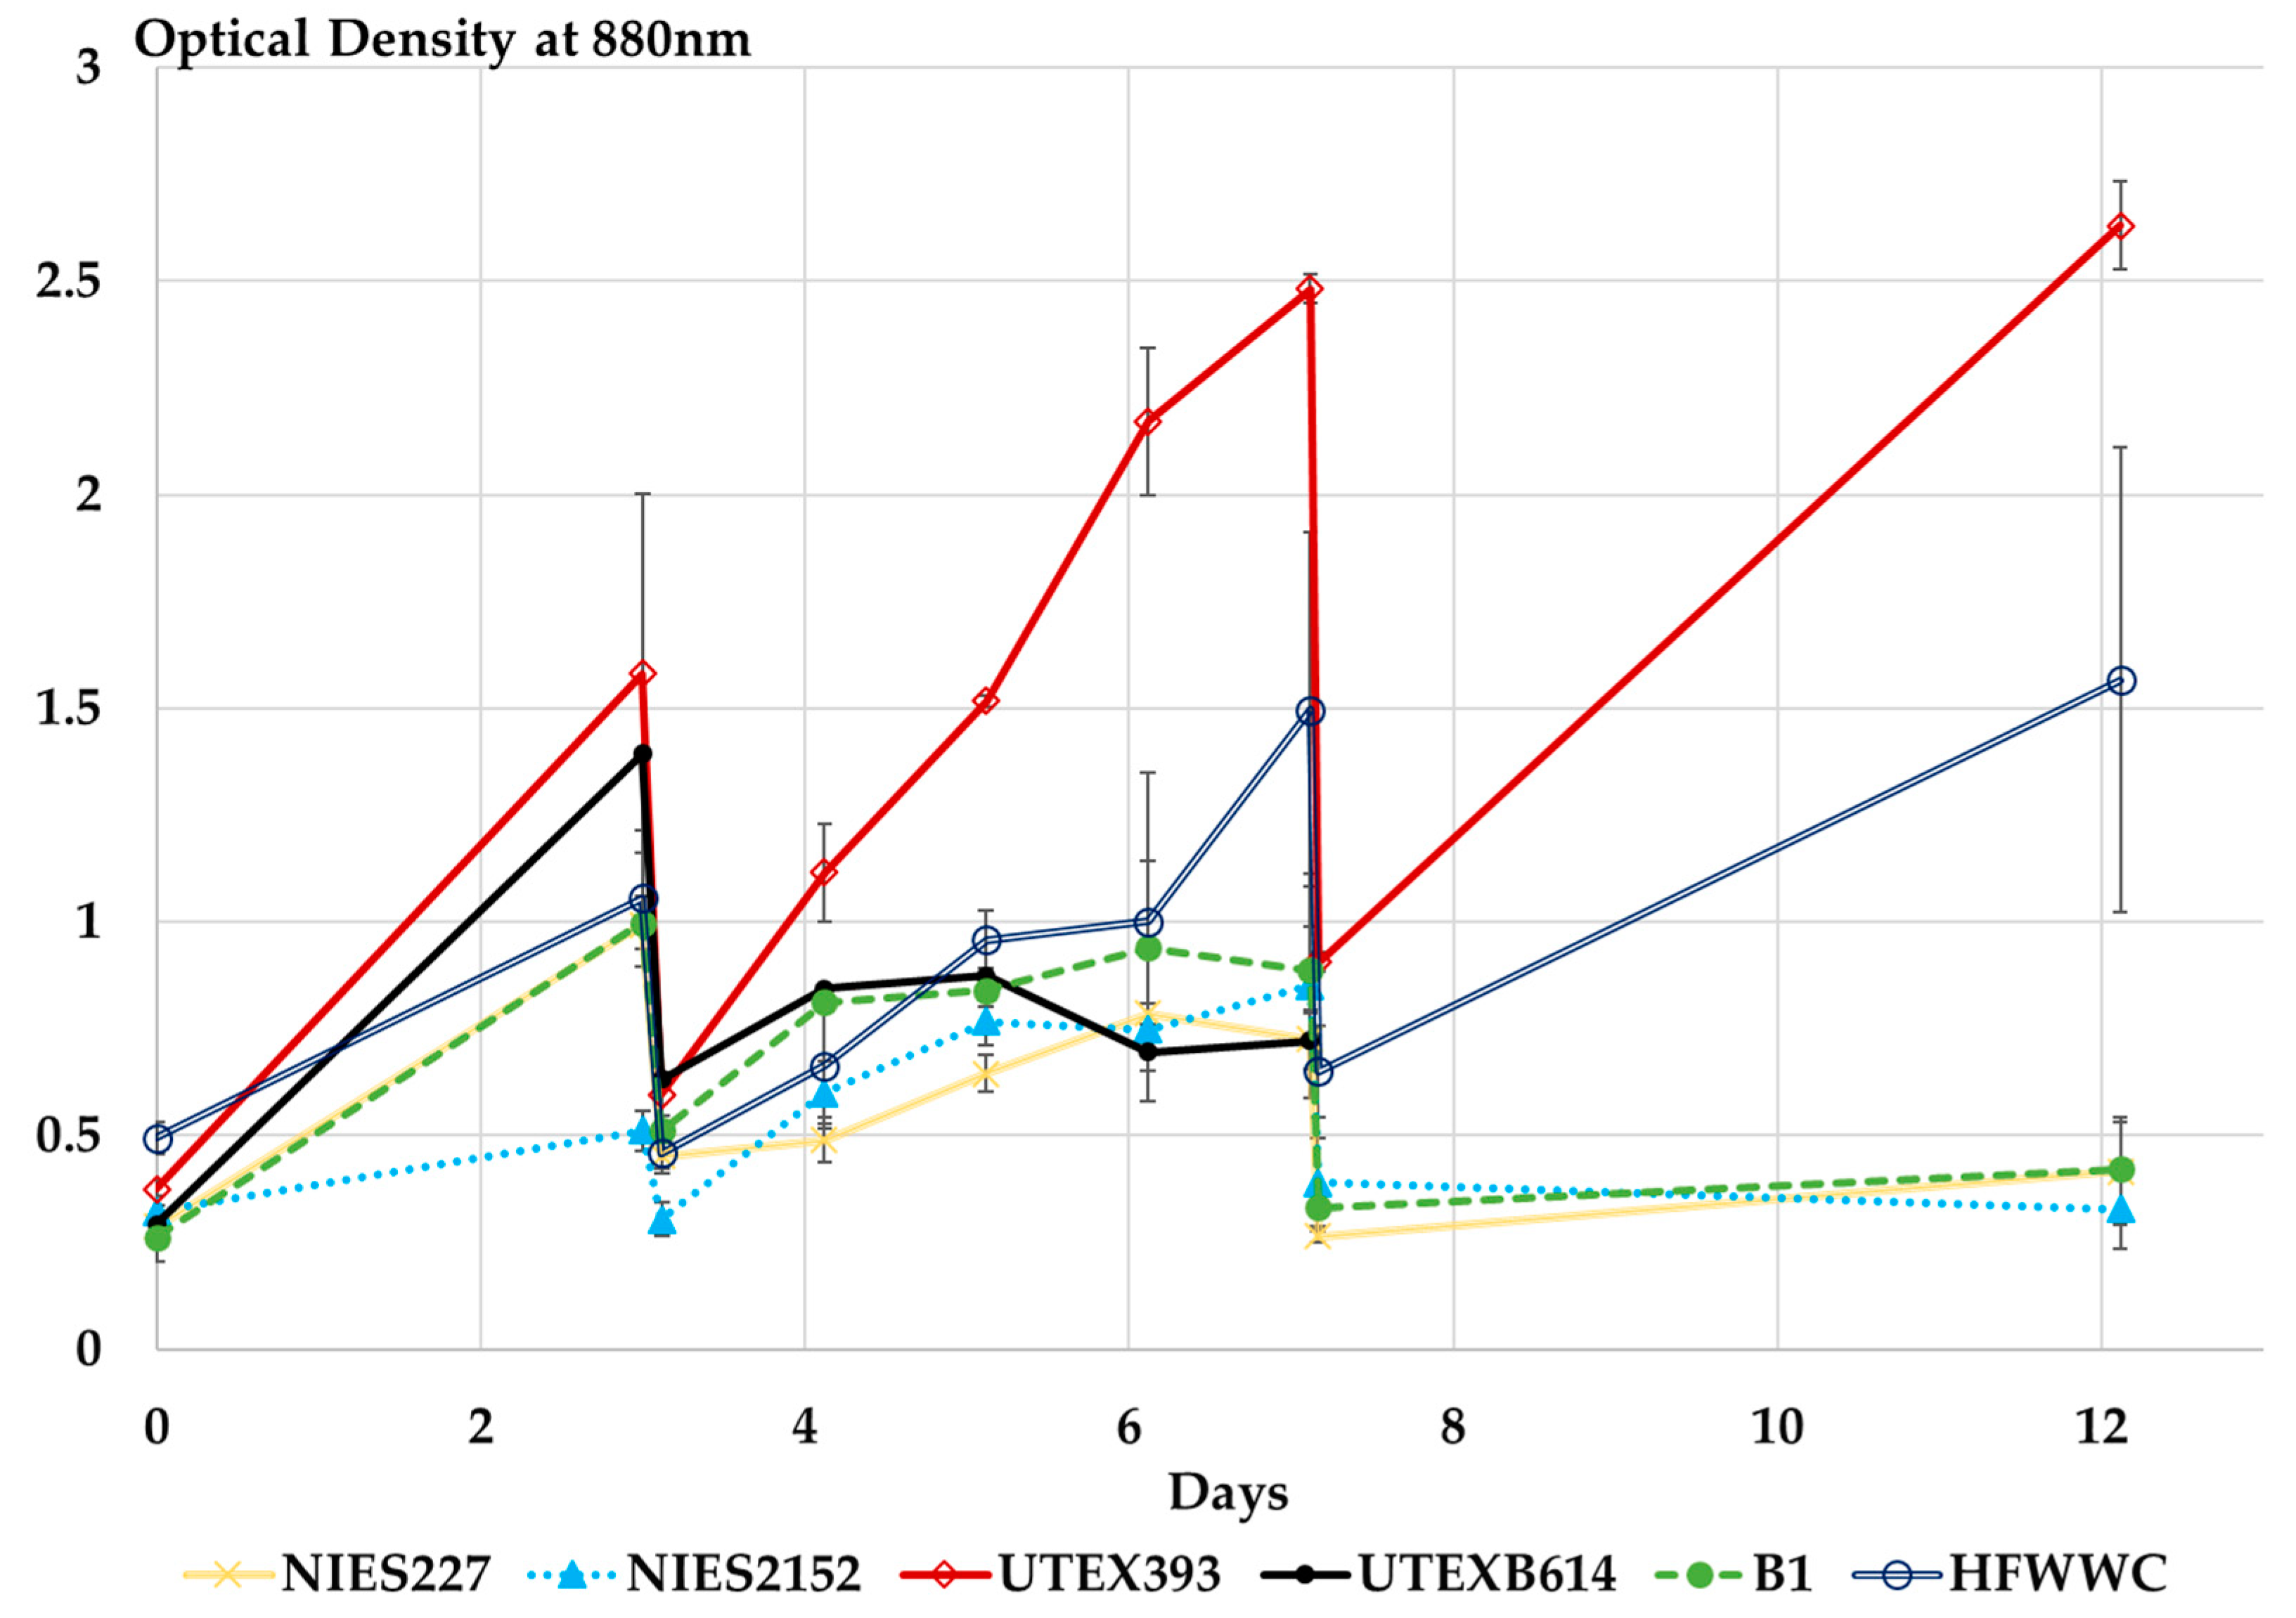
A semi-continuous culture was performed in order to evaluate the ability of the selected microalgae and the two consortiums to grow on HFWW on the long term. Pre-cultures of the four microalgae strains and of the two consortia were diluted in HFWW in 125 mL flasks in triplicate at an initial DCW of 0.32 ± 0.14 g/L. The cultures were grown in the incubator in the conditions described in Section 2.1. A semi-continuous operation was tested by replacing two-thirds of the volume of every flasks by fresh HFWW at the end of each cycle. Three cycles were applied: 3, 4, and 5 days corresponding to Hydraulic Retention Times (HRT) of 4.5, 6, and 7.5 days, respectively. At the end of each cycle, the concentrations in nitrate, phosphate, and sulfate of the microalgae cultures was determined in order to estimate the depollution rates for each strain/consortium. As shown on Figure 2, UTEX393 and HWWC showed the best results, as they were the only growing conditions in cycle 3.
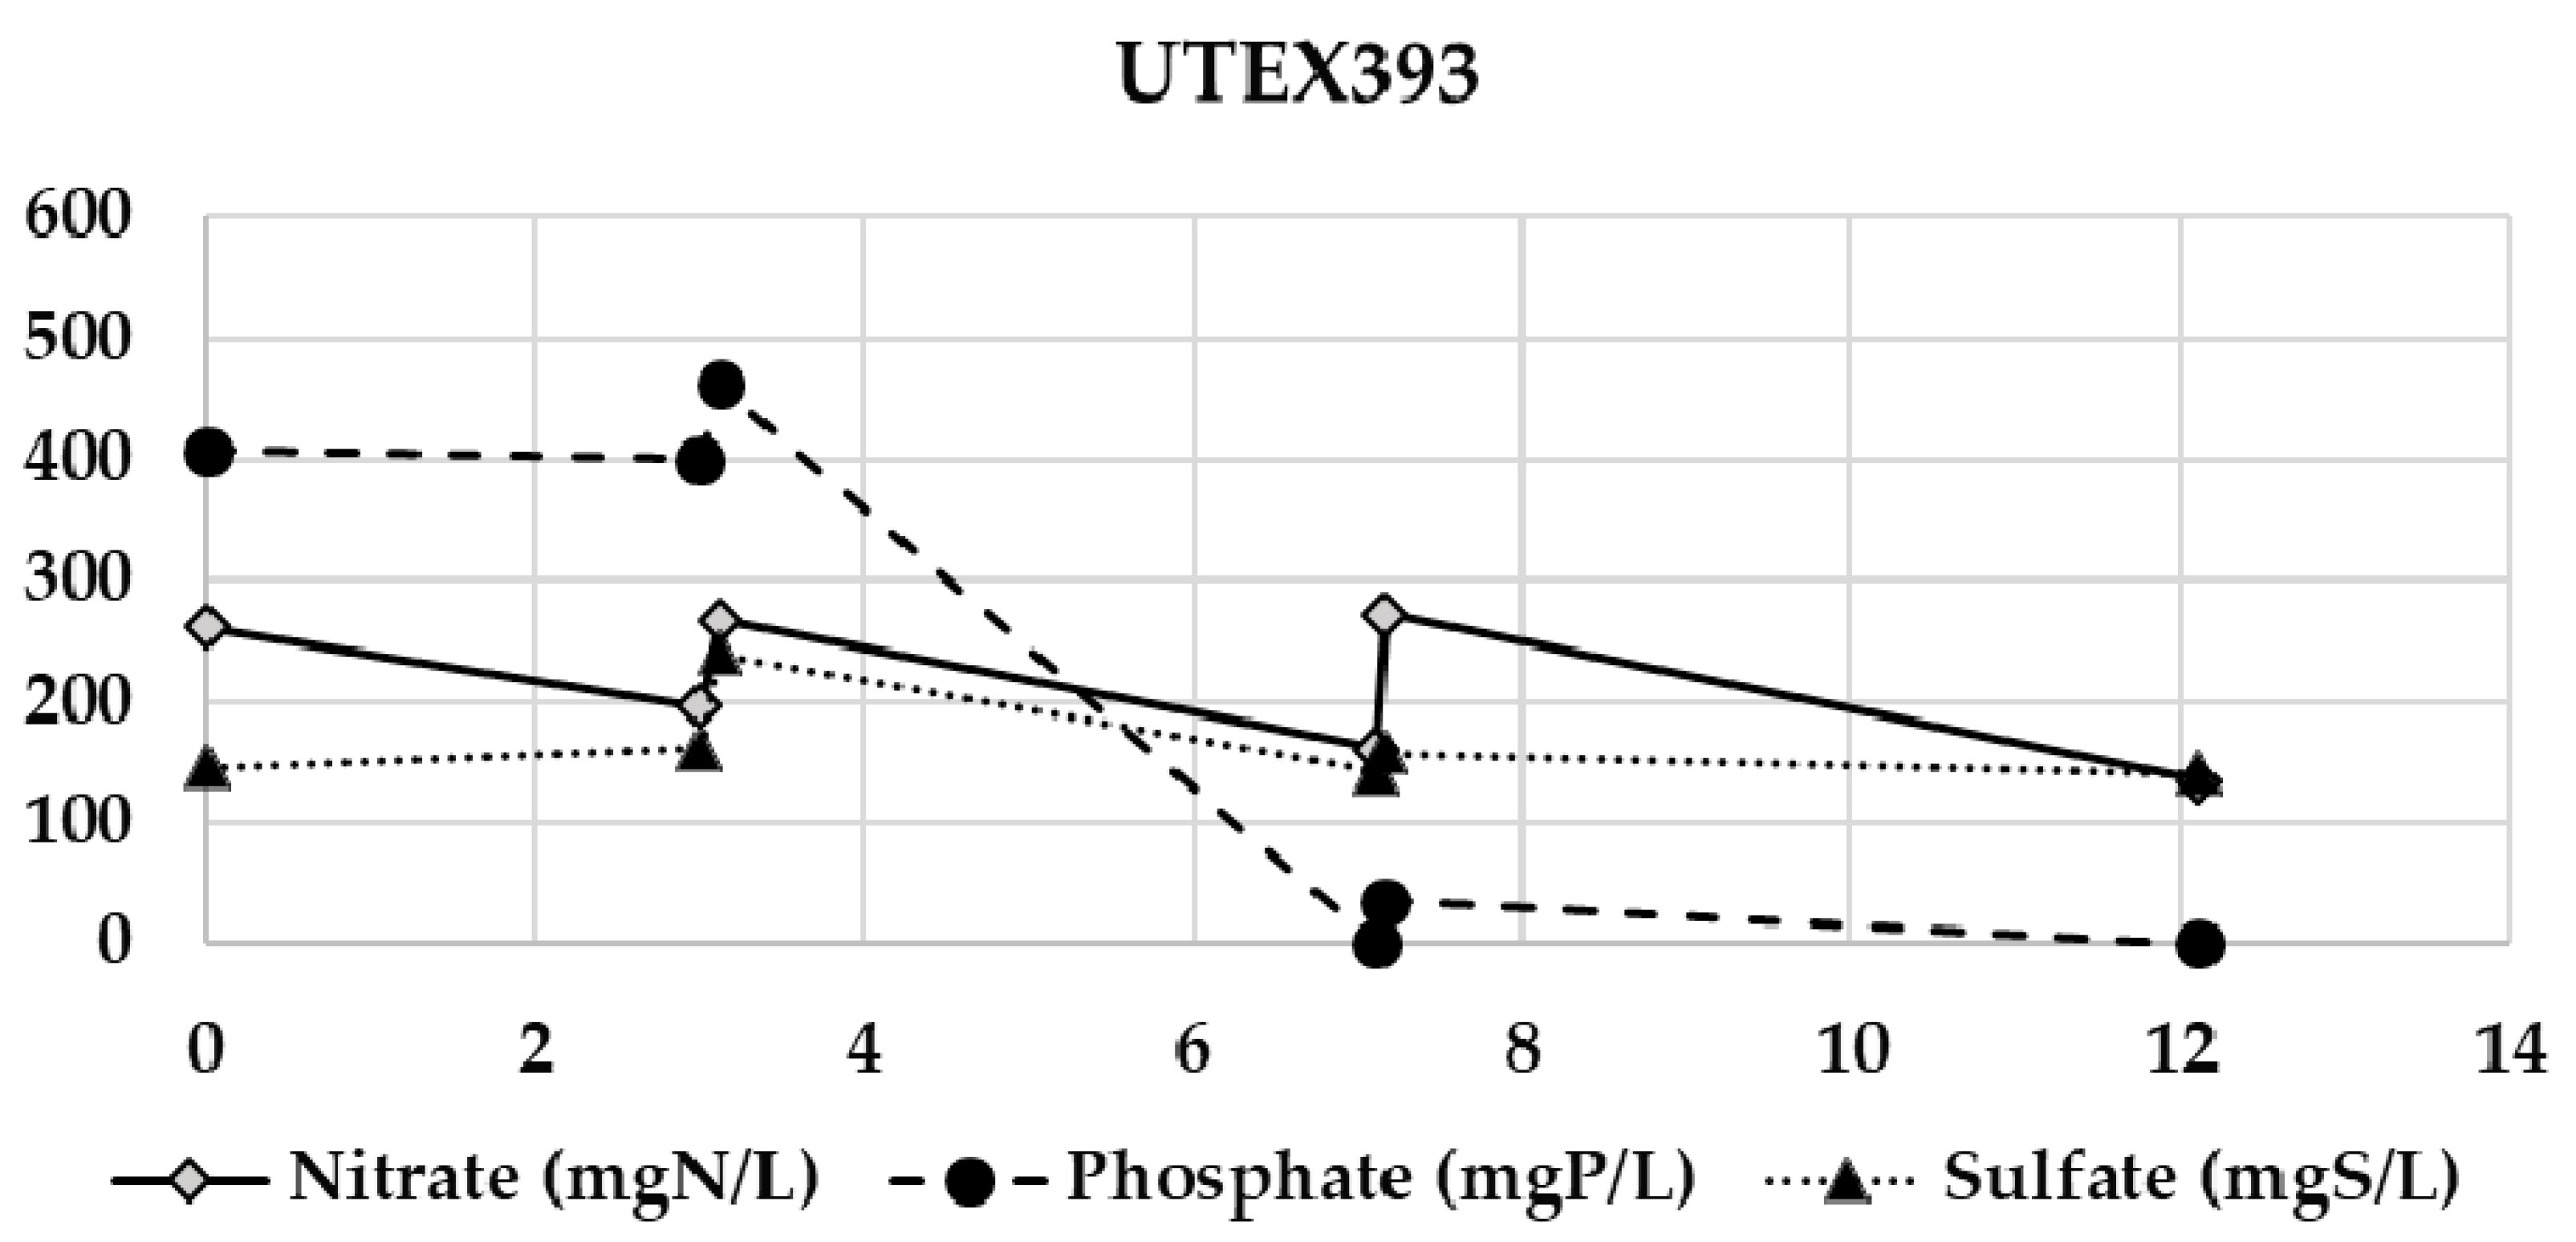
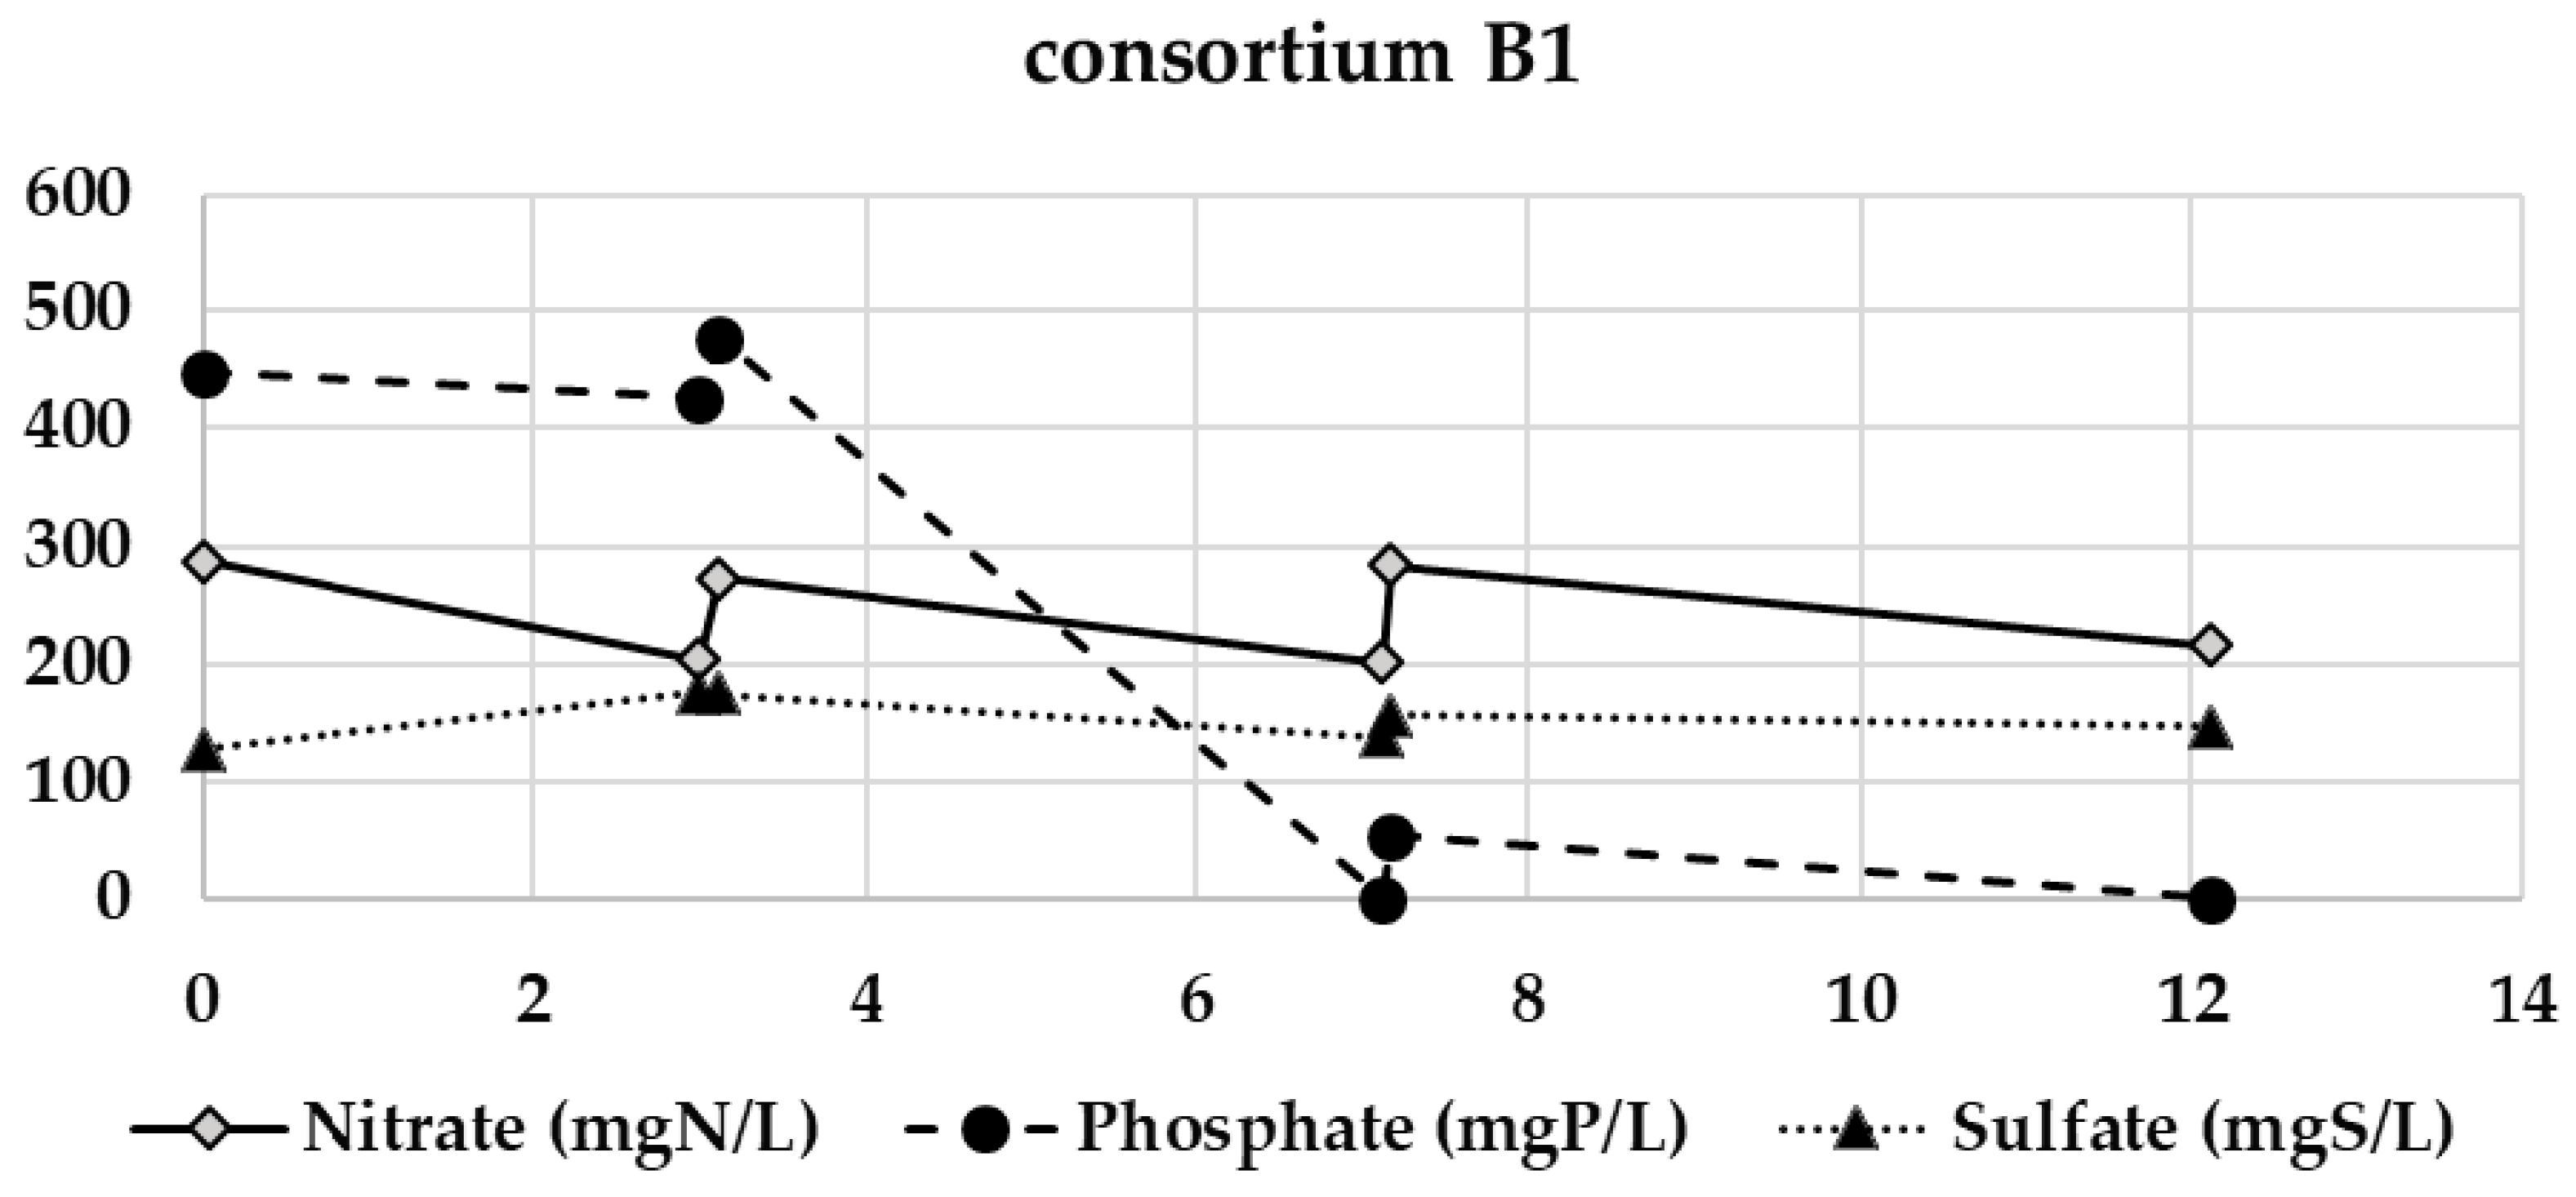
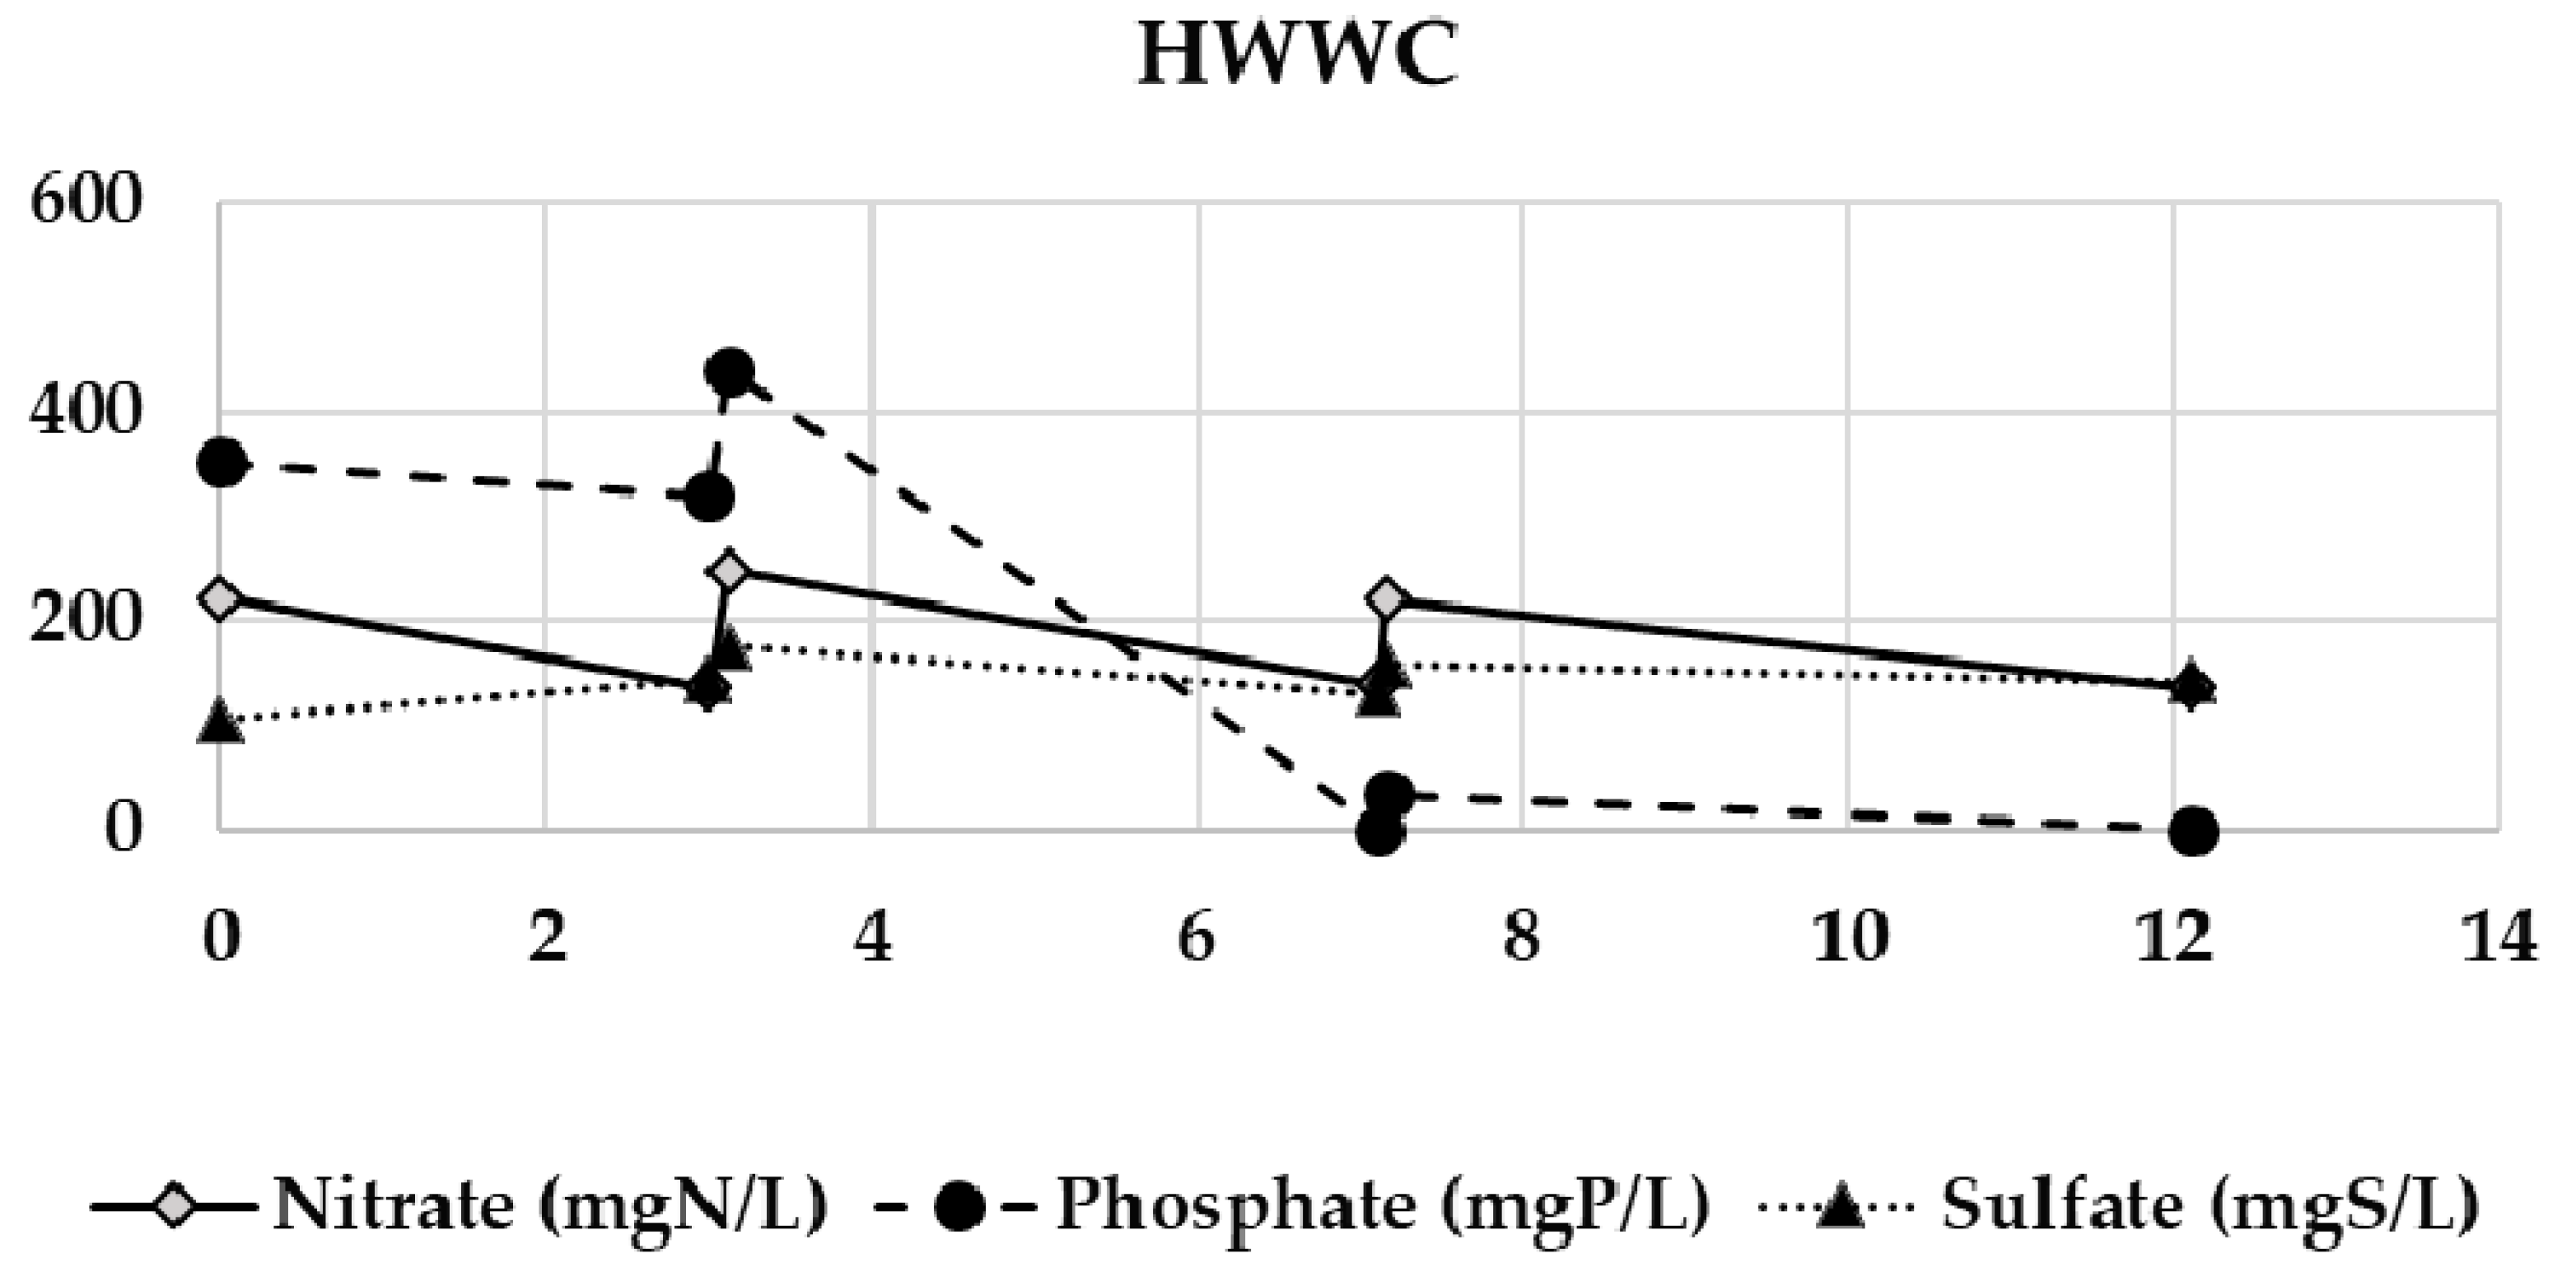
Biomass productivities were high for NIES227, UTEX393, and UTEXB614 but it was significantly reduced in cycle 2 for all strains except for UTEX393 and HFWWC (Figure 3). UTEXB614 was removed from the test after cycle 2 since the culture was not healthy. Despite having a high final OD, UTEX393 productivity decreased also in cycle 3 since the ratio DCW/OD decreased on day 12. The decrease of the growth rate might be due to a lack of some nutrients in HFWW (micronutrients or phosphate if precipitated). On the contrary, inhibition could have been caused by, high level of nutrients (phosphate if not precipitated). The best candidates for HFWW bioremediation were found to be UTEX393 and HFWWC. These strains might be more resistant to the variations in nutrients availability. Biomass production rates were 0.193 g/L/d for UTEX393 and 0.252 g/L/d for HFWWC on average. The evolution of the nitrate, phosphate and sulfate concentrations are available in Appendix B. Average nitrate reduction rates were 23.5 mgN/L/d for UTEX393 and 21.9 mgN/L/d for HFWWC.
All tested strains and consortiums were able to utilize the nutrients contained in the HFWW for their growth. However, only UTEX393 and HFWWC resisted to semi-continuous operation.

3.3. Design of an Integrated Process

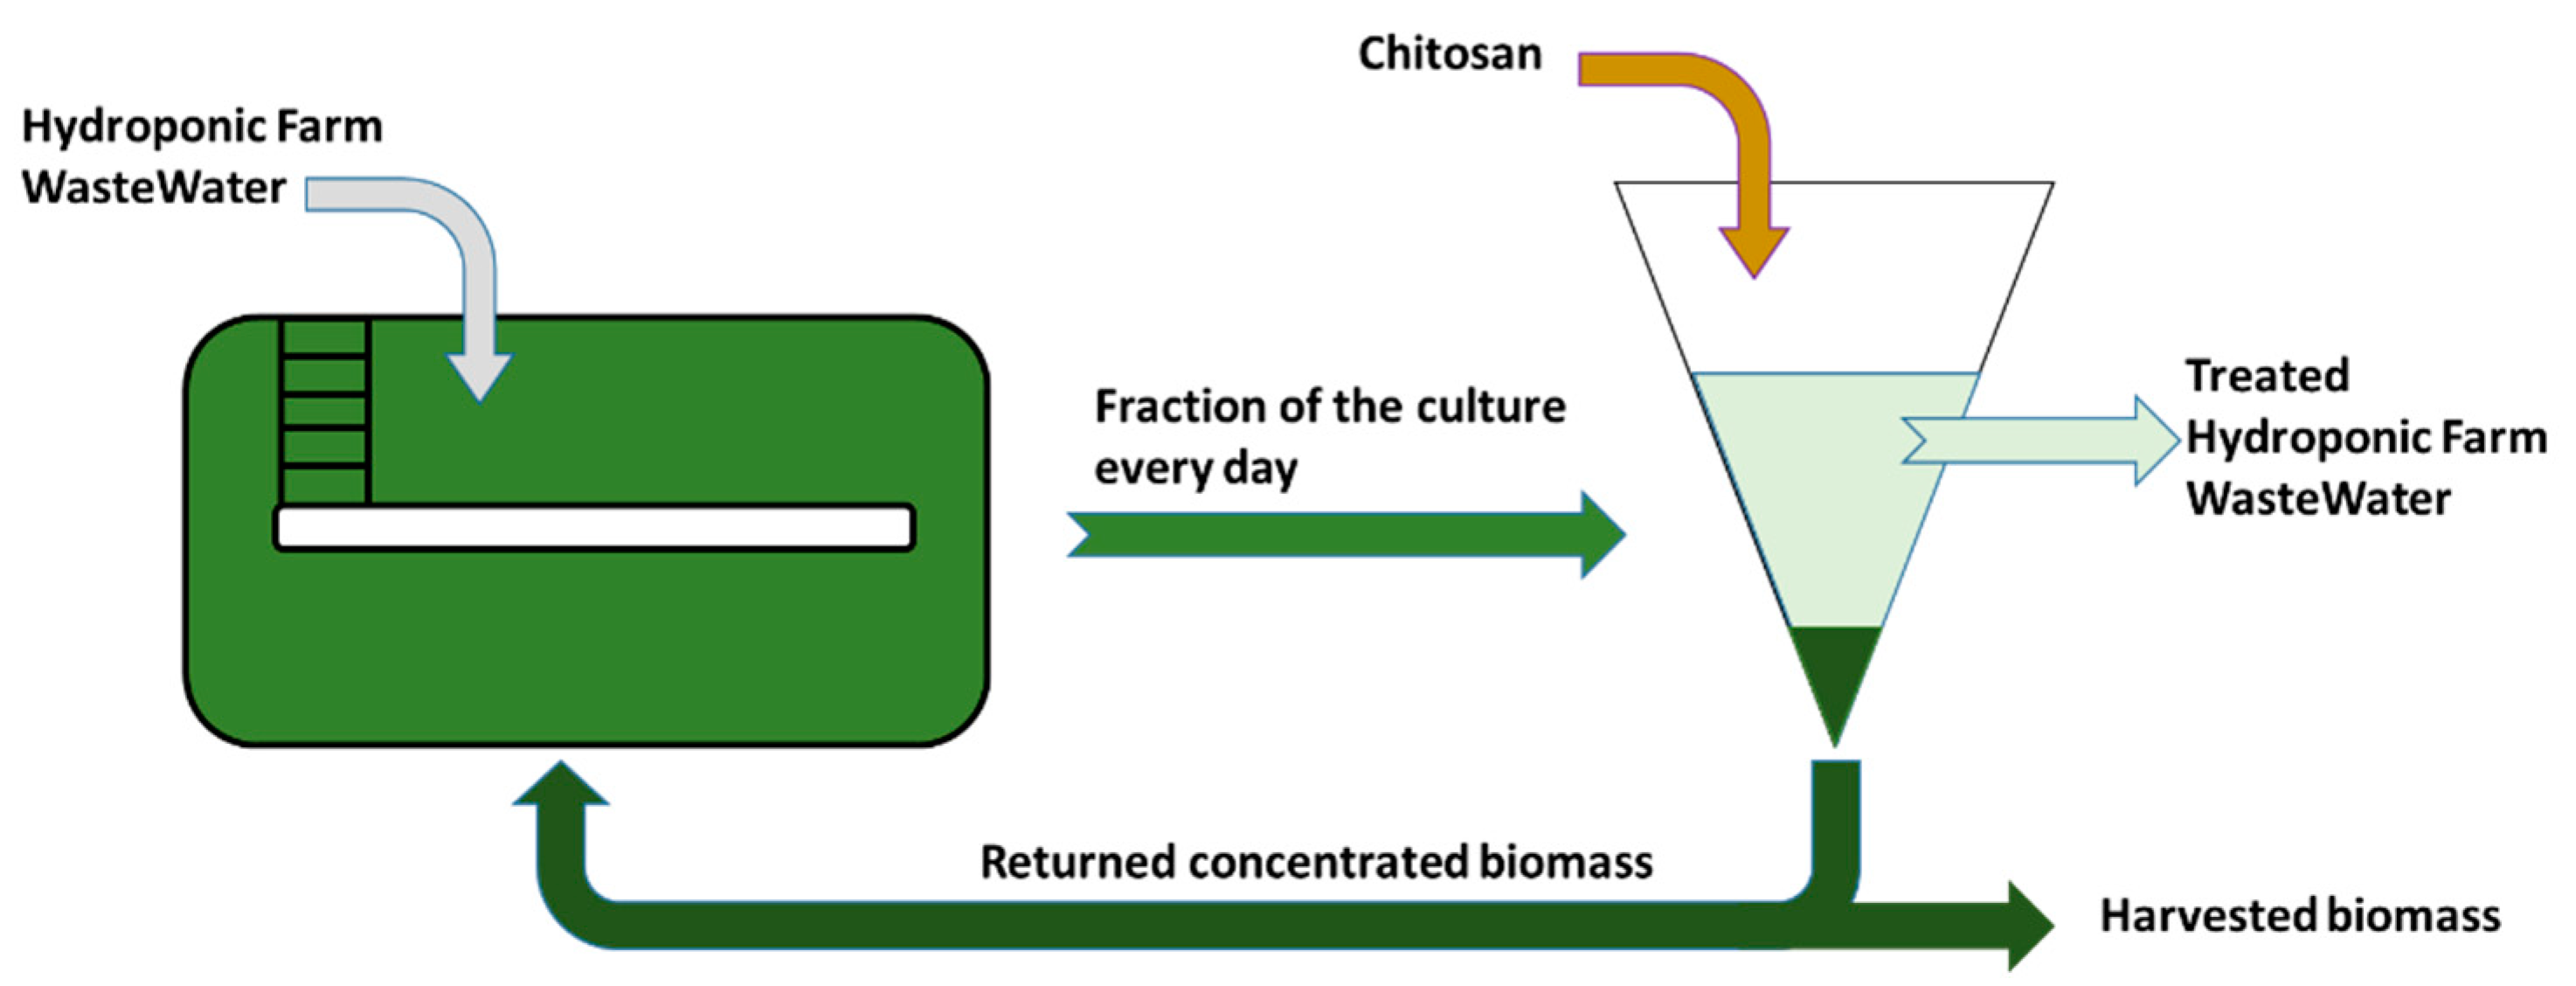
A continuous process was designed for treating HFWW as shown on Figure 4. HFWW is added daily in a culture system (a raceway is pictured on Figure 4 as an example, but other systems such as any photobioreactor can also be used). A fraction of the culture is harvested every day and put in a settler where chitosan is added (mixing will be needed for incorporating chitosan into the culture). The supernatant is the treated HFWW. Part of the settled biomass is returned to the culture system and the other part is removed from the system and can be valorized.
HFWWC was selected to inoculate the system as it was found to be effective to remove nitrates and phosphates from HFWW and its indigenous nature is an asset for large-scale operation (less risk of dissemination of exogenous species).
The system was simulated as follows: (i) culture in 250 mL flasks for seven days (triplicates), (ii) the culture is harvested using chitosan and put in an Imhoff tank, (iii) the supernatant is removed and analyzed, and (iv) part of the settled biomass is used to inoculate new flasks with pure HFWW.

3.3.1. Preliminary Test

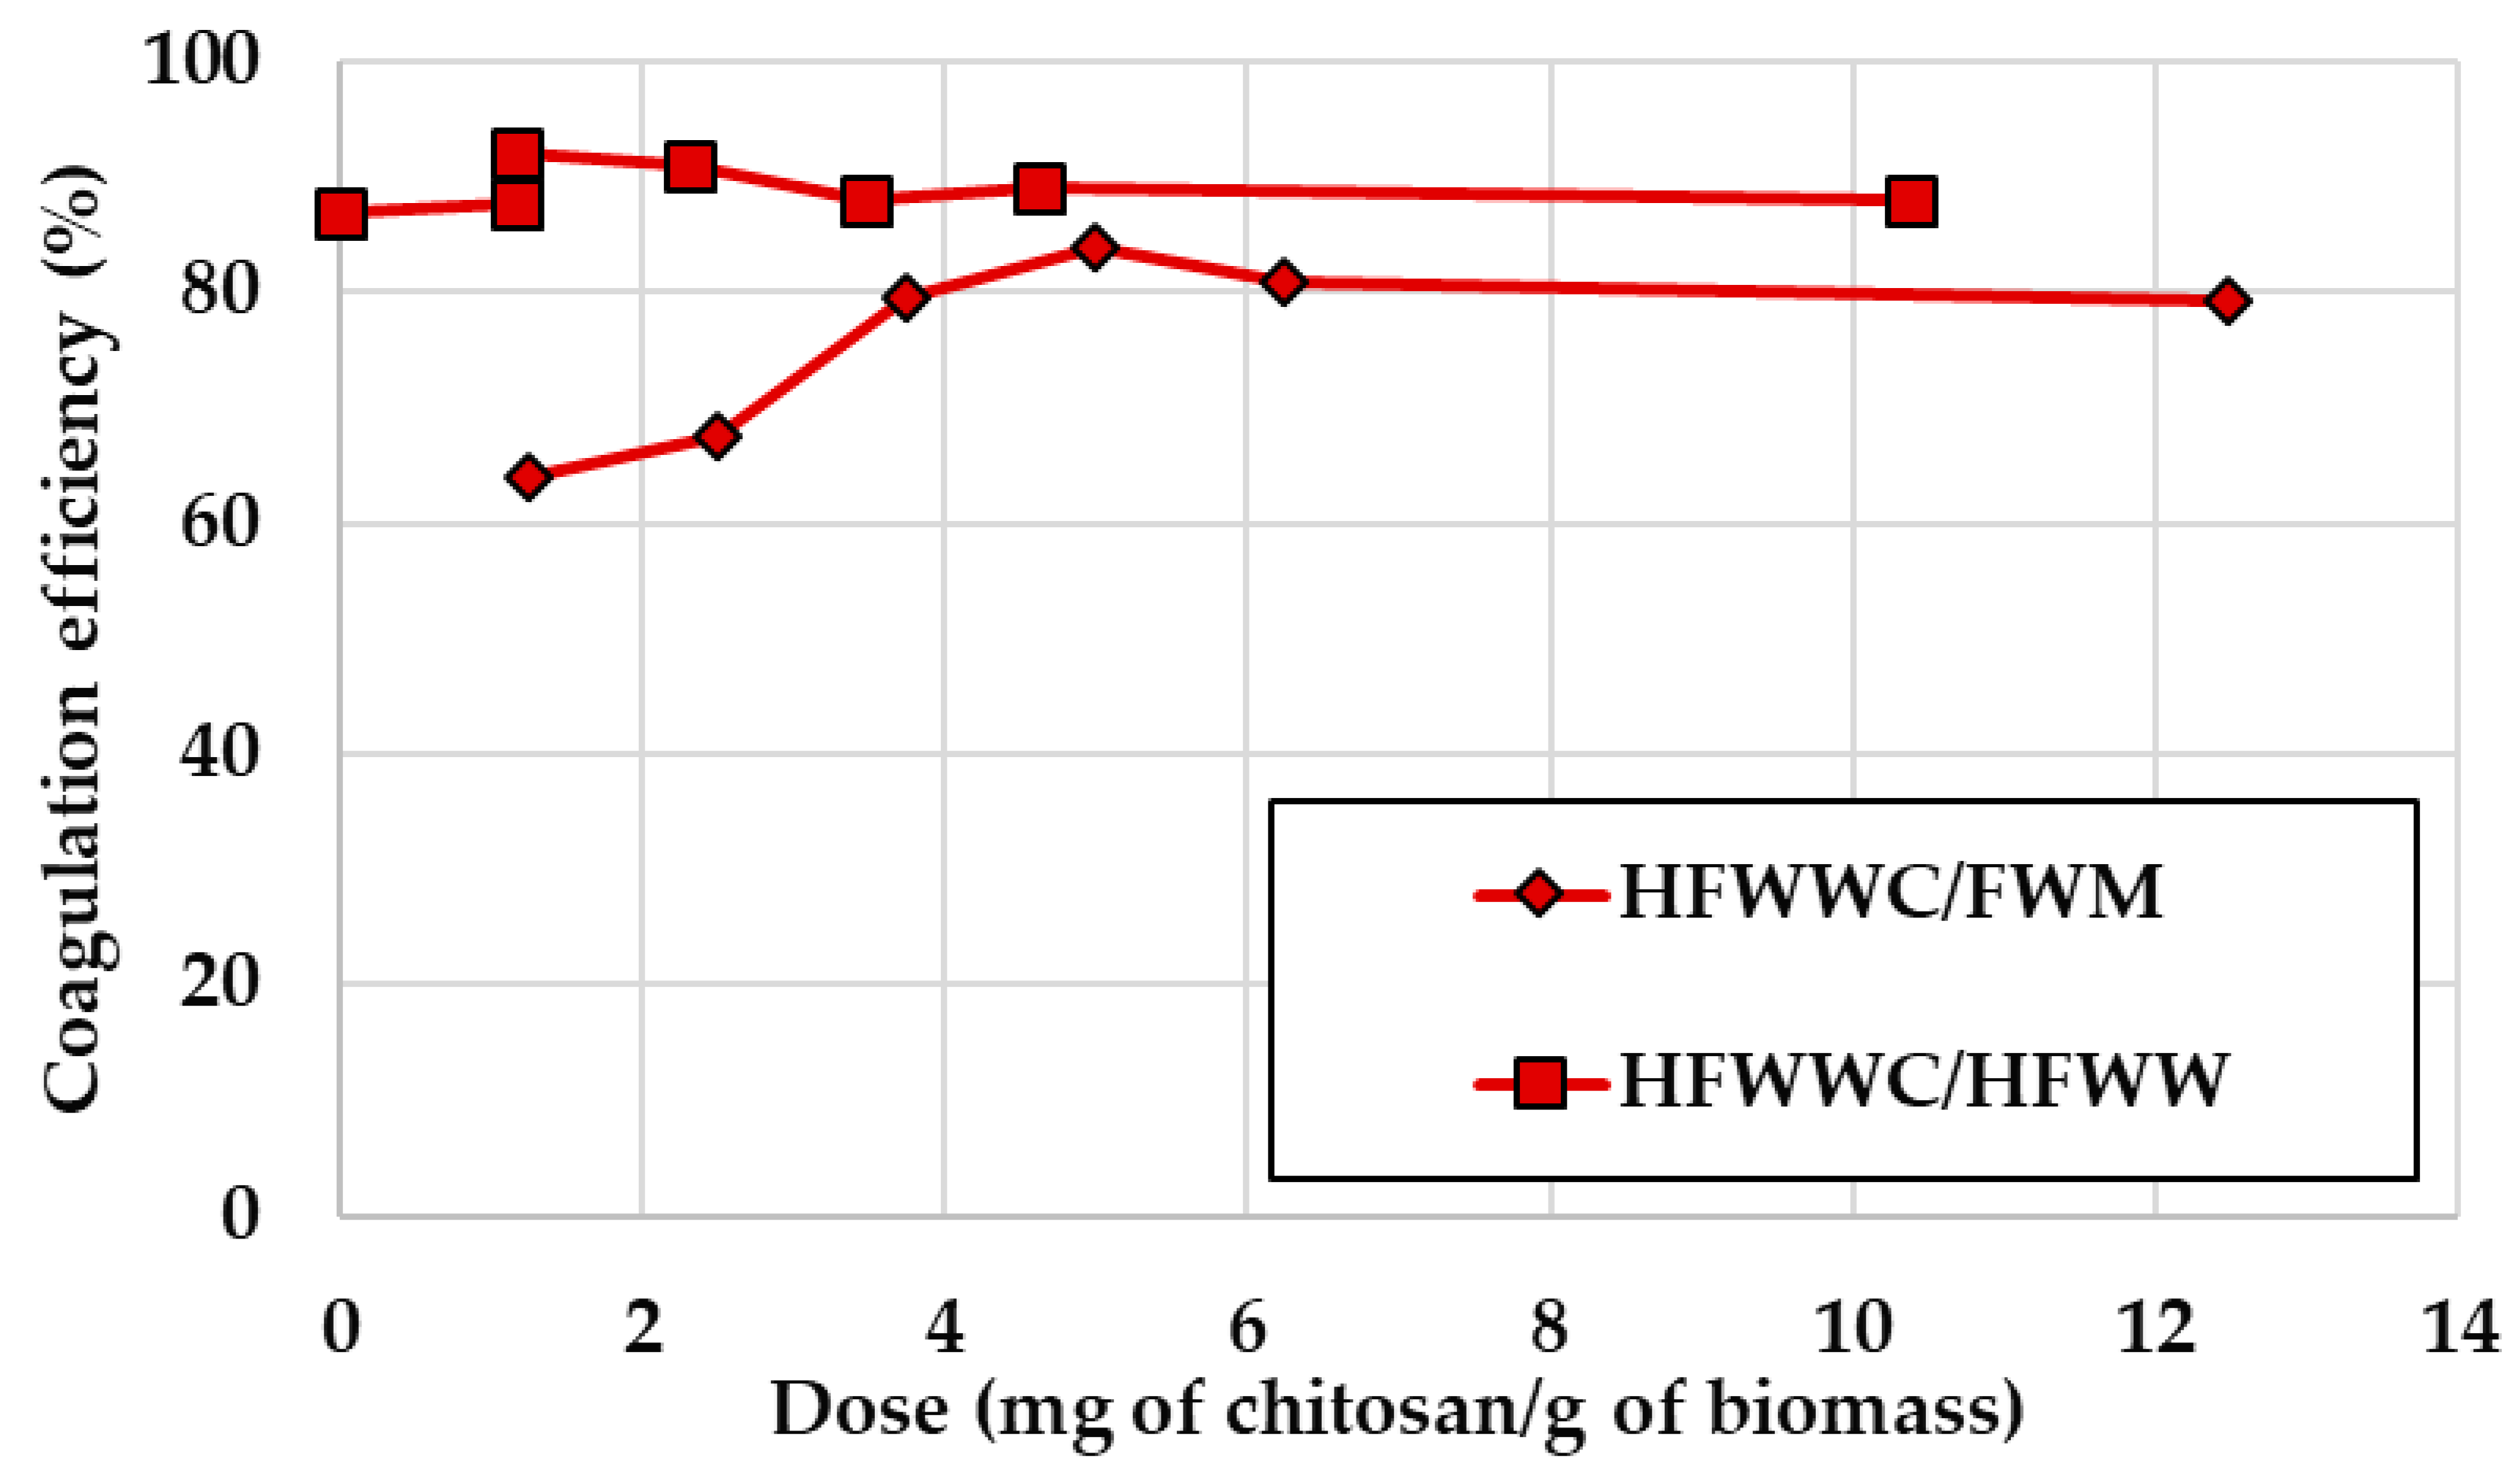
HFWWC was grown in triplicate in FWM and in HFWW at an initial OD of 0.275 ± 0.020. After nine days of cultivation, HFWWC was able to remove 88.9% of nitrates and 87.2% of phosphates from HFWW. The cultures were then harvested by coagulation using chitosan in a Jar-Test. As shown in Figure 5, adding chitosan helped moderately the coagulation of HFWWC when grown on FWM. pH was not modified and stayed below 7 when chitosan was added. This was quite unsatisfactory in comparison to results from the literature. For example, Chlorella sorokiniana UTEX1230 showed coagulation efficiencies above 99% with doses as little as 0.01 g of chitosan/g of biomass for pH below 7 [13]. When grown on HFWW, chitosan did not improve significantly the coagulation efficiency of HFWWC. However, HFWWC naturally coagulates when grown on HFWW (coagulation efficiency of 87% without any chitosan addition). Phosphate precipitation might have the same microalgae coagulation effect than magnesium hydroxide precipitate in pH-induced flocculation [14].

3.3.2. Continuous Integrated Process

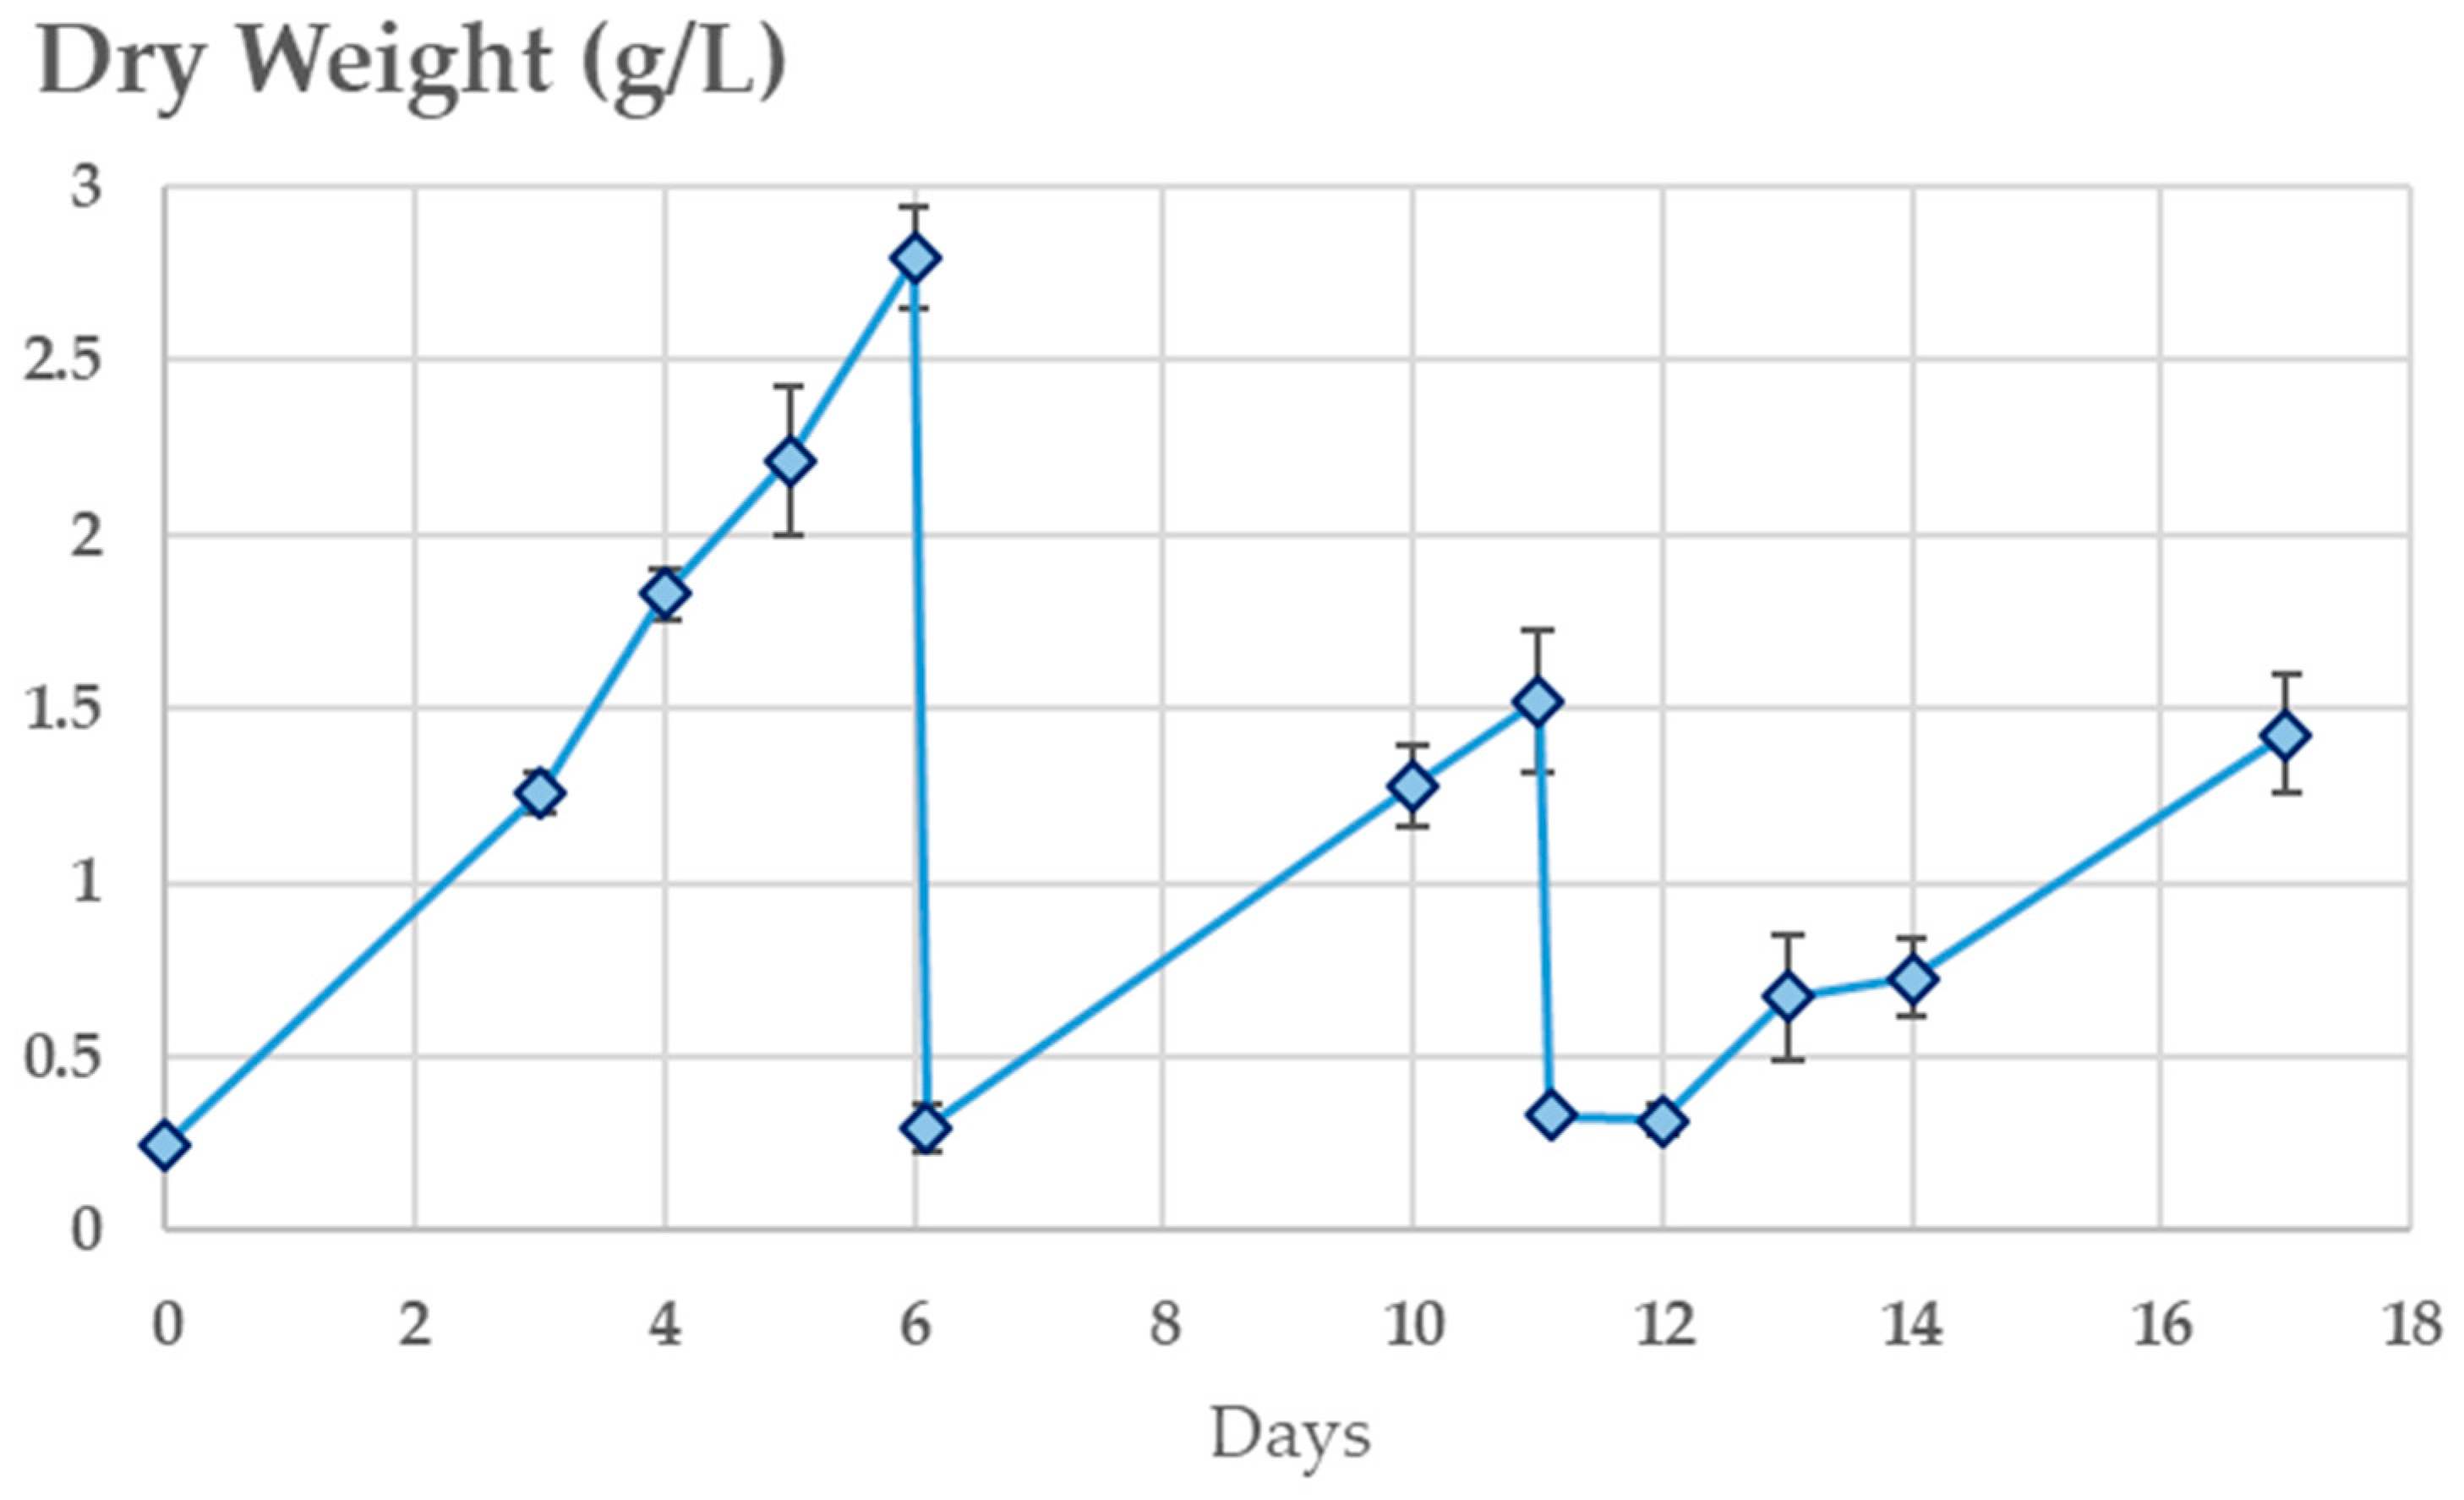
The ability of HFWWC to treat HFWW was tested in a continuous integrated process for 17 days. The specific process has been detailed in Section 3.3.1. Three cycles of treatment/harvesting of respectively 6, 5, and 7 days were performed. The growth of HFWWC on pure HFWW is shown on Figure 6. The growth was maintained during the three cycles despite a small stationary phase at the beginning of cycle 3. The biomass productivities were respectively 0.349, 0.389, and 0.203 g/L/d for cycles 1, 2, and 3.
Despite the unsuccessful preliminary test, chitosan was able to harvest and concentrate HFWWC with coagulation efficiencies above 95% (see Appendix C). The optimal dose was defined as the minimal dose for which 95% of coagulation efficiency is reached. Interestingly, the optimal dose was found to decrease from cycle 1 to 3 (Table 4). It can be partially explained by the decreasing amount of COD in the supernatant or by the remaining chitosan in the supernatant.
The chitosan solution (1 g/L in 0.1 mol/L acetic acid) has a COD value of 7900 ± 30 mgO2/L. The chitosan added during the flocculation represented 44.8%, 16.2%, and 23.6% of the supernatant COD for cycle 1, 2, and 3 respectively. However, a large part of the chitosan might have remained in the settled biomass (not evaluated). Therefore, most of the supernatant COD may be attributed to microalgae (excreted metabolites, cell debris, etc.). This remaining organic matter would probably need to be removed. Possible processes such as tangential filtration or the use of heterotrophic bacteria might be considered to help removing this organic matter.
Nitrate and phosphate concentrations were low in the supernatants (Table 4). The integrated system was found to be effective to remove nitrate and phosphate from HFWW using the naturally-HFWW born consortium. Phosphate was not completely removed in cycles 1 and 3, in comparison to other experiments. A possible explanation is that pH was decreased due to chitosan addition (which is dissolved in 0.1 mol/L acetic acid). Some originally precipitated phosphate might have been re-dissolved in the process.

4. Discussion

The results have shown that HFWW could be treated using an indigenous consortium of photosynthetic microorganisms that naturally grown on the HFWW. This consortium, HFWWC, allowed a satisfactory reduction of nitrate and phosphate concentrations in less than seven days. It was also very robust as it sustained consecutive growth cycles with good average biomass productivities of more than 0.2 g/L/d for every cycle and removal rates above 20 mgN/L/d for nitrates. Amongst the exogenous microalgae tested, the most efficient was UTEX393 with an average removal rate of 23.5 mgN/L/d for nitrates during the semi-continuous experiments. UTEX393 biomass productivity was 23% lower than the one for HFWWC (0.193 g/L/d). The nitrate and phosphate reduction reached respectively 98.3% and 100% for UTEX393 in the nine days batch experiment. HFWWC was preferred for the last continuous experiments due to its indigenous nature. In these tests, HFWWC was used to treat HFWW in an integrated system that includes a cultivation step and a harvesting step using chitosan.
Consortiums with microalgae have been found to be very effective in treating wastewaters [15]. They can perform complex degradation processes, they are more robust to fluctuant environmental conditions (temperature, and light) and are more resistant to contaminations [15]. Moreover, native consortiums are sometimes preferred for the treatment of specific wastewaters such as anaerobically digested municipal sludge centrate [16] or Cr(III) wastewaters [17]. In the case of HFWW, HFWWC proved to be efficient in removing nitrate and phosphate from HFWW. However, an additional step would be needed to remove COD from the remaining wastewater. Bacteria could be included in the consortium in order to improve its COD removal performance. Microalgal bacterial consortiums can achieve both secondary and tertiary treatments [15]. Their cooperation is more complex than simple nutrients exchange. Microalgae can protect bacteria from difficult environmental conditions and the extracellular metabolites they release help bacterial growth [15]. Likewise, bacteria excrete growth-promoting factors, such as vitamins and siderophores that are beneficial to microalgae growth (iron chelating agents) [15]. The association of microalgae and bacteria will be tested in the future works.
In the conducted experiments, a 2% CO2 atmosphere was maintained in the incubators that mediated the pH at level around seven (confirmed by infrequent measurements). Otherwise, higher pH would have been reached due to microalgae photosynthesis [18] and phosphate precipitation would have been even more significant. In future works, phosphate fate would have to be carefully investigated, especially at the pilot-scale where CO2 addition will most probably be uneconomic. In this case, pH control could be an effective way of controlling phosphate precipitation.
Furthermore, without this 2% CO2 atmosphere, the efficiency of HFWWC to treat HFWW at the pilot-scale will be slowed down. Microalgae growth is indeed highly influenced by CO2 addition [19]. However, hydroponic greenhouses are enriched in CO2 (around 1000 ppm) [20], which can potentially help both microalgae growth and pH control.
The next step will be to upscale the process in order to optimize its operation. High average nitrate reduction rates around 25 mgN/g of biomass/d were achieved. However, this might not be sufficient for an economically interesting industrial-scale process, as large cultivation areas would be needed to treat the HFWW. Process intensification will certainly help in reducing the cost of the process, but the major contributor will be biomass valorization.
The biomass produced during the process can indeed be valorized for many purposes. We showed that one liter of HFWW is a suitable medium for producing more than 2 g of biomass (Figure 6). This biomass can be used as a fertilizer for different terrestrial culture with no or slight pretreatment [21]. The biomass can also be used as a feedstock for anaerobic digestion [22]. Microalgae are also a good source for food or feed if the quality of the biomass can be certified throughout the time of the year [23]. Finally, antioxidants such as carotenoids can be produced by microalgae [24], but the operating conditions need to be highly controlled. This is theoretically possible for microalgae grown on HFWW but quite complex as a first target.
Future developments will include validation at the pilot-scale with the integration of an additional step for COD removal, optimization of process operation, and biomass valorization.

Author Contributions

Conceptualization, F.D., P.A., G.F., C.E., and J.-F.S.; methodology, F.D., M.R.d.J.C. and A.C.; investigation M.R.d.J.C. and A.C.; validation, F.D., M.R.d.J.C., and A.C.; formal analysis, F.D., M.R.d.J.C., and A.C.; writing—original draft preparation, F.D.; writing—review and editing, F.D., A.C., P.A., G.F., and J.-F.S.; visualization, F.D.; supervision, F.D. and J.-F.S.; project administration, F.D. and C.E.; funding acquisition, F.D. and C.E. All authors have read and agreed to the published version of the manuscript.

Funding

This research was funded by ADEME on the GRAINE 2017 call, grant number 1903C0039, project name VESPA.

Institutional Review Board Statement

Not applicable.

Informed Consent Statement

Not applicable.

Data Availability Statement

All data is presented within this article.

Acknowledgments

The authors would like to thank all the VESPA partners and especially Raphael TISIOT (CTIFL Balandran) and Rémy MOUTON (Chambre d’Agriculture 13) for providing effluents for this research.

Conflicts of Interest

The authors declare no conflict of interest.

Appendix A. Micrographs of Consortium B1 and HFWWC

Figure A1. Micrographs x200 of consortium B1 (left) and HFWWC (right).
Processes 09 00519 g0a1

Appendix B. Evolution of the Nitrate, Phosphate, and Sulfate Concentrations during the Semi-Continuous Operation

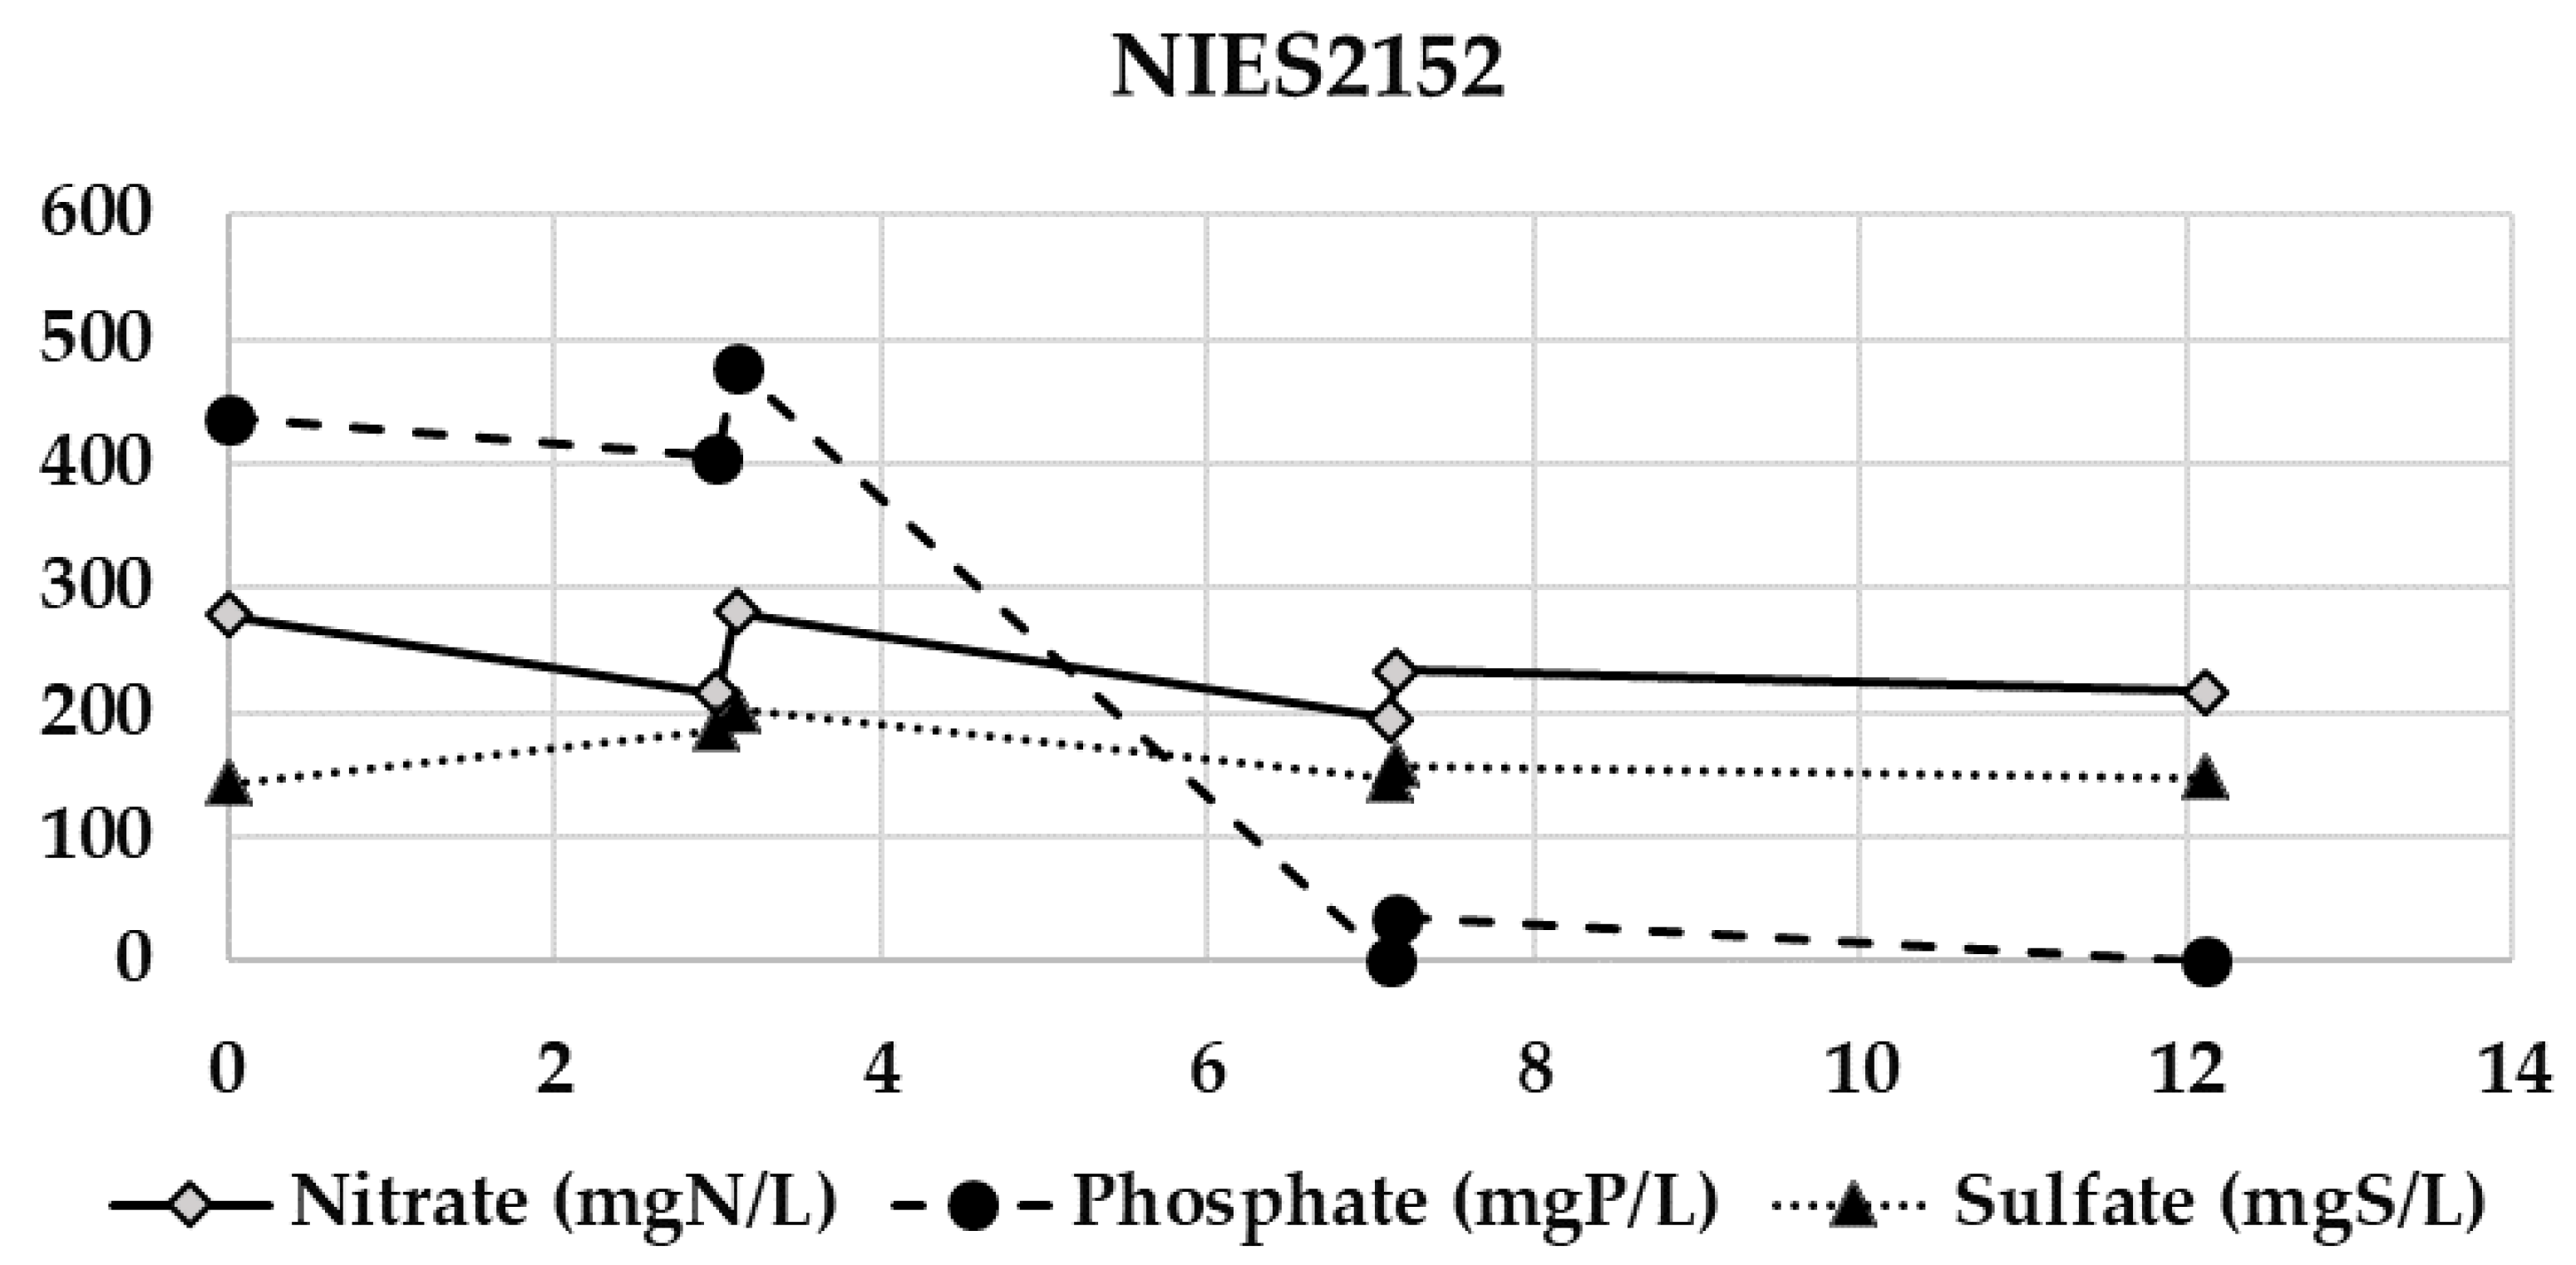
Figure A2. Evolution of the nitrate, phosphate, and sulfate concentrations during the semi-continuous test for NIES227.
Processes 09 00519 g0a2
Figure A3. Evolution of the nitrate, phosphate, and sulfate concentrations during the semi-continuous test for NIES2152.
Processes 09 00519 g0a3
Figure A4. Evolution of the nitrate, phosphate, and sulfate concentrations during the semi-continuous test for UTEX393.
Processes 09 00519 g0a4
Figure A5. Evolution of the nitrate, phosphate, and sulfate concentrations during the semi-continuous test for UTEXB614.
Processes 09 00519 g0a5
Figure A6. Evolution of the nitrate, phosphate, and sulfate concentrations during the semi-continuous test for consortium B1.
Processes 09 00519 g0a6
Figure A7. Evolution of the nitrate, phosphate, and sulfate concentrations during the semi-continuous test for HWWC.
Processes 09 00519 g0a7

Appendix C. Chitosan Coagulation Efficiency during the Continuous Integrated Process Experience
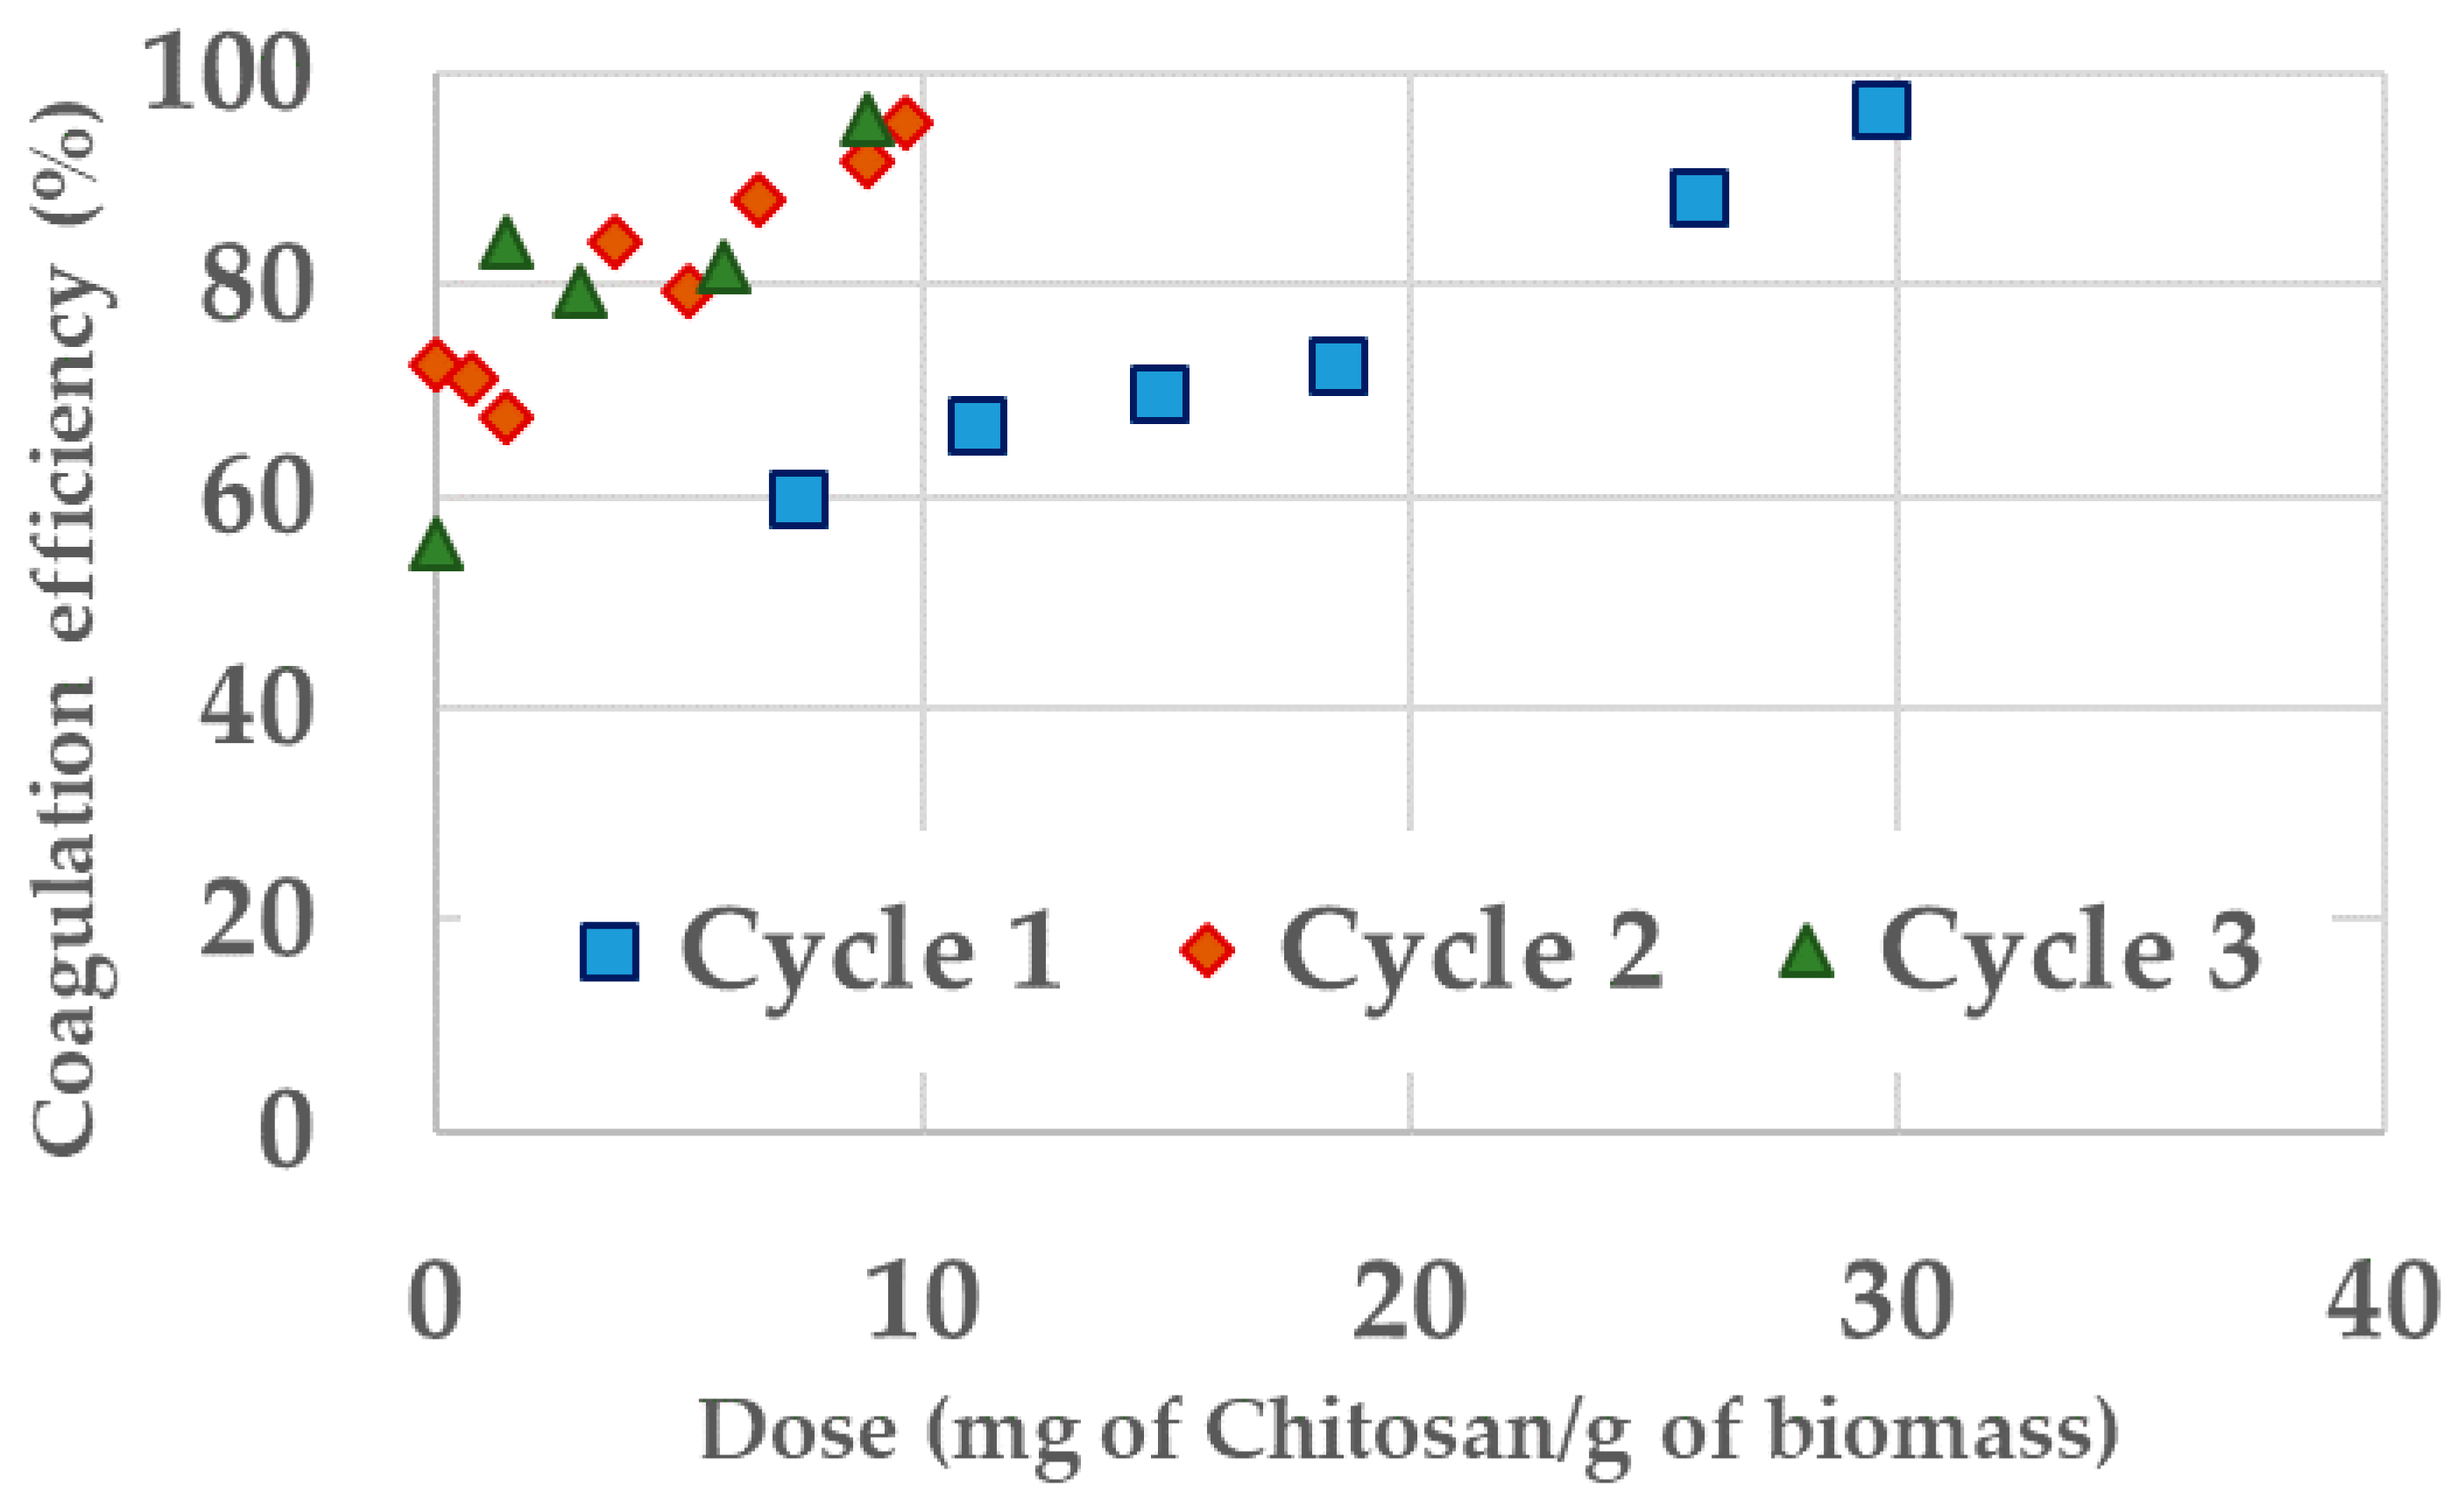
Figure A8. Chitosan coagulation efficiency for the culture of HFWWC grown in HFWW after each of the three cycles of the experiment of the continuous integrated process experience.
Processes 09 00519 g0a8

References

  1. Wang, M.; Zhang, D.; Dong, J.; Tan, S.K. Application of constructed wetlands for treating agricultural runoff and agro-industrial wastewater: A review. Hydrobiologia 2018, 805, 1–31. [Google Scholar] [CrossRef]
  2. Kronvang, B.; Wendland, F.; Kovar, K.; Fraters, D. Land Use and Water Quality. Water 2020, 12, 2412. [Google Scholar] [CrossRef]
  3. Putra, A.; Yuliando, H. Soilless Culture System to Support Water Use Efficiency and Product Quality: A Review. Agric. Agric. Sci. Procedia 2015, 3, 283–288. [Google Scholar] [CrossRef] [Green Version]
  4. Hultberg, M.; Carlsson, A.S.; Gustafsson, S. Treatment of drainage solution from hydroponic greenhouse production with microalgae. Bioresour. Technol. 2013, 136, 401–406. [Google Scholar] [CrossRef] [PubMed]
  5. Saxena, P.; Bassi, A. Removal of nutrients from hydroponic greenhouse effluent by alkali precipitation and algae cultivation method. J. Chem. Technol. Biotechnol. 2013, 88, 858–863. [Google Scholar] [CrossRef]
  6. Delrue, F.; Alvarez-Diaz, P.D.; Fon-Sing, S.; Fleury, G.; Sassi, J.-F. The Environmental Biorefinery: Using Microalgae to Remediate Wastewater, a Win-Win Paradigm. Energies 2016, 9, 132. [Google Scholar] [CrossRef]
  7. Delrue, F.; Setier, P.A.; Sahut, C.; Cournac, L.; Roubaud, A.; Peltier, G.; Froment, A.-K. An economic, sustainability, and energetic model of biodiesel production from microalgae. Bioresour. Technol. 2012, 111, 191–200. [Google Scholar] [CrossRef] [PubMed]
  8. Hutner, S.H.; Provasoli, L.; Schatz, A.; Haskins, C.P. Some approaches to the study of the role of metals in the metabolism of microorganisms. Proc. Am. Philos. Soc. 1950, 94, 152–170. [Google Scholar]
  9. Pei, H.; Ma, C.; Hu, W.; Sun, F. The behaviors of Microcystis aeruginosa cells and extracellular microcystins during chitosan flocculation and flocs storage processes. Bioresour. Technol. 2014, 151, 314–322. [Google Scholar] [CrossRef]
  10. Arbib, Z.; Ruiz, J.; Alvarez, P.; Garrido-Pérez, C.; Barragan, J.; Perales, J.A. Photobiotreatment: Influence of nitrogen and phosphorus ratio in wastewater on growth kinetics of Scenedesmus obliquus. Int. J. Phytoremediat. 2013, 15, 774–788. [Google Scholar] [CrossRef] [PubMed]
  11. Fernandes, T.; Fernandes, I.; Andrade, C.A.P.; Cordeiro, N. Assessing the impact of sulfur concentrations on growth and biochemical composition of three marine microalgae. J. Appl. Phycol. 2020, 32, 967–975. [Google Scholar] [CrossRef]
  12. Mera, R.; Torres, E.; Abalde, J. Effects of sodium sulfate on the freshwater microalga Chlamydomonas moewusii: Implications for the optimization of algal culture media. J. Phycol. 2016, 52, 75–88. [Google Scholar] [CrossRef]
  13. Xu, Y.; Purton, S.; Baganz, F. Chitosan flocculation to aid the harvesting of the microalga Chlorella sorokiniana. Bioresour. Technol. 2013, 129, 296–301. [Google Scholar] [CrossRef] [PubMed]
  14. Wu, Z.; Zhu, Y.; Huang, W.; Zhang, C.; Li, T.; Zhang, T.; Li, A. Evaluation of flocculation induced by pH increase for harvesting microalgae and reuse of flocculated medium. Bioresour. Technol. 2012, 110, 496–502. [Google Scholar] [CrossRef] [PubMed]
  15. Gonçalves, A.L.; Pires, J.C.M.; Simões, M. A review on the use of microalgal consortia for wastewater treatment. Algal. Res. 2017, 24, 403–415. [Google Scholar] [CrossRef]
  16. Halfhide, T.; Dalrymple, O.K.; Wilkie, A.C.; Trimmer, J.; Gillie, B.; Udom, I.; Zhang, Q.; Ergas, S.J. Growth of an Indigenous Algal Consortium on Anaerobically Digested Municipal Sludge Centrate: Photobioreactor Performance and Modeling. Bioenergy Res. 2015, 8, 249–258. [Google Scholar] [CrossRef]
  17. Moreno-García, A.F.; Neri-Torres, E.E.; Mena-Cervantes, V.Y.; Altamirano, R.H.; Pineda-Flores, G.; Luna-Sánchez, R.; García-Solares, M.; Vazquez-Arenas, J.; Suastes-Rivas, J.K. Sustainable biorefinery associated with wastewater treatment of Cr (III) using a native microalgae consortium. Fuel 2021, 290, 119040. [Google Scholar] [CrossRef]
  18. González-Camejo, J.; Robles, A.; Seco, A.; Ferrer, J.; Ruano, M.V. On-line monitoring of photosynthetic activity based on pH data to assess microalgae cultivation. J. Environ. Manag. 2020, 276, 111343. [Google Scholar] [CrossRef]
  19. Uggetti, E.; Sialve, B.; Hamelin, J.; Bonnafous, A.; Steyer, J.-P. CO2 addition to increase biomass production and control microalgae species in high rate algal ponds treating wastewater. J. CO2 Util. 2018, 28, 292–298. [Google Scholar] [CrossRef]
  20. Li, Y.; Ding, Y.; Li, D.; Miao, Z. Automatic carbon dioxide enrichment strategies in the greenhouse: A review. Biosyst. Eng. 2018, 171, 101–119. [Google Scholar] [CrossRef]
  21. Dineshkumar, R.; Kumaravel, R.; Gopalsamy, J.; Sikder, M.N.A.; Sampathkumar, P. Microalgae as Bio-fertilizers for Rice Growth and Seed Yield Productivity. Waste Biomass Valorization 2018, 9, 793–800. [Google Scholar] [CrossRef]
  22. Milledge, J.J.; Nielsen, B.V.; Maneein, S.; Harvey, P.J. A Brief Review of Anaerobic Digestion of Algae for Bioenergy. Energies 2019, 12, 1166. [Google Scholar] [CrossRef] [Green Version]
  23. Camacho, F.; Macedo, A.; Malcata, F. Potential Industrial Applications and Commercialization of Microalgae in the Functional Food and Feed Industries: A Short Review. Mar. Drugs 2019, 17, 312. [Google Scholar] [CrossRef] [PubMed] [Green Version]
  24. Novoveská, L.; Ross, M.E.; Stanley, M.S.; Pradelles, R.; Wasiolek, V.; Sassi, J.-F. Microalgal Carotenoids: A Review of Production, Current Markets, Regulations, and Future Direction. Mar. Drugs 2019, 17, 640. [Google Scholar] [CrossRef] [PubMed] [Green Version]
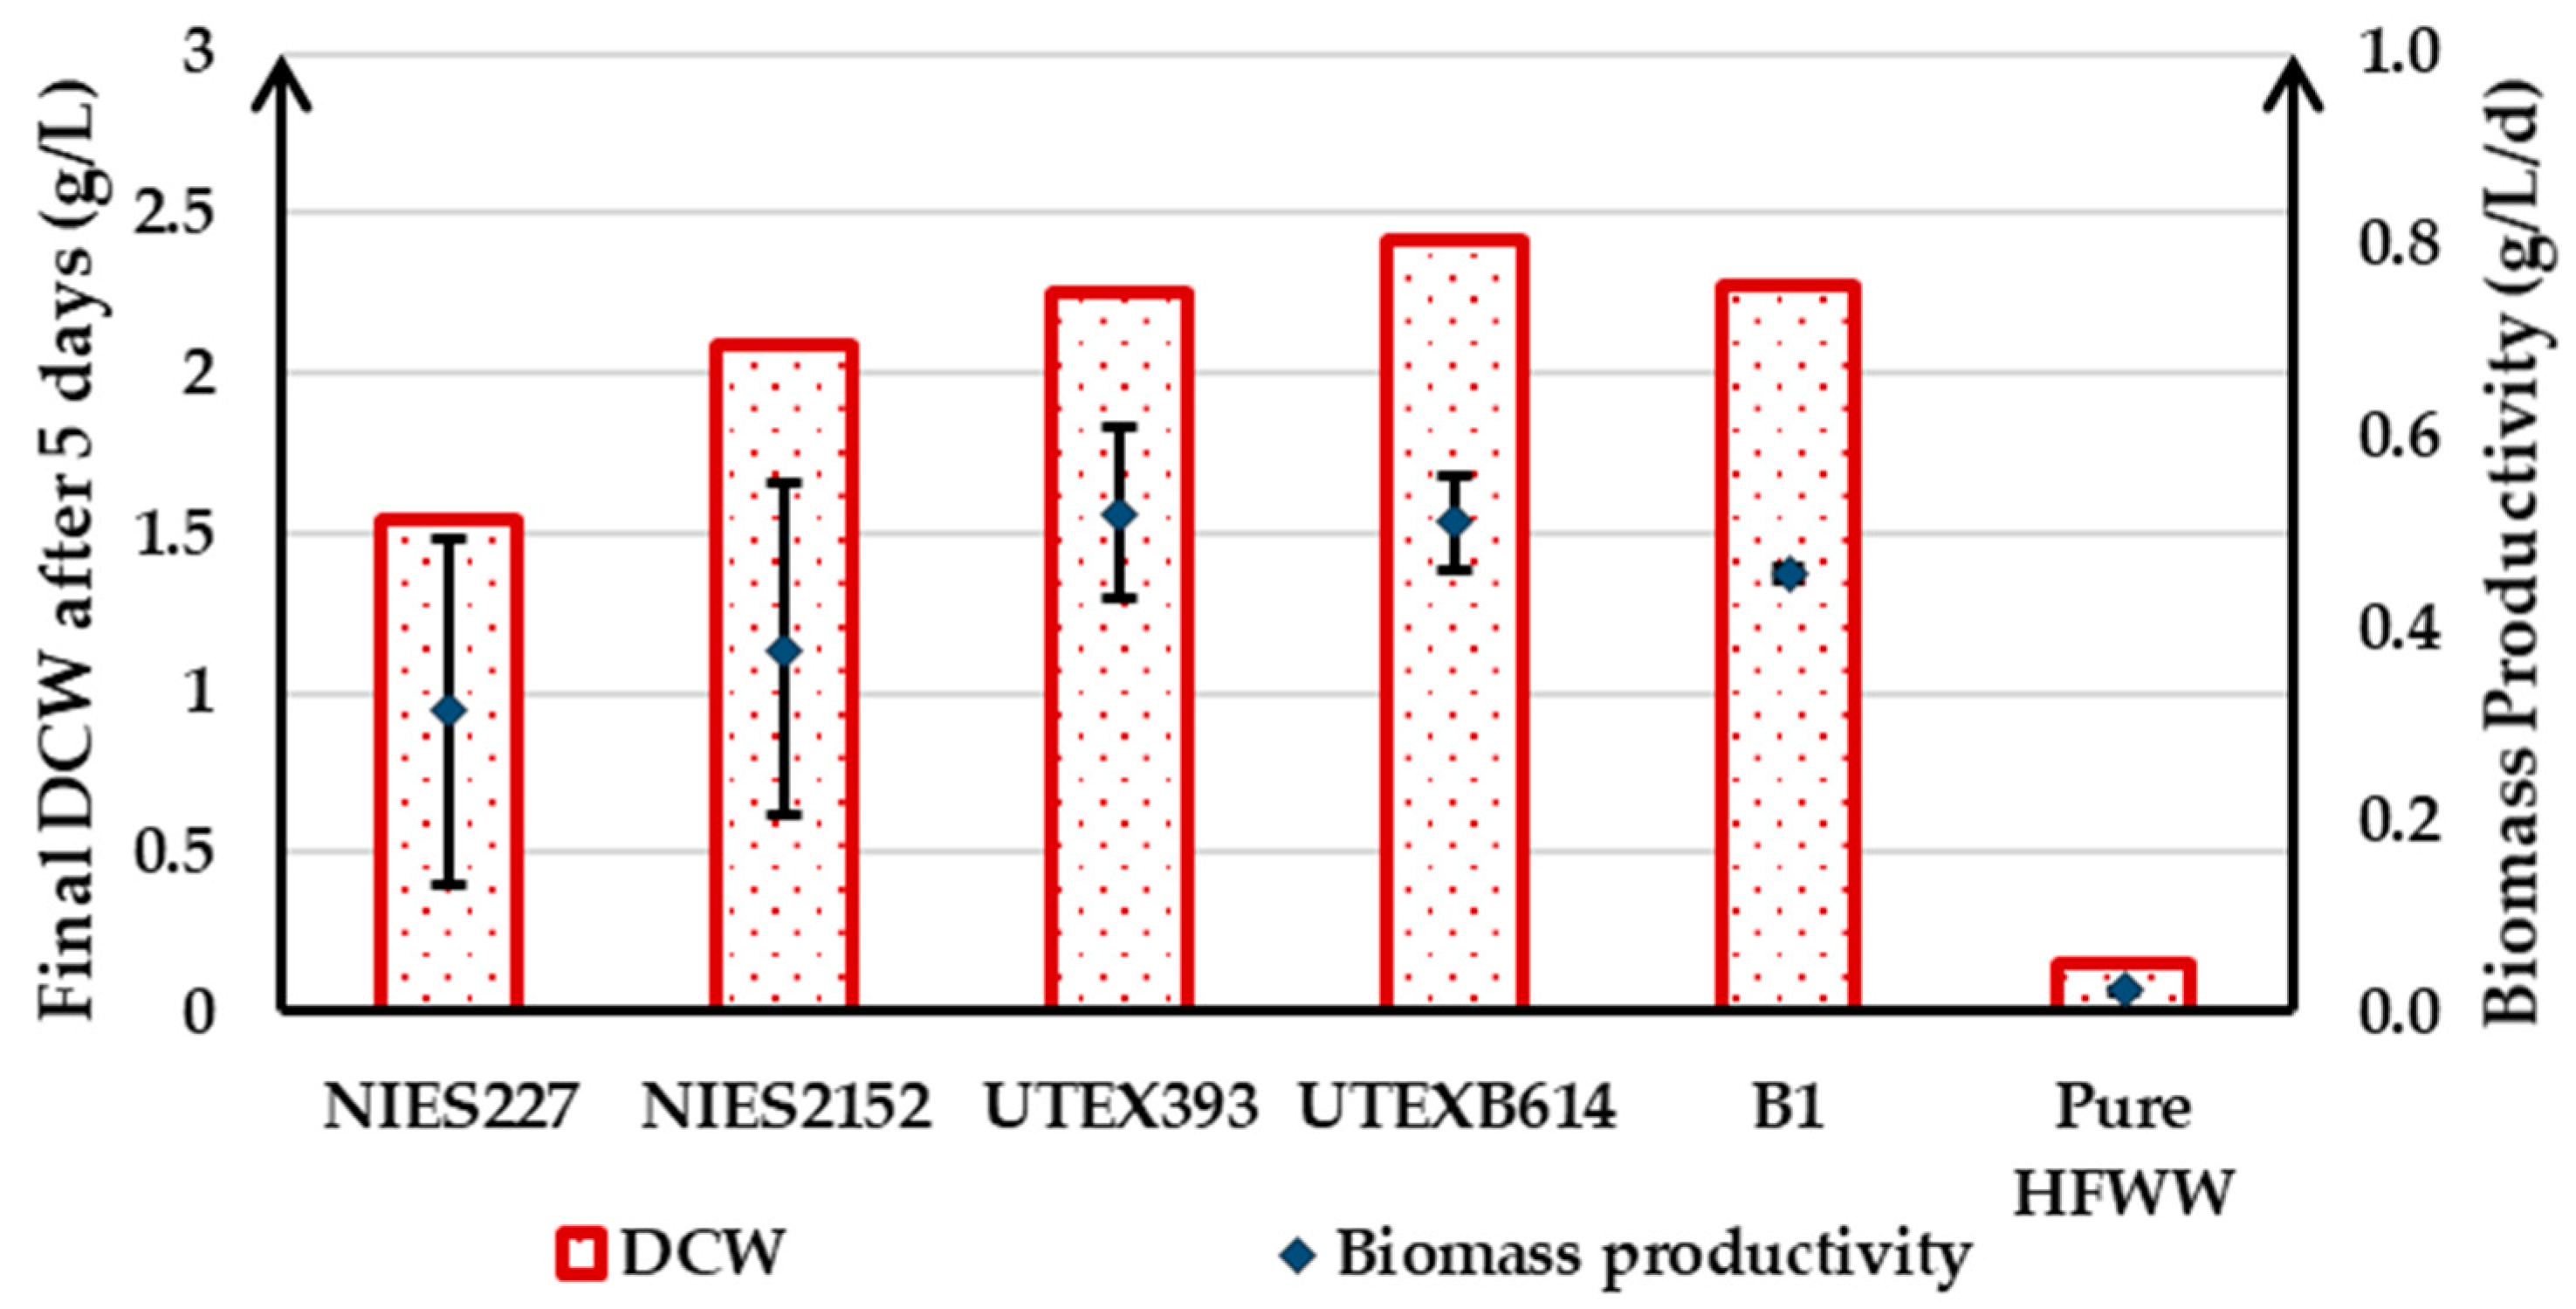
Figure 1. DCW (g/L) and biomass productivity (g/L/d) after 5 days of culture in pure HFWW in flasks for four strains (NIES227, NIES2152, UTEX393, and UTEXB614) and one consortium B1.
Processes 09 00519 g001
Figure 2. Evolution of the optical density (OD) at 880 nm for four strains (NIES227, NIES2152, UTEX393, and UTEXB614) and two consortia (B1 and hydroponic farm wastewater consortium (HFWWC)) grown in HFWW in a semi-continuous mode of 3, 4, and 5 days.
Processes 09 00519 g002
Figure 3. Biomass productivity for four strains (NIES 227, NIES 2152, UTEX 393, and UTEX B614) and two consortia (B1 and HFWWC) grown in HFWW in a semi-continuous mode of 3 (cycle 1), 4 (cycle 2) and 5 (cycle 3) days.
Processes 09 00519 g003
Figure 4. Integrated continuous process to treat HFWW using HFWWC.
Processes 09 00519 g004
Figure 5. Coagulation efficiency (%) as a function of the chitosan dose (in mg of chitosan per g of biomass) for HFWWC grown in FWM and HFWW.
Processes 09 00519 g005
Figure 6. Dry weight (g/L) for HFWWC during the three cycles of continuous treatment of HFWW (triplicates).
Processes 09 00519 g006
Table 1. Hydroponic farm wastewaters (HFWW) characterization.
ParameterEffluent 1Effluent 2Effluent 3Effluent 4
pH5.755.976.166.05
Dry weight (g/L)0.010.010.010.01
Carbon Oxygen Demand (COD) (mg/L)21.018.3--
Nitrate (mgN/L)235292170144
Phosphate (mgP/L)96.946091.167.0
Sulfate (mgS/L)14018243.0144.9
Ammonium (mgN/L)ND 1ND 1ND 1ND 1
Acetate (mg/L)ND 1ND 1ND 1ND 1
Chloride (mg/L)291413390219
Magnesium (mg/L)97.260.812444.3
Potassium (mg/L)70.16445979.6
Sodium (mg/L)13.255.5ND1139.2
1 Not Detected with the dilution used (x10).
Table 2. Dry cell weight (DCW) (g/L) after 5 days of culture of the four strains and the consortium B1 in three different conditions: pure Fresh-Water Medium (FWM), a mix of 50/50 FWM and HFWW, and pure HFWW.
StrainDCW after 5 Days (g/L)
Pure FWM50/50 FWM/HFWWPure HFWW
NIES2270.752.902.62
NIES21521.062.313.04
UTEX3930.811.832.17
UTEXB6140.823.332.36
Consortium B11.751.232.59
Table 3. Concentrations in nitrate (mgN/L), phosphate (mgP/L), sulfate (mgS/L), and their respective removal efficiency after 5 days of culture in pure HWW in flasks for four strains (NIES227, NIES2152, UTEX393, and UTEXB614) and one consortium B1.
Nitrate (mgN/L)Phosphate (mgP/L)Sulfate (mgS/L)
Raw HFWW 23596.9140
NIES227136.1 (42.0%)30.3 (68.8%)65.7 (52.9%)
NIES215271.5 (69.5%)0 (100%)111 (21.2%)
UTEX393106 (54.7%)0 (100%)116 (17.1%)
UTEXB61460 (74.4%)0 (100%)109 (22.3%)
Consortium B171.9 (69.4%)0 (100%)110 (19.1%)
Table 4. Concentrations in nitrate (mgN/L), phosphate (mgP/L), Chemical Oxygen Demand (COD) (mgO2/L) in the supernatant resulting from chitosan coagulation of HFWWC culture. Nitrate and phosphate removal rates in % in parentheses.
Optimal Chitosan Dose (mg/g of Biomass)Nitrate (mgN/L)
(Removal Rate in %)
Phosphate (mgP/L)
(Removal Rate in %)
COD (mgO2/L)
Raw HFWW 14467.0-
Cycle 129.650.26 (99.8%)10.0 (85.0%)523
Cycle 29.635.8 (96.0%)0 (100%)471
Cycle 38.891.85 (98.7%)16.0 (76.1%)298
Publisher’s Note: MDPI stays neutral with regard to jurisdictional claims in published maps and institutional affiliations.