Estimating Parameters of Photovoltaic Models Using Accurate Turbulent Flow of Water Optimizer
Abstract
:1. Introduction
2. Problem Formulation and Objective Function
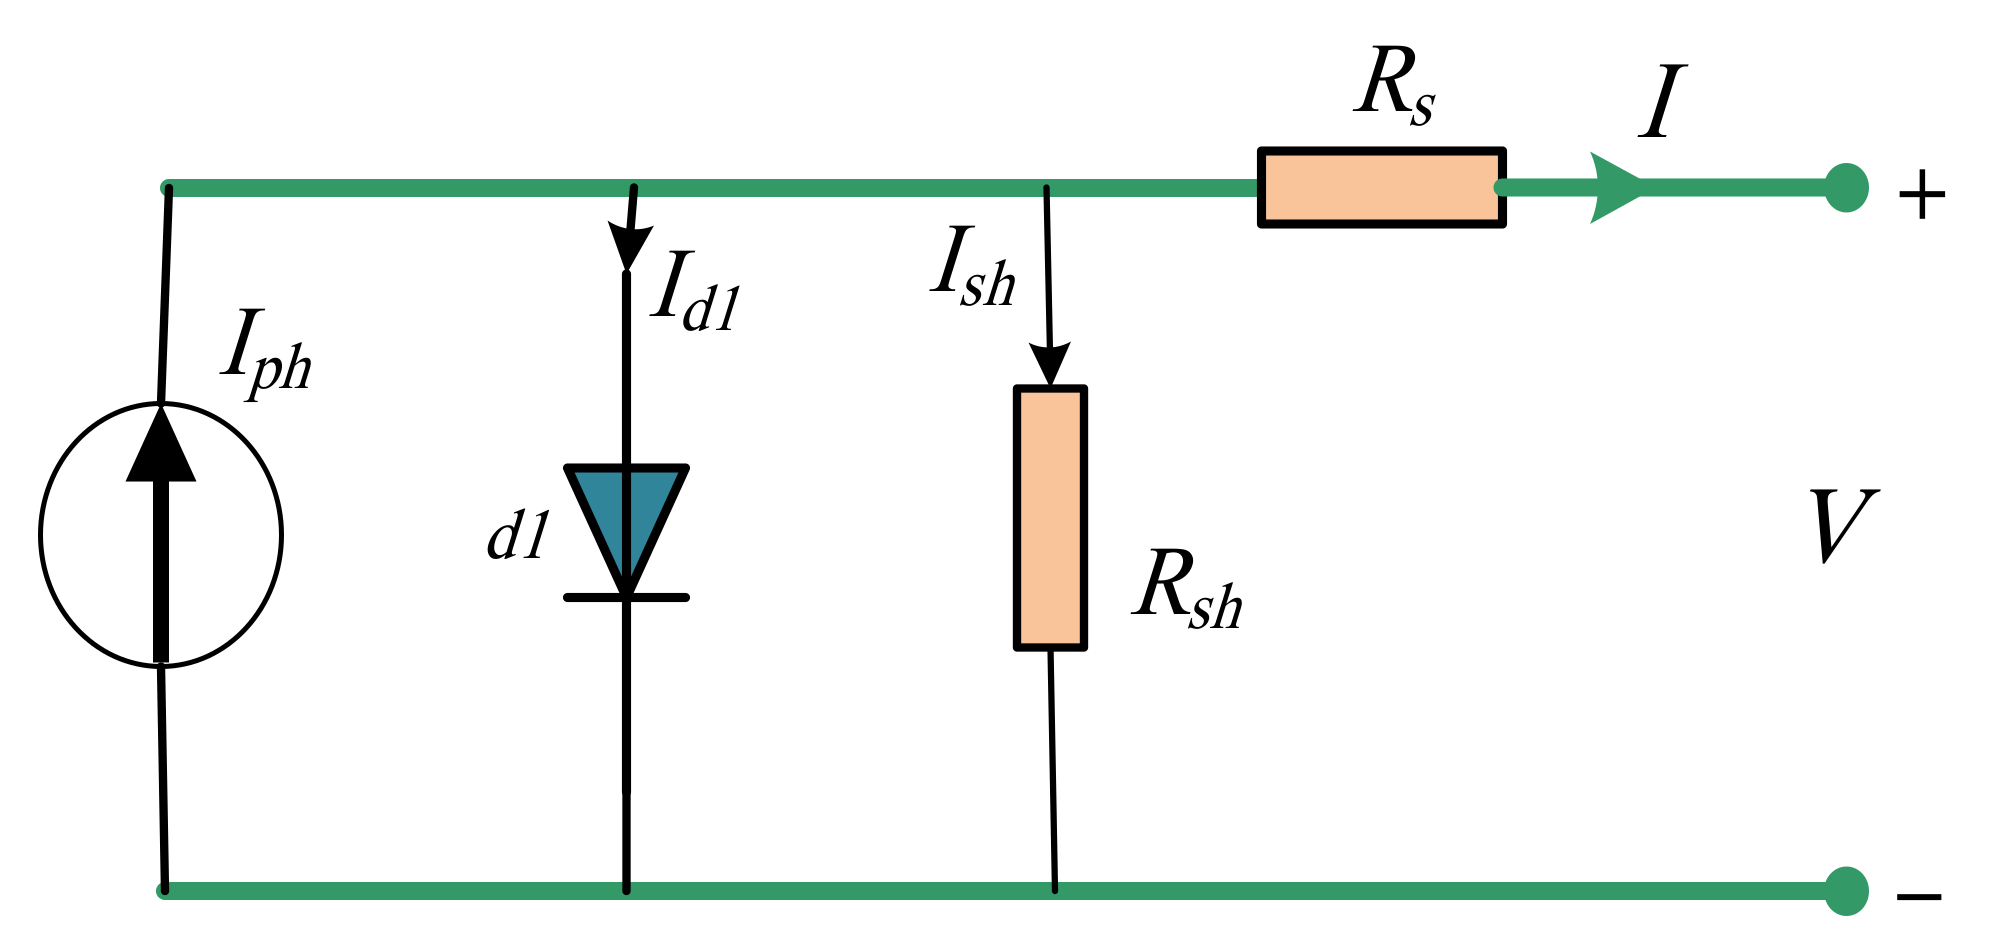
2.1. Analysis of SDM
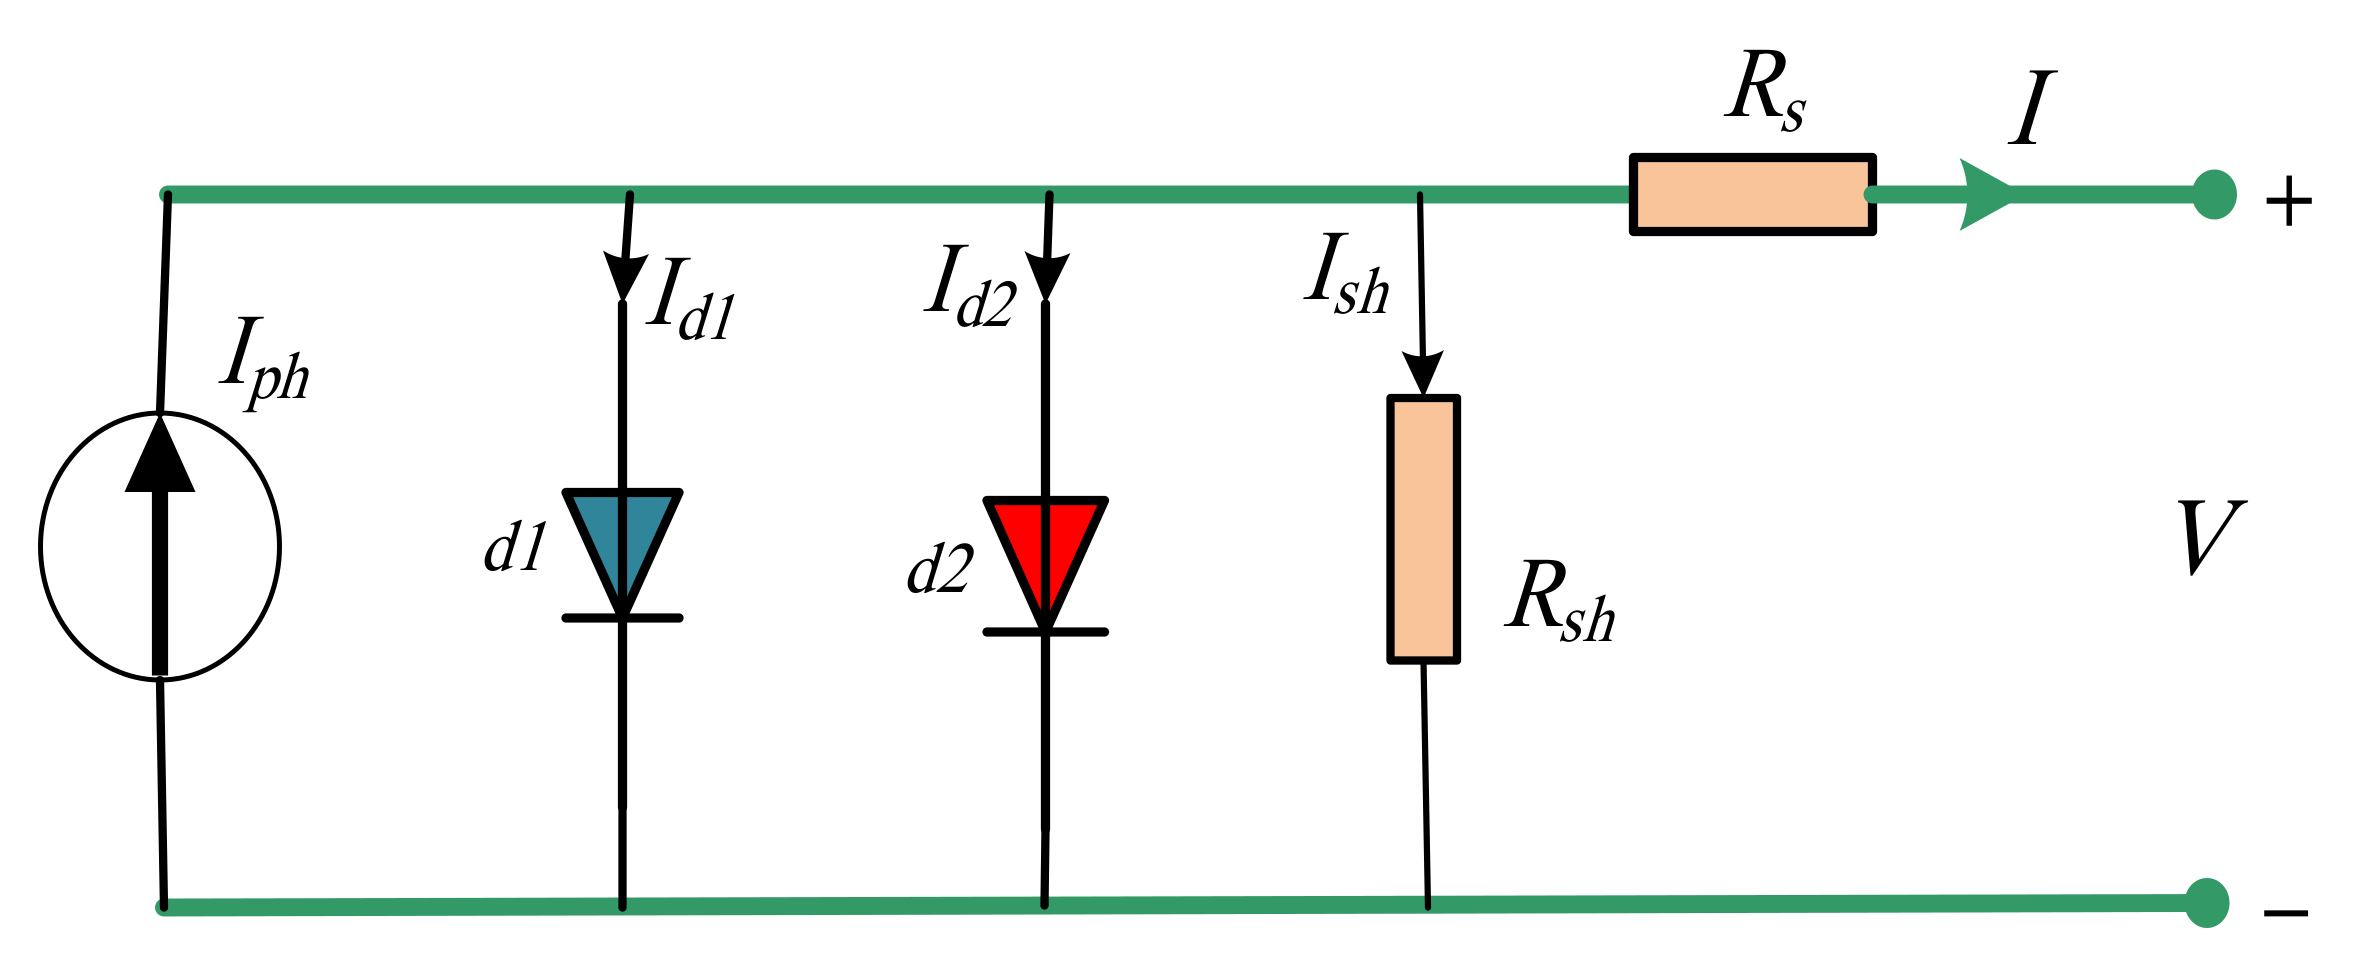
2.2. Analysis of DDM
2.3. Analysis of TDM
2.4. Estimated Objective Function
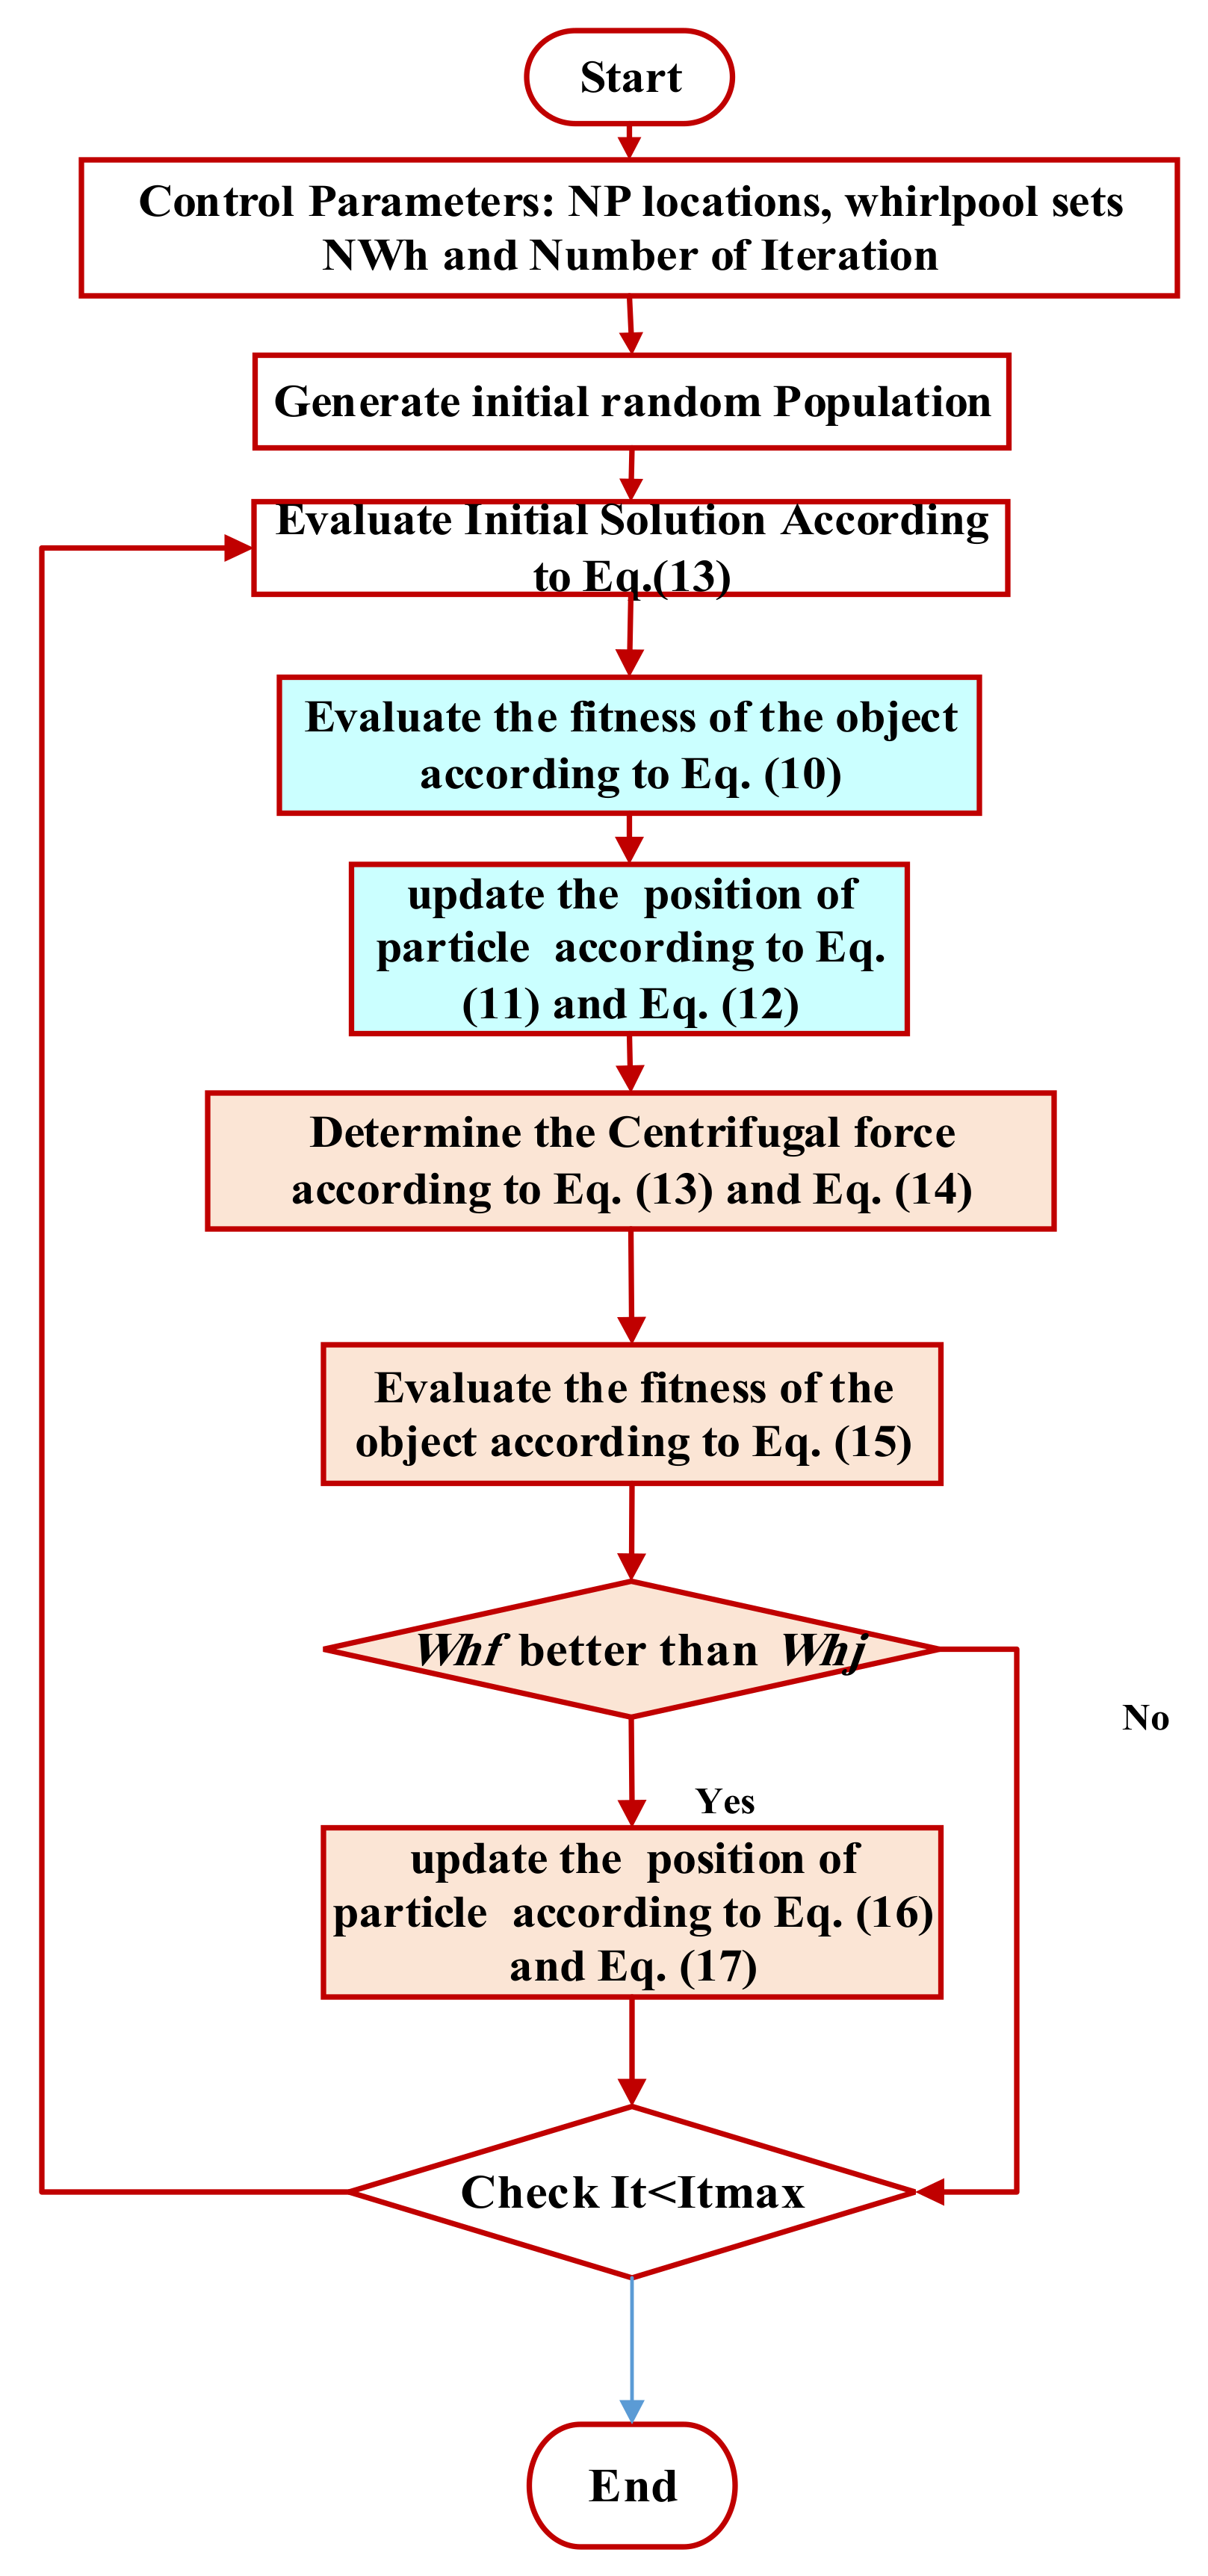
3. Proposed Turbulent Flow of Water-Based Optimization Algorithm
4. Simulation Results and Discussion
4.1. Compared Algorithms
4.2. Statistical Analysis for R.T.C. France Solar Cell
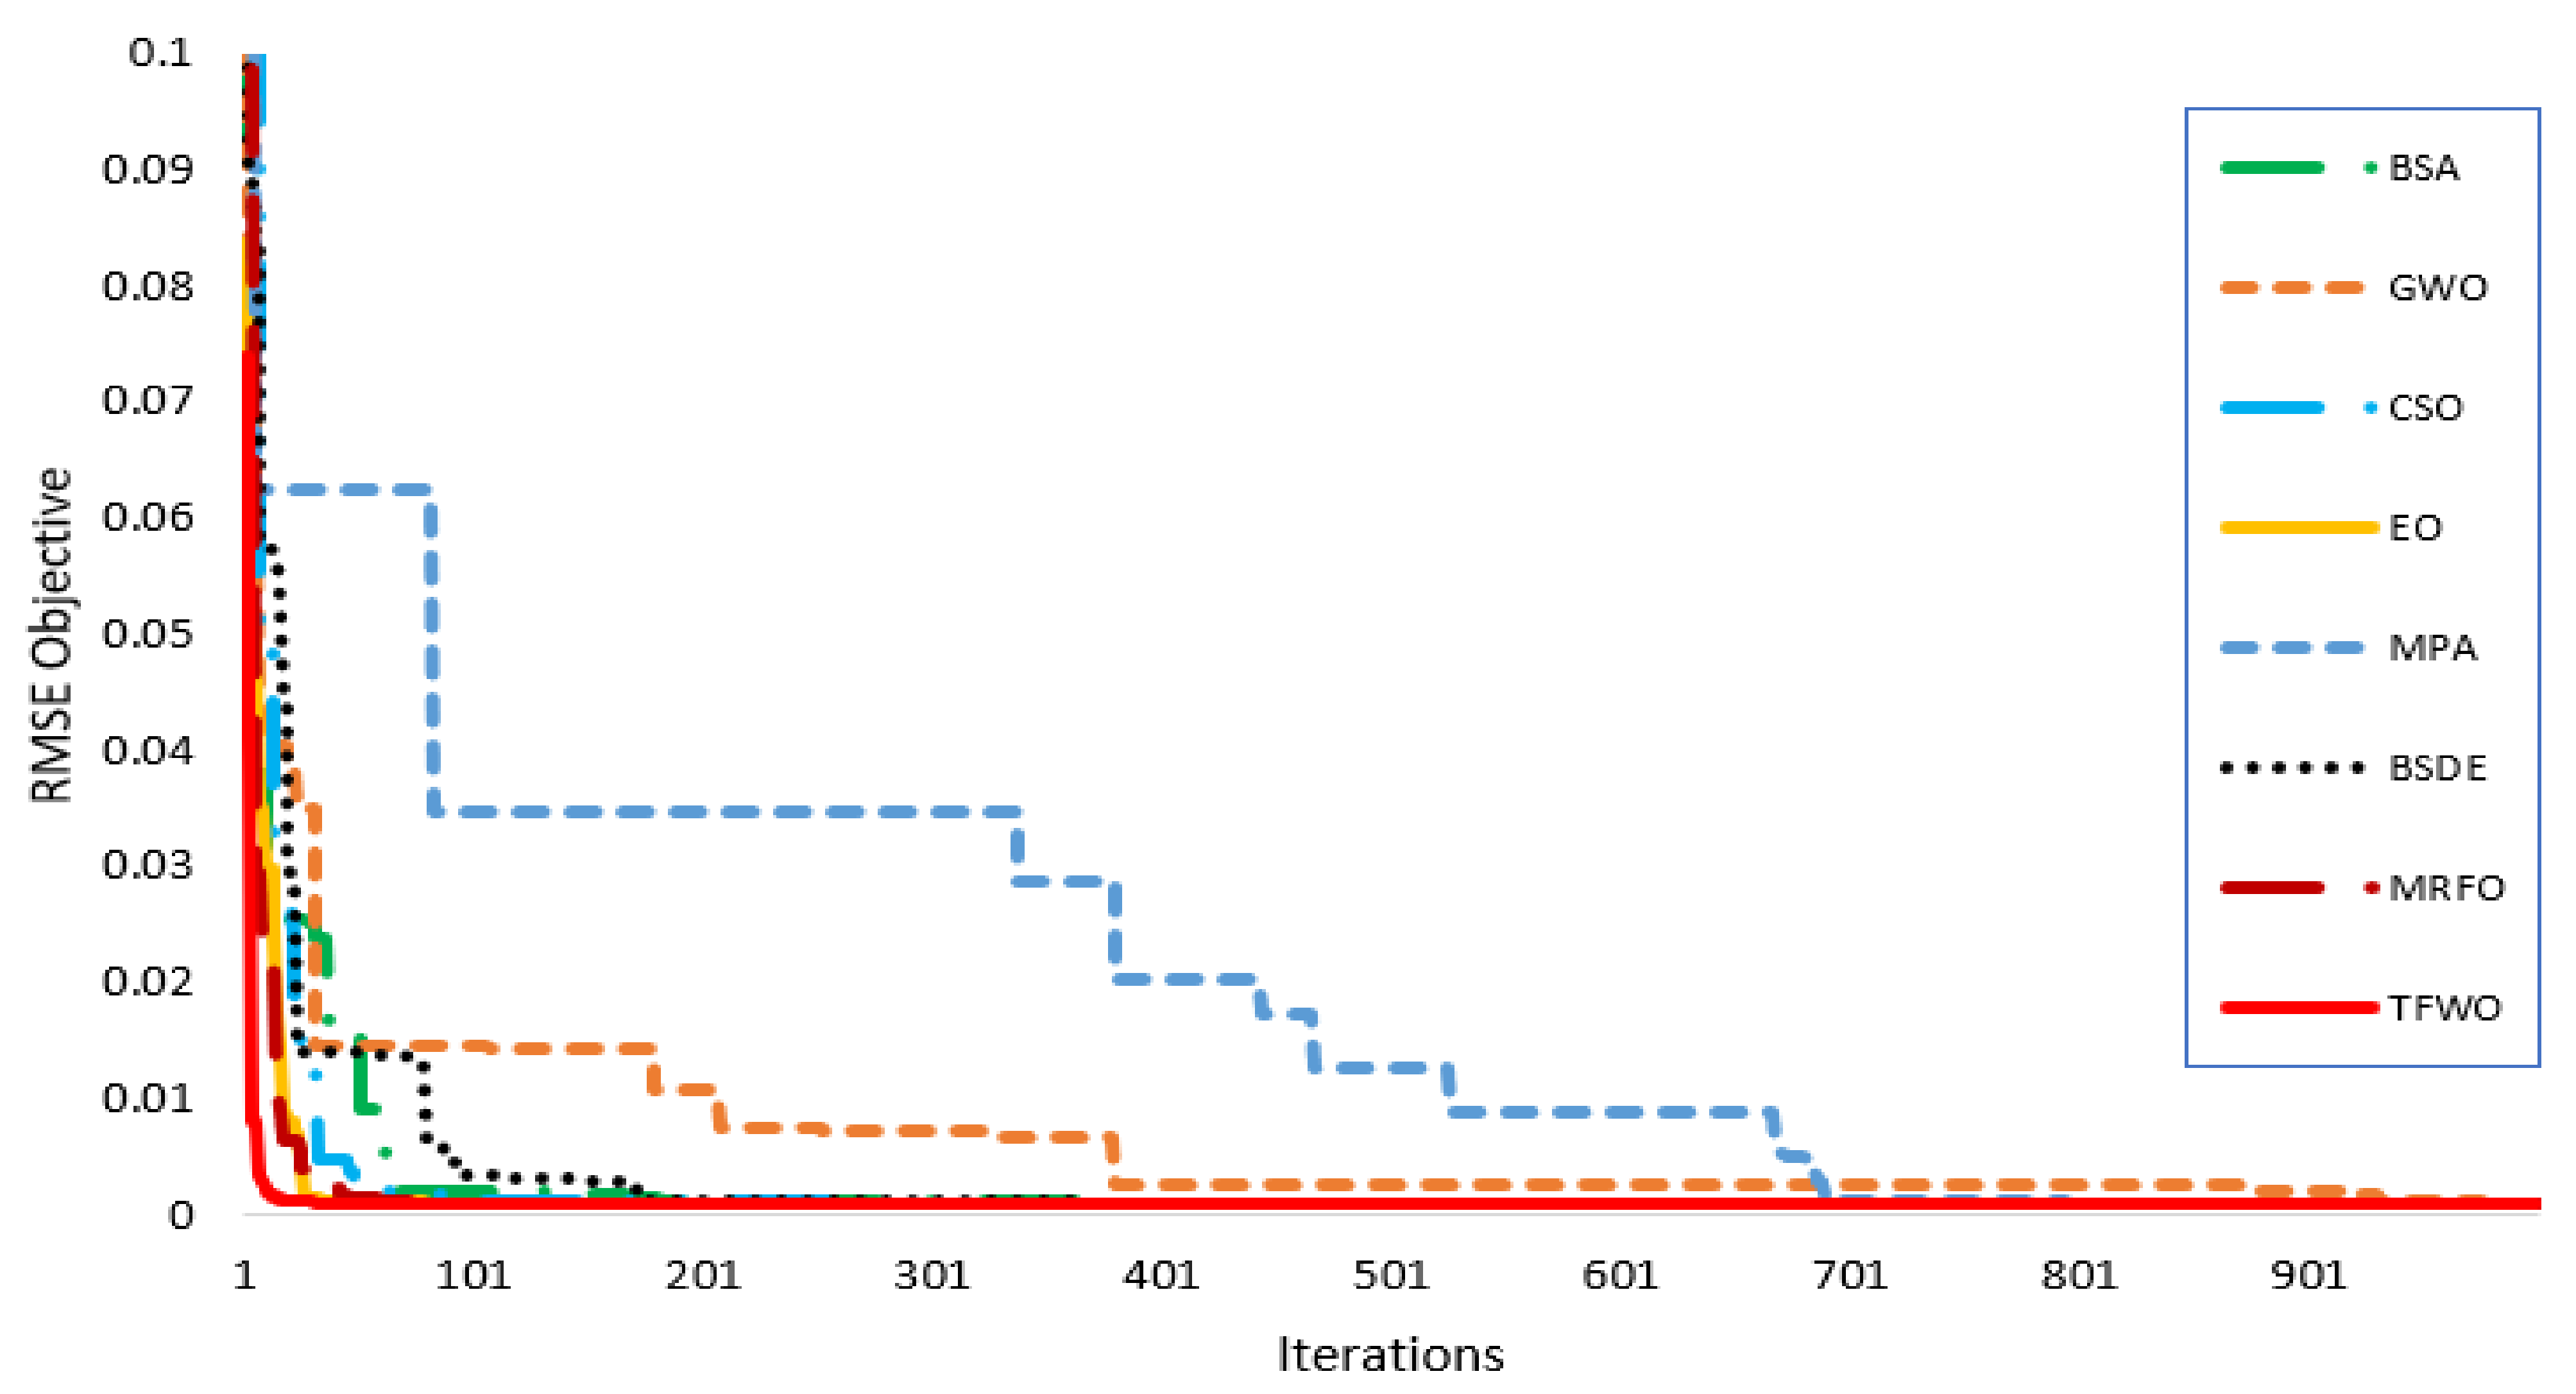
4.2.1. Single Diode Model
4.2.2. Double Diode Model
4.2.3. Three Diode Model
4.3. Statistical Analysis for KC200GT Solar Module
4.3.1. Single Diode Model
4.3.2. Double Diode Model
4.3.3. Three Diode Model
4.3.4. Statistical Analysis for KC200GT Models
5. Conclusions
Author Contributions
Funding
Institutional Review Board Statement
Informed Consent Statement
Data Availability Statement
Conflicts of Interest
References
- Afrand, M.; Shahsavar, A.; Sardari, P.T.; Sopian, K.; Salehipour, H. Energy and exergy analysis of two novel hybrid solar photovoltaic geothermal energy systems incorporating a building integrated photovoltaic thermal system and an earth air heat exchanger system. Sol. Energy 2019, 188, 83–95. [Google Scholar] [CrossRef]
- Dong, Z.; Bingyang, L.; Qintong, Z.; Jinping, L. Thermal performance and energy characteristic analysis of multiple renewable energy complementary heat pump system. Sol. Energy 2020, 196, 287–294. [Google Scholar] [CrossRef]
- Jurasz, J.; Canales, F.A.; Kies, A.; Guezgouz, M.; Beluco, A. A review on the complementarity of renewable energy sources: Concept, metrics, application and future research directions. Sol. Energy 2020, 195, 703–724. [Google Scholar] [CrossRef]
- Valančius, K.; Mikučionienė, R. Solar energy as a tool of renovating soviet-type multi apartment buildings. Sol. Energy 2020, 198, 93–100. [Google Scholar] [CrossRef]
- Herez, A.; el Hage, H.; Lemenand, T.; Ramadan, M.; Khaled, M. Review on photovoltaic/thermal hybrid solar collectors: Classifications, applications and new systems. Sol. Energy 2020, 207, 1321–1347. [Google Scholar] [CrossRef]
- Eldin, S.A.S.; Abd-Elhady, M.S.; Kandil, H.A. Feasibility of solar tracking systems for PV panelsza in hot and cold regions. Renew. Energy 2016, 85, 228–233. [Google Scholar] [CrossRef]
- Ahmad, L.; Khordehgah, N.; Malinauskaite, J.; Jouhara, H. Recent advances and applications of solar photovoltaics and thermal technologies. Energy 2020, 207, 118254. [Google Scholar] [CrossRef]
- El-Negamy, M.S.; Eteiba, M.B.; El-Bayoumi, G.M. Modeling and simulation of Egyptsat-1 satellite system powered by photovoltaic module. J. Am. Sci. 2013, 9, 110–116. [Google Scholar]
- Mahdavi, S.; Sarhaddi, F.; Hedayatizadeh, M. Energy/exergy based-evaluation of heating/cooling potential of PV/T and earth-air heat exchanger integration into a solar greenhouse. Appl. Therm. Eng. 2019, 149, 996–1007. [Google Scholar] [CrossRef]
- Niajalili, M.; Mayeli, P.; Naghashzadegan, M.; Poshtiri, A.H. Techno-economic feasibility of off-grid solar irrigation for a rice paddy in Guilan province in Iran: A case study. Sol. Energy 2017, 150, 546–557. [Google Scholar] [CrossRef]
- Ghasemi-Mobtaker, H.; Mostashari-Rad, F.; Saber, Z.; Chau, K.; Nabavi-Pelesaraei, A. Application of photovoltaic system to modify energy use, environmental damages and cumulative exergy demand of two irrigation systems-A case study: Barley production of Iran. Renew. Energy 2020, 160, 1316–1334. [Google Scholar] [CrossRef]
- Zaky, A.A.; Ibrahim, M.N.; Rezk, H.; Christopoulos, E.; el Sehiemy, R.A.; Hristoforou, E.; Kladas, A.; Sergeant, P.; Falaras, P. Energy efficiency improvement of water pumping system using synchronous reluctance motor fed by perovskite solar cells. Int. J. Energy Res. 2020, 44, 11629–11642. [Google Scholar] [CrossRef]
- Venkateswararao, A.; Ho, J.K.W.; So, S.K.; Liu, S.-W.; Wong, K.-T. Device characteristics and material developments of indoor photovoltaic devices. Mater. Sci. Eng. R Rep. 2020, 139, 100517. [Google Scholar] [CrossRef]
- Bai, Y.; Yu, R.; Bai, Y.; Zhou, E.; Hayat, T.; Alsaedi, A.; Tan, Z. Ternary blend strategy in benzotriazole-based organic photovoltaics for indoor application. Green Energy Environ. 2020. [Google Scholar] [CrossRef]
- Ali, M.N.; Mahmoud, K.; Lehtonen, M.; Darwish, M.M.F. An Efficient Fuzzy-Logic Based Variable-Step Incremental Conductance MPPT Method for Grid-Connected PV Systems. IEEE Access 2021, 9, 26420–26430. [Google Scholar] [CrossRef]
- Ali, M.N.; Mahmoud, K.; Lehtonen, M.; Darwish, M.M.F. Promising MPPT Methods Combining Metaheuristic, Fuzzy-Logic and ANN Techniques for Grid-Connected Photovoltaic. Sensors 2021, 21, 1244. [Google Scholar] [CrossRef] [PubMed]
- Bayoumi, A.S.; El-Sehiemy, R.A.; Mahmoud, K.; Lehtonen, M.; Darwish, M.M.F. Assessment of an Improved Three-Diode against Modified Two-Diode Patterns of MCS Solar Cells Associated with Soft Parameter Estimation Paradigms. Appl. Sci. 2021, 11, 1055. [Google Scholar] [CrossRef]
- Abbas, A.S.; El-Sehiemy, R.A.; Abou El-Ela, A.; Ali, E.S.; Mahmoud, K.; Lehtonen, M.; Darwish, M.M.F. Optimal Harmonic Mitigation in Distribution Systems with Inverter Based Distributed Generation. Appl. Sci. 2021, 11, 774. [Google Scholar] [CrossRef]
- Qais, M.H.; Hasanien, H.M.; Alghuwainem, S. Transient search optimization for electrical parameters estimation of photovoltaic module based on datasheet values. Energy Convers. Manag. 2020, 214, 112904. [Google Scholar] [CrossRef]
- Elsisi, M.; Mahmoud, K.; Lehtonen, M.; Darwish, M.M.F. An Improved Neural Network Algorithm to Efficiently Track Various Trajectories of Robot Manipulator Arms. IEEE Access 2021, 9, 11911–11920. [Google Scholar] [CrossRef]
- Elsisi, M.; Tran, M.-Q.; Mahmoud, K.; Lehtonen, M.; Darwish, M.M.F. Deep Learning-Based Industry 4.0 and Internet of Things towards Effective Energy Management for Smart Buildings. Sensors 2021, 21, 1038. [Google Scholar] [CrossRef] [PubMed]
- Elsisi, M.; Mahmoud, K.; Lehtonen, M.; Darwish, M.M.F. Reliable Industry 4.0 Based on Machine Learning and IoT for Analyzing, Monitoring, and Securing Smart Meters. Sensors 2021, 21, 487. [Google Scholar]
- Mansour, D.-E.A.; Abdel-Gawad, N.M.K.; El Dein, A.Z.; Ahmed, H.M.; Darwish, M.M.F.; Lehtonen, M. Recent Advances in Polymer Nanocomposites Based on Polyethylene and Polyvinylchloride for Power Cables. Materials 2021, 14, 66. [Google Scholar] [CrossRef]
- Abouelatta, M.A.; Ward, S.A.; Sayed, A.M.; Mahmoud, K.; Lehtonen, M.; Darwish, M.M.F. Fast Corona Discharge Assessment Using FDM integrated with Full Multigrid Method in HVDC Transmission Lines Considering Wind Impact. IEEE Access 2020, 8, 225872–225883. [Google Scholar] [CrossRef]
- Ghoneim, S.S.M.; Mahmoud, K.; Lehtonen, M.; Darwish, M.M.F. Enhancing Diagnostic Accuracy of Transformer Faults Using Teaching-Learning Based Optimization. IEEE Access 2021, 9. [Google Scholar] [CrossRef]
- Abaza, A.; El-Sehiemy, R.A.; Mahmoud, K.; Lehtonen, M.; Darwish, M.M.F. Optimal Estimation of Proton Exchange Membrane Fuel Cells Parameter Based on Coyote Optimization Algorithm. Appl. Sci. 2021, 11, 2052. [Google Scholar] [CrossRef]
- Lun, S.; Wang, S.; Yang, G.; Guo, T. A new explicit double-diode modeling method based on Lambert W-function for photovoltaic arrays. Sol. Energy 2015, 116, 69–82. [Google Scholar] [CrossRef]
- Toledo, F.J.; Blanes, J.M.; Galiano, V. Two-Step Linear Least-Squares Method for Photovoltaic Single-Diode Model Parameters Extraction. IEEE Trans. Ind. Electron. 2018, 65, 6301–6308. [Google Scholar] [CrossRef]
- Ayang, A.; Wamkeue, R.; Ouhrouche, M.; Djongyang, N.; Salomé, N.E.; Pombe, J.K.; Ekemb, G. Maximum likelihood parameters estimation of single-diode model of photovoltaic generator. Renew. Energy 2019, 130, 111–121. [Google Scholar] [CrossRef]
- Et-Torabi, K.; Nassar-eddine, I.; Obbadi, A.; Errami, Y.; Rmaily, R.; Sahnoun, S.; El Fajri, A.; Agunaou, M. Parameters estimation of the single and double diode photovoltaic models using a Gauss–Seidel algorithm and analytical method: A comparative study. Energy Convers. Manag. 2017, 148, 1041–1054. [Google Scholar] [CrossRef]
- Zaky, A.A.; Sehiemy, R.A.E.; Rashwan, Y.I.; Elhossieni, M.A.; Gkini, K.; Kladas, A.; Falaras, P. Optimal Performance Emulation of PSCs using the Elephant Herd Algorithm Associated with Experimental Validation. ECS J. Solid State Sci. Technol. 2019, 8, Q249–Q255. [Google Scholar] [CrossRef]
- Yu, K.; Liang, J.J.; Qu, B.Y.; Cheng, Z.; Wang, H. Multiple learning backtracking search algorithm for estimating parameters of photovoltaic models. Appl. Energy 2018, 226, 408–422. [Google Scholar] [CrossRef]
- Long, W.; Cai, S.; Jiao, J.; Xu, M.; Wu, T. A new hybrid algorithm based on grey wolf optimizer and cuckoo search for parameter extraction of solar photovoltaic models. Energy Convers. Manag. 2020, 203, 112243. [Google Scholar] [CrossRef]
- Chen, H.; Jiao, S.; Heidari, A.A.; Wang, M.; Chen, X.; Zhao, X. An opposition-based sine cosine approach with local search for parameter estimation of photovoltaic models. Energy Convers. Manag. 2019, 195, 927–942. [Google Scholar] [CrossRef]
- Jian, X.; Weng, Z. A logistic chaotic JAYA algorithm for parameters identification of photovoltaic cell and module models. Optik 2020, 203, 164041. [Google Scholar] [CrossRef]
- Zhang, H.; Heidari, A.A.; Wang, M.; Zhang, L.; Chen, H.; Li, C. Orthogonal Nelder-Mead moth flame method for parameters identification of photovoltaic modules. Energy Convers. Manag. 2020, 211, 112764. [Google Scholar] [CrossRef]
- Li, S.; Gong, W.; Yan, X.; Hu, C.; Bai, D.; Wang, L.; Gao, L. Parameter extraction of photovoltaic models using an improved teaching-learning-based optimization. Energy Convers. Manag. 2019, 186, 293–305. [Google Scholar] [CrossRef]
- Allam, D.; Yousri, D.A.; Eteiba, M.B. Parameters extraction of the three diode model for the multi-crystalline solar cell/module using Moth-Flame Optimization Algorithm. Energy Convers. Manag. 2016, 123, 535–548. [Google Scholar] [CrossRef]
- Chenouard, R.; El-Sehiemy, R.A. An interval branch and bound global optimization algorithm for parameter estimation of three photovoltaic models. Energy Convers. Manag. 2020, 205, 112400. [Google Scholar] [CrossRef]
- Niu, Q.; Zhang, H.; Li, K. An improved TLBO with elite strategy for parameters identification of PEM fuel cell and solar cell models. Int. J. Hydrog. Energy 2014, 39, 3837–3854. [Google Scholar] [CrossRef]
- Elaziz, M.A.; Oliva, D. Parameter estimation of solar cells diode models by an improved opposition-based whale optimization algorithm. Energy Convers. Manag. 2018, 171, 1843–1859. [Google Scholar] [CrossRef]
- Oliva, D.; Ewees, A.A.; Aziz, M.A.E.; Hassanien, A.E.; Peréz-Cisneros, M. A Chaotic Improved Artificial Bee Colony for Parameter Estimation of Photovoltaic Cells. Energies 2017, 10, 865. [Google Scholar] [CrossRef] [Green Version]
- Shaheen, A.M.; Ginidi, A.R.; El-Sehiemy, R.A.; Ghoneim, S.S.M. A Forensic-Based Investigation Algorithm for Parameter Extraction of Solar Cell Models. IEEE Access 2021, 9, 1–20. [Google Scholar] [CrossRef]
- Ismaeel, A.A.K.; Houssein, E.H.; Oliva, D.; Said, M. Gradient-based optimizer for parameter extraction in photovoltaic models. IEEE Access 2021, 9, 13403–13416. [Google Scholar] [CrossRef]
- Ghasemi, M.; Davoudkhani, I.F.; Akbari, E.; Rahimnejad, A.; Ghavidel, S.; Li, L. A novel and effective optimization algorithm for global optimization and its engineering applications: Turbulent Flow of Water-based Optimization (TFWO). Eng. Appl. Artif. Intell. 2020, 92, 103666. [Google Scholar] [CrossRef]
- García, R.M.A.; Abril, I.P. Photovoltaic module model determination by using the Tellegen’s theorem. Renew. Energy 2020, 152, 409–420. [Google Scholar] [CrossRef]
- Civicioglu, P. Backtracking Search Optimization Algorithm for numerical optimization problems. Appl. Math. Comput. 2013, 219, 8121–8144. [Google Scholar] [CrossRef]
- Mirjalili, S.; Mirjalili, S.M.; Lewis, A. Grey wolf optimizer. Adv. Eng. Softw. 2014, 69, 46–61. [Google Scholar] [CrossRef] [Green Version]
- Askarzadeh, A. A novel metaheuristic method for solving constrained engineering optimization problems: Crow search algorithm. Comput. Struct. 2016, 169, 1–12. [Google Scholar] [CrossRef]
- Faramarzi, A.; Heidarinejad, M.; Stephens, B.; Mirjalili, S. Equilibrium optimizer: A novel optimization algorithm. Knowl. Based Syst. 2020, 191, 105190. [Google Scholar] [CrossRef]
- Faramarzi, A.; Heidarinejad, M.; Mirjalili, S.; Gandomi, A.H. Marine Predators Algorithm: A nature-inspired metaheuristic. Expert Syst. Appl. 2020, 152, 113377. [Google Scholar] [CrossRef]
- Bernstein-Levy Search Differential Evolution Algorithm. Available online: https://www.mathworks.com/matlabcentral/fileexchange/77374-bernstein-levy-search-differential-evolution-algorithm (accessed on 1 March 2021).
- Zhao, W.; Zhang, Z.; Wang, L. Manta ray foraging optimization: An effective bio-inspired optimizer for engineering applications. Eng. Appl. Artif. Intell. 2020, 87, 103300. [Google Scholar] [CrossRef]
- Shaheen, A.M.; El-Sehiemy, R.A. Enhanced feeder reconfiguration in primary distribution networks using backtracking search technique. Aust. J. Electr. Electron. Eng. 2020, 17, 1–7. [Google Scholar] [CrossRef]
- Shaheen, A.M.; el Sehiemy, R.A.; Farrag, S.M. Integrated Strategies of Backtracking Search Optimizer for Solving Reactive Power Dispatch Problem. IEEE Syst. J. 2018, 12. [Google Scholar] [CrossRef]
- Tian, Z. Backtracking search optimization algorithm-based least square support vector machine and its applications. Eng. Appl. Artif. Intell. 2020, 94, 103801. [Google Scholar] [CrossRef]
- Abou-El-Ela, A.; L-Sehiemy, R.E.; Shaheen, A.M.; Eissa, I. Optimal coordination of static VAR compensators, fixed capacitors, and distributed energy resources in Egyptian distribution networks. Int. Trans. Electr. Energy Syst. 2020. [Google Scholar] [CrossRef]
- Shaheen, A.M.; el Sehiemy, R. Optimal co-ordinated allocation of distributed generation units/capacitor banks/voltage regulators by EGWA. IEEE Syst. J. 2020. [Google Scholar] [CrossRef]
- El-Bidairi, K.S.; Nguyen, H.D.; Jayasinghe, S.D.G.; Mahmoud, T.S.; Penesis, I. A hybrid energy management and battery size optimization for standalone microgrids: A case study for Flinders Island, Australia. Energy Convers. Manag. 2018, 175, 192–212. [Google Scholar] [CrossRef]
- Memarzadeh, G.; Keynia, F. A new short-term wind speed forecasting method based on fine-tuned LSTM neural network and optimal input sets. Energy Convers. Manag. 2020, 213, 112824. [Google Scholar] [CrossRef]
- Shaheen, A.M.; El-Sehiemy, R.A. Optimal allocation of capacitor devices on MV distribution networks using crow search algorithm. In Proceedings of the 24th International Conference on Electricity Distribution, Glasgow, Scotland, 12–15 June 2017. Paper No. 20. [Google Scholar]
- El Ela, A.A.A.; El-Sehiemy, R.A.; Shaheen, A.M.; Shalaby, A.S. Application of the crow search algorithm for economic environmental dispatch. In Proceedings of the 2017 Nineteenth International Middle East Power Systems Conference (MEPCON), Cairo, Egypt, 19–21 December 2017. [Google Scholar]
- Abdel-Basset, M.; Chang, V.; Mohamed, R. A novel equilibrium optimization algorithm for multi-thresholding image segmentation problems. Neural Comput. Appl. 2020. [Google Scholar] [CrossRef]
- Abdul-Hamied, D.T.; Shaheen, A.M.; Salem, W.A.; Gabr, W.I.; El-Sehiemy, R.A. Equilibrium optimizer based multi dimensions operation of hybrid AC/DC grids. Alex. Eng. J. 2020, 59, 4787–4803. [Google Scholar] [CrossRef]
- Yousri, D.; Babu, T.S.; Beshr, E.; Eteiba, M.B.; Allam, D. A Robust Strategy Based on Marine Predators Algorithm for Large Scale Photovoltaic Array Reconfiguration to Mitigate the Partial Shading Effect on the Performance of PV System. IEEE Access 2020, 8, 112407–112426. [Google Scholar] [CrossRef]
- Abdel-Basset, M.; Mohamed, R.; Elhoseny, M.; Bashir, A.K.; Jolfaei, A.; Kumar, N. Energy-Aware Marine Predators Algorithm for Task Scheduling in IoT-based Fog Computing Applications. IEEE Trans. Ind. Inf. 2020, 1. [Google Scholar] [CrossRef]
- Xu, H.; Song, H.; Xu, C.; Wu, X.; Yousefi, N. Exergy analysis and optimization of a HT-PEMFC using developed Manta Ray Foraging Optimization Algorithm. Int. J. Hydrog. Energy 2020, 45, 30932–30941. [Google Scholar] [CrossRef]
- Elattar, E.E.; Shaheen, A.M.; Elsayed, A.M.; El-Sehiemy, R.A. Optimal Power Flow with Emerged Technologies of Voltage Source Converter Stations in Meshed Power Systems. IEEE Access 2020, 8, 166963–166979. [Google Scholar] [CrossRef]
- Fathy, A.; Rezk, H.; Yousri, D. A robust global MPPT to mitigate partial shading of triple-junction solar cell-based system using manta ray foraging optimization algorithm. Sol. Energy 2020, 207, 305–316. [Google Scholar] [CrossRef]
- Kiparissides, A.; Koutinas, M.; Kontoravdi, C.; Mantalaris, A.; Pistikopoulos, E.N. ‘Closing the loop’ in biological systems modeling—From the in silico to the in vitro. Automatica 2011, 47, 1147–1155. [Google Scholar] [CrossRef]
- Kravaris, C.; Hahn, J.; Chu, Y. Advances and selected recent developments in state and parameter estimation. Comput. Chem. Eng. 2013, 51, 111–123. [Google Scholar] [CrossRef]
- Villaverde, A.F.; Barreiro, A.; Papachristodoulou, A. Structural Identifiability of Dynamic Systems Biology Models. PLoS Comput. Biol. 2016, 12, e1005153. [Google Scholar] [CrossRef] [Green Version]
- Bendary, A.F.; Abdelaziz, A.Y.; Ismail, M.M.; Mahmoud, K.; Lehtonen, M.; Darwish, M.M.F. Proposed ANFIS Based Approach for Fault Tracking, Detection, Clearing and Rearrangement for Photovoltaic System. Sensors 2021, 21, 2269. [Google Scholar] [CrossRef]




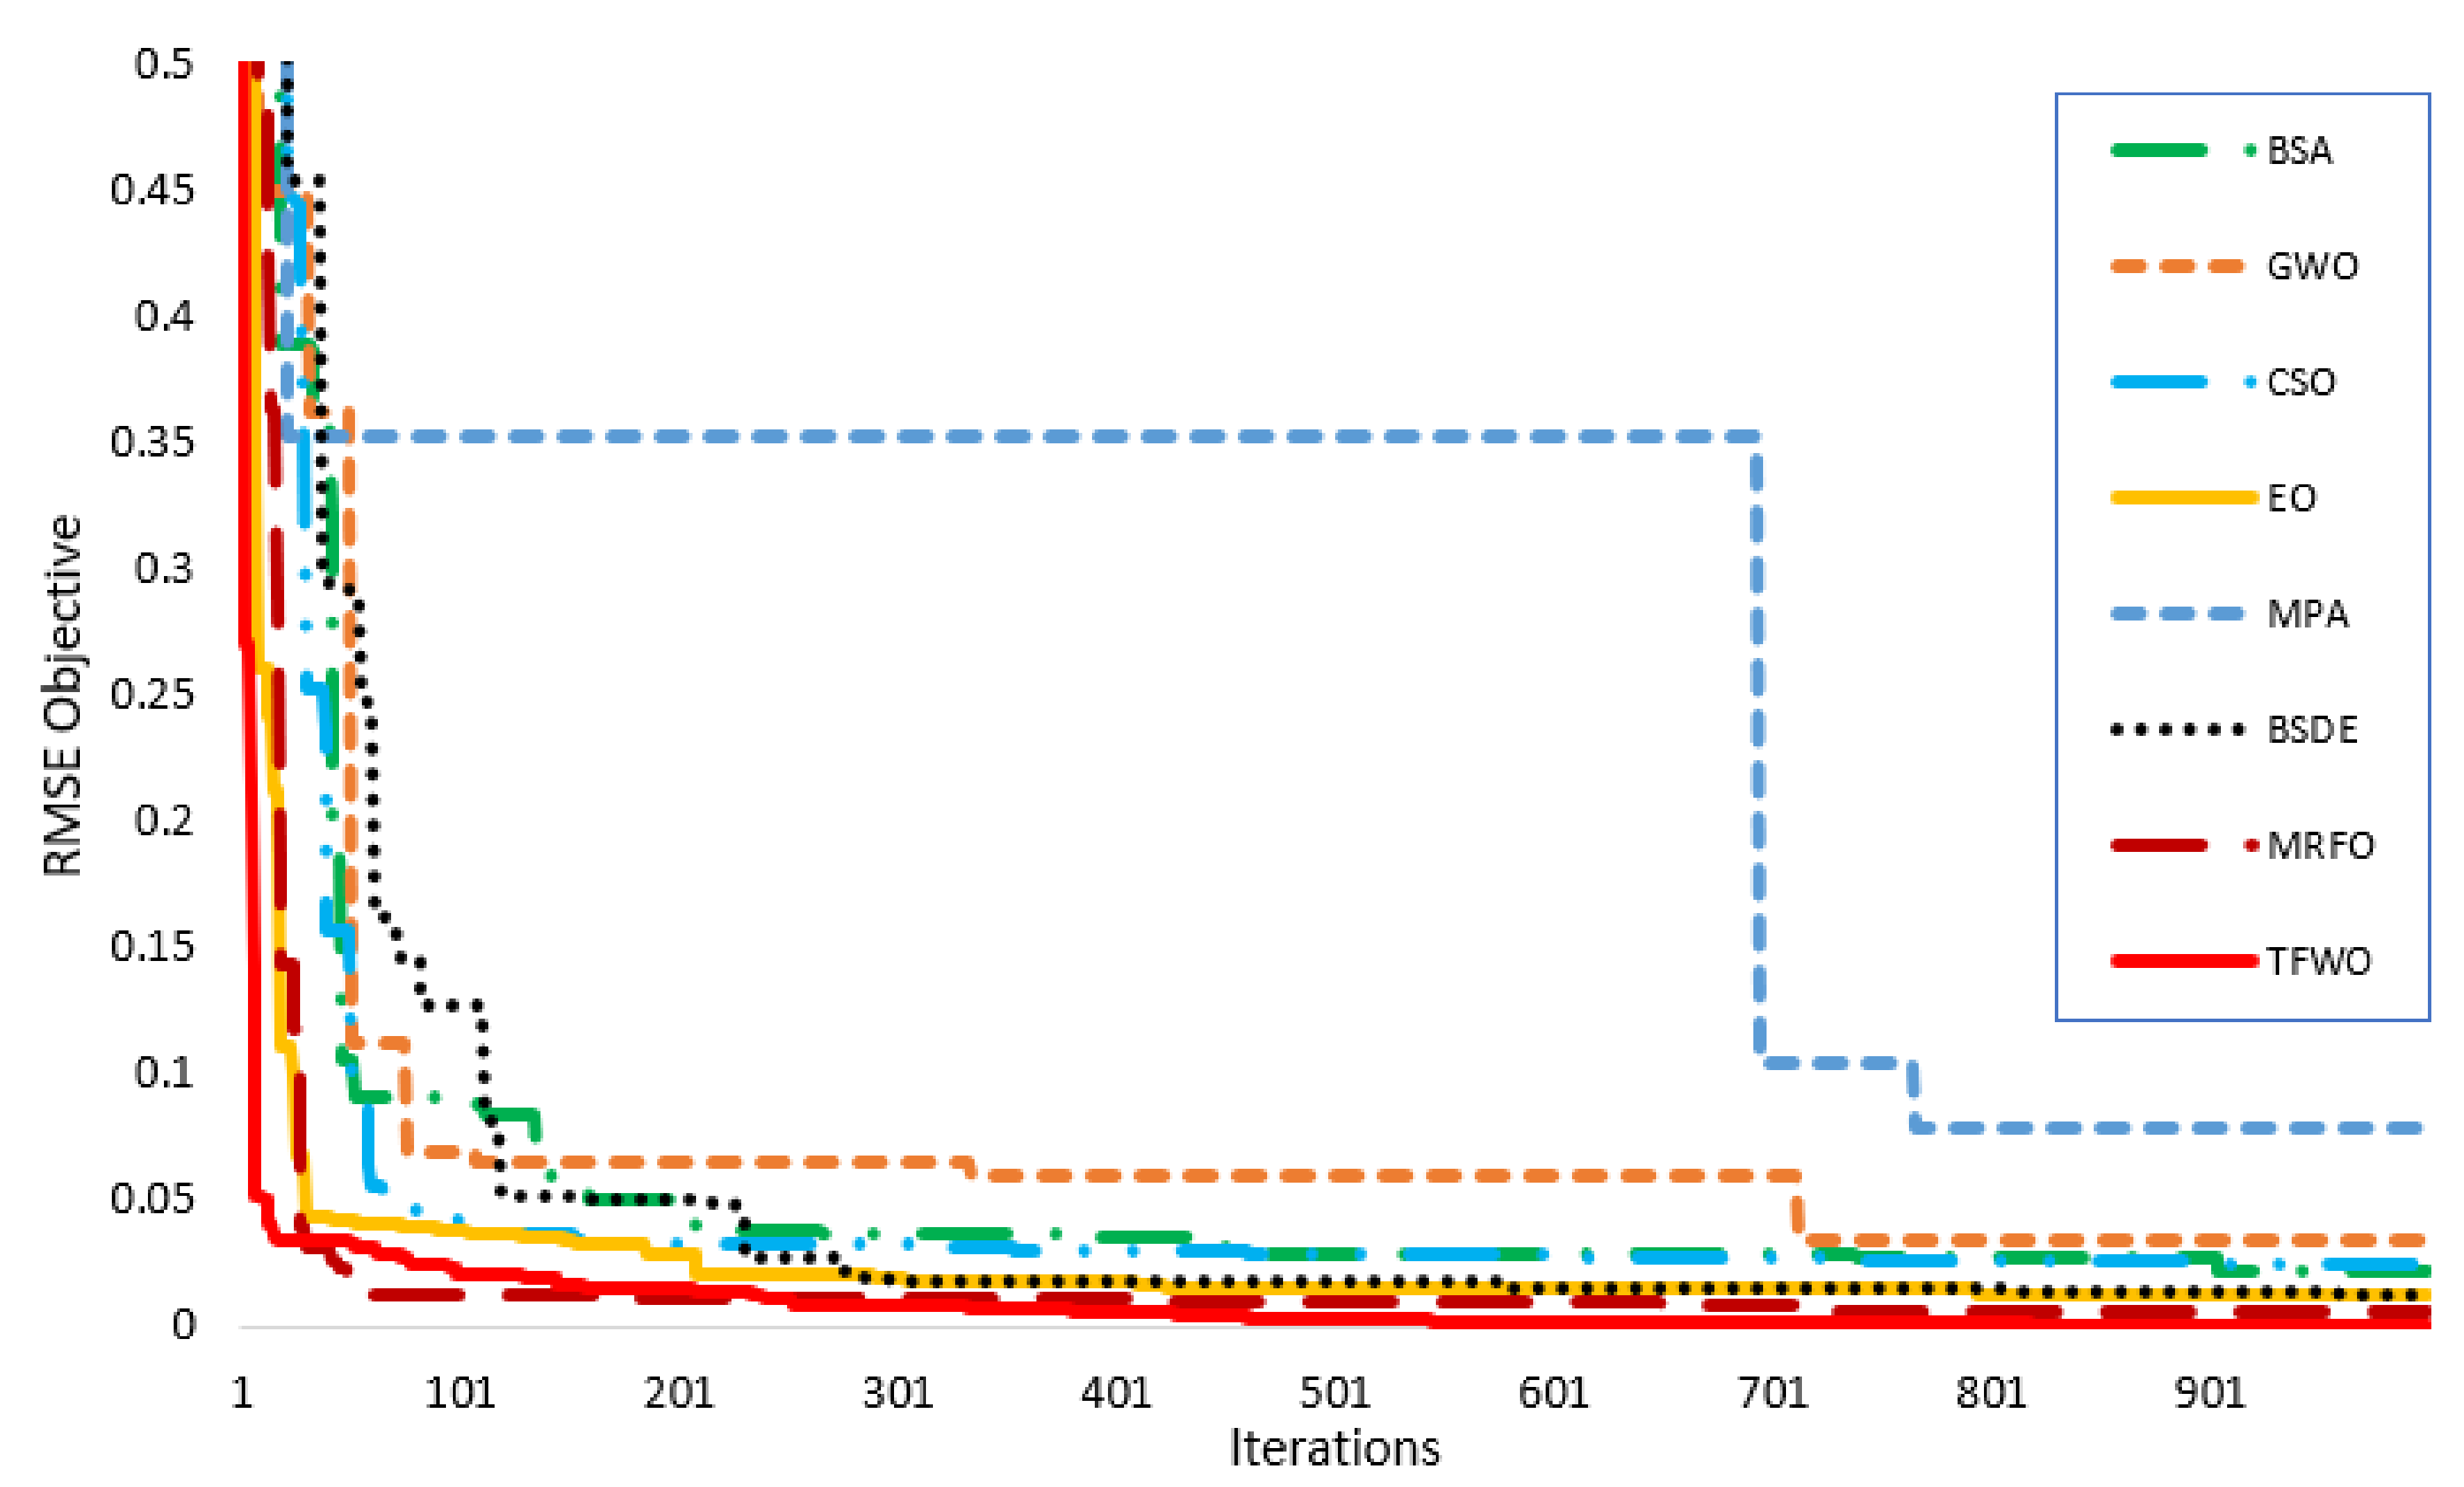

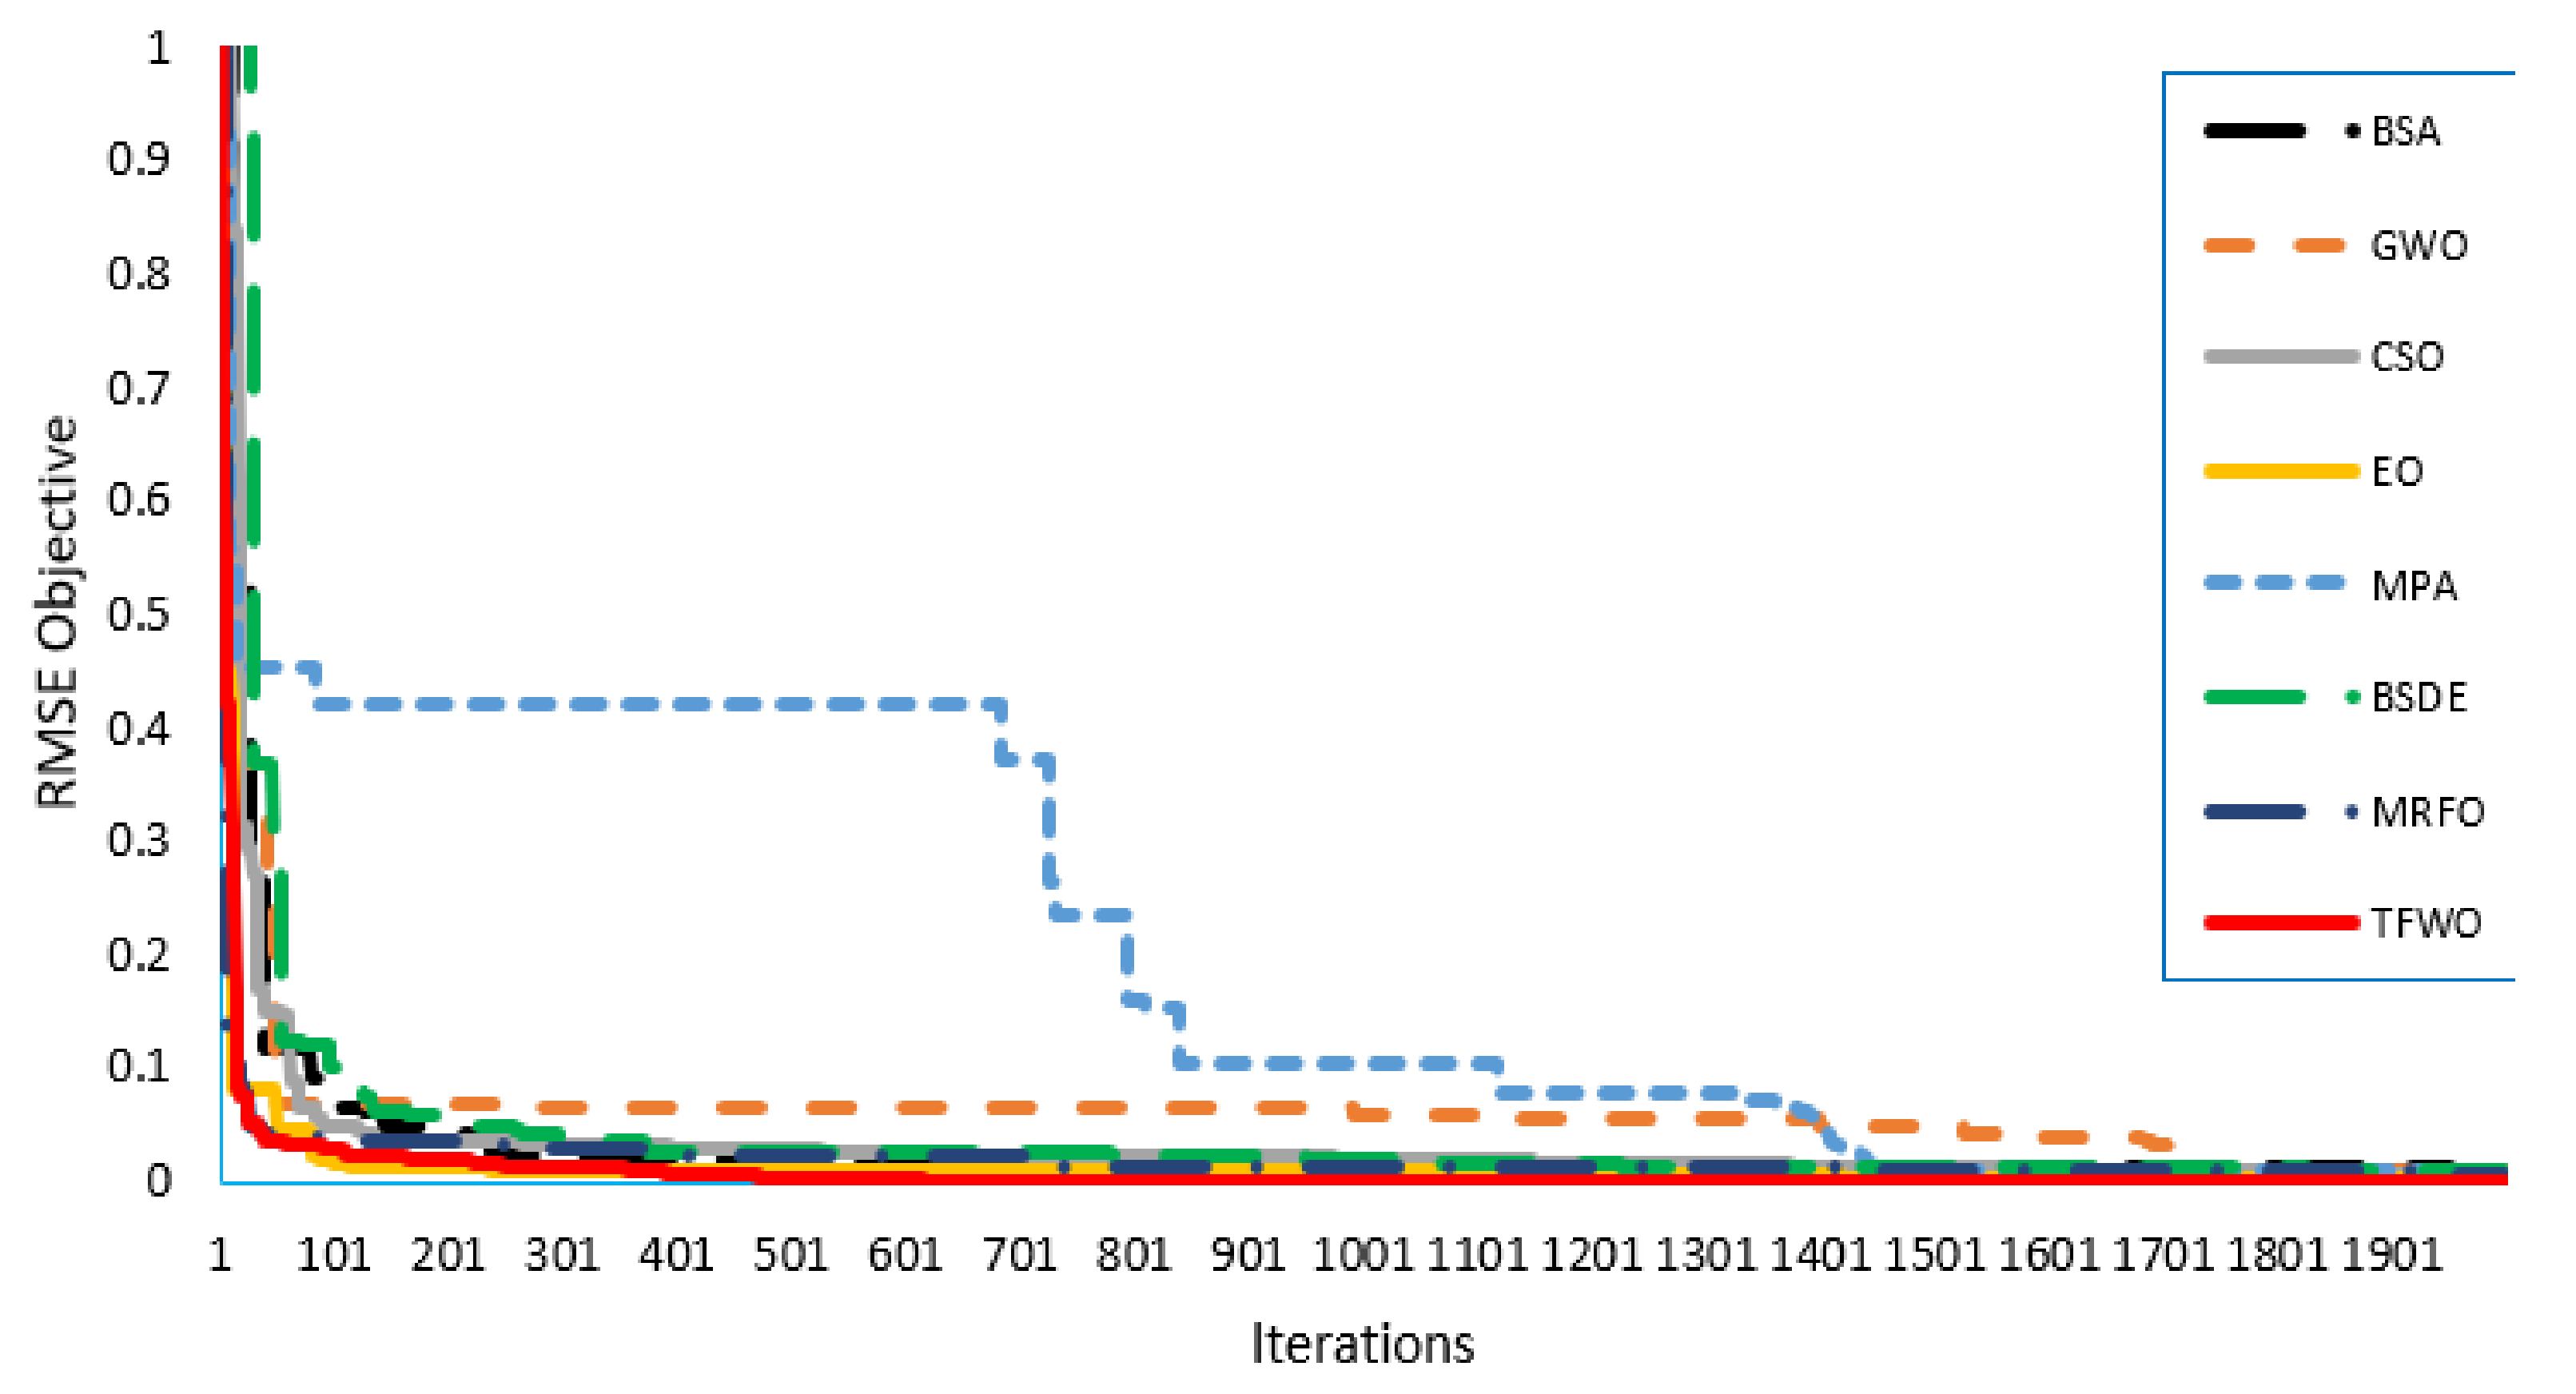
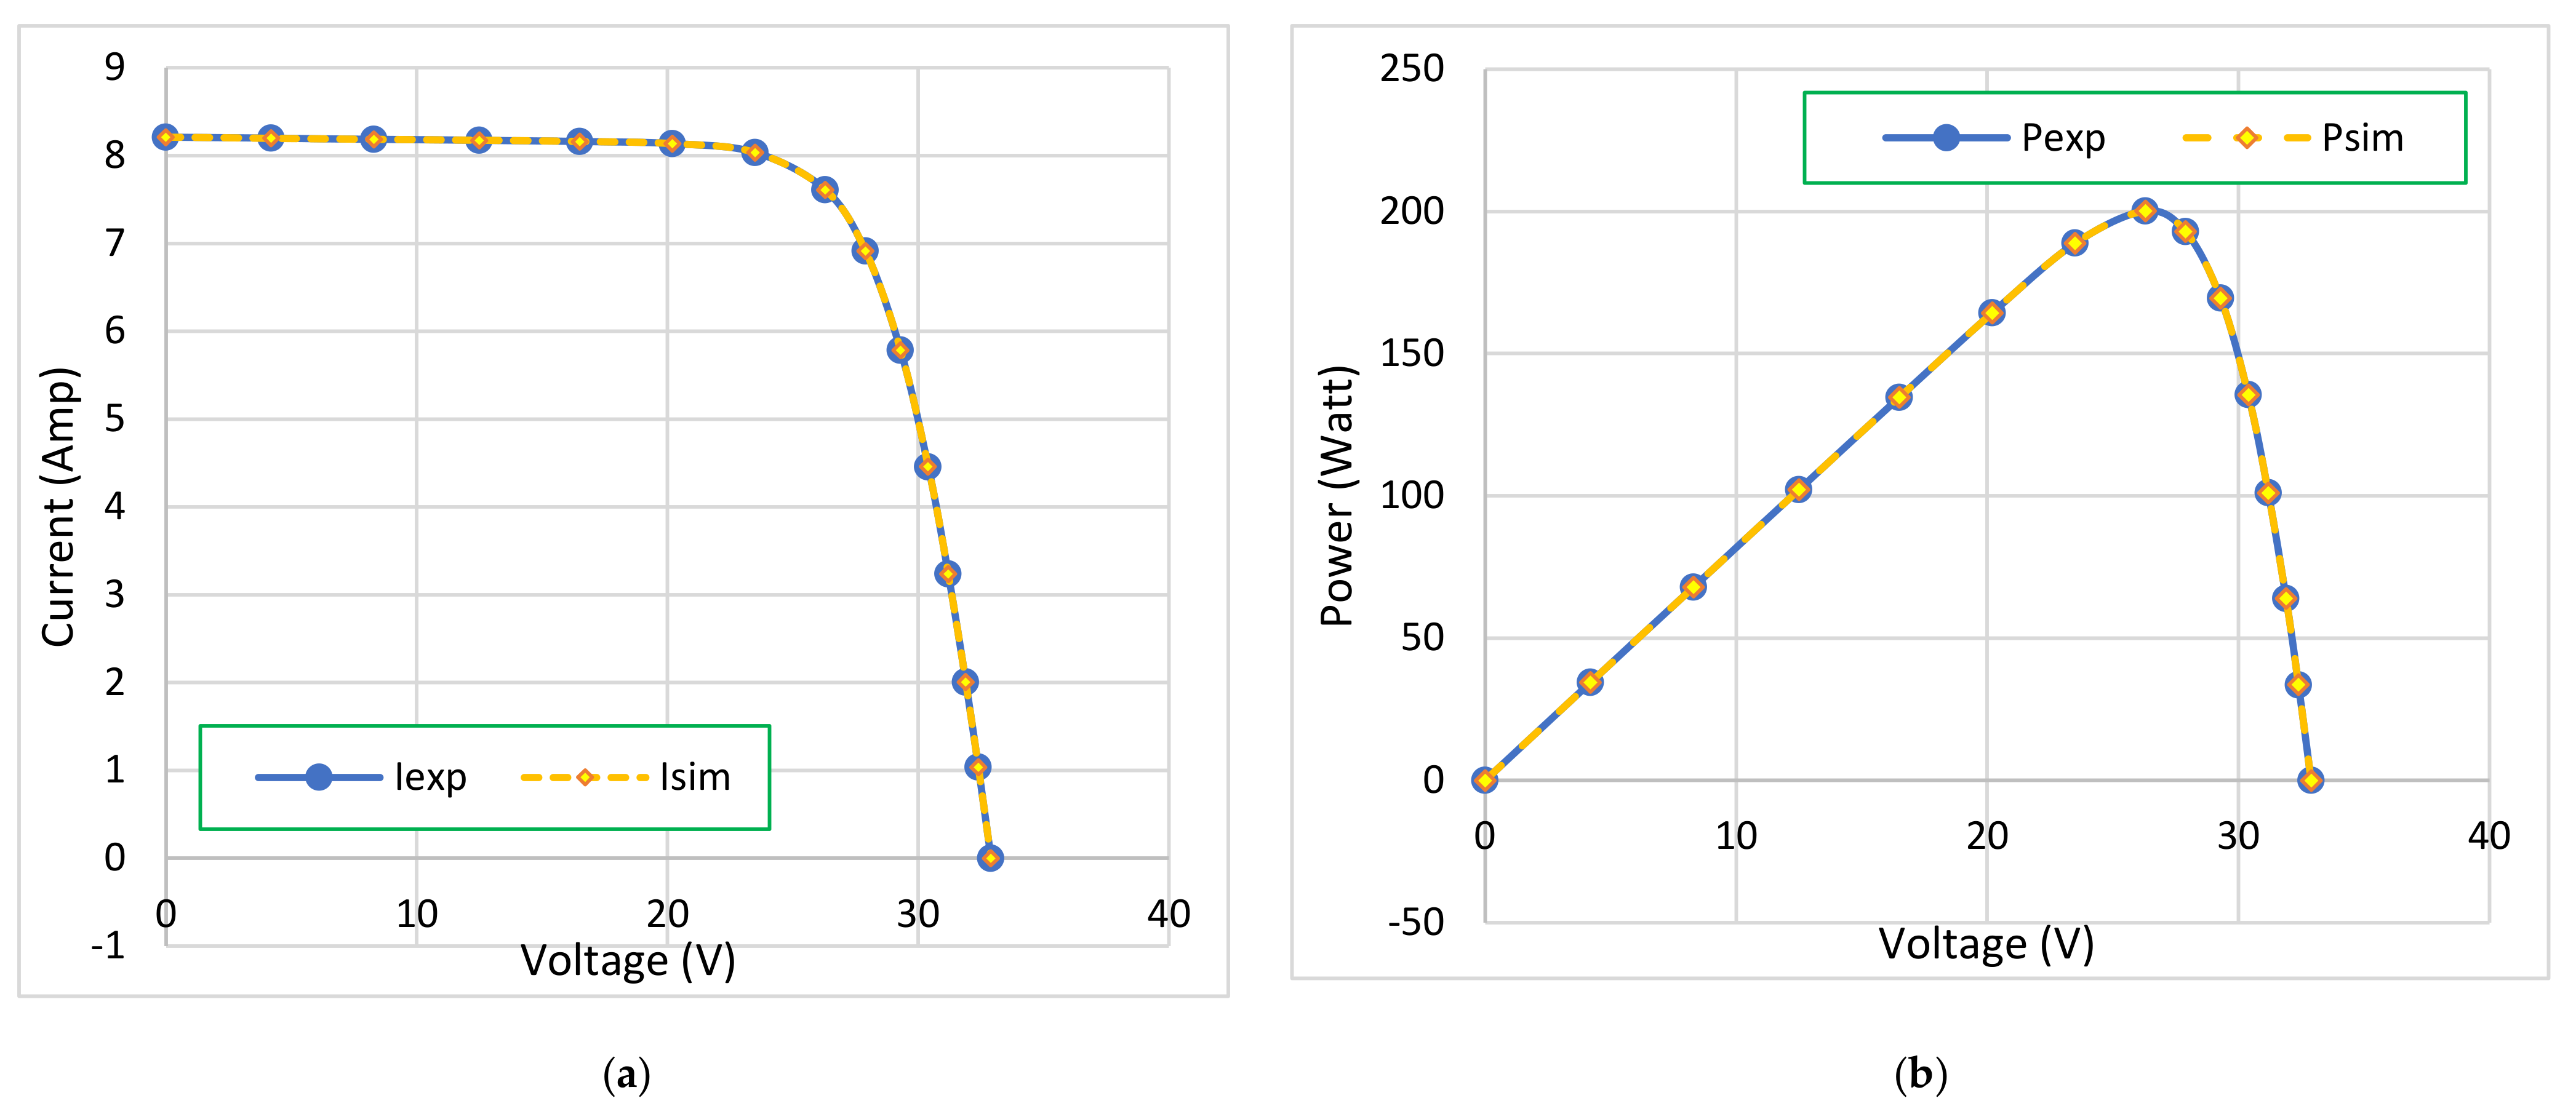
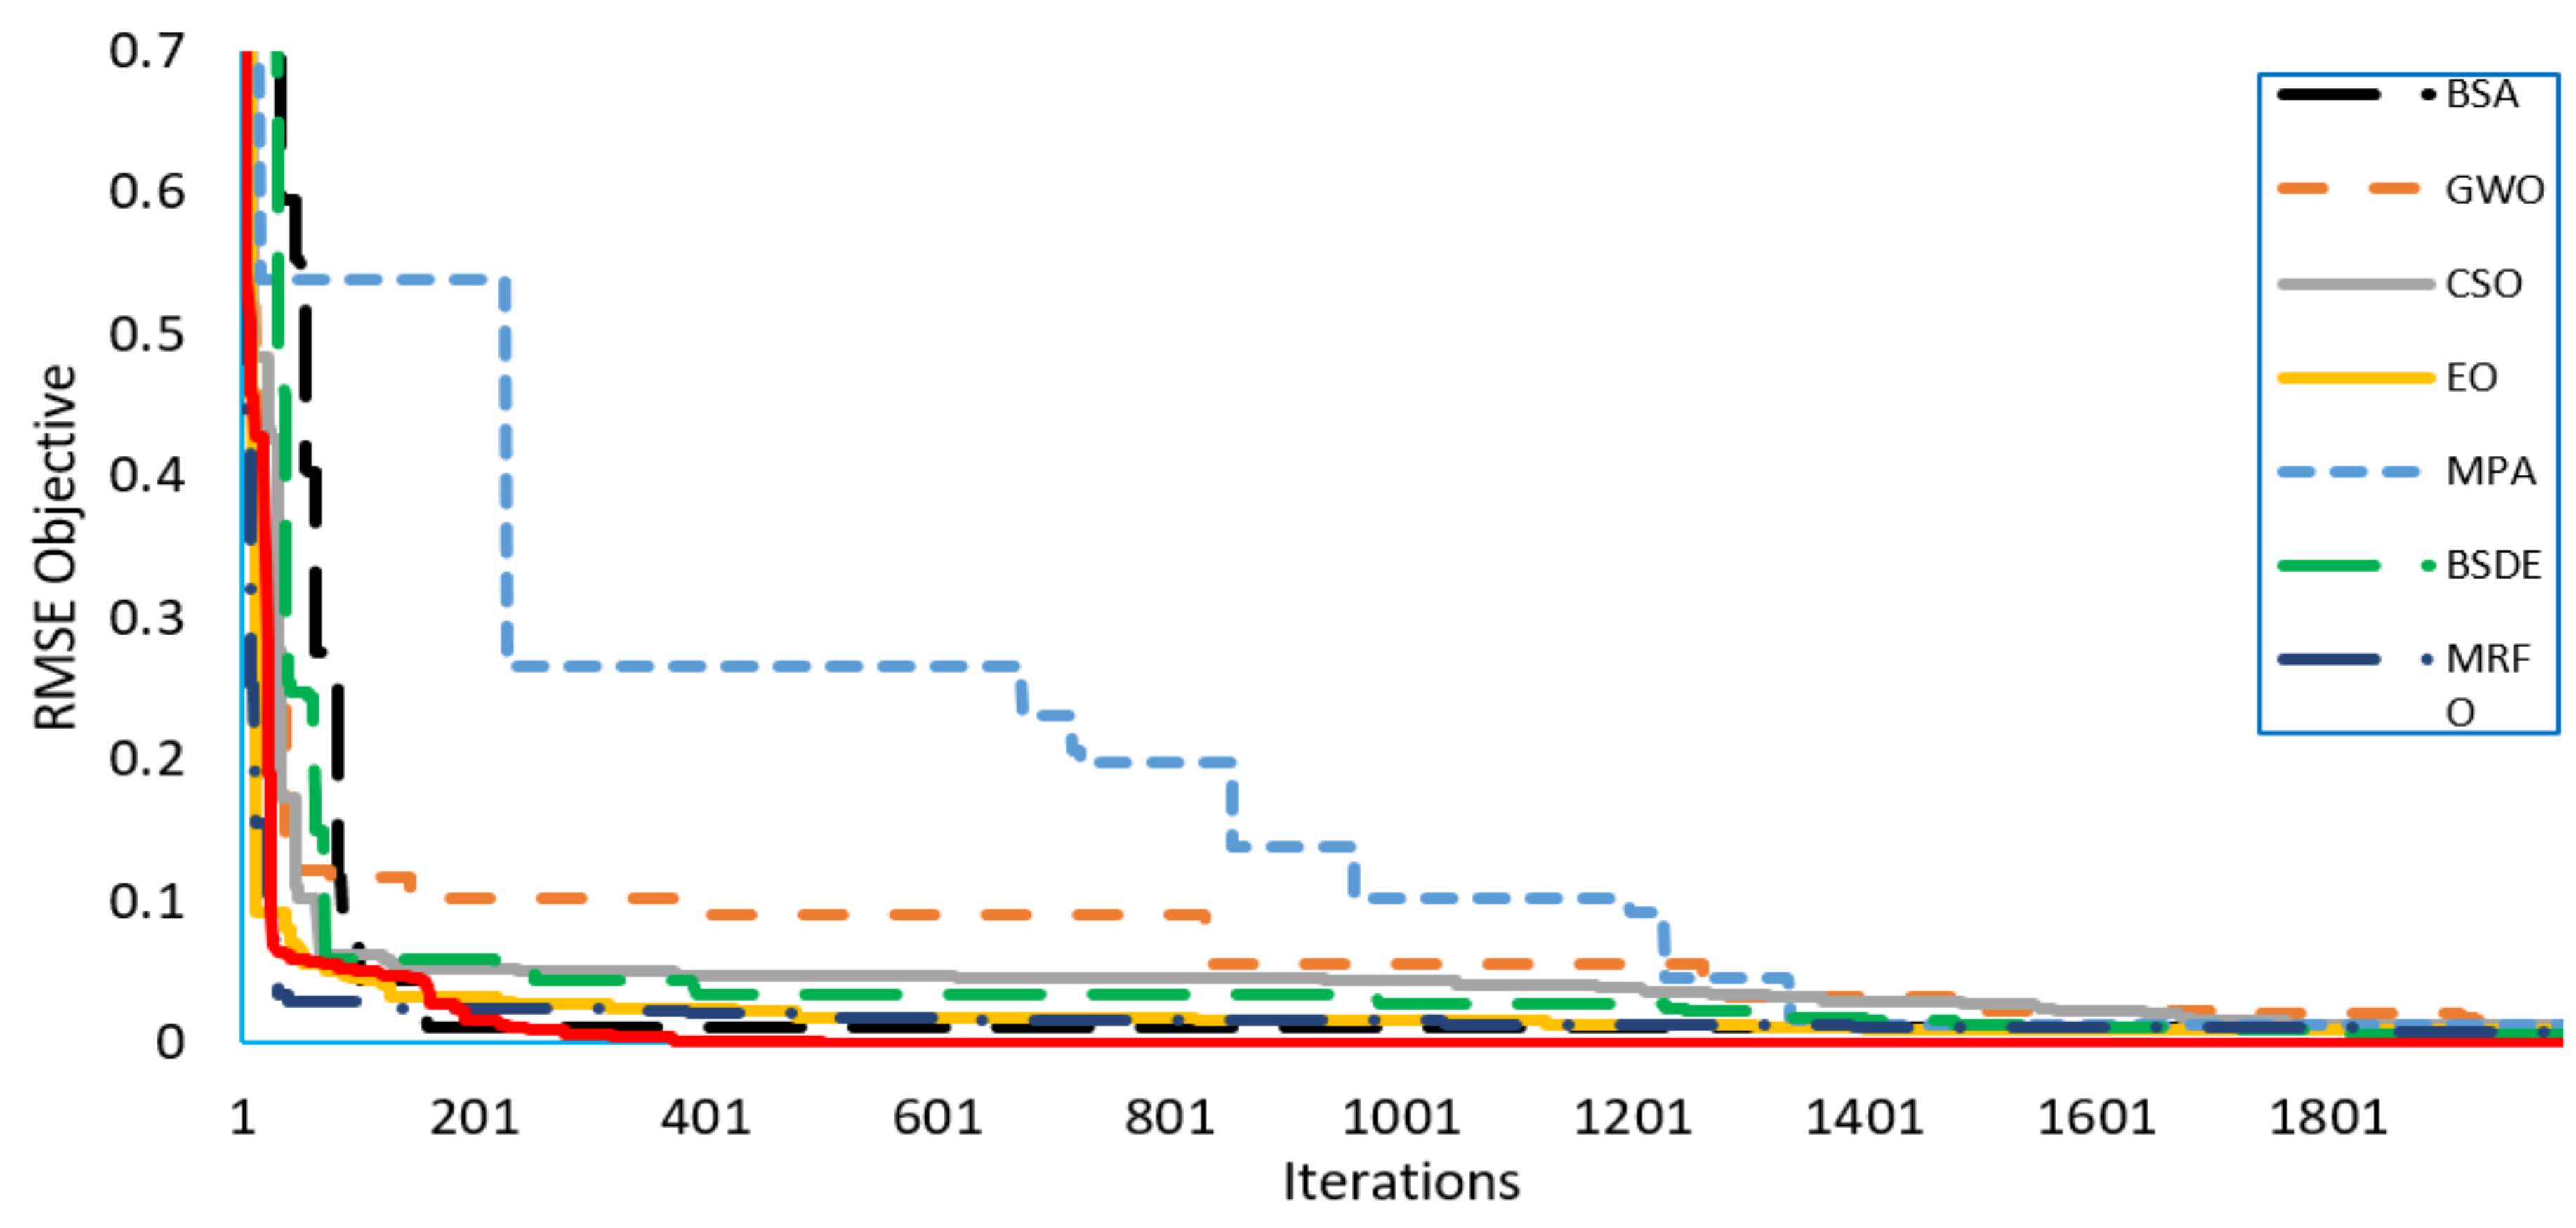

| R.T.C. France Solar Cell [7] | KC200GT Module [7] | |||
|---|---|---|---|---|
| Parameters | Lower Bound | Upper Bound | Lower Bound | Upper Bound |
| 0 | 1 | 0 | 9 | |
| (μA) | 0 | 1 | 0 | 1 |
| 0 | 0.5 | 0 | 0.5 | |
| 0 | 100 | 0 | 100 | |
| 1 | 2 | 1 | 2 | |
| Algorithm | Published Year | Recent Applications |
|---|---|---|
| BSA [47] | 2013 | Reconfiguration in distribution networks (2020) [54], reactive power dispatch (2018) [55], parameter optimization of the support vector machine (2020) [56]. |
| GWO [48] | 2014 | Coordination of VAR compensators and distributed energy resources (2020) [57], allocation of distributed generation in power systems (2020) [58], energy management, and battery size optimization (2020) [59]. |
| CSO [49] | 2016 | Short-term wind speed forecasting (2020) [60], capacitor allocation in distribution networks (2017) [61], emission economic dispatch [62] |
| EO [50] | 2020 | Multi-thresholding image segmentation problems [63], operation of hybrid AC/DC grids (2020) [64]. |
| MPA [51] | 2020 | Large-scale photovoltaic array reconfiguration (2020) [65], task scheduling in IoT-based fog computing applications (2020) [66]. |
| BSDE [52] | 2021 | Not applicable yet. |
| MRFO [53] | 2020 | Fuel cell exergy analysis (2020) [67], optimal power flow (2020) [68], maximum power point (2020) [69]. |
| TFWO [45] | 2021 | Not applicable yet. |
| Algorithm | Iph (A) | Id1 (A) | a1 | Rs (Ω) | Rsh (Ω) | RMSE |
|---|---|---|---|---|---|---|
| TFWO | 0.760775529 | 3.23 × 10⁻⁷ | 1.481183723 | 0.036377085 | 53.71858096 | 0.000986022 |
| MRFO | 0.760778817 | 3.22884 × 10⁻⁷ | 1.481141648 | 0.036380748 | 53.67819867 | 0.000986034 |
| BSDE | 0.760773529 | 3.23008 × 10⁻⁷ | 1.481179386 | 0.036378015 | 53.74364455 | 0.000986023 |
| MPA | 0.760846832 | 3.22991 × 10⁻⁷ | 1.48119268 | 0.036361364 | 52.76698061 | 0.000987369 |
| EO | 0.76077794 | 3.22162 × 10⁻⁷ | 1.480915424 | 0.036387935 | 53.64156933 | 0.000986035 |
| CSO | 0.760757142 | 3.24211 × 10⁻⁷ | 1.481546607 | 0.036366384 | 54.0990705 | 0.000986181 |
| GWO | 0.760695583 | 3.58429 × 10⁻⁷ | 1.491737687 | 0.035974121 | 57.26269608 | 0.001008231 |
| BSA | 0.760850914 | 3.11696 × 10⁻⁷ | 1.477614787 | 0.036510097 | 51.96067738 | 0.000989471 |
| Algorithm | RMSE | |||
|---|---|---|---|---|
| Min. | Max. | Mean | SD | |
| TFWO | 0.00098602 | 0.00098620 | 0.00098603 | 3.353 × 10⁻⁸ |
| MRFO | 0.00098603 | 0.00105788 | 0.00100505 | 2.143 × 10⁻⁵ |
| BSDE | 0.00098602 | 0.00103025 | 0.00099520 | 1.056 × 10⁻⁵ |
| MPA | 0.00098736 | 0.00481175 | 0.00217485 | 0.00065237 |
| EO | 0.00098603 | 0.00105604 | 0.00100209 | 1.783 × 10⁻⁵ |
| CSO | 0.00098618 | 0.00130296 | 0.00105888 | 8.095 × 10⁻⁵ |
| GWO | 0.00100823 | 0.03816637 | 0.00637283 | 0.0112567 |
| BSA | 0.000989471 | 0.001161862 | 0.001037488 | 4.42885 × 10⁻⁵ |
| Algorithm | Iph (A) | Rs (Ω) | Rsh (Ω) | RMSE | Id1 (A) | a1 | Id2 (A) | a2 |
|---|---|---|---|---|---|---|---|---|
| TFWO | 0.760782016 | 0.036839463 | 55.91920478 | 0.000982723 | 2.06 × 10⁻⁷ | 1.443289469 | 9.24 × 10⁻⁷ | 2 |
| MRFO | 0.760743575 | 0.036597626 | 54.95169271 | 0.000983378 | 4.37429 × 10⁻⁷ | 1.998364786 | 2.62887 × 10⁻⁷ | 1.463671024 |
| BSDE | 0.760782257 | 0.036991096 | 54.62889674 | 0.000989247 | 1.38431 × 10⁻⁷ | 1.416972632 | 5.71114 × 10⁻⁷ | 1.764756216 |
| MPA | 0.760918727 | 0.037865706 | 53.18011281 | 0.001026823 | 7.66125 × 10⁻⁸ | 1.36857525 | 9.99997 × 10⁻⁷ | 1.815337209 |
| EO | 0.760741801 | 0.036329661 | 54.62831228 | 0.000986861 | 3.06281 × 10⁻⁷ | 1.492418793 | 2.85646 × 10⁻⁸ | 1.428995768 |
| CSO | 0.760756875 | 0.03652498 | 54.63222775 | 0.000983888 | 3.22867 × 10⁻⁷ | 1.992580518 | 2.7755× 10⁻⁷ | 1.46831668 |
| GWO | 0.760583028 | 0.036533827 | 58.81767959 | 0.001003603 | 3.2814 × 10⁻⁷ | 1.563347542 | 8.25411× 10⁻⁸ | 1.41082037 |
| BSA | 0.760980002 | 0.036723119 | 53.23192348 | 0.000993668 | 2.64414 × 10⁻⁷ | 1.705891588 | 1.99393 × 10⁻⁷ | 1.446025602 |
| Algorithm | RMSE | |||
|---|---|---|---|---|
| Min. | Max. | Mean | SD | |
| TFWO | 0.000982723 | 0.0012 | 0.00099392 | 3.9352 × 10⁻⁵ |
| MRFO | 0.000983378 | 0.001353061 | 0.001077661 | 8.45223 × 10⁻⁵ |
| BSDE | 0.000989247 | 0.001492072 | 0.001113348 | 0.000112212 |
| MPA | 0.001026823 | 0.002869201 | 0.001779704 | 0.000616954 |
| EO | 0.000986861 | 0.001256857 | 0.001033158 | 6.33746 × 10⁻⁵ |
| CSO | 0.000983888 | 0.001428127 | 0.00113901 | 0.000155378 |
| GWO | 0.001003603 | 0.038150899 | 0.00640054 | 0.011254562 |
| BSA | 0.000993668 | 0.001214824 | 0.001080621 | 5.45125 × 10⁻⁵ |
| Algorithm | BSA | GWO | CSO | EO | MPA | BSDE | MRFO | TFWO |
|---|---|---|---|---|---|---|---|---|
| Iph (A) | 0.76088788 | 0.761840018 | 0.760767839 | 0.760733925 | 0.760665312 | 0.76060128 | 0.760721516 | 0.7608 |
| Is1 (A) | 6.11525 × 10⁻⁸ | 6.26386 × 10⁻⁷ | 8.65078 × 10⁻⁷ | 2.29078 × 10⁻⁷ | 2.60174 × 10⁻¹⁵ | 1.33125 × 10⁻⁷ | 2.6918 × 10⁻⁷ | 0 |
| a1 | 1.665282347 | 1.972178035 | 1.992247826 | 1.945636832 | 1.025249938 | 1.715044852 | 1.880941278 | 1 |
| Rs (Ω) | 0.036740001 | 0.036238306 | 0.036859716 | 0.036427424 | 0.037130986 | 0.036693181 | 0.036566016 | 0.0367 |
| Rsh (Ω) | 53.18712346 | 43.25339883 | 54.98736983 | 55.52914763 | 59.57973022 | 60.17938354 | 55.20751535 | 55.2261 |
| Is2 (A) | 8.13561 × 10⁻⁸ | 7.69448 × 10⁻⁹ | 4.64418 × 10⁻¹¹ | 9.51489 × 10⁻⁸ | 6.85783 × 10⁻⁷ | 2.119 × 10⁻⁷ | 7.27156 × 10⁻⁸ | 2.39243 × 10⁻⁷ |
| a2 | 1.951596911 | 1.982906016 | 1.583874031 | 1.981076476 | 1.670531807 | 1.449412901 | 1.755268871 | 1.4558 |
| Is3 (A) | 2.62168 × 10⁻⁷ | 2.41707 × 10⁻⁷ | 2.06159× 10⁻⁷ | 2.78562 × 10⁻⁷ | 4.54209 × 10⁻⁸ | 4.27168 × 10⁻⁷ | 2.41083 × 10⁻⁷ | 6.38605 × 10⁻⁷ |
| a3 | 1.464894557 | 1.457809556 | 1.443266003 | 1.469223538 | 1.348012837 | 1.942277098 | 1.458171437 | 2 |
| RMSE | 0.001002321 | 0.001293402 | 0.000984242 | 0.000985451 | 0.001002377 | 0.001029117 | 0.000984843 | 0.000983646 |
| Algorithm | RMSE | |||
|---|---|---|---|---|
| Min. | Max. | Mean | SD | |
| TFWO | 0.000983646 | 0.00102314 | 0.000987683 | 7.32713 × 10⁻⁶ |
| MRFO | 0.000984843 | 0.001492643 | 0.001164256 | 0.000129441 |
| BSDE | 0.001029117 | 0.002051955 | 0.001320873 | 0.000243075 |
| MPA | 0.001002377 | 0.005305369 | 0.002200116 | 0.000900812 |
| EO | 0.000985451 | 0.001393105 | 0.001131243 | 0.00011292 |
| CSO | 0.000984242 | 0.00191729 | 0.001164341 | 0.000184491 |
| GWO | 0.001293402 | 0.033393772 | 0.006435657 | 0.01033541 |
| BSA | 0.001002321 | 0.001567976 | 0.001189651 | 0.000119982 |
| Algorithm | Iph (A) | Is1 (A) | a1 | Rs (Ω) | Rsh (Ω) | RMSE |
|---|---|---|---|---|---|---|
| TFWO | 8.216747428 | 2.62486 × 10⁻⁸ | 1.212957711 | 0.004825464 | 6.284632281 | 0.000636657 |
| MRFO | 8.212405132 | 3.36662 × 10⁻⁸ | 1.228520397 | 0.004754881 | 7.037075568 | 0.003374264 |
| BSDE | 8.210553583 | 3.43101 × 10⁻⁸ | 1.229705769 | 0.004756865 | 7.555908952 | 0.003467884 |
| MPA | 8.184927 | 7.94459 × 10⁻⁸ | 1.285180059 | 0.004537611 | 92.14823504 | 0.0148696 |
| EO | 8.209152899 | 2.85259 × 10⁻⁸ | 1.218067754 | 0.004814539 | 7.714703106 | 0.002888472 |
| CSO | 8.188955905 | 8.18358 × 10⁻⁸ | 1.287282057 | 0.004540479 | 87.91105559 | 0.015480743 |
| GWO | 8.193721562 | 1.72203 × 10⁻⁷ | 1.341187392 | 0.004264421 | 84.34172349 | 0.023476598 |
| BSA | 8.187828492 | 4.39672 × 10⁻⁸ | 1.245523356 | 0.004706406 | 17.16016059 | 0.009775873 |
| Algorithm | Iph (A) | Rs (Ω) | Rsh (Ω) | Is1 (A) | a1 | Is2 (A) | a2 | RMSE |
|---|---|---|---|---|---|---|---|---|
| TFWO | 8.215931265 | 0.00490447 | 6.55275986 | 9.75 × 10⁻¹¹ | 1 | 4.58 × 10⁻⁸ | 1.266697565 | 0.000464919 |
| MRFO | 8.207554293 | 0.004729 | 7.962198358 | 1.30925 × 10⁻⁷ | 1.956231371 | 3.89385 × 10⁻⁸ | 1.237993335 | 0.008229492 |
| BSDE | 8.199742079 | 0.004618981 | 11.00371597 | 1.70333 × 10⁻⁷ | 1.898851719 | 5.22564 × 10⁻⁸ | 1.257319714 | 0.009849963 |
| MPA | 8.184775806 | 0.005037849 | 96.10264033 | 8.62345 × 10⁻⁷ | 1.581206361 | 4.01866 × 10⁻¹⁰ | 1.017081239 | 0.01025436 |
| EO | 8.210884382 | 0.004777302 | 7.422135219 | 9.02611 × 10⁻⁹ | 1.822712307 | 3.13628 × 10⁻⁸ | 1.224039636 | 0.002599915 |
| CSO | 8.204148086 | 0.004890878 | 9.331329018 | 7.23319 × 10⁻⁸ | 1.304927843 | 1.27128 × 10⁻¹⁰ | 1.000421712 | 0.004212996 |
| GWO | 8.188942442 | 0.004865207 | 20.87443954 | 7.54227 × 10⁻⁷ | 1.765240036 | 1.56333 × 10⁻⁸ | 1.185224915 | 0.009625309 |
| BSA | 8.204090314 | 0.004601853 | 10.29800978 | 5.53 × 10⁻⁸ | 1.260653585 | 3.03837 × 10⁻⁸ | 1.998785758 | 0.009625725 |
| Algorithm | BSA | GWO | CSO | MPA | EO | BSDE | MRFO | TFWO |
|---|---|---|---|---|---|---|---|---|
| Iph (A) | 8.20173508 | 8.194693695 | 8.181855948 | 8.17852875 | 8.197397535 | 8.202679685 | 8.196629725 | 8.216333065 |
| Is1 (A) | 0.004614443 | 0.004525605 | 0.004692599 | 0.004752779 | 0.004683395 | 0.004733114 | 0.004684349 | 0.004855332 |
| a1 | 13.66542752 | 23.11163887 | 99.9201098 | 99.98707579 | 14.01948329 | 9.497022092 | 11.43921825 | 6.406246831 |
| Rs (Ω) | 3.75184 × 10⁻⁸ | 8.7 × 10⁻⁹ | 9.49405 × 10⁻⁸ | 2.87148 × 10⁻⁷ | 3.86696 × 10⁻⁸ | 2.40491× 10⁻⁷ | 3.43285 × 10⁻⁷ | 1.65 × 10⁻¹⁴ |
| Rsh (Ω) | 1.238796687 | 1.590792134 | 1.481550006 | 1.983137731 | 1.238348021 | 1.797831823 | 1.89039067 | 1.00002872 |
| Is2 (A) | 1.6158 × 10⁻⁷ | 6.62556 × 10⁻⁹ | 1.99524 × 10⁻⁸ | 3.79051 × 10⁻⁸ | 7.61616 × 10⁻⁷ | 3.2756 × 10⁻⁸ | 3.85165 × 10⁻⁸ | 2.04 × 10⁻⁹ |
| a2 | 1.775790984 | 1.295053844 | 1.213009208 | 1.236293271 | 1.991605757 | 1.228057245 | 1.238261076 | 1.11890891 |
| Is3 (A) | 4.33175 × 10⁻⁷ | 7.22637 × 10⁻⁸ | 1.60734 × 10⁻⁸ | 1.20422 × 10⁻⁷ | 2.11766 × 10⁻⁷ | 1.75316 × 10⁻⁷ | 7.55869 × 10⁻⁸ | 3.78866 × 10⁻⁸ |
| a3 | 1.743389601 | 1.284146864 | 1.310004248 | 1.967323029 | 1.958780659 | 1.917122756 | 1.748171665 | 1.270101351 |
| RMSE | 0.011035788 | 0.013924443 | 0.013060563 | 0.013504282 | 0.008423459 | 0.006771142 | 0.008878327 | 0.000379678 |
| Model | Algorithm | RMSE | |||
|---|---|---|---|---|---|
| Min. | Max. | Mean | SD | ||
| SDM | TFWO | 0.000636657 | 0.000776307 | 0.000643757 | 2.76367 × 10⁻⁵ |
| MRFO | 0.003374264 | 0.015283988 | 0.01143509 | 0.003320893 | |
| BSDE | 0.003467884 | 0.014320685 | 0.010188693 | 0.002289554 | |
| MPA | 0.0148696 | 0.048448767 | 0.039118106 | 0.010156791 | |
| EO | 0.002888472 | 0.01320854 | 0.009771334 | 0.002376063 | |
| CSO | 0.015480743 | 0.023739498 | 0.019620651 | 0.002077078 | |
| GWO | 0.023476598 | 0.468609138 | 0.164042826 | 0.180451636 | |
| BSA | 0.009775873 | 0.020577736 | 0.015024514 | 0.002330391 | |
| DDM | TFWO | 0.000464919 | 0.003991719 | 0.000784157 | 0.000677807 |
| MRFO | 0.008229492 | 0.017508428 | 0.013106997 | 0.002099435 | |
| BSDE | 0.009849963 | 0.029252608 | 0.016694172 | 0.004448939 | |
| MPA | 0.01025436 | 0.049871846 | 0.035790405 | 0.012557606 | |
| EO | 0.002599915 | 0.013710246 | 0.009972209 | 0.002673846 | |
| CSO | 0.004212996 | 0.025007328 | 0.017745851 | 0.004339108 | |
| GWO | 0.009625309 | 0.467884375 | 0.149515185 | 0.179605814 | |
| BSA | 0.009625725 | 0.026600837 | 0.017425267 | 0.003984149 | |
| TDM | TFWO | 0.000379678 | 0.026665602 | 0.001706197 | 0.004771068 |
| MRFO | 0.008878327 | 0.023401173 | 0.014709966 | 0.003787592 | |
| BSDE | 0.006771142 | 0.032728388 | 0.019233922 | 0.006086967 | |
| MPA | 0.013504282 | 0.051722136 | 0.039748254 | 0.012810733 | |
| EO | 0.008423459 | 0.015285328 | 0.011790041 | 0.001841909 | |
| CSO | 0.013060563 | 0.025146228 | 0.017635053 | 0.003334599 | |
| GWO | 0.013924443 | 0.4172306 | 0.226455866 | 0.174785582 | |
| BSA | 0.011035788 | 0.026603176 | 0.018267773 | 0.00416284 | |
Publisher’s Note: MDPI stays neutral with regard to jurisdictional claims in published maps and institutional affiliations. |
© 2021 by the authors. Licensee MDPI, Basel, Switzerland. This article is an open access article distributed under the terms and conditions of the Creative Commons Attribution (CC BY) license (https://creativecommons.org/licenses/by/4.0/).
Share and Cite
Said, M.; Shaheen, A.M.; Ginidi, A.R.; El-Sehiemy, R.A.; Mahmoud, K.; Lehtonen, M.; Darwish, M.M.F. Estimating Parameters of Photovoltaic Models Using Accurate Turbulent Flow of Water Optimizer. Processes 2021, 9, 627. https://doi.org/10.3390/pr9040627
Said M, Shaheen AM, Ginidi AR, El-Sehiemy RA, Mahmoud K, Lehtonen M, Darwish MMF. Estimating Parameters of Photovoltaic Models Using Accurate Turbulent Flow of Water Optimizer. Processes. 2021; 9(4):627. https://doi.org/10.3390/pr9040627
Chicago/Turabian StyleSaid, Mokhtar, Abdullah M. Shaheen, Ahmed R. Ginidi, Ragab A. El-Sehiemy, Karar Mahmoud, Matti Lehtonen, and Mohamed M. F. Darwish. 2021. "Estimating Parameters of Photovoltaic Models Using Accurate Turbulent Flow of Water Optimizer" Processes 9, no. 4: 627. https://doi.org/10.3390/pr9040627
APA StyleSaid, M., Shaheen, A. M., Ginidi, A. R., El-Sehiemy, R. A., Mahmoud, K., Lehtonen, M., & Darwish, M. M. F. (2021). Estimating Parameters of Photovoltaic Models Using Accurate Turbulent Flow of Water Optimizer. Processes, 9(4), 627. https://doi.org/10.3390/pr9040627


