1. Introduction
Condition-based maintenance techniques are the main predictive maintenance procedures that are widely employed by electrical utilities. They rely on the on-line monitoring, either periodic or continuous, of in-service electrical equipment in order to schedule proper maintenance plans based on the actual condition of the asset. They have competitive advantages such as minimizing the maintenance cost of labor and spare parts, preventing unanticipated failures, extending the lifetime of the asset, and increasing the reliability of the electrical grids. Condition monitoring usually necessitates nondestructive techniques such as vibrational analysis, acoustic techniques, optical techniques, and so on.
Power transformers are considered one of the most vital and expensive assets in electrical grids. Oil-filled power transformers contain an insulation system that consists of dielectric insulation paper and transformer oil, typically mineral oil. The aging of power transformers in the field depends mainly on the loading conditions [
1,
2,
3]. Under the normal operation of power transformers, they are exposed to thermal stresses. These stresses mainly originate from copper losses from the windings or iron losses from the core. The thermal stresses accelerate the oxidation processes in transformer oil, causing the decomposition of the oil to and the formation of aging byproducts (ABP) such as moisture, dissolved gasses, acids, and sludge. These ABP have various adverse effects on transformer oil properties including physical, chemical, and electrical properties [
4,
5]. Physical properties mainly include interfacial tension, flash point, and viscosity. The interfacial tension is reduced with aging due to the generation of polar contaminants [
6]. Also, the flashpoint is reduced due to the composition of volatile combustible products in the oil [
7,
8]. However, the viscosity is approximately kept unchanged during aging [
7]. Chemical properties include acidity and water content. Both properties increase with aging due to the oxidation process in oil [
4]. For electrical properties, the dielectric strength and resistivity decrease [
4,
8], while the dielectric dissipation factor increases [
8,
9]. Most of these properties go beyond their acceptable limits due to thermal aging. Therefore, assessing the condition of transformer oil is vital. In particular, the condition of the oil indicates the oil quality in addition to the condition of the transformer.
Condition monitoring of transformers is generally concerned with assessing the aging and deterioration of their components, especially the degradation and contamination of the internal insulation system. Traditional condition monitoring of transformer oil includes oil tests that are carried out to evaluate some properties of transformer oil to identify the extent of aging in transformers [
10,
11,
12]. However, these tests demand expensive equipment, expertise for sampling and testing, and sophisticated procedures. Dissolved gas analysis (DGA) was proposed as a widely used technique for the condition monitoring of transformers. It depends on measuring the concentrations of dissolved gases produced in transformer oil and correlating those concentrations to different incipient faults. DGA has been used successfully in fault diagnosis [
13,
14,
15,
16,
17,
18]. However, it cannot assess the aging condition of transformer oil.
As an alternative, optical spectroscopy techniques were proposed for assessing the condition of transformer oil [
19,
20,
21]. They are nondestructive techniques that can be applied online. Ultraviolet-visible (UV-Vis) is nowadays considered for the condition assessment of transformer oil. UV-Vis spectroscopy has exhibited a correlation with some chemical and physical properties [
22,
23] in addition to some dielectric properties of transformer oil [
24]. Fourier transform infrared (FTIR) spectroscopy is another optical absorption spectroscopy technique that has shown a correlation between some absorption bands and aging byproducts produced due to the aging process of transformer oil [
25,
26]. To apply these techniques, limited experience is needed and simple procedures are conducted. It should be mentioned that although the UV-Vis absorption spectroscopy technique has been applied with transformer oil, the information obtained from such technique does not reflect the molecular structure of the oil. Besides, the technique itself is costly and difficult to implement as an online sensor. In addition, UV-Vis spectroscopy is not highly sensitive to fluorescent species that can arise under the thermal aging of oil.
Accordingly, in this paper, we propose to use photoluminescence (PL) spectroscopy for the effective condition assessment of insulating oil in power transformers. The PL technique is widely used in solid-state spectroscopy measurements [
27] and is well known for its technical simplicity and ability to provide a fast single-shot spectrum on-site [
28]. It also provides rich information on the optical transitions among thermalized energy states. Apart from the technical simplicity and lower cost of PL spectroscopy compared to UV-Vis absorption spectroscopy, the PL technique involves emission processes that only occur between a narrow band of electronic states that are occupied by thermalized electrons. Consequently, the PL measurements yield a spectrum that is much narrower and more sensitive than that of the absorption spectrum [
29]. This is because the UV-Vis absorption technique involves all electronic states of the investigated material. Thus, UV-Vis spectroscopy typically yields a broad spectrum. Consequently, UV-Vis spectroscopy cannot, for example, precisely reflect the electronic structure of aged oil samples. In addition, PL spectroscopy measurements can be implemented as an online sensor [
30], adding further advantage for this technique in the online condition monitoring of oil degradation. However, it should be mentioned that the PL technique may not be the best choice for systems with low molecular weight constituents that are unlikely to fluoresce.
Table 1 compares PL spectroscopy, UV-Vis absorption spectroscopy, and traditional tests such as breakdown test and DGA.
To the best of our knowledge, this is the first time the simple and less costly PL spectroscopy has been used for insulating oil assessment. Here, first, the aging process of oil samples was performed using a laboratory-based accelerated aging test. Different aging extents were considered up to 30 days, which is equivalent to 30 years of in-service operation. Then, these aged samples were tested using PL spectroscopy, and the corresponding features were extracted. Moreover, the aged samples were tested for the dielectric dissipation factor. The correlation between PL spectra and dielectric dissipation factor was obtained and compared to that of UV-Vis spectroscopy for the same samples. Finally, the physical mechanisms behind the obtained results were discussed.
2. Experimental Procedures
In this section, the experimental procedures are introduced, including accelerated aging tests, optical spectroscopy tests, and dielectric measurements.
2.1. Preparation of Accelerated Aged Oil Samples
Investigation of the influence of aging and the condition assessment of transformer oil requires the preparation of aged oil samples with different aging durations. An accelerated aging procedure was carried out on commercial transformer oil in the laboratory to simulate the aging of transformer oil during the operation in the field. The specifications of mineral transformer oil used in this study are stated in
Table 2 according to the supplier datasheet. Fresh transformer oil was poured into bottles to be prepared for the accelerated aging test. Then, the accelerated aging procedure was conducted under semi-sealed conditions as follows:
- (1)
Fresh oil sample was preconditioned in a vacuum oven at a temperature of 45 °C and under pressure below 0.1 bar for 2 h.
- (2)
The oil sample was taken out from the vacuum oven and then closed and wrapped.
- (3)
The oil sample was aged under semi-sealed conditions inside a heating oven at a temperature of 120 °C for a specific duration before gradual cooling to room temperature.
- (4)
Aged oil samples were taken out from the heating oven and tested using different techniques.
Aged transformer oil samples were prepared with different aging durations ranging from 3 days to 30 days. The accelerated aging test is conducted consistently with the half-life rule of thumb [
4]. It states that the aging rate of transformer oil is doubled as the operating temperature increases by 7 °C. The base operating temperature of the transformer oil is 60 °C. Consequently, under the aging condition of heating at 120 °C, 1 day of oil aging in the heating oven is equivalent to 380 days (approximately 1 year) of practical oil aging in field transformers, as shown in the following equations:
The accelerated aged oil samples, in addition to the fresh oil sample, are shown in
Figure 1. It is observed that the color of aged samples was initially almost transparent. Then, it became darker as the aging duration increased. Eventually, the color of the severe aging sample was dark brown.
2.2. Optical Spectroscopy Tests
Optical spectroscopy techniques are concerned with the interaction of electromagnetic radiation and materials. They include PL spectroscopy (HORIBA Scientific, Palaiseau, France) and UV-Vis spectroscopy (Shimadzu Scientific Instruments Incorporated, Tokyo, Japan) techniques. In PL spectroscopy, the optical fluorescence of atoms and molecules is measured as a function of wavelength, while UV-Vis spectroscopy measures the optical absorption by atoms and molecules as a function of wavelength. Each atom or molecule has a specific spectral response. Therefore, optical spectroscopy is used to identify the atomic or molecular structure of chemical compounds and quantify the concentration of these compounds as well. In this section, the proposed PL spectroscopy technique is discussed alongside with the UV-Vis technique.
2.2.1. PL Spectroscopy Test
PL spectroscopy or emission spectroscopy corresponds to the radiation emitted from an atom or a molecule due to an electronic transition that occurs from a high energy level to a lower energy level [
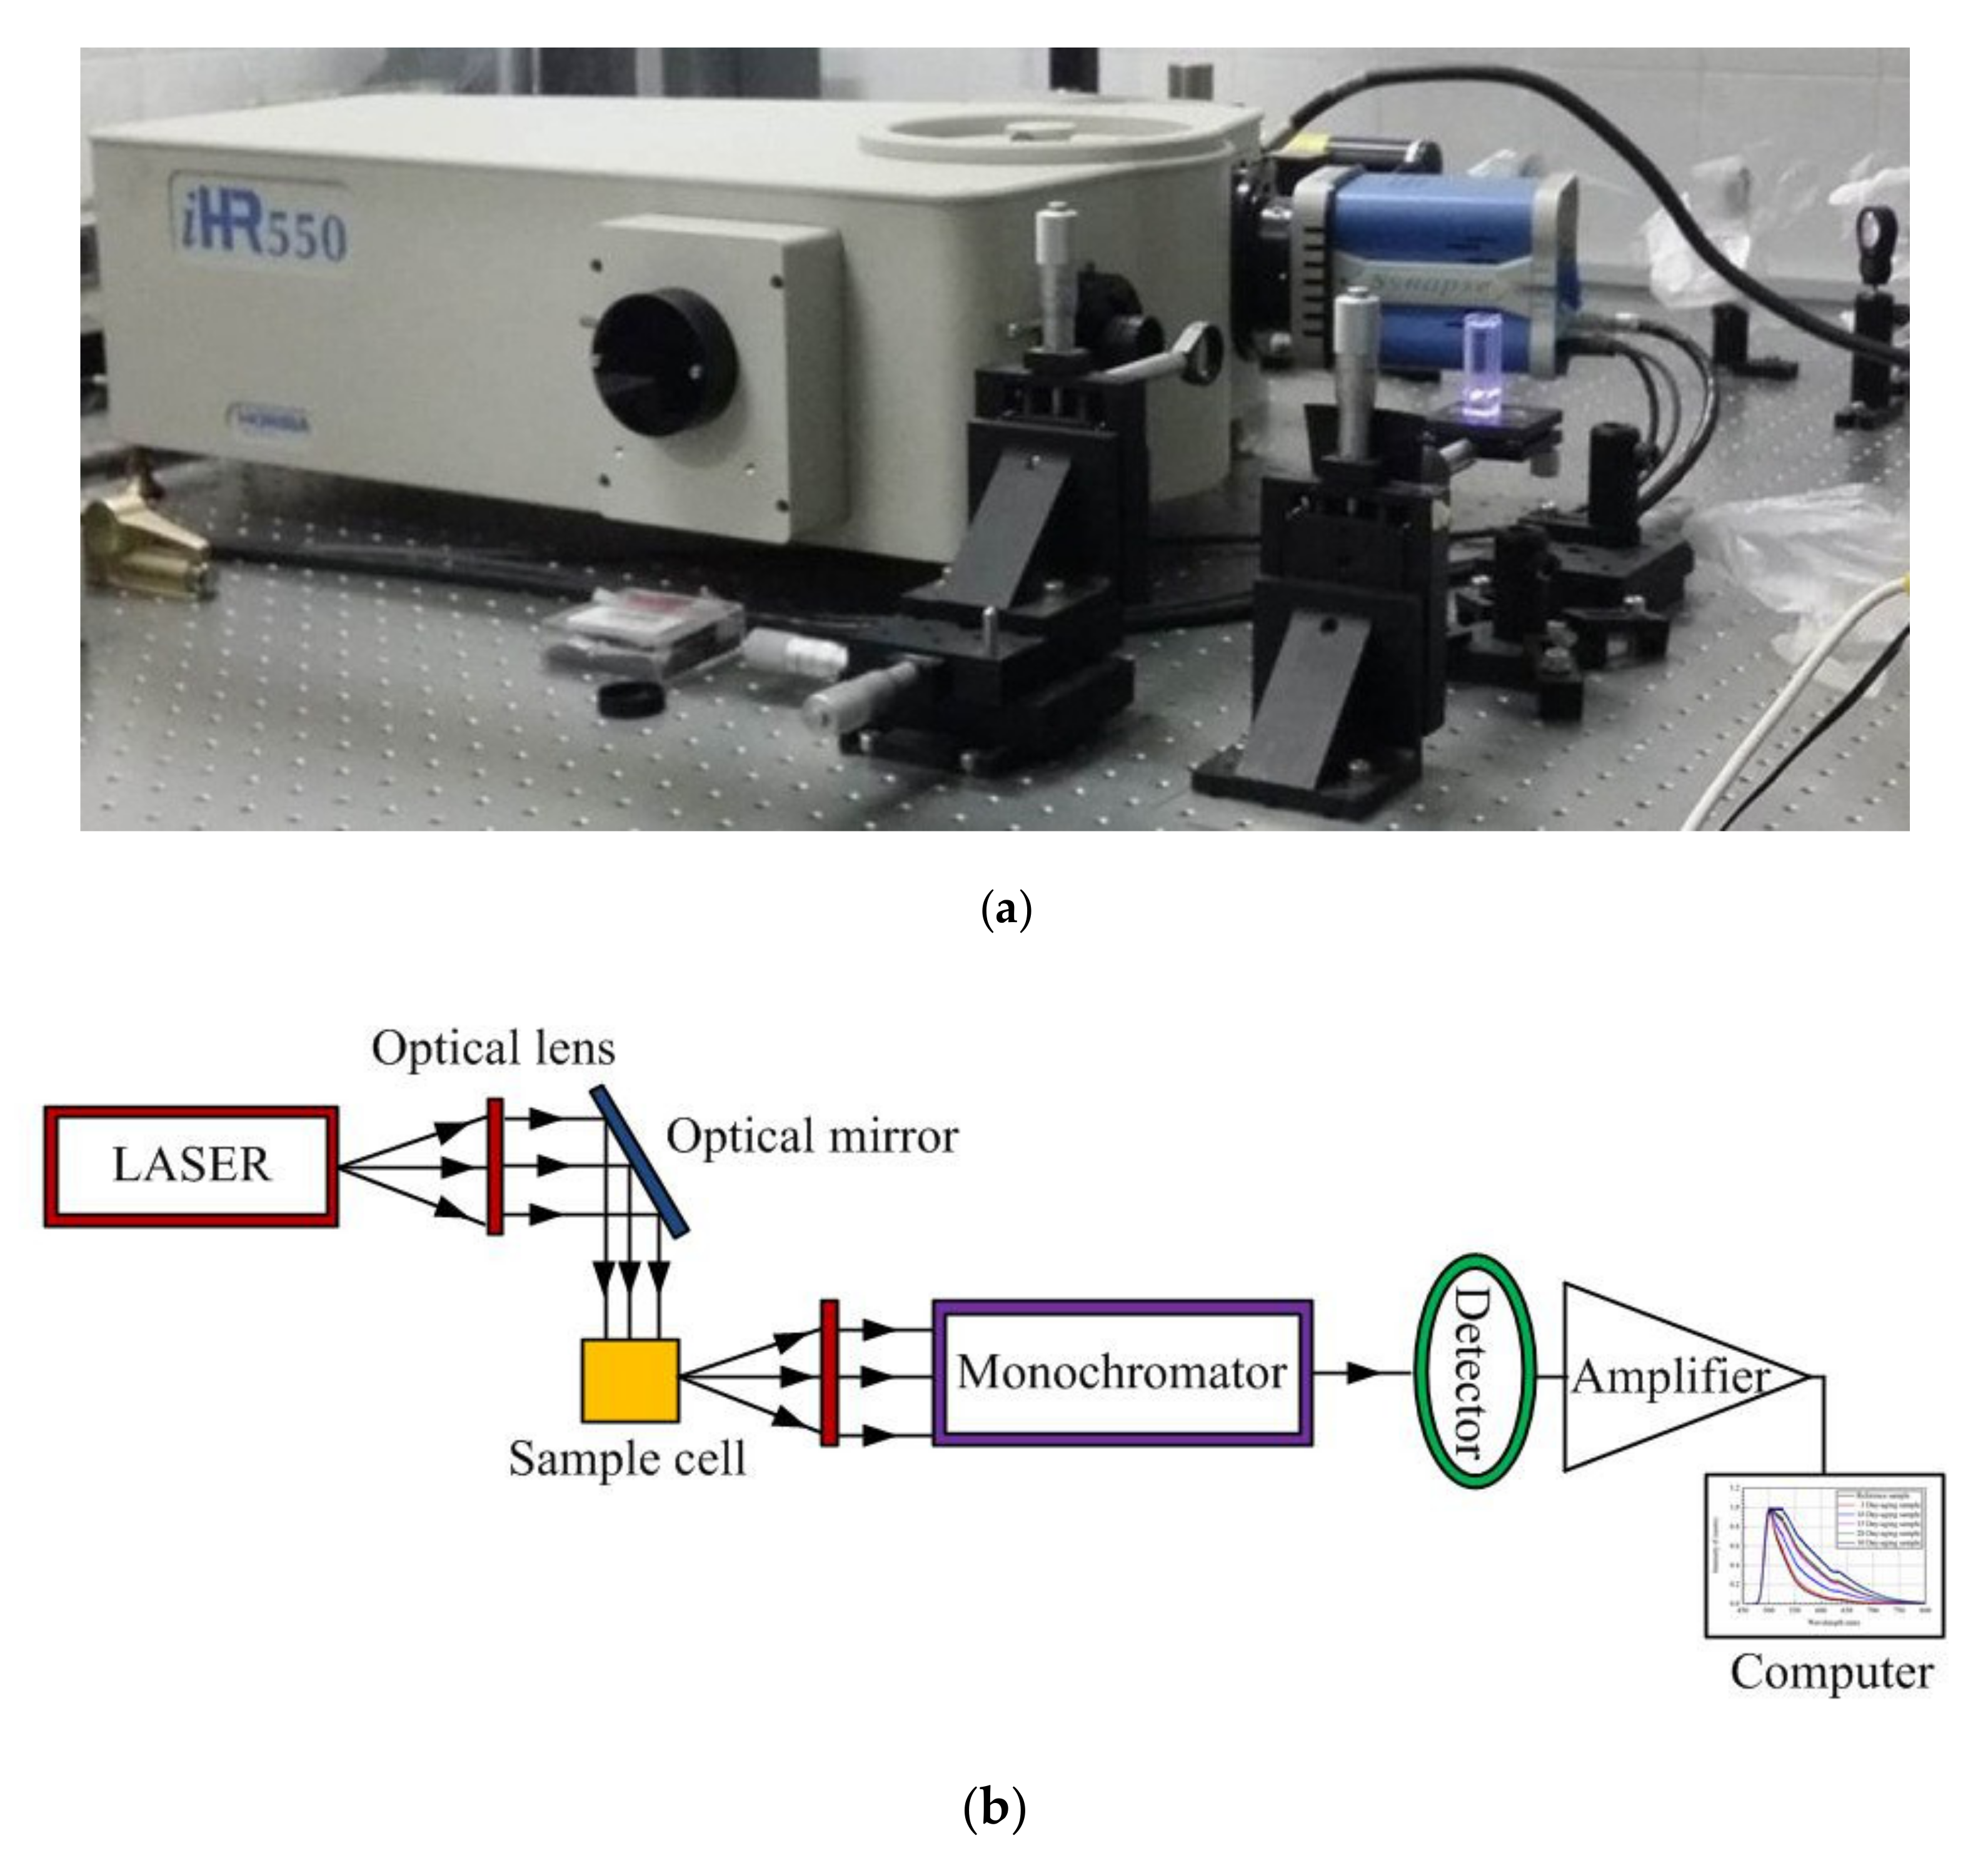
32]. Each atom or molecule has a specific emission spectrum. Therefore, PL spectroscopy can be used to identify the electronic structure of materials. In this study, aged transformer oil samples and a fresh transformer oil sample were tested using a PL spectrometer, with the setup shown in
Figure 2a, to obtain their emission spectra. A schematic diagram of the configuration of the PL spectrometer is shown in
Figure 2b. The configuration includes a laser source, optical lenses, a placeholder for the sample container, and a PL spectrometer. Only 1 cuvette is required and is filled with an aged oil sample. The wavelength range of the PL spectrometer is from 150 nm to 1500 nm. The PL spectra were obtained as follows. The laser source launched a laser beam toward the optical mirror that directed the beam to the sample. When the laser beam hit the sample, some electrons were excited to higher energy levels. Then, these electrons returned to their ground energy level emitting radiation, which was detected by the PL spectrometer at specific wavelengths that reflected the energy difference between the energy levels. The PL spectrometer was used to separate the emitted light into its component wavelengths, and then to record the emission spectra intensity of the sample as a function of wavelength.
The emission spectra reflect the electronic transition between energy levels which are unique to each molecule. Therefore, the emission spectra can be used to perform a quantitative and qualitative analysis of the tested samples. The emission spectra of aged oil samples with different durations were measured and investigated.
2.2.2. UV-Vis Spectroscopy Test
For the sake of comparison, PL spectroscopy was compared with UV-Vis spectroscopy. The latter has been used extensively in the literature for the condition assessment of transformer oil. UV-Vis spectroscopy technique is a powerful tool that can be used for the quantitative analysis of organic compounds, particularly highly conjugated compounds. In this study, aged oil samples and fresh oil samples were tested using a double-beam UV-Vis spectrophotometer to obtain their UV-Vis spectra. A schematic diagram of the configuration of a double-beam spectrophotometer (Shimadzu Scientific Instruments Incorporated, Tokyo, Japan) is shown in
Figure 3. The configuration includes light sources (UV and visible light lamps), a monochromator (wavelength selector), optical lenses, 2 placeholders for sample containers, and 2 detectors. In addition, 2 identical cuvettes, made of quartz, are included. One cuvette, defined as a reference cell, is filled with a fresh oil sample. The other cuvette, defined as sample cell, is filled with aged oil sample. The spectrophotometer measures over the wavelength range from 200 nm to 1400 nm. The UV-Vis absorption spectra were obtained as follows. As the spectrophotometer ran, the UV-Vis light source launched a beam of light directly toward the monochromator that transmitted a narrow band of wavelengths of light. The monochromator contained a drive mechanism that rotated to allow successive bands of wavelengths to be transmitted. Then, the light was split into 2 beams through the splitter. One beam passed through the reference cell, while the other passed through the sample cell. Then, the transmitted light beams were collected, and their intensities were measured by the detector. The spectrophotometer was connected to computer software, which displayed the measured absorbance spectrum while the spectrophotometer analyzed the sample. The obtained spectra presented the absorbance of light by sample as a function of wavelength.
Transformer oil is composed of hydrocarbon compounds, including highly conjugated compounds. When a sample of transformer oil is tested using a UV-Vis spectrophotometer, it absorbs light at specific wavelengths. When the transformer oil ages, aging byproducts are generated, and the sample becomes darker. Therefore, the light transmitted through the sample is decreased. The absorbance spectra of different durations for aged oil samples were measured and investigated.
2.3. Dielectric Dissipation Factor Test
Dielectric dissipation factor (DDF) is a vital electrical property that specifies the quality of transformer oil as it indicates the presence of impurities and conducting materials. In this study, the DDF test was carried out using the Keysight E4980A precision LCR meter (Keysight Technologies, Santa Rosa, CA, USA). The utilized test cell was a fixture that included 2 parallel plates separated by an adjustable spacer. The sample was injected into the test cell. The 2 parallel plates had a diameter of 38 mm and were separated by a distance of 0.3 mm. The parallel capacitance/resistance mode was used. Then, DDF was calculated from the measured capacitance and resistance. DDF was used to evaluate the effectiveness of PL spectroscopy by correlating the PL spectra with the measured DDF for various aged samples.
3. Experimental Results
3.1. PL Spectroscopy Results
The output of PL spectroscopy is a relation between the wavelength of the emitted light represented on the
x-axis and the counts or intensity of emitted photons represented on the
y-axis. Emission at longer wavelengths indicates the transition of electrons with lower energy levels and vice versa.
Figure 4 illustrates the normalized PL spectra of the aged oil samples in addition to reference oil samples over a wavelength range from 450 nm to 800 nm.
Investigating the PL spectrum of the reference oil sample, it is observed that the emission started around 800 nm, and then its intensity tended to increase toward shorter wavelengths. A peak denoted as M, which had low intensity, was observed at around 631 nm. In addition, the main peak with high intensity, denoted as N, was observed at around 500 nm. The peak with low intensity, M, can be attributed to a slight amount of ABP in the reference sample, whereas the peak with high intensity, N, can be attributed to the main hydrocarbon compounds existed in transformer oil.
Investigating the PL spectra of aged oil samples, the impact of the aging process on transformer oil can be remarkably observed. Overall, the PL spectra were observed to shift to higher intensities and became broader over the wavelength range of 800 to 528 nm as the aging duration increased. It was observed that the peak, M, that appeared at 631 nm shifted to a higher level of intensity as the aging duration increased for all aged samples. In addition, it gradually became broader with aging. The behavior of this peak indicates the increment in ABP in transformer oil with the aging process. Moreover, the main peak, which appeared at around 500 nm, became gradually broader with aging as its width increased.
Two main parameters were evaluated for quantitative analysis as depicted in
Figure 5. The first parameter is the full width at half-maximum (FWHM), which is a parameter deduced from the curves to describe their width. It is calculated by measuring the distance on the
x-axis between the points whose values on the
y-axis are half of the peak value. In this paper, FWHM was calculated by measuring the difference in the wavelength between the points that had an intensity of 0.5 in the normalized PL spectra. For fresh oil, the FWHM was measured as 38 nm. This value increased proportionally against aging duration until reaching about 100 nm after 30 days of aging. The second parameter is the enclosed area under the PL spectra (A
PL). It is expressed in arbitrary units. The A
PL of the fresh oil was measured at about 49 a.u., while it increased in an almost linear relationship against aging until attaining about 116 a.u. for the sample aged 30 days. It is clear that both parameters exhibited a good representation for the aged oil condition.
3.2. Correlation of PL Spectra with DDF
DDF is usually used to assess the evolution of aging byproducts in transformer oil. As the aging duration increases, transformer oil decomposes and aging byproducts are generated. Consequently, DDF increases with aging [
8,
9]. Accordingly, by correlating PL spectra with DDF, the effectiveness of PL spectroscopy in assessing the aging condition of transformer oil can be evaluated.
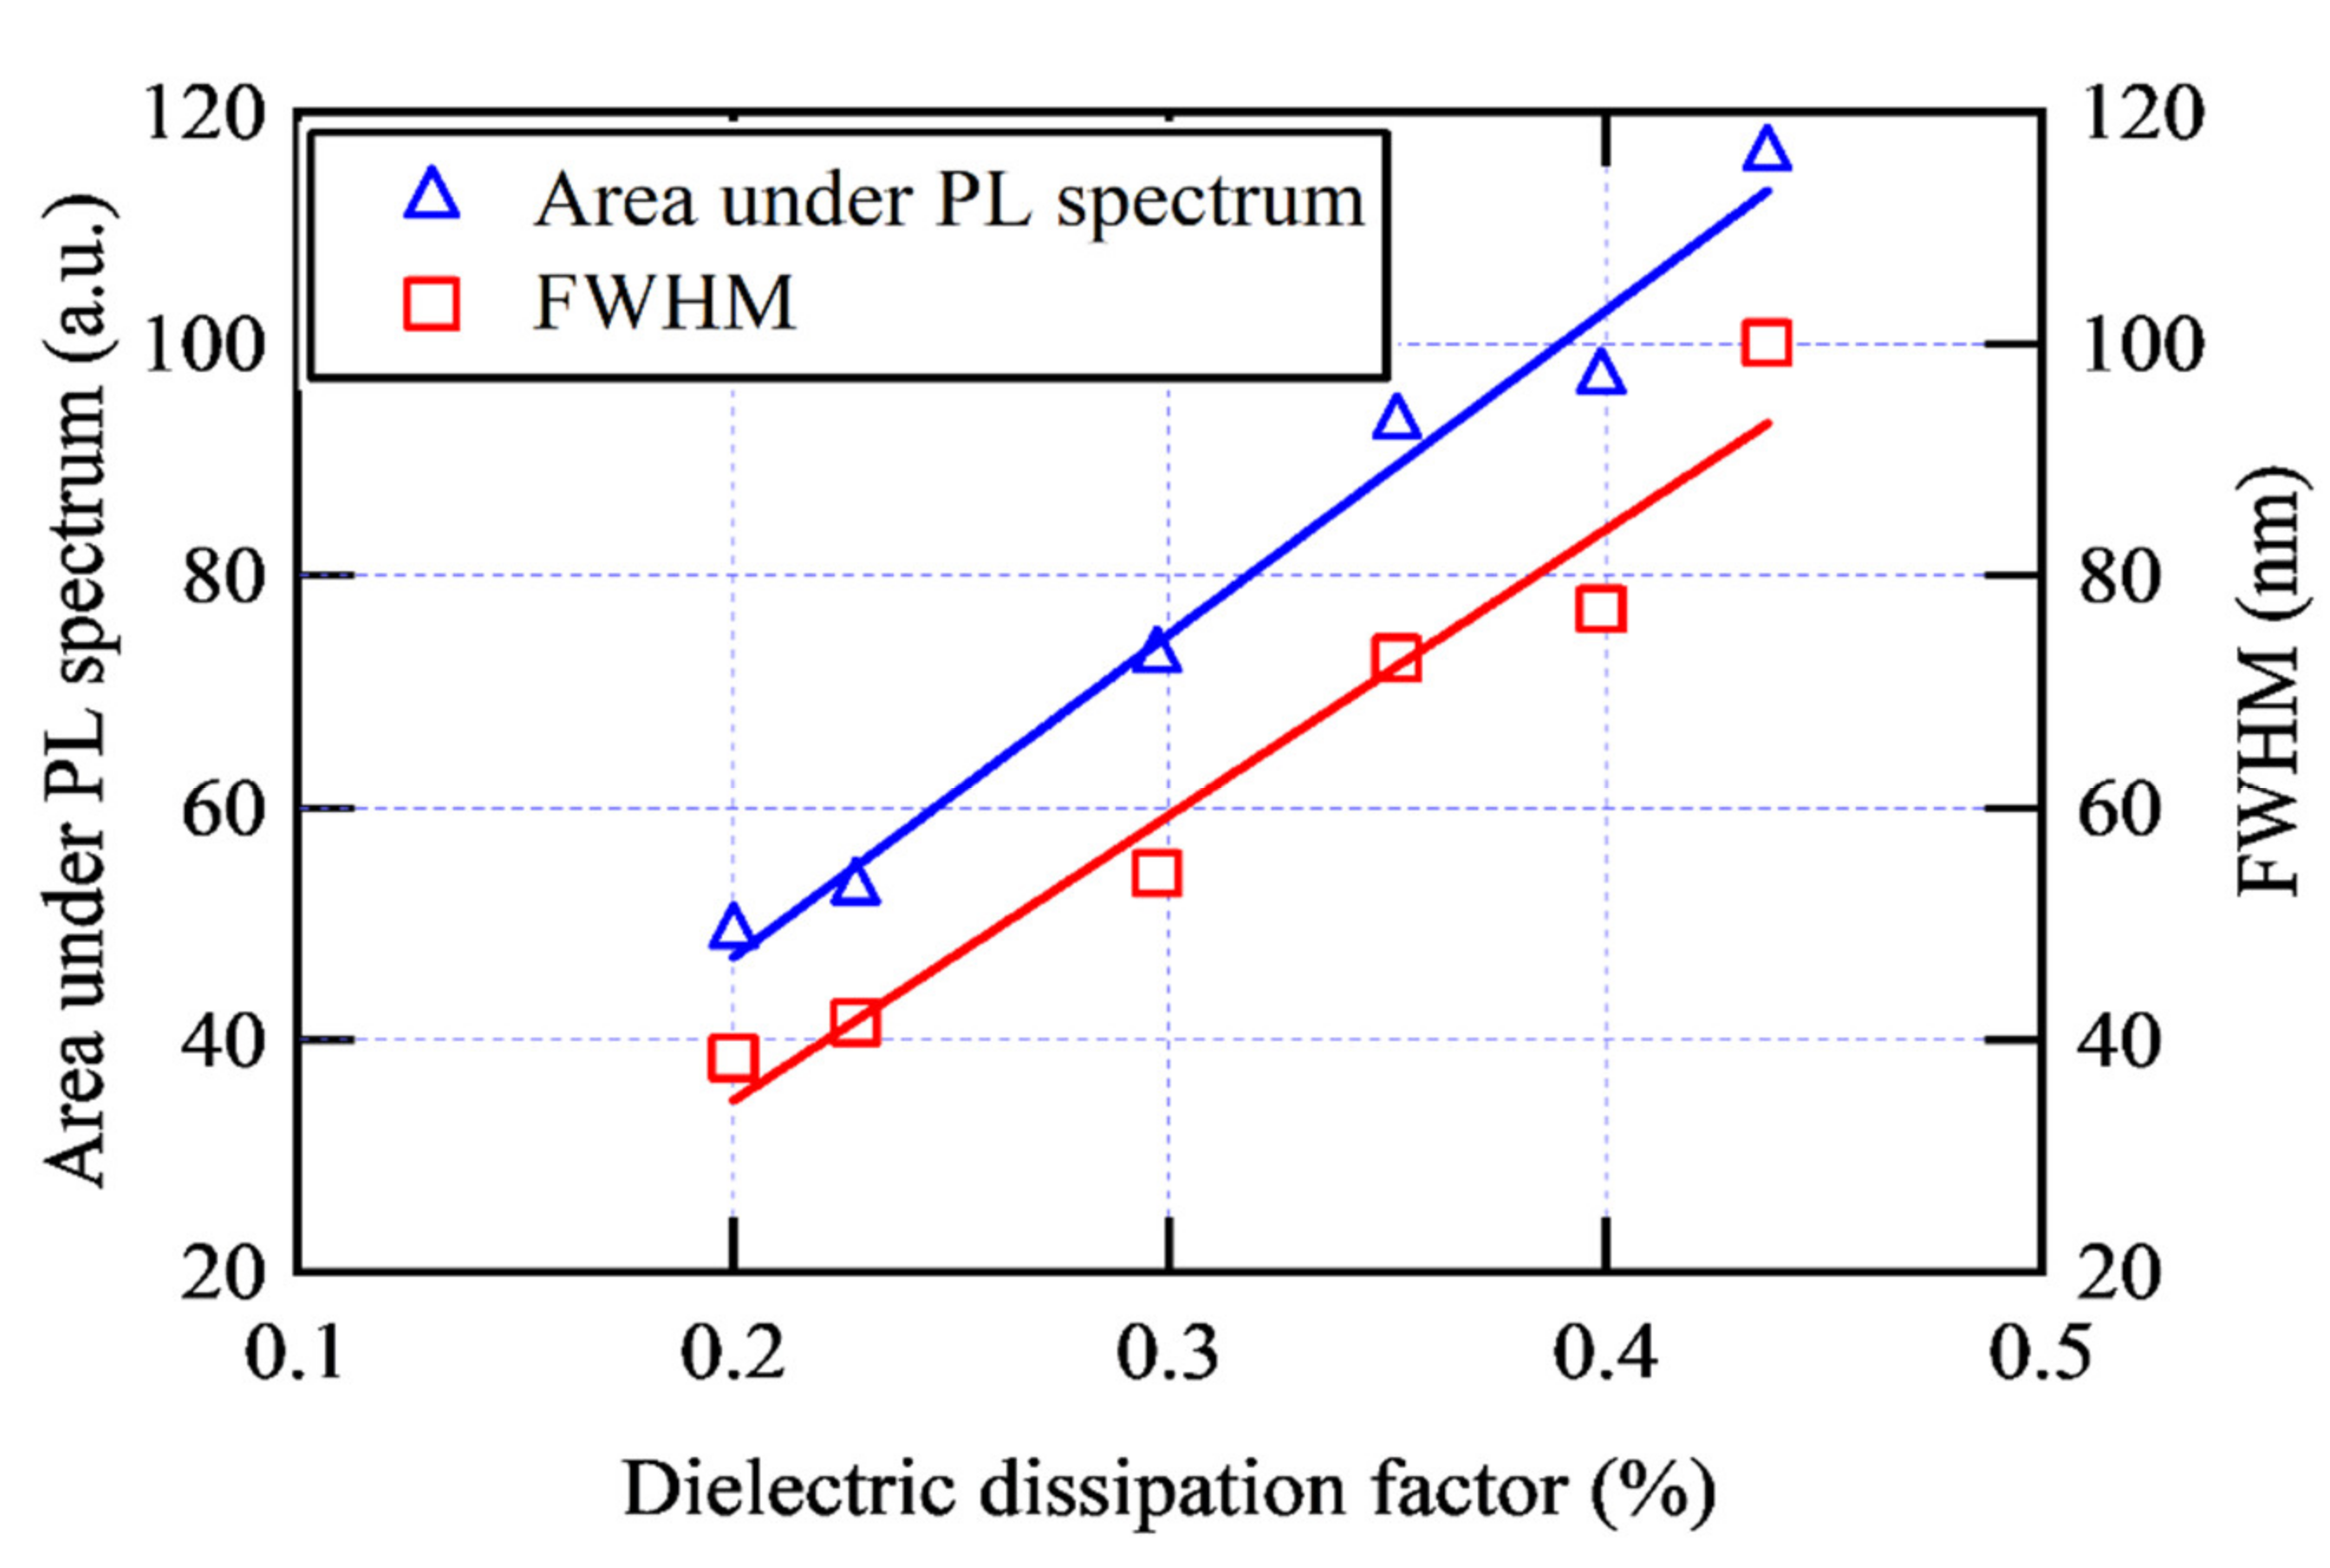
Figure 6 shows the correlation of FWHM and A
PL deduced from PL spectra with DDF. The DDF increased from 0.2% for the fresh sample to about 0.23% for the sample aged 3 days. The DDF continued to increase against aging until attaining about 0.44% after 30 days of aging. In addition, it was found that both A
PL and FWHM increased as the DDF increased. In other words, these parameters could reflect the increment in the aging byproducts in transformer oil and thus its aging condition. With the linear fitting of FWHM and A
PL with DDF, it was found that the correlation coefficients of FWHM and A
PL with DDF were equal to 98% and 99%, respectively. These correlations are extremely high and validate the effectiveness of PL spectroscopy in the proper condition assessment of transformer oil.
3.3. Comparison between PL Spectra and UV-Vis Spectra
Figure 7 illustrates the UV-Vis absorption spectra of the aged oil samples with different aging durations in addition to reference oil samples over the wavelength range from 200 nm to 800 nm. Overall, it was observed that the UV-Vis absorption spectrum of the reference sample had the lowest level of absorbance along with the wavelength range. Moreover, the UV-Vis absorption spectra of aged samples shifted gradually to higher levels of absorbance as the aging duration increased.
Investigating the UV-Vis absorption spectrum of the reference sample, it was noted that the sample began to absorb the light around 425 nm. Then, the absorbance level tended to increase when moving toward shorter wavelengths until a sharp transition in the absorbance spectrum was observed over the wavelength range from 375 to 345 nm. Finally, the absorption spectrum attained the highest absorbance level with some fluctuations over the wavelength range from 345 to 200 nm. The observed fluctuations in this spectral region of high absorbance reflect the complex structure of organic compounds in transformer oil as discussed in
Section 5.
Considering the impact of aging on the UV-Vis spectra some remarkable deviations were observed in the absorbance spectra. A primary observed result of the aging process of transformer oil is that the UV-Vis spectra shifted to higher levels of absorbance. This shift in absorbance spectra can be attributed to the Beer–Lambert relation, which indicates that the absorption of the incident UV-Vis light on a sample is a function of the concentration of the light absorbents in the sample. As the transformer oil ages, the aging byproducts formed in aged oil increase. Therefore, the UV-Vis light absorption by aged oil samples increased with increasing the aging duration.
For quantitative analysis, the ABP was evaluated for each sample by calculating the area under UV-Vis absorption spectrum over the wavelength range from 360 nm to 600 nm according to the ASTM D6802 standard [
33]. The results are depicted in
Figure 8. The ABP was measured at 35 a.u. for the fresh oil and increased continuously against aging duration until reaching about 252 a.u. after 30 days of aging. To evaluate the effectiveness of UV-Vis spectroscopy in assessing the transformer oil condition, the ABP deduced from UV-Vis spectra was correlated with the DDF as shown in
Figure 9. It was found that the ABP increased as the DDF increased. However, in this case, the correlation coefficient for linear fitting was found to be 94%, which is less than the correlation coefficients associated with the parameters deduced from the PL spectra. Thus, PL spectroscopy showed a higher correlation than the UV-Vis spectroscopy with DDF. It is clear that PL spectroscopy is more effective in the condition assessment of transformer oil than UV-Vis spectroscopy.
4. Discussion
In this section, the physical mechanisms behind the obtained PL spectra are investigated in comparison to that of UV-Vis spectra. Mineral transformer oil is composed of a complex mixture of hydrocarbon compounds, namely paraffins, naphthene, and aromatic compounds. The single-bonded straight chains of paraffins and single-bonded rings of naphthene are strong bonds. Thus, they absorb energy higher than the available UV-Vis spectrum. Accordingly, any impact of aging on these bonds will not be accurately reflected on the UV-Vis spectra. Nevertheless, the double-bonded rings of aromatic compounds are less strong. As a result, only aromatic hydrocarbon compounds absorb light in the UV-Vis region over the wavelength range from 200 nm to 800 nm.
Figure 10 shows the UV-Vis absorbance spectra and PL spectra for the same transformer oil samples after 10 days of aging in comparison to the reference sample. It is observed that there was symmetry between the deviations that occurred in the absorbance spectrum and PL spectrum. Similar peaks and transitions can be observed on both of them. However, there was a remarkable spectral shift in the wavelength between both spectra. For UV-Vis spectroscopy, as UV-Vis light passed through the transformer oil sample, a fraction of the electromagnetic radiation was absorbed. The absorption of light energy led to electronic transitions from a low energy state, defined as the ground state, to a higher energy state, defined as the excited state, as shown in
Figure 11a. The energy of absorbed electromagnetic radiation was exactly equivalent to the difference in the energy gap between the ground state and excited state [
34]. Before returning to the ground state, the electrons exhibited a relaxation process where they moved down to a deep energy state as shown in
Figure 11b. The relaxation process emitted heat, and it was not radiant. Finally, the electrons returned to the ground state with a lower emitted energy than the absorbed one, as shown in
Figure 11c, leading to a shift in the PL spectra to longer wavelengths than that of the absorbance spectra. Accordingly, the PL spectra showed a clear Gaussian shape of the optical transitions in oil, as shown in
Figure 10, resulting in full coverage for all excited states and a simple interpretation of the obtained results in consideration of oil coloring. This also made the single-bonded straight chains of paraffins and the single-bonded rings of naphthene detectable in the PL spectra.
With exposing the transformer oil to aging, the shift in PL spectra was more pronounced than that in UV-Vis spectra as shown in
Figure 12. In this figure, the spectral shift from the reference sample was calculated for each spectrum at 50% of its maximum value. The PL spectra attained a shift of about 62 nm after 30 days of aging, while the UV-Vis spectra attained a shift of only about 34 nm, indicating a higher sensitivity for the PL spectra. This can be explained considering the abovementioned mechanisms and the impact of aging byproducts described as follows. With exposing the transformer oil to aging, aging byproducts such as aldehyde, ketone, and carboxylic acids are increased in transformer oil. These byproducts increase the depth of deep energy states. Accordingly, the relaxation process in
Figure 11c occurs toward a lower energy state than that in unaged oil, making the emission processes occur on narrower bands. Since the PL spectroscopy technique involves such emission processes, it can definitely reflect these states in the emitted light, making the features deduced from PL spectra more accurate than those deduced from UV-Vis absorption spectra.
Table 3 compares the various quantitative features extracted from the PL technique with those obtained by the UV-Vis absorbance technique.
5. Conclusions
In this paper, PL spectroscopy was applied as a simple and accurate method for the qualitative and quantitative condition assessment of insulating oil. Aged transformer oil samples were prepared using an accelerated aging test with different aging durations ranging from 3 days to 30 days. Then, PL spectra were extracted for the aged samples and compared to the fresh oil sample. In addition, the dielectric dissipation factor was measured and correlated to the obtained features from PL spectra. The obtained findings can be summarized as follows:
The PL spectra remarkably illustrated the impact of aging on transformer oil. Overall, it was noted that the PL spectra shifted to higher levels and longer wavelengths with aging. The features extracted from PL spectra, including the full width at half-maximum (FWHM) and the enclosed area under the PL spectra (APL), increased proportionally against aging duration.
The UV-Vis absorption spectra for the same aged samples were obtained for the sake of comparison. The UV-Vis absorption spectra of aged samples shifted gradually to higher levels of absorbance and longer wavelengths as the aging duration increased.
By correlating FWHM and APL extracted from PL spectra with DDF, it was found that the correlation coefficients of FWHM and APL with DDF were equal to 98% and 99%, respectively, while the correlation of aging byproducts extracted from UV-Vis spectra with DDF exhibited a correlation coefficient of 94%. These correlations validate the effectiveness of PL spectroscopy.
Physical mechanisms behind the obtained PL spectra were discussed in comparison to those of UV-Vis spectra considering the excitation, relaxation, and emission processes of electronic transitions. PL spectra showed a clear Gaussian shape of optical transitions, resulting in full coverage for all excited states and the accurate reflection of newly created states due to aging.
Overall, PL spectroscopy proved to be simpler and more accurate than UV-Vis spectroscopy. In addition, the PL technique can be easily developed, thus making this type of optical measurement a part of the condition-based maintenance plan as an inexpensive, online, simple alternative technique for assessing the insulating oil quality.


 ,
, 


