1. Introduction
The legal framework set by the Paris Climate Agreement [
1] calls for practical technological solutions to realise emission reduction targets at both the European Union (EU) and the national levels. The ultimate target of the EU is to gradually achieve carbon neutrality by 2050 [
2]. The realisation of considerable emission reductions requires marked reconfiguration of the energy sector. The role of hydrogen in the energy transition has gained significant interest, and the question of whether to use renewable electricity directly as a source of power or to convert electricity to hydrogen via the electrolysis of water remains unresolved. The direct use of electricity in battery electric vehicles is the most energy efficient option, and this can be readily observed by comparing the overall well-to-wheels efficiencies of fully electric vehicles and internal combustion engine vehicles. After taking fuel production, distribution, retail, and vehicle losses into account, the well-to-wheels efficiency of fossil fuel-powered internal combustion engine vehicles is only 25–29%, while the corresponding figure for battery electric vehicles charged with renewable electricity is 68% [
3]. However, wide-spread adoption of electric transport is hindered by the scarcity of materials required for the production of batteries. Weil et al. estimated that global lithium and cobalt reserves will be exhausted by 2050, even with high recycling rates for the used battery materials [
4]. Additionally, there were 280 million road vehicles in use in the EU in 2019 [
5], and 96% of these vehicles operated on either gasoline or diesel and were in use for 12 years on average. Transitioning the entire internal combustion engine vehicle fleet to battery-powered electric vehicles is therefore a slow and demanding process.
The announced auction prices for onshore wind power and solar photovoltaics fell by 49% and 83%, respectively, between 2013 and 2020 [
6]. Despite the favourable reduction of renewable electricity prices, the conversion of aviation, long-haul marine transport, and heavy road transport to fully electric alternatives in the near future is challenging. Alternative liquid fuels, such as renewable methanol and ammonia, have been considered as substitutes for fossil fuels in marine transport [
7], while jet fuel does not yet have such a sustainable alternative.
The direct use of hydrogen for transportation also has challenges. Large-scale deployment of hydrogen production is restricted by issues related to demanding storage conditions, safety concerns, and insufficient infrastructure [
8], and these difficulties further translate to high costs. The use of hydrogen-powered fuel cells is also limited by the low overall technology readiness level (TRL) [
9]. It would therefore be preferable to convert renewable hydrogen and carbon dioxide to methanol or liquid hydrocarbons via power-to-liquid (PTL) processes. PTL has gained increasing attention as an alternative route for transport fuel production, especially in hard-to-abate sectors [
10]. The International Air Transport Association views the electrification of commercial aviation as unlikely until 2040 [
11]; hence, producing liquid aviation kerosene is the most viable option for decades to come. Some major airlines [
12,
13] have already announced initiatives to begin using carbon-neutral kerosene. Global consumption of aviation kerosene was nearly 300 Mt in 2019, and consumption has increased steadily over the past 15 years with an average annual growth rate of 2.5% [
14]. This represents remarkable business potential for PTL processes if fossil kerosene is gradually replaced with synthetic aviation fuel.
There are several methods to convert hydrogen and carbon dioxide into hydrocarbons. In conventional synthetic fuel production, the raw material is syngas, a mixture of CO and H
2, which can be used to synthesise methanol or hydrocarbons. Processes converting CO
2 to hydrocarbons can be divided into direct and indirect methods. Direct conversion technologies constitute Fischer–Tropsch (FT) processes in which syngas is converted to hydrocarbon chains with high carbon numbers [
15]. As the FT synthesis uses CO, a reverse water–gas shift reaction must be carried out if CO
2 is utilised as the carbon source [
16]. The oil and petrochemical company Shell uses FT synthesis in its Shell Middle Distillate Synthesis (SMDS) plants in Qatar and Malaysia. The process produces synthetic crude that can be refined into liquid fuels [
17]. The FT process is also used in South Africa by The Petroleum Oil and Gas Corporation of South Africa (PetroSA) [
18]. The plant produces gasoline and diesel fuels via a conversion of olefins to distillate (COD) process by converting light FT olefins to higher olefins. To the best of our knowledge, PetroSA is the only company that uses the COD process [
19].
In an alternate conversion process, hydrocarbons are produced via methanol. First, CO or CO
2 is hydrogenated to methanol. The methyl alcohol is then further dehydrated to dimethyl ether (DME) and finally to hydrocarbons. As a result of the series of dehydration reactions, a large quantity of water is formed as a by-product. The first application of methanol for fuel production was ExxonMobil’s methanol-to-gasoline (MTG) process [
20]. Haldor Topsøe developed the synthesis further and integrated methanol and gasoline production into a single synthesis loop in a process called Topsøe integrated gasoline synthesis (TIGAS) [
21]. Both techniques are currently commercially available with a TRL of 9. While these processes produce only gasoline as the main hydrocarbon product, ExxonMobil further developed the methanol-to-olefins (MTO) process and Mobil’s olefins to gasoline and distillate (MOGD) process. When these processes are coupled, methanol can be converted into gasoline, kerosene, and diesel [
22]. Because the MOGD process was only developed to the pre-commercial stage in the 1990s [
23], the TRL of MTO-MOGD can be estimated to be 8.
Synthesis techniques originally developed for fossil raw materials can be adopted in renewable transport fuel production. CO
2 can be acquired from industrial emissions, biogenic sources, or directly from the atmosphere. Hydrogen can be produced via electrolysis of water using renewable electricity. Methanol production is a well-known and industrially proven technology with fossil raw material sources that mainly uses steam reforming of methane to produce syngas. Renewable methanol is already produced in Iceland from captured CO
2 and renewable H
2 [
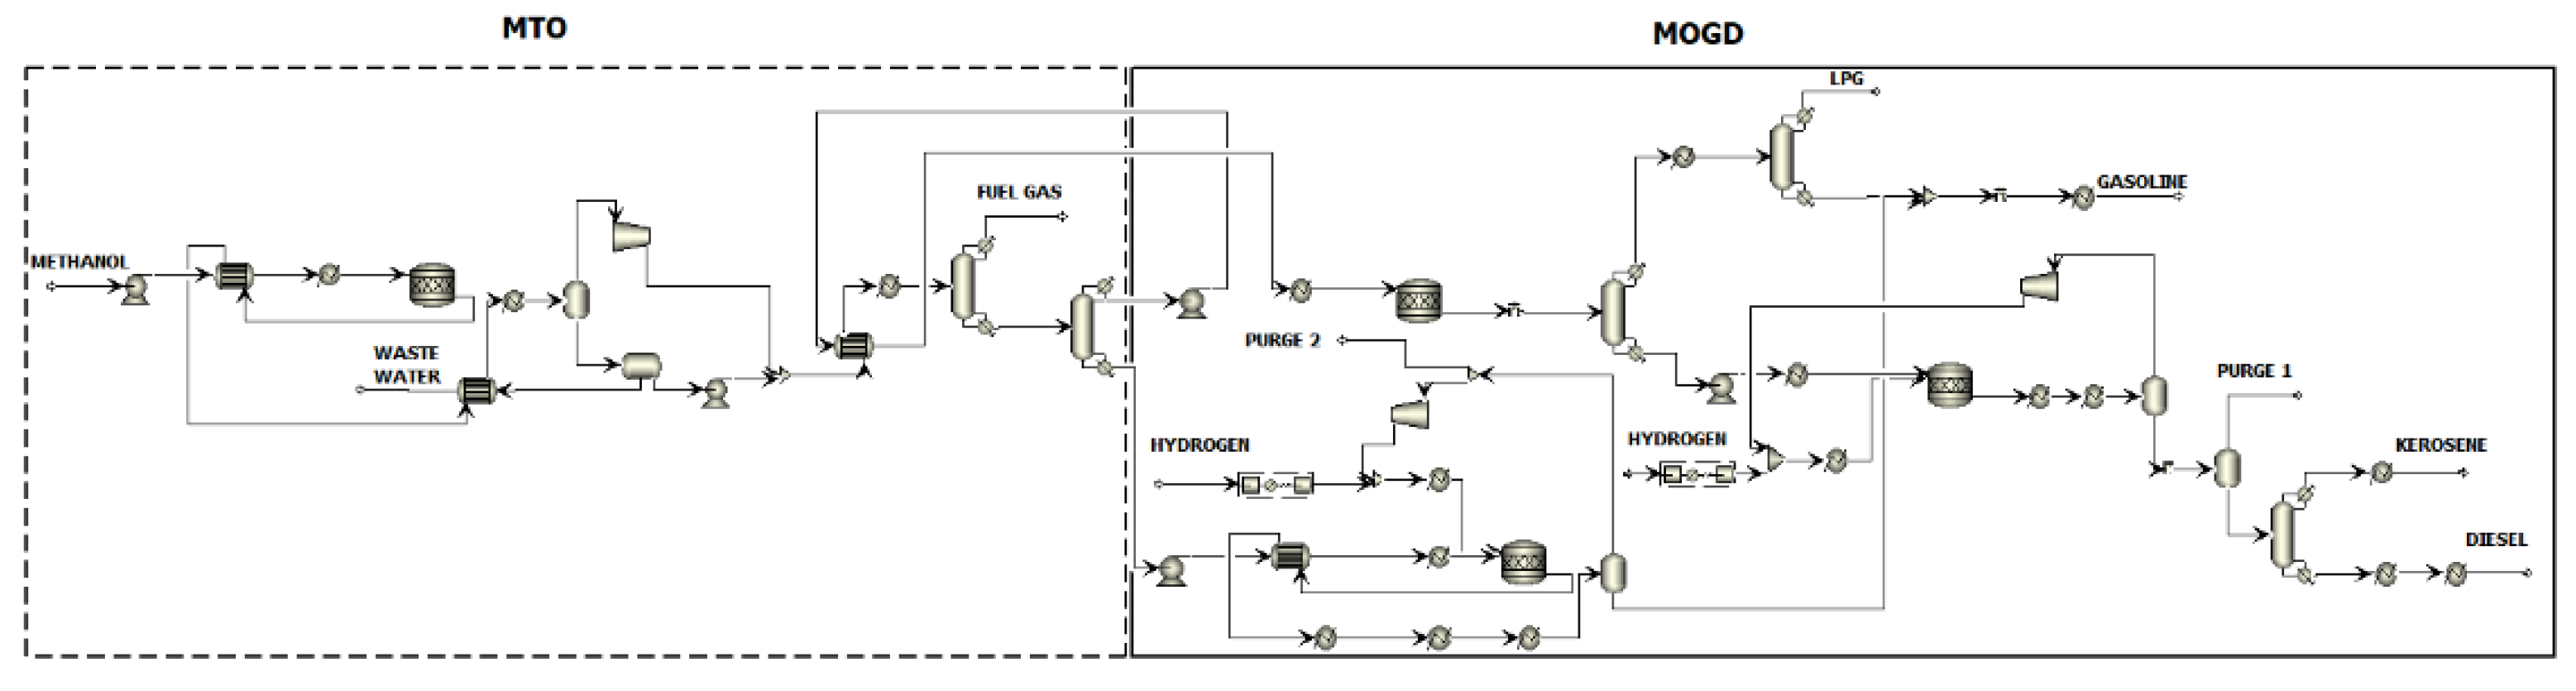
24]. Further refining of methanol into liquid hydrocarbon fuels is possible in an MTO process where methanol is converted to light olefins and water via a dimethyl ether intermediate. The synthesis is coupled with a MOGD process that converts light olefins into gasoline, kerosene, and diesel range liquid fuels via olefin oligomerisation. The principle of methanol conversion into transport fuels by combining the two processes is illustrated in
Figure 1 as a block diagram.
The reaction system in the synthesis catalysed by the ZSM-5 zeolite molecular sieve can be described in a generic form via Equations (1)–(3) [
26,
27]. Equations (1) and (2) describe the hydrocarbon pool mechanism proposed by Dahl and Kolboe [
28]. First, methanol (MeOH) is dehydrated to dimethyl ether and water (Equation (1)). Further conversion of DME (Equation (2)) yields additional water and light olefins with a general expression of (CH
2)
n, where 2 ≤ n ≤ 4 [
28]. C
3–C
6 olefins are the main reaction products in Equation (2), but light paraffins, naphtenes, and aromatics with carbon numbers ≤10 also form [
23]. In the final step (Equation (3)), light olefins are oligomerised to produce higher olefins in the C
5–C
20 range. Estimates of the standard reaction enthalpies and the corresponding reference values found in literature [
29,
30] are given in the
Supplementary Materials.
The MTO-MOGD process is often introduced in the literature in connection to synthetic fuel production [
31,
32]; however, to the best of our knowledge, the process has not been modelled in detail. Baliban et al. [
33] presented a synthesis and optimisation scheme for the thermochemical conversion of coal, biomass, and natural gas to liquid hydrocarbons via MTO-MOGD. Baliban et al. [
34] also carried out a comparative study of FT and MTO-MOGD for biomass-based processes. Onel et al. [
35] introduced a synthesis and optimisation framework focusing on light olefin production from biomass and natural gas. However, these studies considered hydrocarbon formation and refining only via atom balance calculations. As an improvement to the previous studies, the current work introduces a detailed process modelling and economic analysis for the synthesis of gasoline, kerosene, and diesel from renewable methanol. A steady-state process simulation model is created using the Aspen Plus V11 simulation software, and cost evaluation for the process is developed based on the model. A process model integrating the simultaneous production of several liquid fuels, a hydrogen recycling loop, and heat recovery system from fuel gas is a unique approach for further development of the MTO-MOGD process. Additionally, a sensitivity analysis to determine the parameters that most influence the profitability of this process is of great interest to decision-makers.
2. Materials and Methods
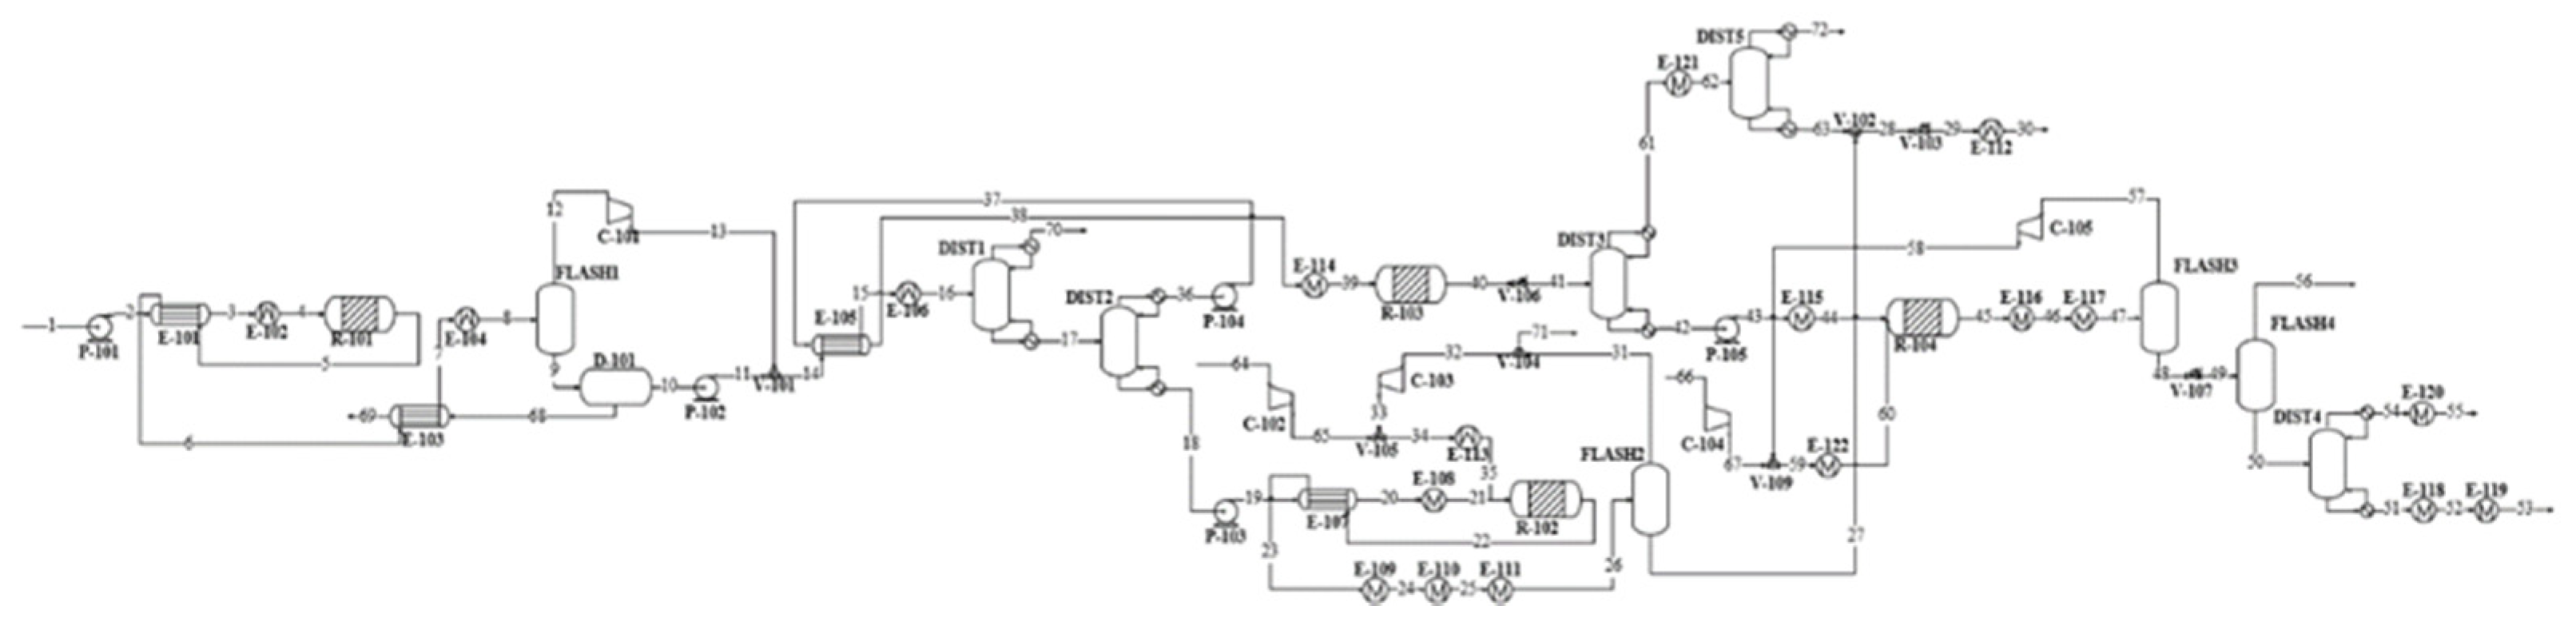
The simulation flowsheet was constructed, and the process conditions were determined based on literature references [
22,
23]. Because the MTO-MOGD process has not reached the commercial scale [
23] and reported process information is limited, the design was complemented with approximations using common process engineering principles. For instance, process conditions in the separation stages were defined iteratively to achieve the desired performance. Heat integration within the model was also designed to reduce the energy consumption of the process. The Peng–Robinson (PENG-ROB) method was chosen for physical property estimation as it is applicable for nonpolar and mildly polar mixtures of hydrocarbons and MeOH/DME/water [
36]. PENG-ROB was recently found to also be applicable in methanol/hydrocarbon processing by Shi et al. [
37] and Henning and Haase [
38]. This selection was validated by comparison of the modelling results to those predicted via alternative physical property methods. The process was designed for 3000 kg/h methanol feed, which corresponds to a pilot-scale production plant.
2.1. Process Description
Methanol is assumed to enter the process under atmospheric conditions. It is pumped and heated to the MTO reactor conditions of 2 bar and 450 °C. In the reactor, methanol is first converted to DME and water, and further to light olefins and additional water. The reactor operates isothermally via high-pressure (HP) steam generation. The reactor effluent is cooled down and water is separated from the hydrocarbon–water system. Non-condensable light hydrocarbon gases are separated from light olefins via distillation and directed to high-temperature heat generation. Durene is separated from the olefin product in the following distillation column and sent to a dedicated heavy gasoline treatment.
The MOGD reactor converts light olefins into heavier olefins via oligomerisation reactions. The reactor operates at 40 bar and 200 °C, and the temperature is kept constant by low-pressure (LP) steam generation. The reactor product is fractioned to liquefied petroleum gas (LPG), gasoline, and distillate products via two-step distillation. The distillate blend formed by olefinic kerosene and diesel compounds is hydrotreated to saturate the carbon–carbon double bonds. The hydrogenation reactor operates isothermally at 40 bar and 300 °C. Exothermic reaction heat is directed to HP steam generation. The paraffinic distillate product is separated from excess hydrogen gas and distilled to separate kerosene and diesel fuels. Hydrogen is recovered at a purity of 99.6 mol% and recycled back to the reactor feed.
The aromatic gasoline fraction rich in durene is treated via hydroisomerisation in a heavy gasoline treatment unit. The isomerisation reaction takes place in the presence of hydrogen gas in an isothermal reactor operating at 16 bar and 345 °C. The reaction heat is provided by high-temperature heat. The durene content of the aromatic fraction is reduced by 57 mol% during the reaction. The resulting hydrocarbon–hydrogen mixture is separated, and the aromatics are blended with the gasoline fraction. Then, 99.7 mol% of hydrogen is recovered at a purity of 99.4 mol% in the separation stage and recycled back to the reactor feed.
Heat is recovered from combustion of light gases removed from the light olefins. The combustion air is pre-heated using HP steam prior to entering the furnace. Overall, 1.1 MW of high-temperature heat >500 °C is recovered from the furnace and cooling of the combustion gases. An additional 0.1 MW is recovered from the combustion gases by generation of high-pressure steam in a flue gas boiler.
2.2. Model Specification
To simplify the complex reaction system of various hydrocarbon compounds, the gasoline was considered as a mixture of C
4–C
10 paraffins, olefins, naphthenes, and aromatics. The kerosene was estimated to consist only of C
12 paraffins and olefins, and diesel was assumed to include C
16, C
18, and C
20 hydrocarbons. The
Supplementary Materials contain the specifications of the model components and the reactions taking place in each reactor.
Operation of the MTO and MOGD reactors R-101 and R-103, respectively, was determined based on the reported operation experience of Mobil’s demonstration-scale MTO-MOGD plant [
22]. In the model, full conversion of methanol to DME and further conversion to light olefins occurs in reactor R-101. Because of the highly exothermic reaction system, the reactor was assumed to be equipped with a cooling jacket. In reactor R-103, C
2–C
6 olefins are oligomerised to long-chained olefins with carbon numbers up to C
20. The reactions are catalysed using the ZSM-5 catalyst. The yields in both reactors were set to correspond with the experimental yields reported by Avidan [
22] by adjusting the fractional conversion of each reaction.
Hydrotreatment of the distillate fraction was modelled based on previously reported work [
39]. The hydrogen feed was estimated to be equimolar to the hydrocarbon flow, as suggested by Gong [
40]. The hydrogenation reactions were assumed to produce both linear and branched paraffins over a Ni/γ-Al
2O
3 catalyst [
41].
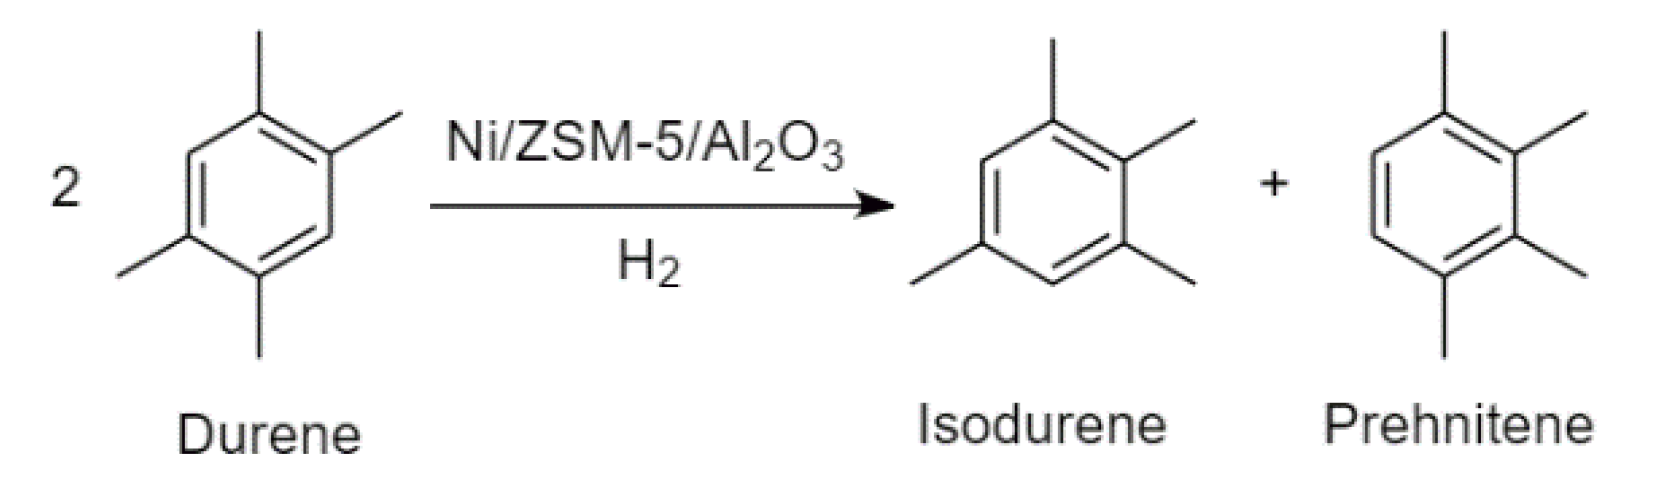
The aromatic compound durene (1,2,4,5-tetramethylbenzene) has a melting point of 79 °C, while its two isomers, isodurene (1,2,3,5-tetramethylbenzene) and prehnitene (1,2,3,4-tetramethylbenzene), melt at −24 and −7 °C, respectively [
42,
43,
44]. High durene content in gasoline can lead to engine issues, especially in cold climates. This can be avoided via treatment of durene by hydroisomerisation. The process was modelled based on the process patented by Topsøe [
45]. Isomerisation of durene to isodurene and prehnitene occurs over a sulphided Ni/ZSM-5/Al
2O
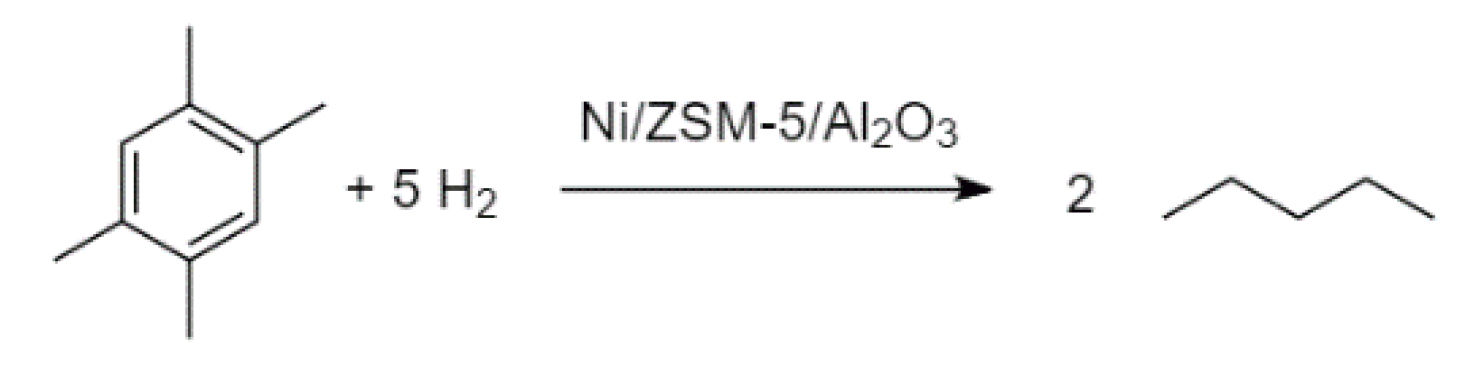
3 catalyst in the presence of hydrogen gas. Along with the hydrogenation–dehydrogenation activity of the catalyst, cracking and hydrogenolysis reactions occur on a minor scale. It was discovered by Hidalgo-Vivas and Joensen [
45] that ~6 vol% of the hydrogen fed to the isomerisation reactor was consumed in the synthesis, while the yield of the C
3–C
7 fraction increased. Thus, it was approximated that n-pentane was formed in this work via the reaction of durene and hydrogen in an amount that corresponds to the reported hydrogen consumption. Hidalgo-Vivas and Joensen did not, however, report the individual quantities of isodurene and prehnitene formed during the hydroisomerisation process. It was therefore assumed that the isomers formed in equimolar ratios. Based on these considerations, the reaction stoichiometry can be presented by
Figure 4 and
Figure 5.
The combustion of light gases in a furnace was modelled using an RGibbs reactor block with an isothermal specification at 1000 °C. Air input was specified at a molar excess of 20% above complete combustion, with combustion air pre-heated to 235 °C using high-pressure steam. The amount of high-temperature heat was calculated via addition of the furnace heat duty and the additional duty from cooling of the combustion gases to 500 °C. The amount of heat recovered as HP steam was calculated as the heat duty from further cooling of the gases to 260 °C.
2.3. Thermodynamic Model Comparison
Performance of a simulation model is conventionally evaluated by validating the model with an external dataset. As the MTO-MOGD process has not been developed into fully commercial scale, extensive experimental data are not available in the literature. The model validity can be alternatively evaluated by critically examining the model setup. The selection of an appropriate Aspen Plus property model is one of the most important steps and affects simulation of the hydrocarbons. While the Peng–Robinson equation of state is commonly used as a property method for the simulation of hydrocarbons especially in petrochemical processes [
36], it was compared to other potential property models for hydrocarbon simulation to justify the selection. The methods selected for comparison include the Peng–Robinson with Boston–Mathias modification (PR-BM), Redlich–Kwong–Soave with modified Huron–Vidal mixing rules (RKSMHV2), and the Soave–Redlich–Kwong (SRK) method. Both the Boston–Mathias modification and the modified Huron–Vidal mixing rules aim to improve the accuracy of these equations of state under high-pressure conditions, and the latter is used in particular when both polar and non-polar components are present [
36].
To compare the predictions of each property method, the mass flow rates of the key product fractions were compared to the results given by the PENG-ROB method. The comparisons were made in terms of the relative difference in mass flow rate compared with the corresponding PENG-ROB results, as described by Equation (4):
where i refers to the product fraction and n refers to the property method used.
2.4. Economic Evaluation
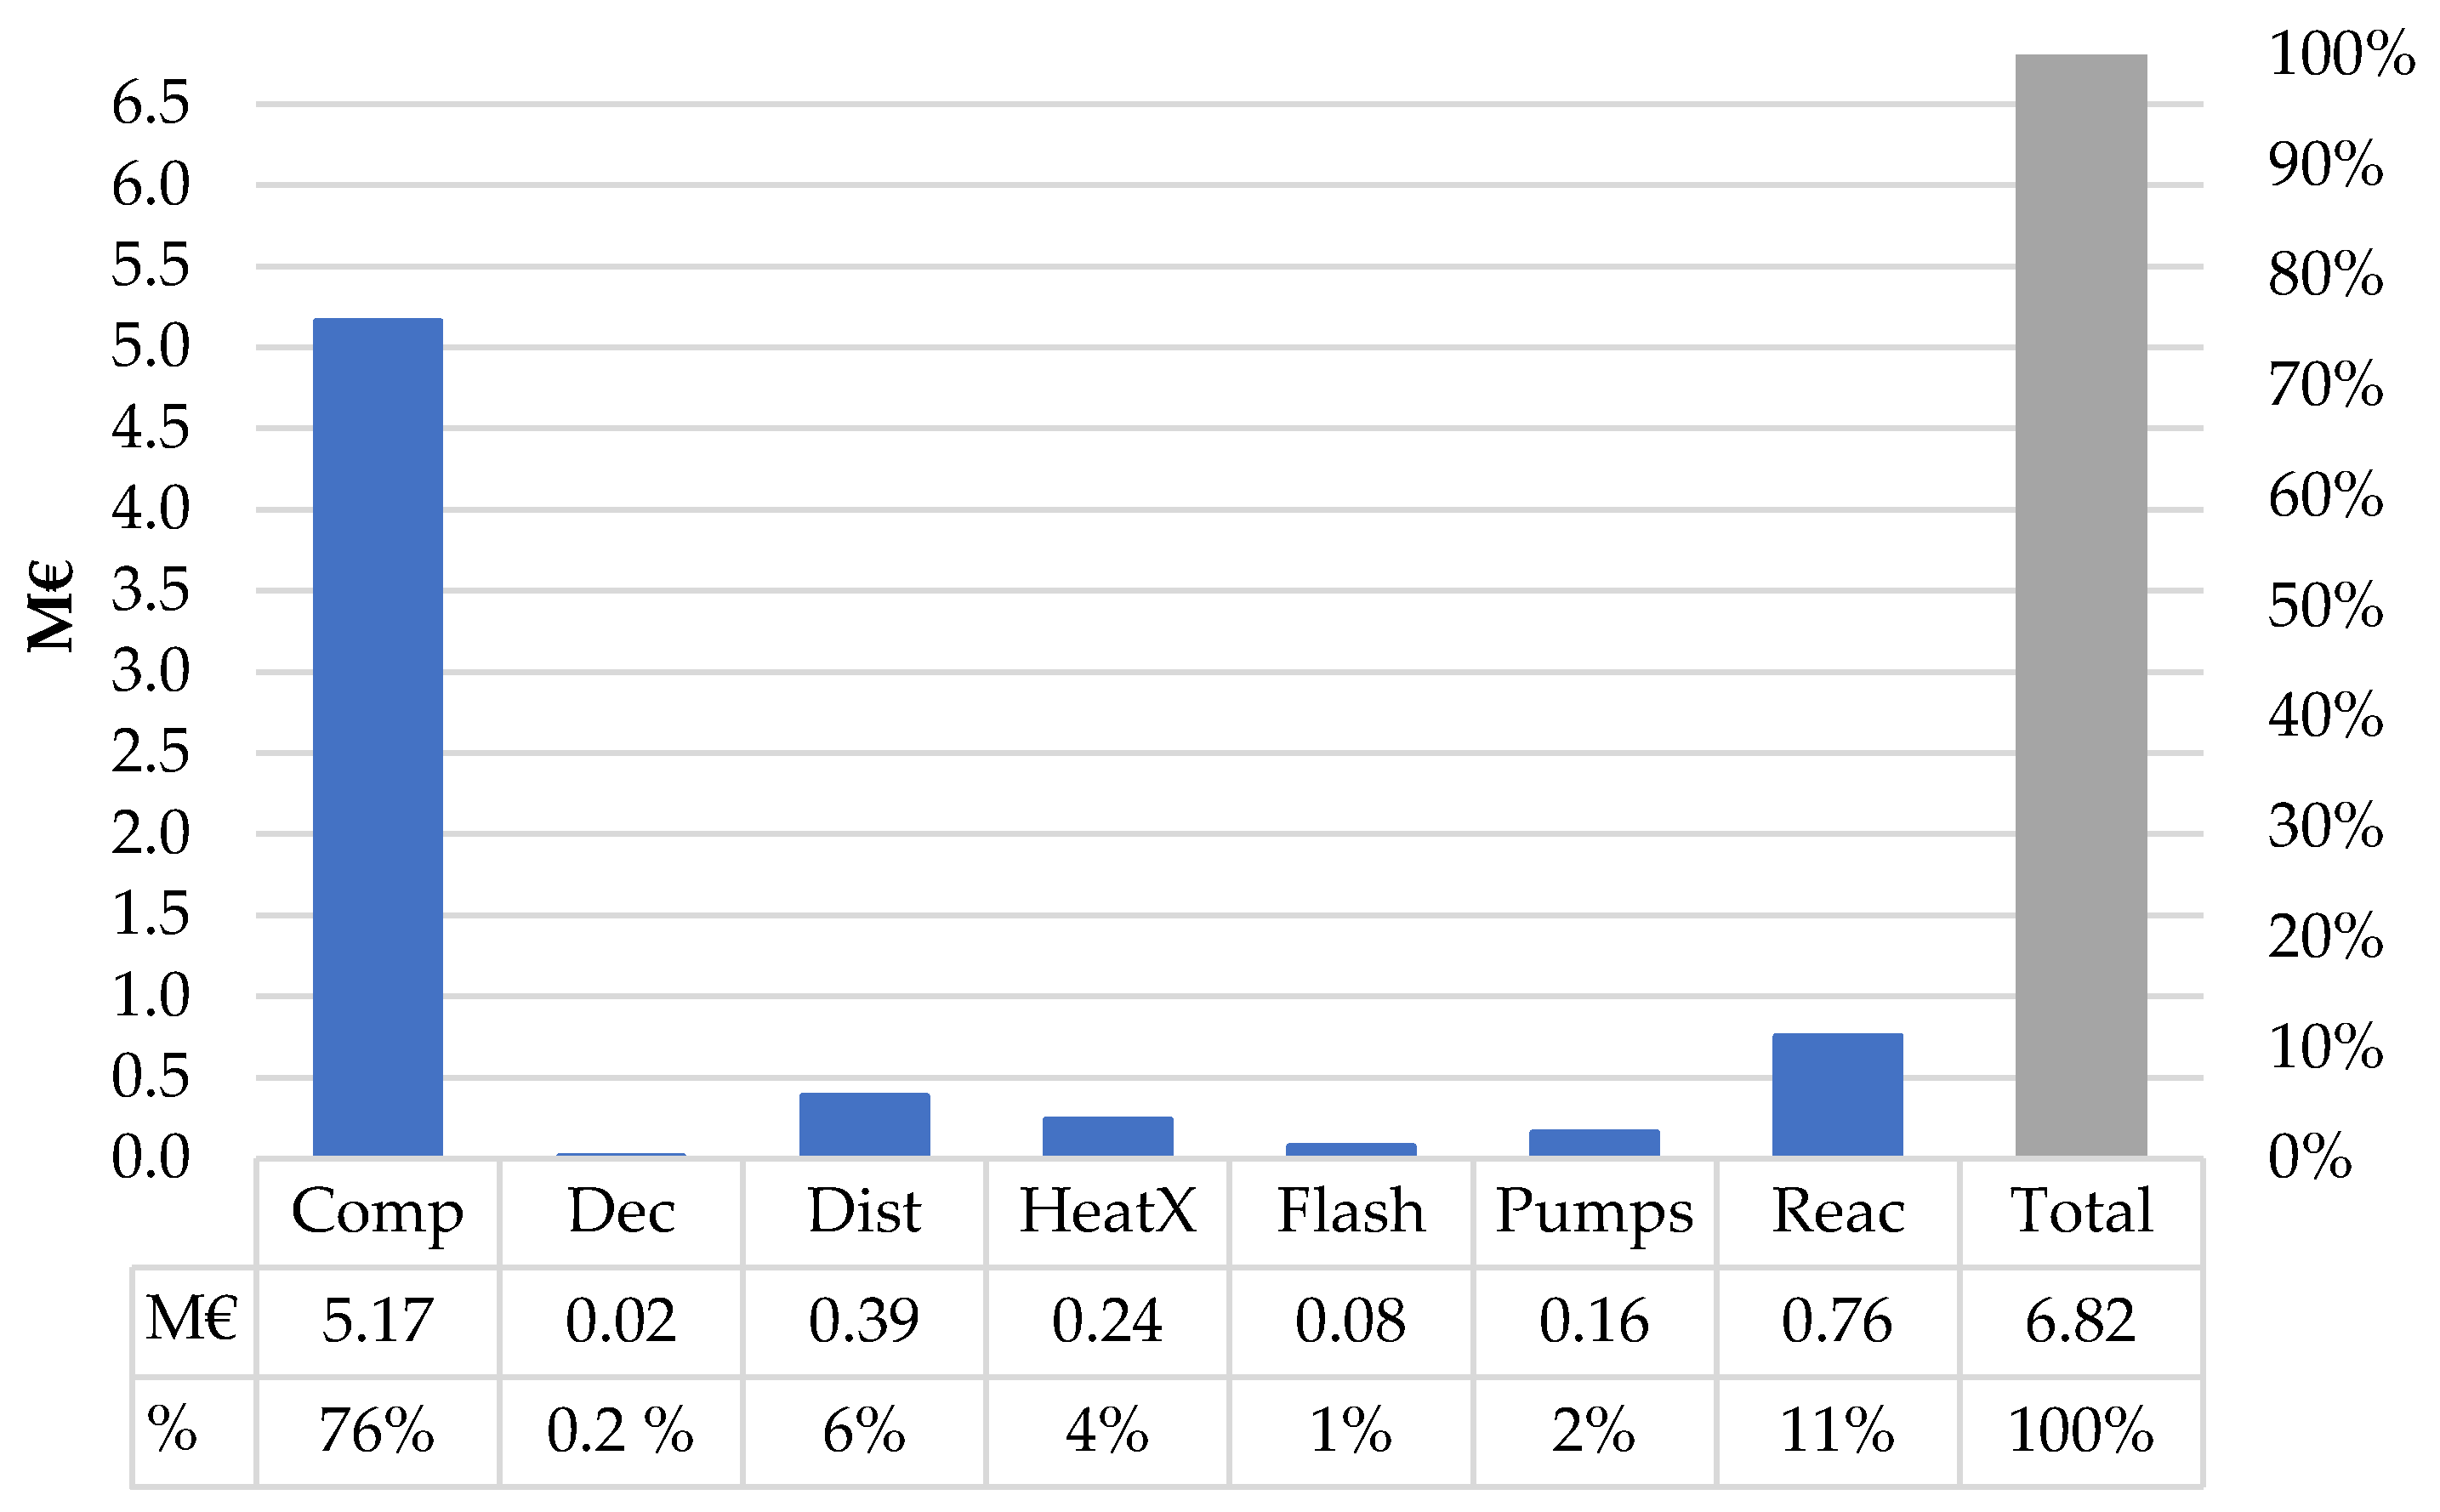
2.4.1. Capital Expenditure
The fixed capital investment for the MTO-MOGD plant was evaluated using the model in Aspen Plus. The purchased equipment costs (
Ce,i,CS) were calculated using the Aspen Process Economic Analyzer (APEA) tool that sizes the equipment and estimates the costs based on the equipment dimensions. Reactor sizes were manually determined based on the liquid and weight hourly space velocities reported in the literature [
40,
45,
46] rather than using the dimensions calculated by APEA. The purchase costs of the reactors were considered twice to enable a dual reactor configuration in which one reactor is on stream and the other is under catalyst regeneration. Reflux pumps for each distillation column were supplied twice for both the condenser and reboiler cycles.
APEA V11 calculates the equipment costs in the United States on the basis of 2018 Q1. The costs were updated using correction factors for inflation, currency rates, and location [
47]. The inside battery limits (ISBL) investment was then calculated using Equation (5) taking equipment installation and commissioning into account. The material factor was considered for equipment manufactured using type SS304 stainless steel instead of carbon steel (CS). For such equipment, SS304 was chosen over CS because of its superior heat and pressure resistance as well as its relatively higher resistance to hydrogen embrittlement. The values of the factors in Equation (5) are listed in
Table 1. The total fixed capital cost (TFCC) was calculated using Equation (6) by estimating the shares of outside battery limit (OSBL) costs (OS), design and engineering (DE) charges, and the investment contingency (X) [
48].
The MTO-MOGD plant was considered as an independent greenfield site with proprietary auxiliary systems. Towler and Sinnott [
48] recommended the use of 40% of ISBL as an initial estimate for the OSBL cost. The share of the OSBL cost can be reduced by using auxiliary infrastructure serving several synthesis plants. The design and engineering as well as contingency charges were also estimated based on values given by Towler and Sinnott [
48].
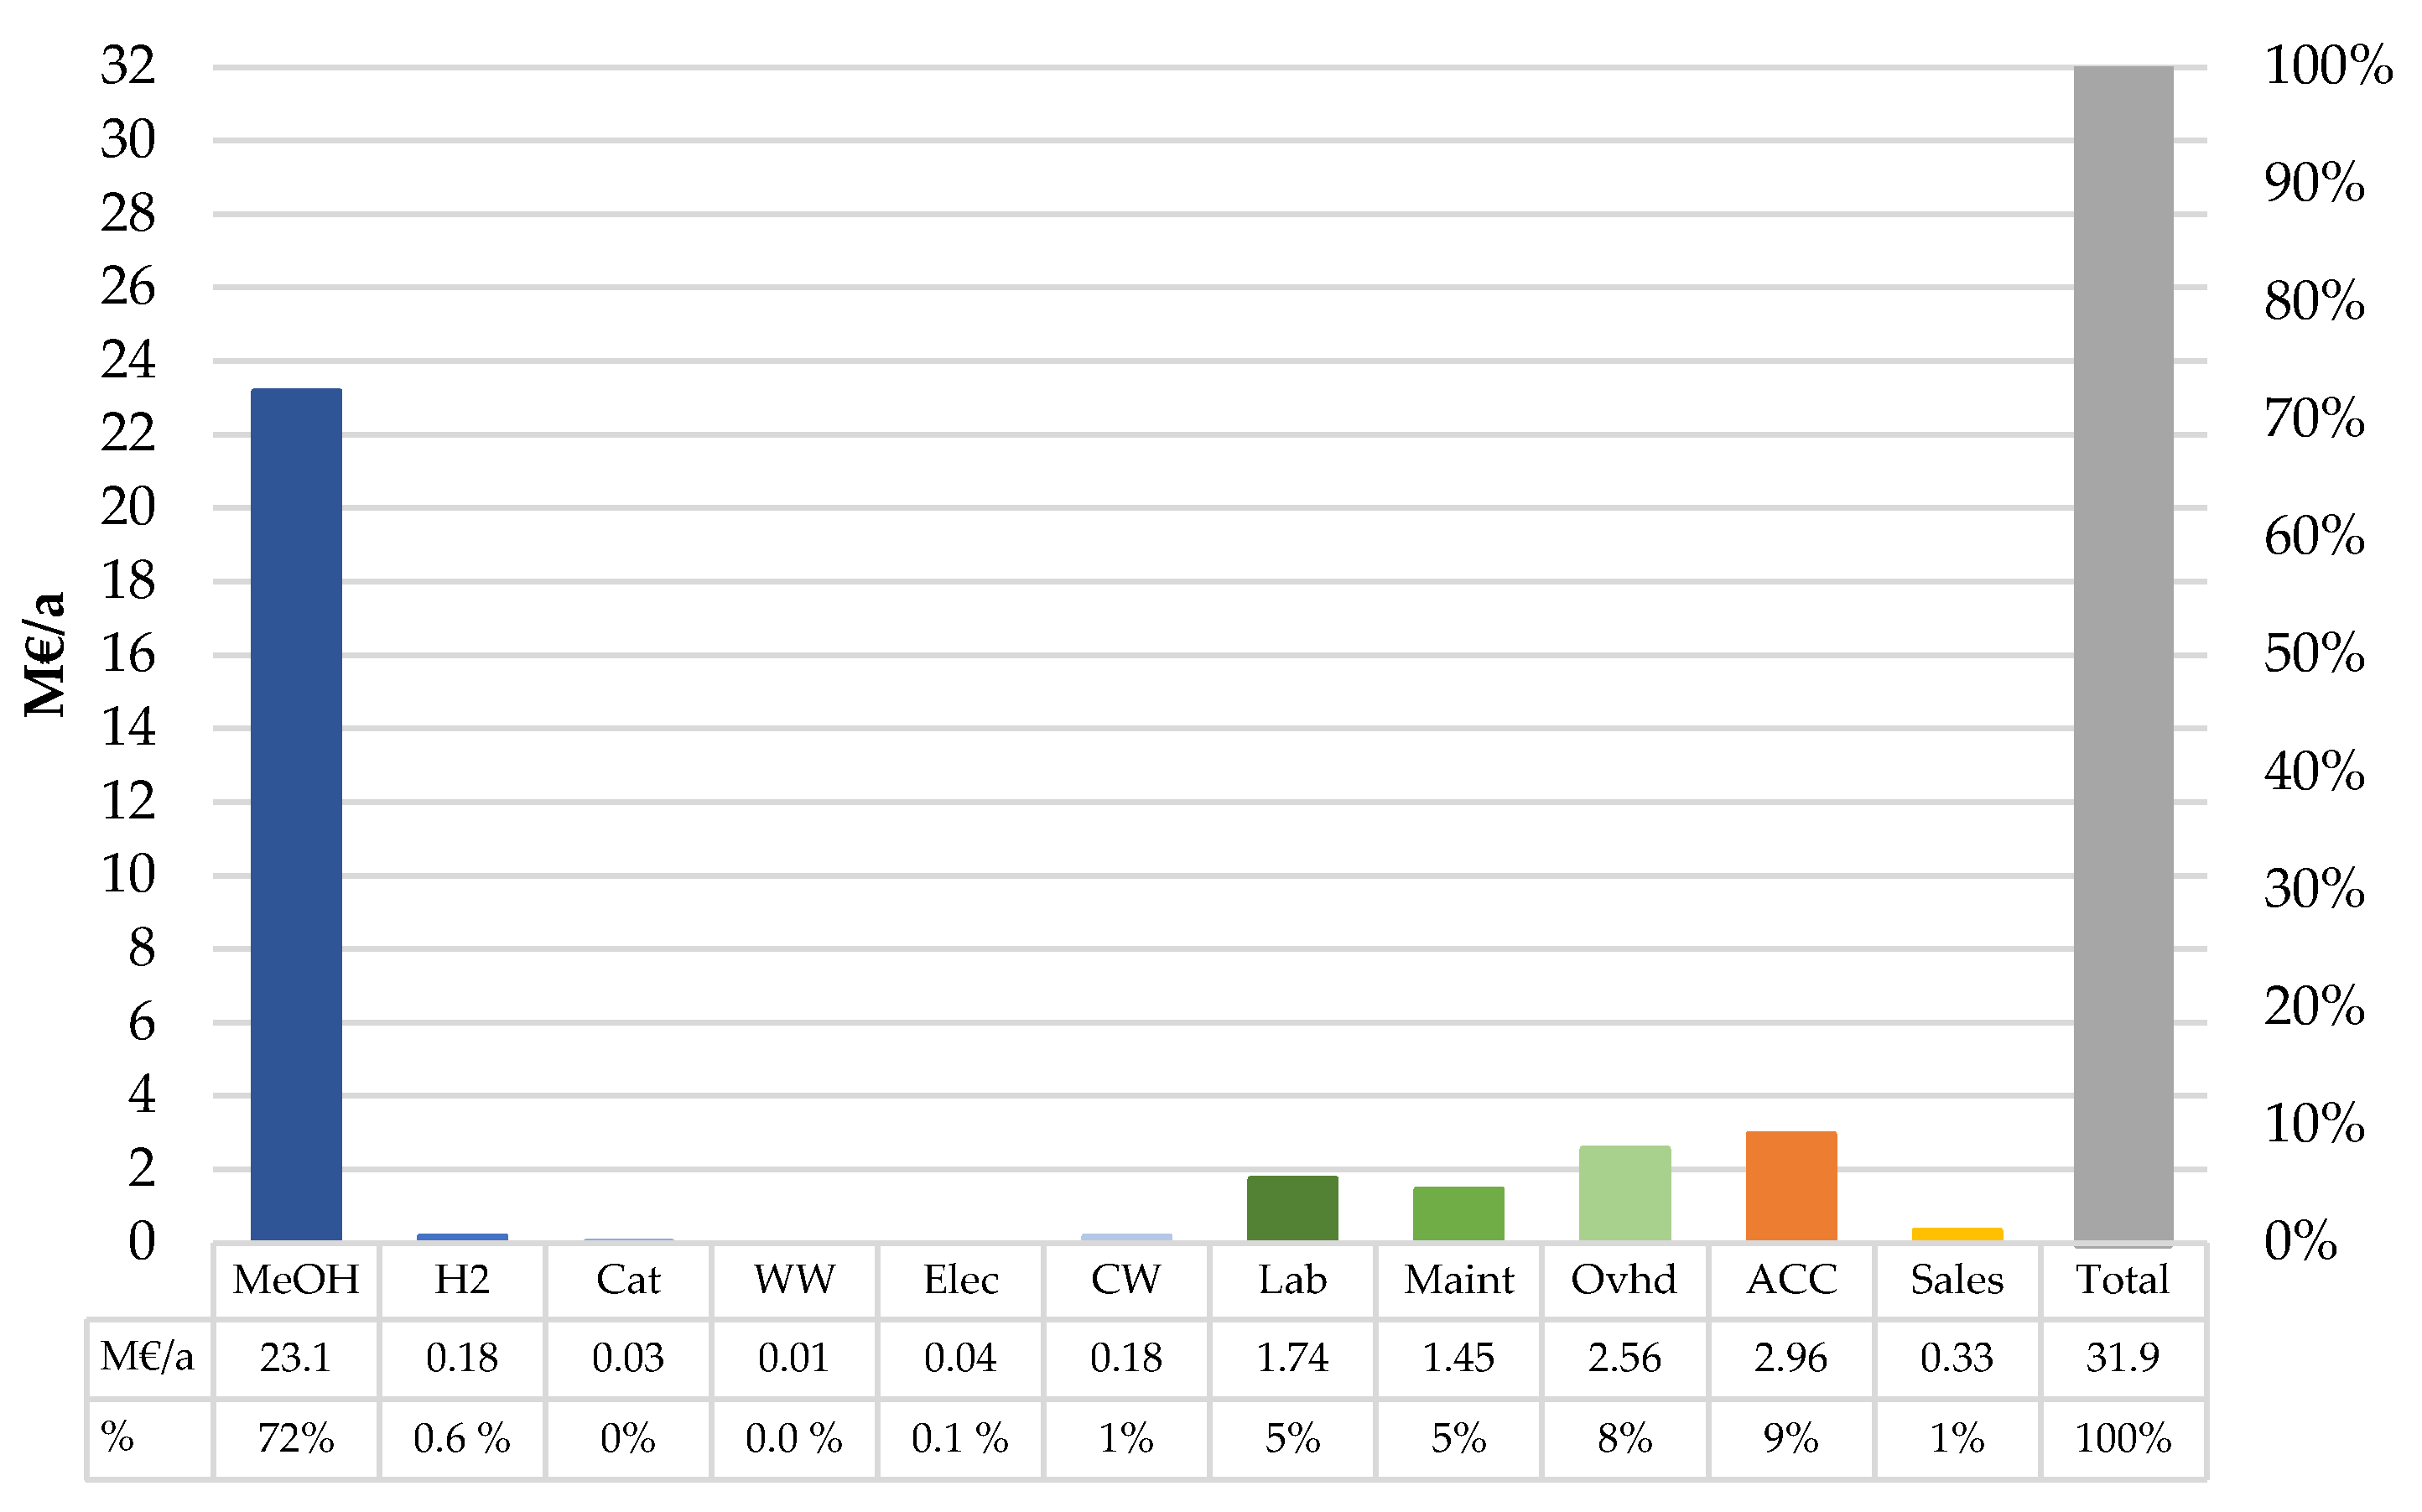
2.4.2. Cost of Production
The variable cost of production (VCOP), including the product and by-product revenues; costs associated with the raw materials, consumables, and utilities; and expenditure related to waste management, was calculated. The value for each cost factor is listed in
Table 2. Catalyst replacement was assumed to take place every two years, as suggested in the literature [
49]. A typical catalyst lifetime in hydrocarbon processing can be expected to vary between 1.5 and 3 years [
50,
51]. Assumptions for the fixed cost of production (FCOP) and profitability calculations are shown in
Table 3. The fixed production costs were estimated as outlined by Towler and Sinnott [
52]. The working capital of the plant can be estimated as a share of TFCC or based on the production rate. Towler and Sinnott [
53] recommend estimating working capital in the range of 5–30% of TFCC depending on the complexity of raw material inventory and final product storage. In this case, 5% working capital was chosen for the calculations. The investment in the form of working capital is recovered at the end of plant lifetime by liquidating inventories [
53]. The interest rate of the loan was estimated to be 2%, which corresponds to the rate of recent large corporate loans [
54]. The median debt ratio of the petroleum refining industry was 56% in the U.S. in 2019 [
55]. As production of MTO-MOGD fuels relies on novel technologies and has a higher financial risk, a debt ratio of 70% was assumed in the calculations. A 6% cost of equity was found to be reasonable when considering the small scale of the production plant. It was decided to neglect taxes as they would be paid by the company owning the plant.
Catalysts prices were estimated from foreign bulk order prices by including service fees from shipping, customs, and installation. The total price was determined by multiplying the bulk price by a factor of two to consider additional costs related to the acquisition of the catalysts. Prices of the fuel products were assumed to consist of the price of each fossil fuel and a premium price related to CO
2 emission reduction. A premium of 350 €/t, which is the highest price in the current European market [
59], was considered for each fuel product. Such fuel pricing would create competition between synthetic and biofuels in the low-emission fuel markets.


 ,
, 


