Article

CO2-Derived Carbon Capture Using Microalgae and Sodium Bicarbonate in a PhotoBioCREC Unit: Kinetic Modeling

by
Maureen Cordoba-Perez
1,2 and
Hugo de Lasa
1,*
1
Chemical Reactor Engineering Center, Department of Chemical and Biochemical Engineering, Faculty of Engineering, Western University, London, ON N6A 5B9, Canada
2
Department of Chemical Engineering, University of Costa Rica, San Jose 11501-2060, Costa Rica
*
Author to whom correspondence should be addressed.
Processes 2021, 9(8), 1296; https://doi.org/10.3390/pr9081296
Submission received: 1 July 2021 / Revised: 22 July 2021 / Accepted: 23 July 2021 / Published: 27 July 2021

Abstract

:
By converting bicarbonates via Chlorella vulgaris photosynthesis, one can obtain valuable biofuel products and find a route toward carbon-derived fossil fuel conversion into renewable carbon. In this research, experiments were carried out in the PhotoBioCREC prototype under controlled radiation and high mixing conditions. Sodium bicarbonate (NaHCO3) was supplied as the inorganic carbon-containing species, at different concentrations, in the 18 to 60 mM range. Both the NaHCO3 concentrations and the organic carbon concentrations were quantified periodically during microalgae culture, with the pH being readjusted every day to the 7.00 level. It was found that sodium bicarbonate was converted with a selectivity up to 33.0% ± 2.0 by Chlorella vulgaris. It was also observed that the reaction rate constant for inorganic carbon conversion was 0.26 ± 0.09 day 1 , while the maximum reaction rate constant for organic carbon formation was achieved with a 28 mM NaHCO3 concentration and displayed a 1.18 ± 0.05 mmole   L 1 day 1 value.

1. Introduction

Innovative processes are required to reduce the use of fossil fuels and promote the consumption of anthropogenic carbon dioxide (CO2). It is broadly acknowledged that terrestrial plants can only capture a fraction of the CO2 produced in electricity power plants and transportation vehicles, via photosynthesis. Some microorganisms, such as microalgae, can perform enhanced photosynthesis in specially designed reactors [1], contributing very effectively to CO2 capture [2]. The produced microalgae frequently designated as biomass is an attractive feedstock for biofuel and/or energy production in carbon-neutral processes [3,4].
The culturing of microalgae in either an open pond or a closed photobioreactor requires the supply of inorganic carbon. This can be done by using gaseous CO2 directly from a combustion process or alternatively by using soluble carbonates (i.e., bicarbonates). The latter option has the advantage of providing carbon-containing species of high solubility in water (i.e., 9.6 g of NaHCO3/100 g of water versus 0.1688 g of CO2/100 g of water, at 20 °C and atmospheric pressure [5]), while allowing carbon to be incorporated in the microalgae cell structure as organic carbon [6,7]. Thus, as the growth rates of microalgae are influenced by the availability of dissolved inorganic carbon species in the medium [8], the use of soluble carbonates species can result in a much higher carbon fixation efficiency [2]. Furthermore, one should note that there may be other factors affecting microalgae growth, including: (a) nutrients (i.e., nitrogen and phosphorous), (b) visible light, (c) mixing, (d) pH, and (e) temperature [9]. Therefore, all these microalgae growth parameters must be carefully controlled to achieve maximum efficiency in the carbon conversion into microalgae.
Despite the claimed advantages of carbon capture using microalgae, there are still important issues to be addressed, related to the scaling up of this process, such as the culture microalgae growth rate [10]. The lack of this information limits the commercialization of the microalgae growth technology [10]. To overcome this, the optimization of microalgae growth has to be accomplished through a better understanding of the interaction between reaction rate, visible light radiation, and absorption and media hydrodynamics [11].
Regarding kinetic models for microalgae growth published in the technical literature, the Monod model is widely used to predict the specific microorganism growth rate, under light saturation conditions [12,13,14,15]. Later, in other studies, growth rate modifications have been reported, including growth inhibition, due to both the lack of nutrients or nutrient concentrations that are too high [16,17,18]. Kumar and Das [19] and Chang et al. [20] used the logistic equation (Equation (1)), as first proposed by Verhulst (1844) and Pear and Reed (1920), to explain the different phases of the microalgae growth (lag, exponential, and stationary) with this rate being postulated as independent of the substrate concentration [17,19,20]:
d X d t = K C X ( 1 X X m a x )
where X represents the dry cell weight (g L−1), X m a x is the maximum dry cell weight (g L−1), and K C stands for the apparent specific growth rate of the microalgae (day−1).
Regarding the microalgae growth rate, few studies have determined algae growth kinetic parameters, including the effect from inorganic carbon concentration from bicarbonate solutions. The focus has been on the use of gaseous CO2 [13,21].
Table A1 reports a summary of the kinetic models available in the technical literature [2,12,13,14,19,20,22,23], highlighting the main issues considered: (a) the effect of mixing and radiation absorption, (b) the quantum yield evaluation, (c) the kinetic model development with the simultaneous measurement of total organic carbon (TOC) formed, and (d) the inorganic carbon substrate consumed.
One can notice in Table A1 that even if these proposed kinetics can be considered valuable as first approximations, they still lack the following: (a) the development of macroscopic irradiation energy balances, (b) the assessment of carbon balances, (c) a critical review of kinetic model assumptions applicability, and (d) the determination of kinetic parameters using statistical indicators.
Given the above, the present study focused on rigorously establishing phenomenologically based growth kinetics for CPCC90 Chlorella vulgaris. The selectivity reported for Chlorella vulgaris and the resulting kinetic model are original and have not been previously reported. These growth kinetics were established for a wide range of bicarbonate concentrations. They adequately predicted both bicarbonate and organic carbon concentrations at various culture times, while effectively determining the efficiency of inorganic carbon conversion into microalgae biomass.

2. Materials and Methods

2.1. Microalgae Strain and Medium

The green algae CPCC90 Chlorella vulgaris obtained from the Canadian Phycological Culture Centre (CPCC) of the University of Waterloo, Canada was used throughout the experiments. A modified Bold Basal Medium (BBM) was employed to grow the microalgae with different concentrations of sodium bicarbonate (NaHCO3). As reported previously [1], the medium purchased from CPCC was sterile and ready to be used. The composition of the medium was (g/L): 0.175 KH2PO4, 0.025 CaCl2·2H2O, 0.075 MgSO4·7H2O, 0.25 NaNO3, 0.075 K2HPO4, 0.025 NaCl, 0.01 Na2EDTA·2H2O, 0.0062 KOH, 0.00498 FeSO4·7H2O, and 0.00805 H3BO3, and contained a trace metal solution with 2.86 g/L of H3BO3, 1.81 g/L of MnCl2·4H2O, 0.222 g/L of ZnSO4·7H2O, 0.390 g/L of Na2MoO4·2H2O, 0.079 g/L of CuSO4·5H2O, and 0.0494 g/L of Co(NO3)2·6H2O.

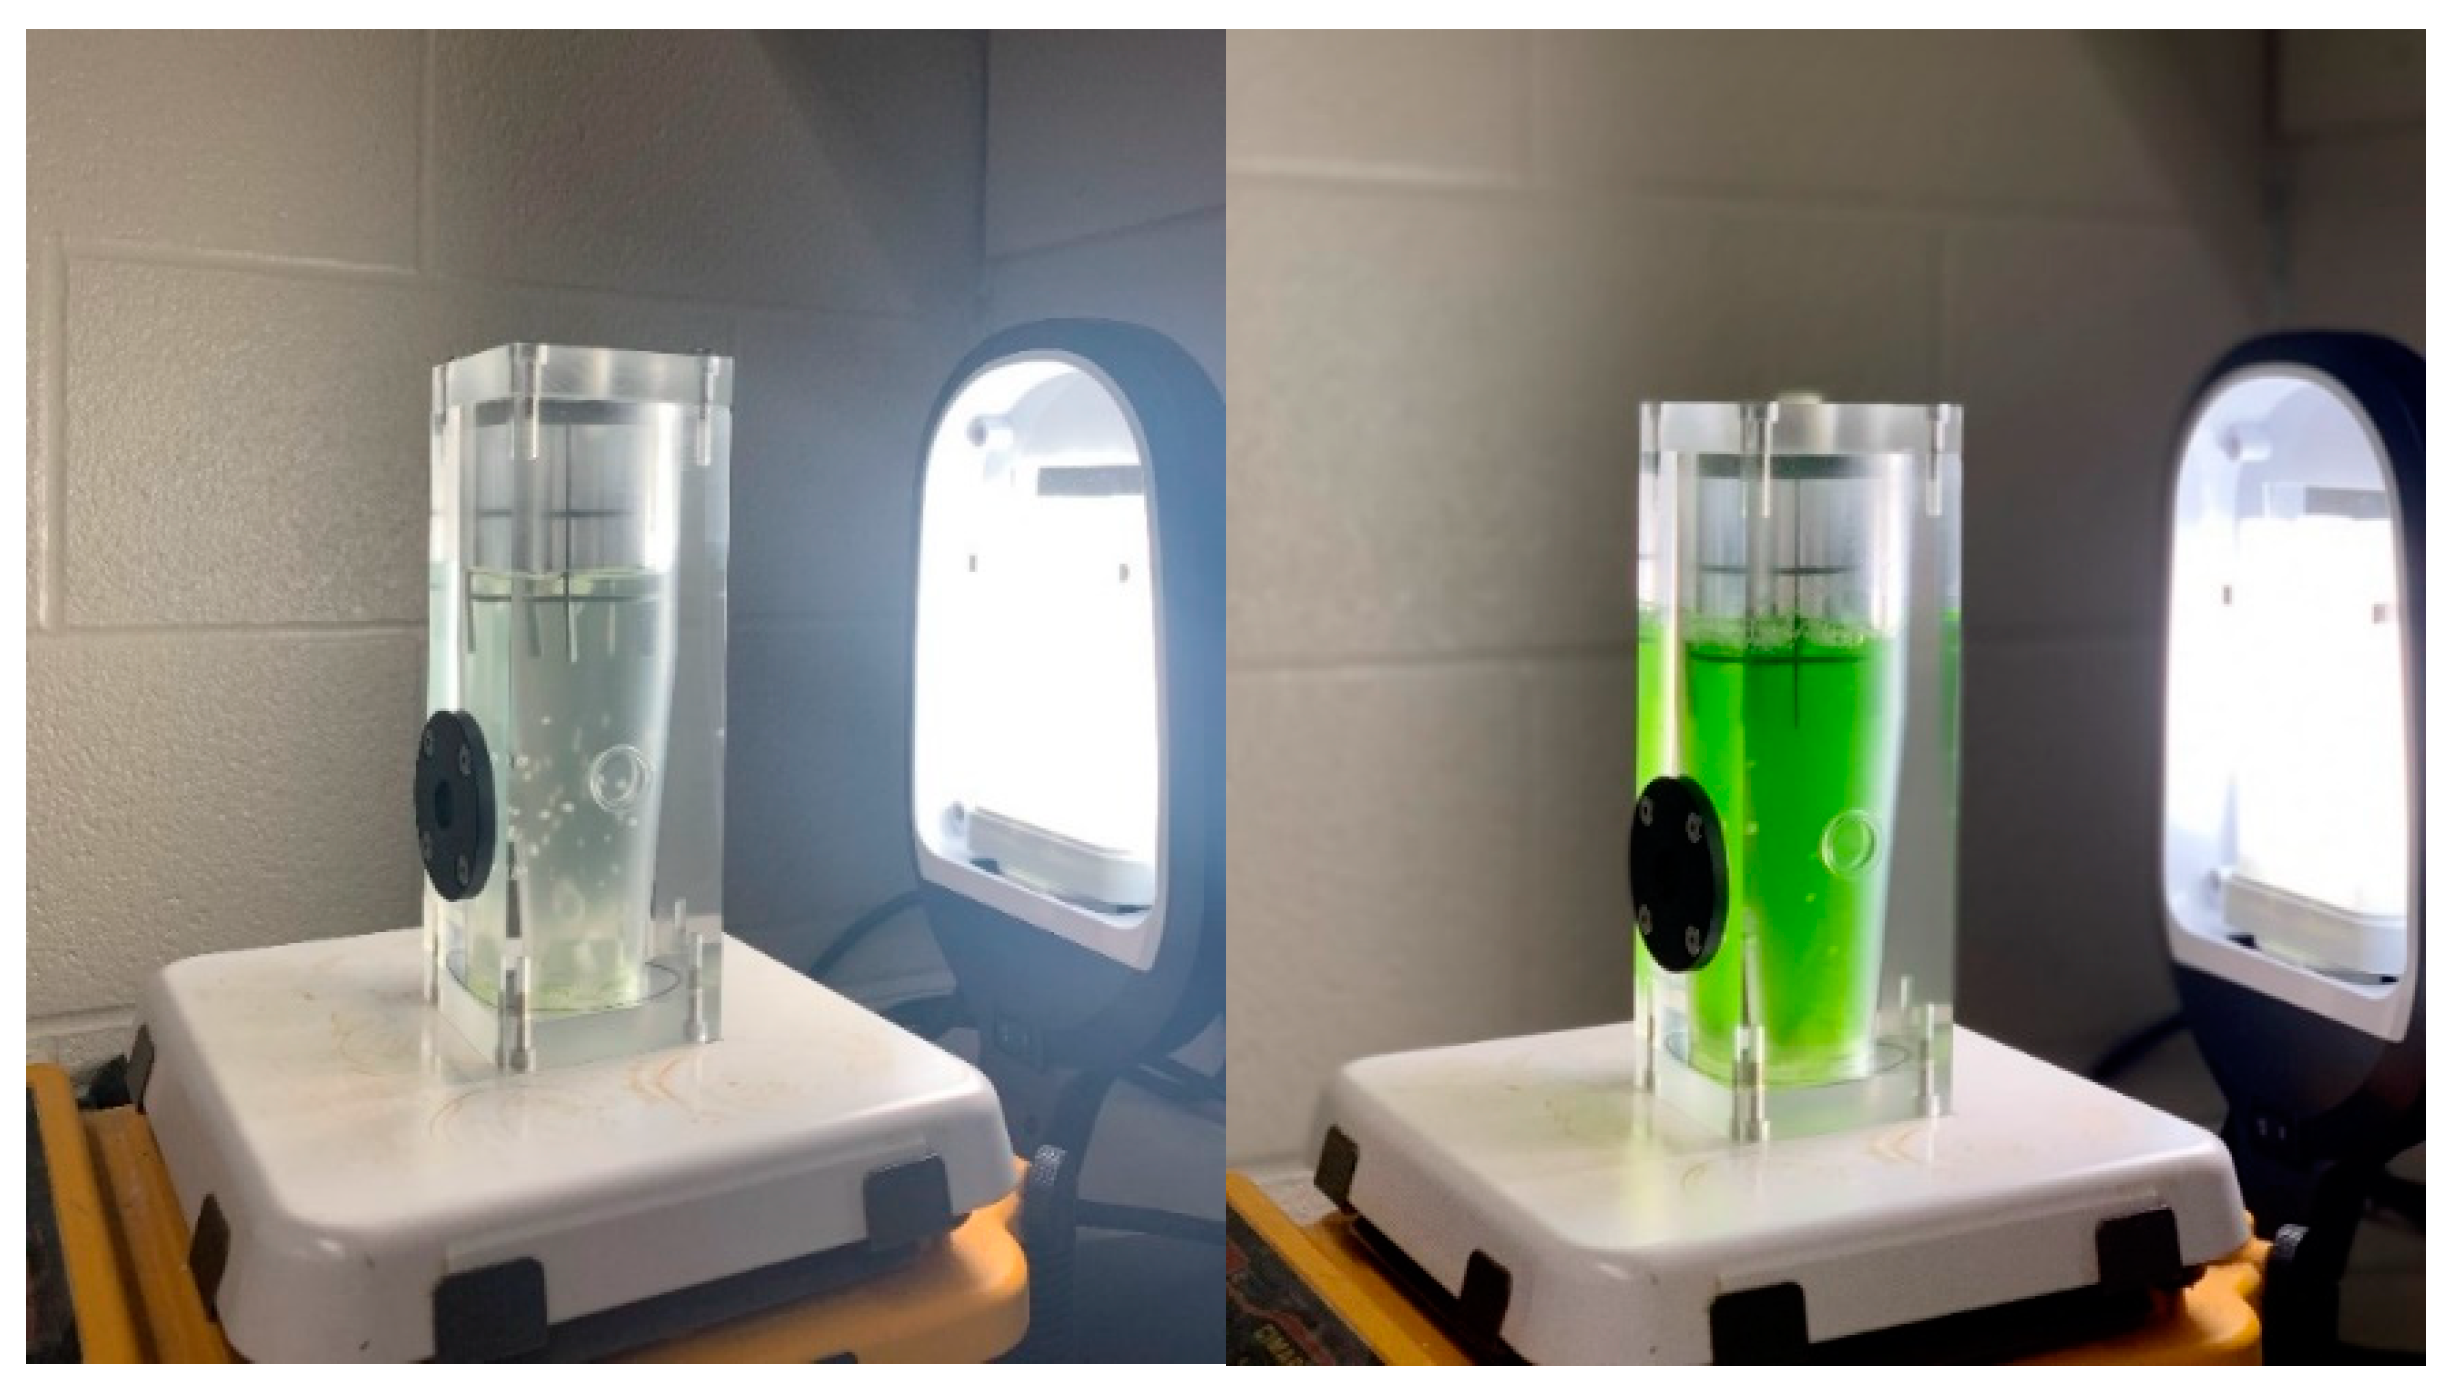
2.2. Experimental Setup

A detailed explanation of the PhotoBioCREC prototype used in this research was already reported previously by us [1]. The PhotoBioCREC of the present study was specifically designed to carry out the experiments using the CPCC90 Chlorella vulgaris at the Chemical Reactor Engineering Center (CREC) at the University of Western Ontario. The PhotoBioCREC has a semiconical shape in the lower section, which promotes a vortex flow and prevents the formation of dead zones. Moreover, it has vertical baffles that complement the mixing provided by a cross-magnetic stirrer, placed in the bottom section of the photobioreactor. The described vertical baffles increase both the mixing and turbulence. Photos of the PhotoBioCREC prototype with microalgae CPCC90 Chlorella vulgaris are presented in Figure 1.
To determine the kinetic parameters of carbon fixation, experiments with CPCC90 Chlorella vulgaris, grown in BBM with four different nominal concentrations of NaHCO3, were developed in a 175 mL volume solution capacity unit. The nominal concentrations of NaHCO3 tested were 18, 28, 40, and 60 mM. Three repeats for each experimental run were effected for each concentration studied. Thus, all reported concentrations in the present article are average values, with their respective reported standard deviations.
Furthermore, the pH of the culture was monitored and re-adjusted to the value of 7.00, every 24 h, by employing both hydrochloric acid (HCl) at a 1.0 mol/L concentration and sodium hydroxide (NaOH) at a 1.0 mol/L concentration, as required. A cool white fluorescent lamp provided the radiation energy required by the culture for a period of 12 h. This was followed by a dark cycle of 12 h. This was performed to simulate the eventual expected cycles of visible light (day and night) that could be used to irradiate the culture in equatorial-region countries, such as Costa Rica. The temperature in the photobioreactor was 24.6 ± 0.8 °C. A magnetic stirrer was used to provide mixing at 700 rpm [1]. The quantification of organic and inorganic carbon, pH, and transmitted irradiation was performed daily. In addition, during operation, suspended 1–2 mm diameter alumina particles were added to the culture system to keep the reactor walls clean and without microalgae deposition. It was found that 0.3 g of alumina particles in a 175 mL microalgae culture (0.05% volume concentration) was adequate to achieve this objective, with only a 5% reduction in the prototype-transmitted visible light [1].

2.3. Analytical Methods

The analytical methods used in the present study were reported in a previous publication of our research team [1]. Samples were taken every 24 h, to monitor the culture growth, by quantifying the total organic carbon (TOC) produced, using a TOC-Shimadzu analyzer VCPH. Using this approach, it was considered that the approximate amount of carbon involved in the culture growth, due to the soluble microbial products, was negligible, in comparison with all other organic species contained in the cells. This is in agreement with results reported by Babaei and Mehrnia [24]. Prior to the TOC analysis, samples were pretreated with 2.0 mol/L of HCl and sparged with nitrogen for 10 min, to eliminate the inorganic carbon present. Moreover, the inorganic carbon concentration at various culture times was determined via titration with a Digital pH meter Thermo Scientific Orion Star (Canada). The titration endpoint was determined using a pH derivative plot [25].

2.4. Inorganic Carbon Conversion Efficiency

The efficiency in the utilization of inorganic carbon by the CPCC90 Chlorella vulgaris can be reported as carbon conversion. This efficiency can be expressed as the ratio of the moles of organic carbon produced over the initial moles of inorganic carbon:
η = m o l e s   o f   o r g a n i c   c a r b o n   p r o d u c e d m o l e s   o f   i n i t i a l   i n o r g a n i c   c a r b o n   * 100

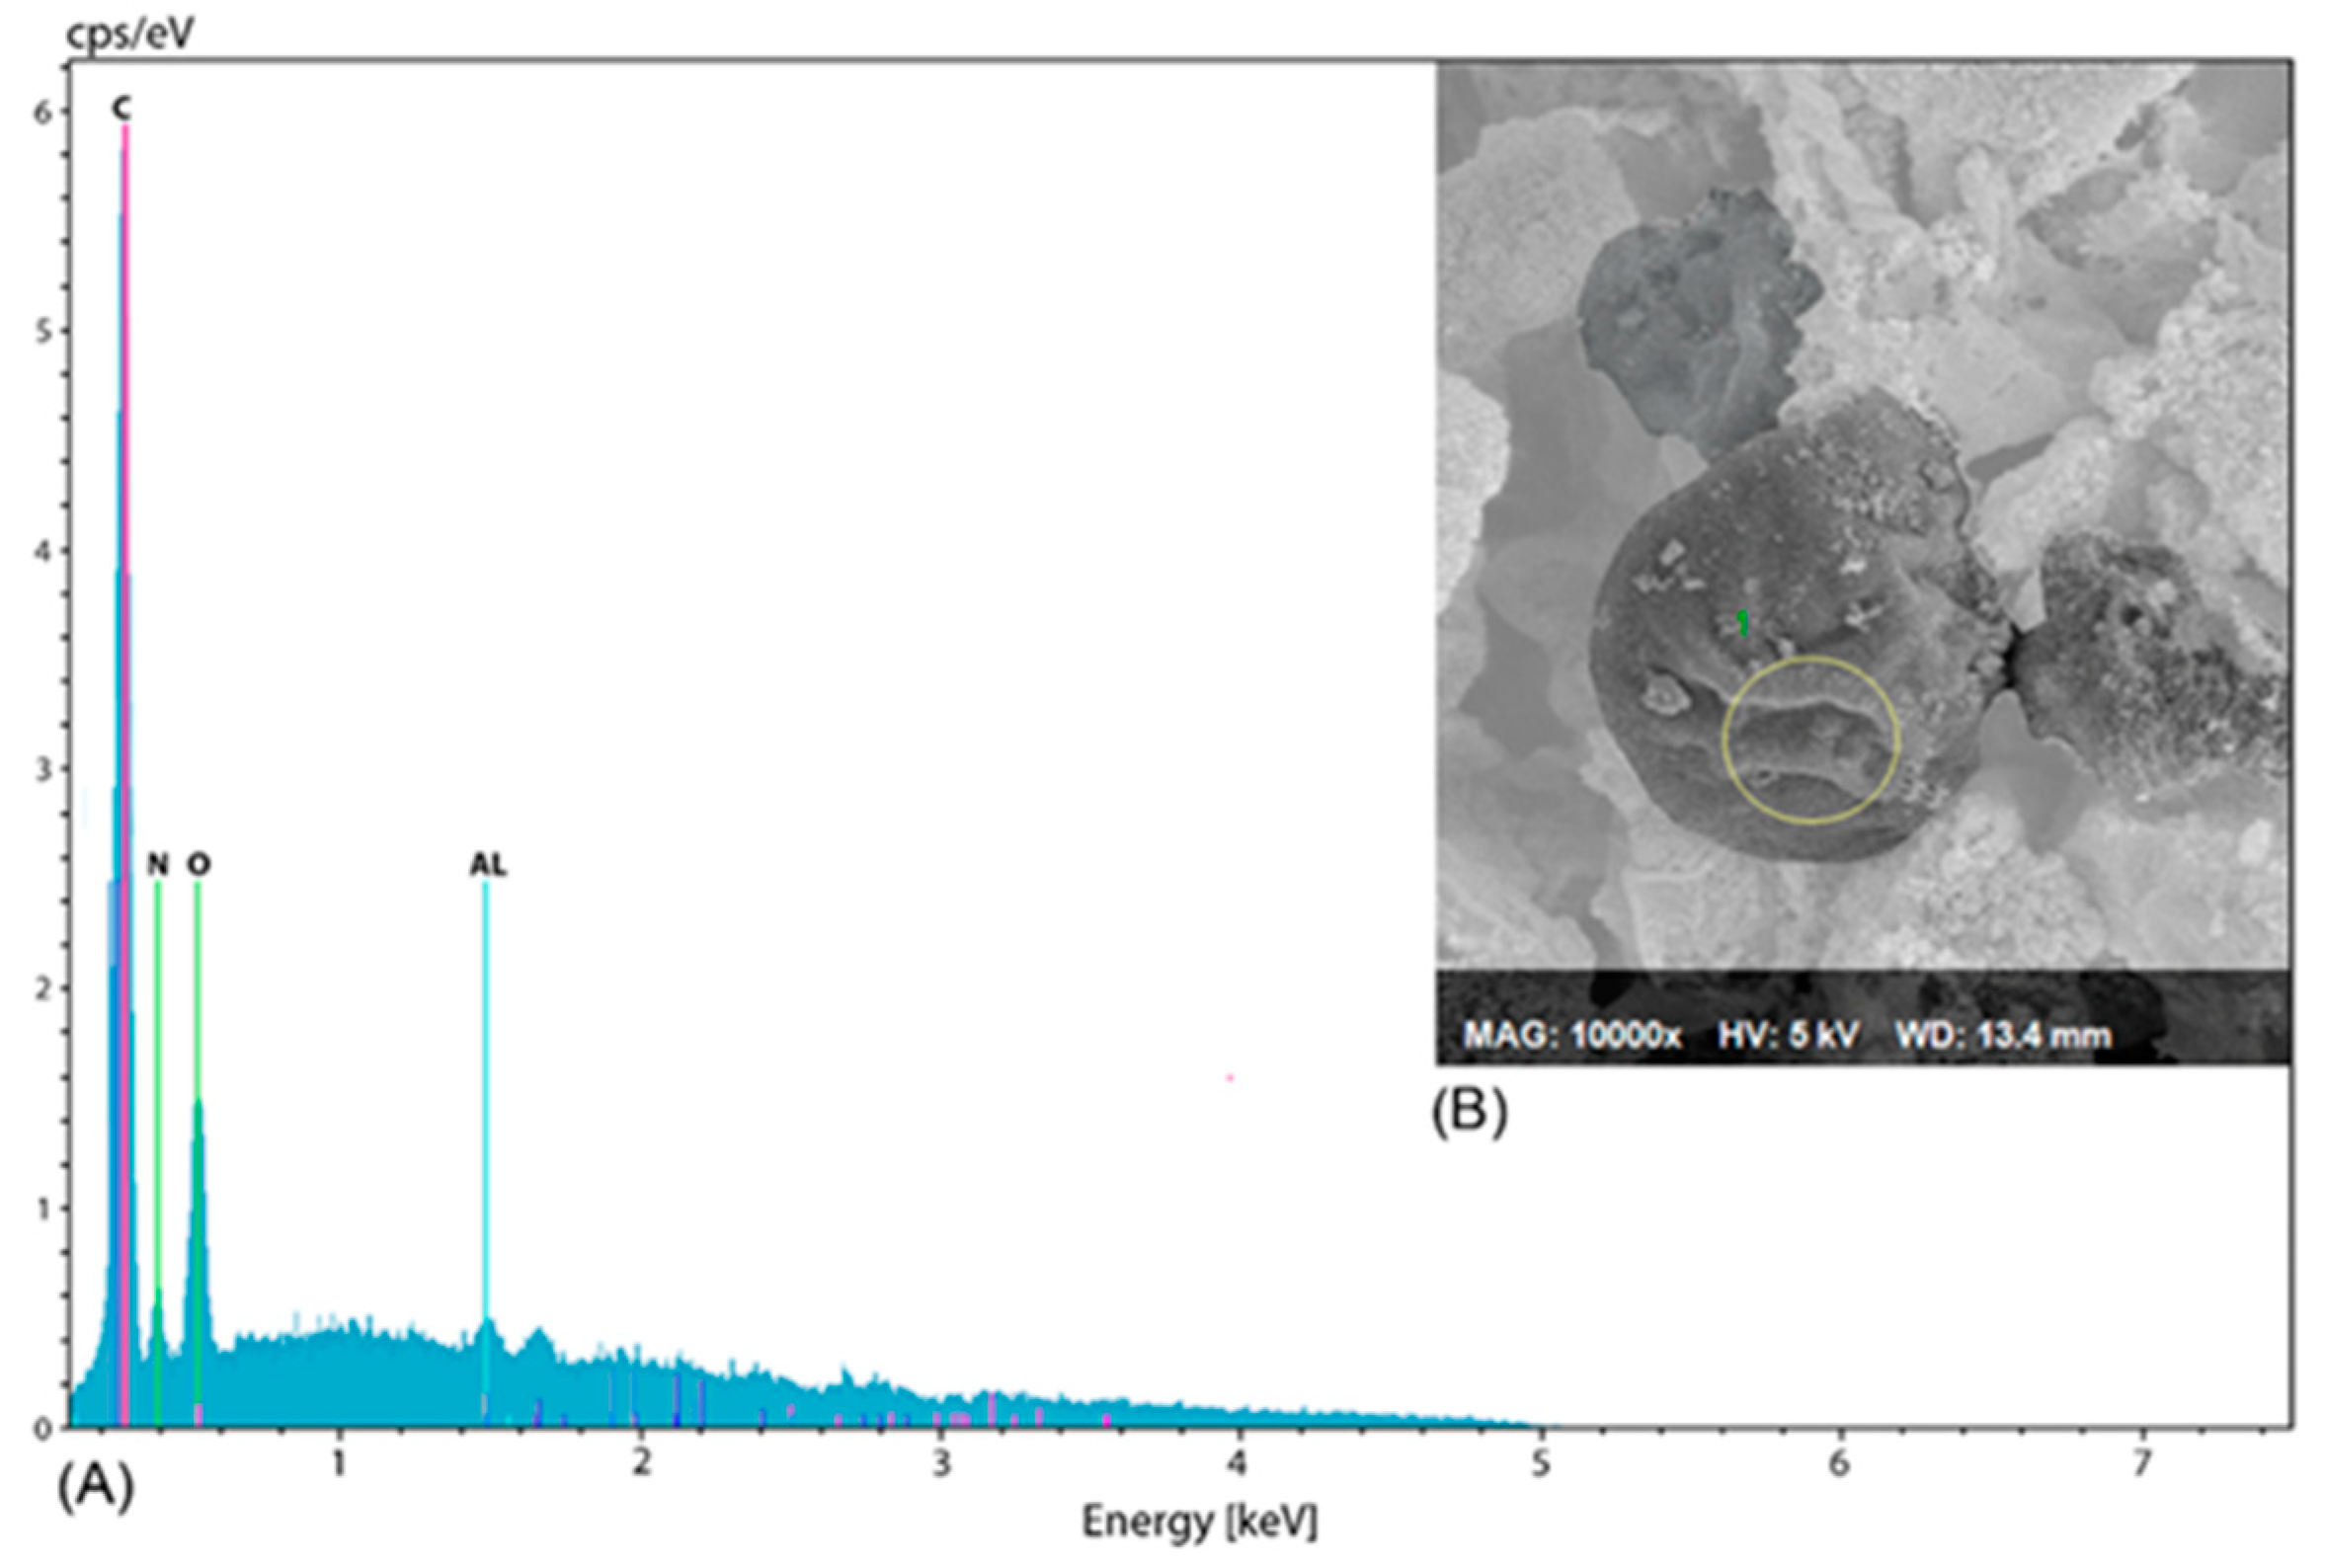
2.5. Microalgae Characterization

The characterization of microalgae was obtained through the analysis of the cells, by quantifying their components using combined elemental analyzer/isotope ratio mass spectrometry and energy-dispersive X-ray spectroscopy (EDX). Microalgae CPCC60 Chlorella vulgaris cell sizes were analyzed using the microscope Z1 Imager by Zeiss.
The image analysis was complemented with a scanning electron microscope (SEM) analysis. This involved treating samples with 1% glutaraldehyde (in BBM) for 2.5 days at 4 °C. The resulting cells were washed with a BBM buffer. Biomass was treated with osmium vapor for 1 h. After that, filtered biomass was rinsed with water to eliminate the osmium and then dehydrated with ethanol at different concentrations (30% to 100%). The ethanol-dehydrated samples were dried using a Critical Point Dryer followed by the needed coating for the SEM analysis [26].
Furthermore, algal biomass was recovered by centrifugation in order to quantify carbon, hydrogen, nitrogen, and sulfur atomic weight fractions. Three centrifugation cycles were performed to concentrate the biomass, which was then washed with distilled water to remove any nutrients [27]. Following centrifugation and washing, the biomass was freeze-dried to retain an unaltered sample before proceeding to analysis quantification.

3. Modeling Algae Growth

As mentioned previously, inorganic carbon species can be fed to the PhotoBioCREC unit, as bicarbonates. These species can be converted, in principle, into organic carbon as microalgal biomass, CO2, sodium carbonate, and sodium hydroxide. As a result, an overall bicarbonate conversion stoichiometry can be considered as follows:
2 N a H C O 3 α C H a O b ( b i o m a s s ) + β C O 2 + ω N a 2 C O 3 + φ N a O H + υ H 2 O
where α ,   β ,   ω ,   φ , and υ are, respectively, the stochiometric coefficients for organic carbon as biomass, for CO2, for sodium carbonate, for sodium hydroxide, and for water (see Appendix B and Appendix C for details of parameters’ determination).
On this basis, a kinetic model can be established based on sound assumptions, using the PhotoBioCREC unit data [1]:
(a)
Algal growth takes places in a well-mixed PhotoBioCREC unit. This is considered adequate given the high mixing, which is the result of the important axial and circumferentially promoted fluid motion in this unit.
(b)
The incident irradiation passing through the flow media, containing the suspended alumina particles, remains steady during the entire algal growth period. This is achieved because of the self-cleaning walls promoted by the circumferential motion of the alumina particles in the region close to the wall.
As a result, under these conditions, one can postulate with confidence that the changes in bicarbonate moles comply with the following species balance:
d N i n d t = r i n V f = k i n C i n n V f
where N i n represents the moles of inorganic carbon, r i n is the molar rate of inorganic carbon consumption, C i n denotes the molar concentration of inorganic species, and V f stands for the liquid hold-up in the PhotoBioCREC.
Assuming that the V f is constant, given the unchanged fluid level, and the steady visible radiation provided to the PhotoBioCREC, Equation (4) becomes Equation (5), as follows:
d C i n d t = k i n C i n n
where k i n represents the kinetic constant for the conversion of inorganic carbon species, fed as bicarbonates.
Regarding Equation (5), one can also mention, as shown later in the present study, that the sodium bicarbonate concentration displays a first-order decay ( n = 1 ), which is an expected order of reaction for a unimolecular species consumption.
Furthermore, while sodium bicarbonate consumption progresses, microalgae steadily forms, during a designated “growth phase.” Throughout this period, the CPCC90 Chlorella vulgaris growth can be described, using as a basis the total organic carbon (TOC), as follows:
d N o r g d t = r o r g V f = k o r g C i n m θ v V f
d C o r g d t = k o r g C i n m θ v
where θ v represents the microalgae matrix sites susceptible to reacting with bicarbonate inorganic molecules in a condensation reaction with the m reaction order set to 1. Moreover, k o r g is the reaction rate constant for total organic carbon formation.
Furthermore, and if the bicarbonate carbon-containing species interact with microalgae sites at equilibrium, a Monod type of model results as follows:
d C o r g d t = r o r g = k o r g C i n 1 + K C i n
Thus, Equations (5) and (8) can be used to describe the sodium bicarbonate concentration ( C i n ) changes, as well as the changes in microalgae-contained carbon concentration ( C o r g ) as defined using TOC.
In addition, one can also envisage that at K C i n 1 conditions, Equation (8) becomes a zero-order reaction. This applies for substrate concentrations at the high concentration levels used in the present study.
As a result, the following integrated form of Equations (5)–(8) can be proposed for CPCC90 Chlorella vulgaris culture in NaHCO3 solution media:
(a)
Inorganic carbon consumption:
C i n = C i n 0 e k i n t
(b)
Organic carbon formation:
C o r g = u ( t t l a g ) { k o r g , j ( t t l a g ) [ 1 u ( t t f ) ] + u ( t t f ) C o r g m a x }
with Equation (9) representing the decay of inorganic species, involving an exponential decay function; and Equation (10) representing a zero-order reaction, with a Heaviside function selected to represent the growth induction period, and the growth arrest time (Appendix D).
Furthermore, a ratio between the integrated form of Equation (7), evaluated at the maximum organic carbon concentration, and the initial inorganic carbon concentration can be established. One can obtain the maximum concentration of total organic carbon based on the initial inorganic carbon concentration as:
C o r g m a x C i n 0 = 1 C i n 0 k o r g ( t f t l a g ) = k o r g C i n 0 τ
with τ representing the growth phase time. The results obtained with Equation (11) and the parameters k o r g and τ are later presented in Section 4.2.

4. Results and Discussion

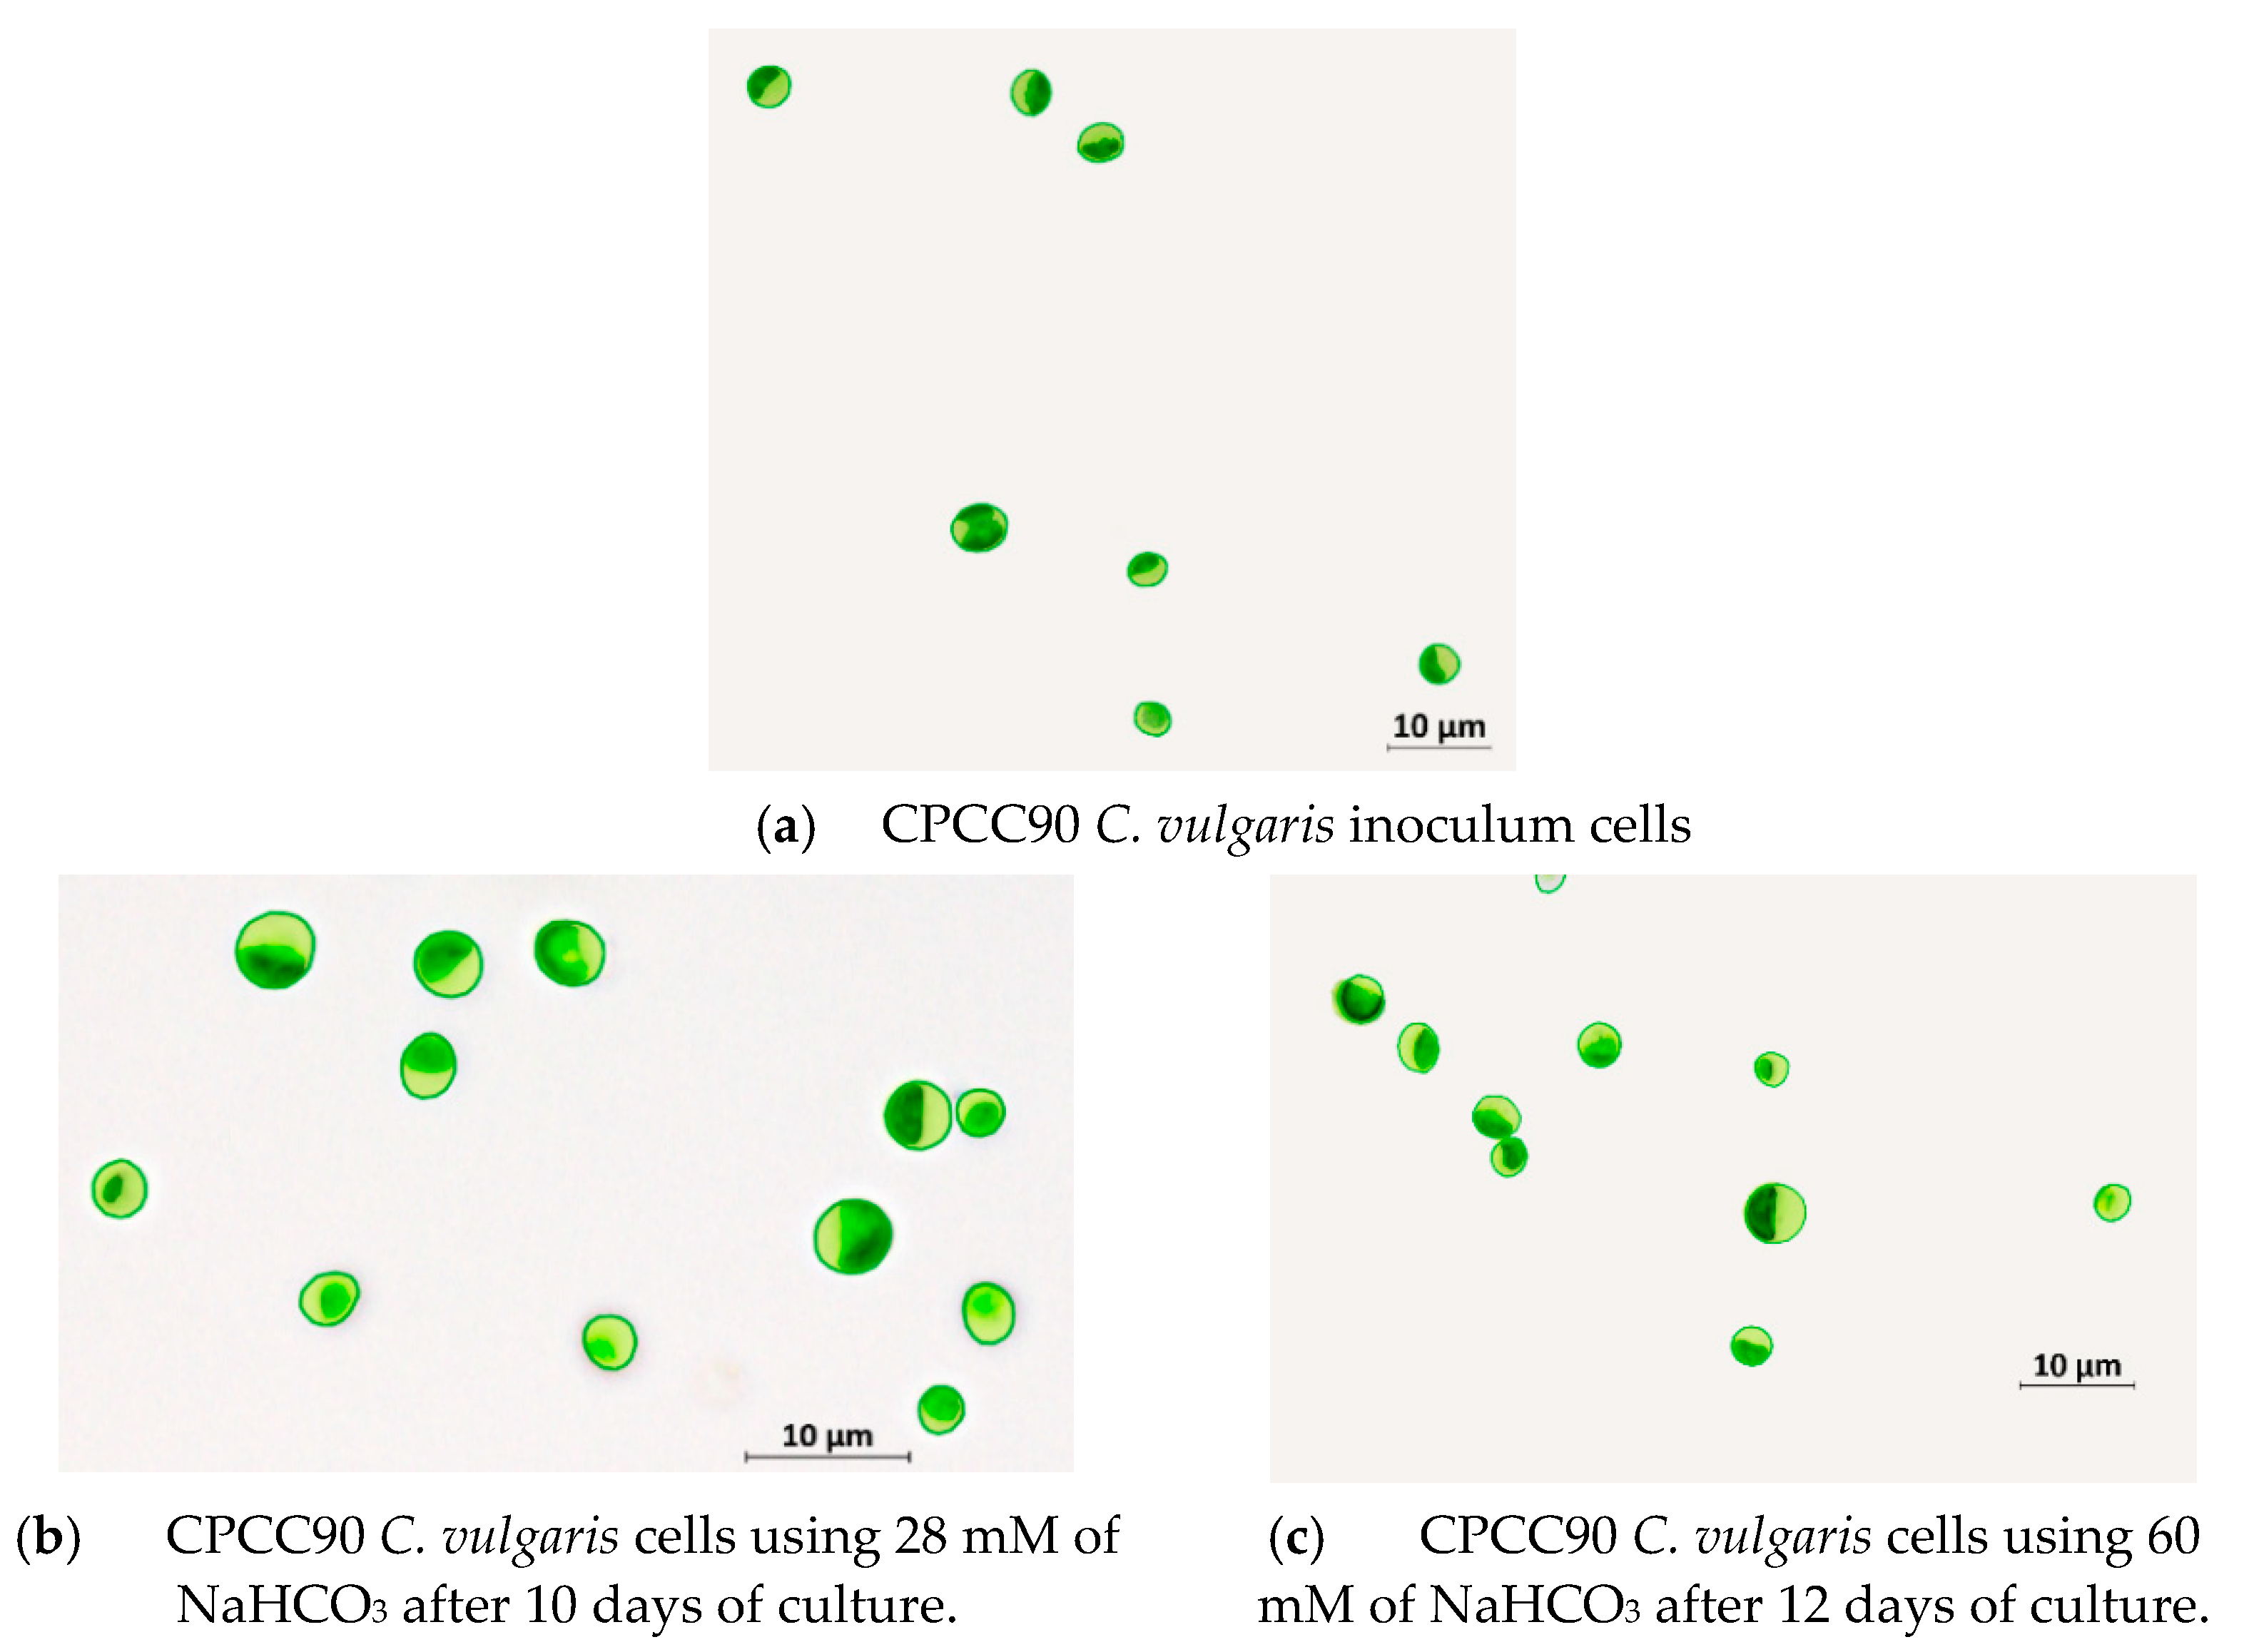
4.1. Cell Size and Biomass Composition

The CPCC90 Chlorella vulgaris cells were analyzed using a Zeiss Z1 Imager microscope. It was found that microalgae cells display a consistent quasi-spherical/ellipsoidal shape, with diameters ranging from 2 to 7 μm. This is in agreement with the data reported in the literature, where cell sizes for Chlorella vulgaris range from 2 to 10 μm [28].
Figure 2 reports the images of CPCC90 Chlorella vulgaris cells for the inoculum and for two initial inorganic carbon concentrations. One can observe that there is no significant change in the quasi-spherical/elliptical sizes, with average cell sizes consistently ranging from 4.0 to 6.0 μm with a ±0.8 μm standard deviation, as shown in the cell size distribution plot of Figure 3.
In addition, for experiments with 60 mM of NaHCO3, SEM images of the Chlorella vulgaris cells cultured in the PhotoBioCREC unit were taken after 12 days of cultivation. A typical recorded cell image is reported in Figure 4 with the corresponding EDX elemental composition of the Chlorella vulgaris biomass.
Thus, one can observe that the CPCC90 Chlorella vulgaris cells grown in the culture, as described in Equations (9) and (10), have characteristic ellipsoidal shapes, and are composed of C, H, S, and O, as determined via combined CHNS and EDX analysis and reported in Table 1.
Table 1 shows that the carbon, hydrogen, oxygen, and nitrogen elemental components of the CPCC90 Chlorella vulgaris of the present study agree with the data reported in the technical literature [29]. In particular, the observed nitrogen content in the CPCC90 C. vulgaris confirmed the expected protein content [30]. In addition, the reported low sulfur content in the CPCC90 C. vulgaris grown with NaHCO3 makes it a good biofuel feedstock [31] with low sulfur oxide emissions [30]. Finally, one can also notice the negligible sodium content in the CPCC90 C. vulgaris elemental analysis. This allows one to anticipate, consistent with Equation (3), the full sodium recycle in the CO2 capture process.
Thus, and on this basis, a proximate formula for CPCC90 Chlorella vulgaris biomass was established as C H 1.8 O 0.39 .

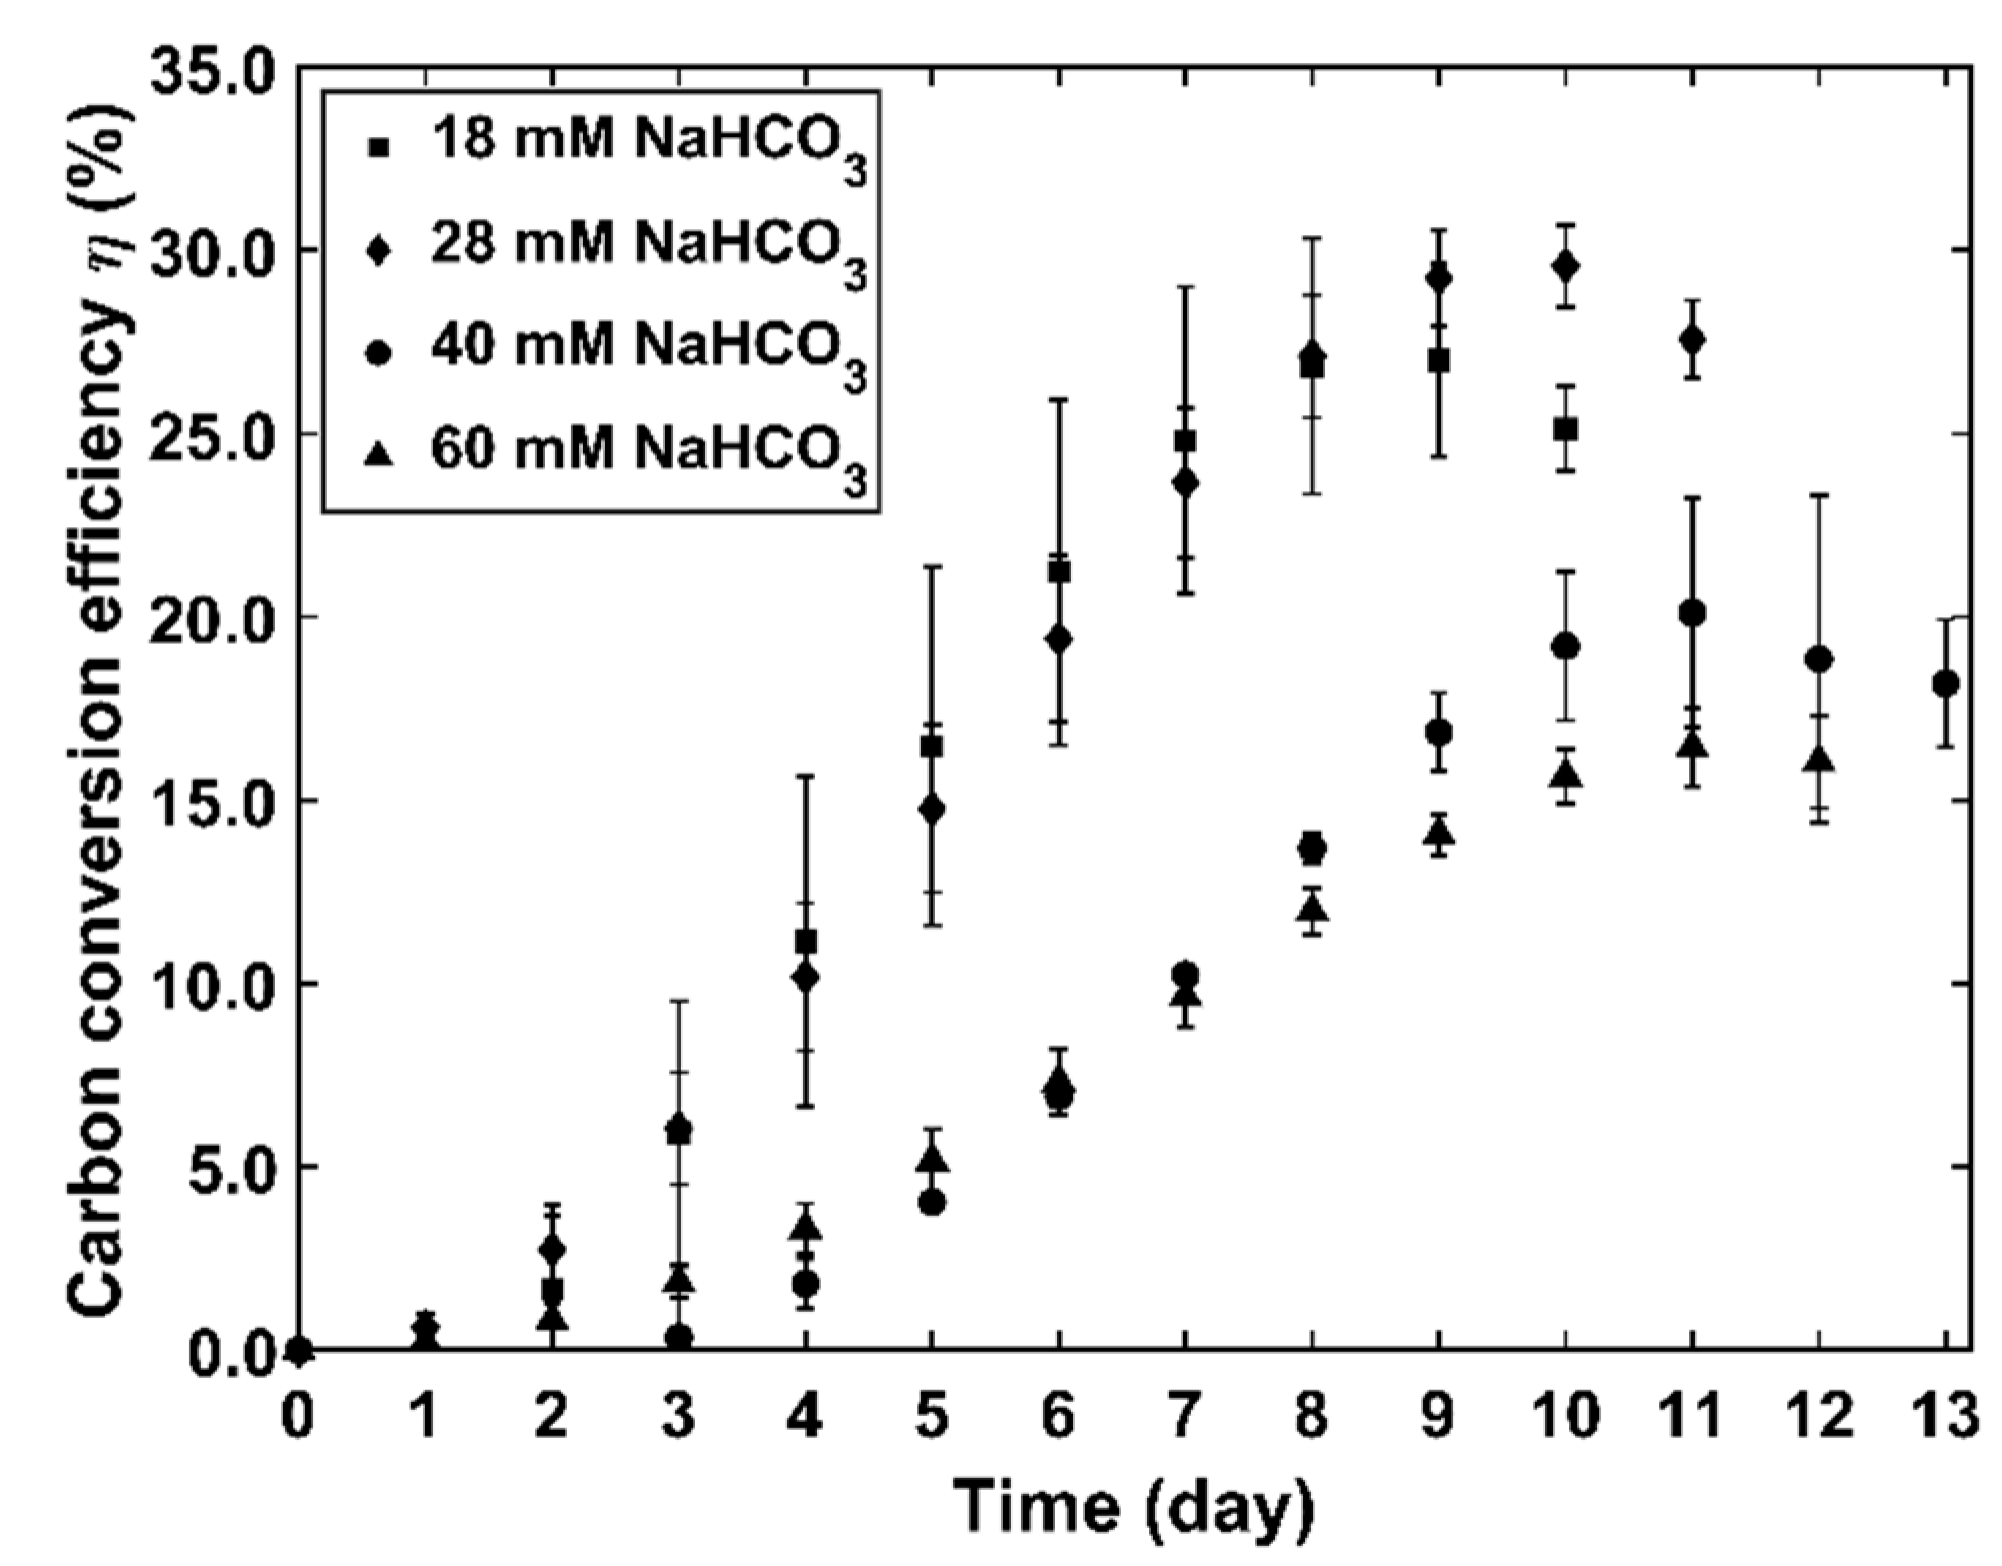
4.2. Inorganic Carbon Conversion and Kinetic Parameters
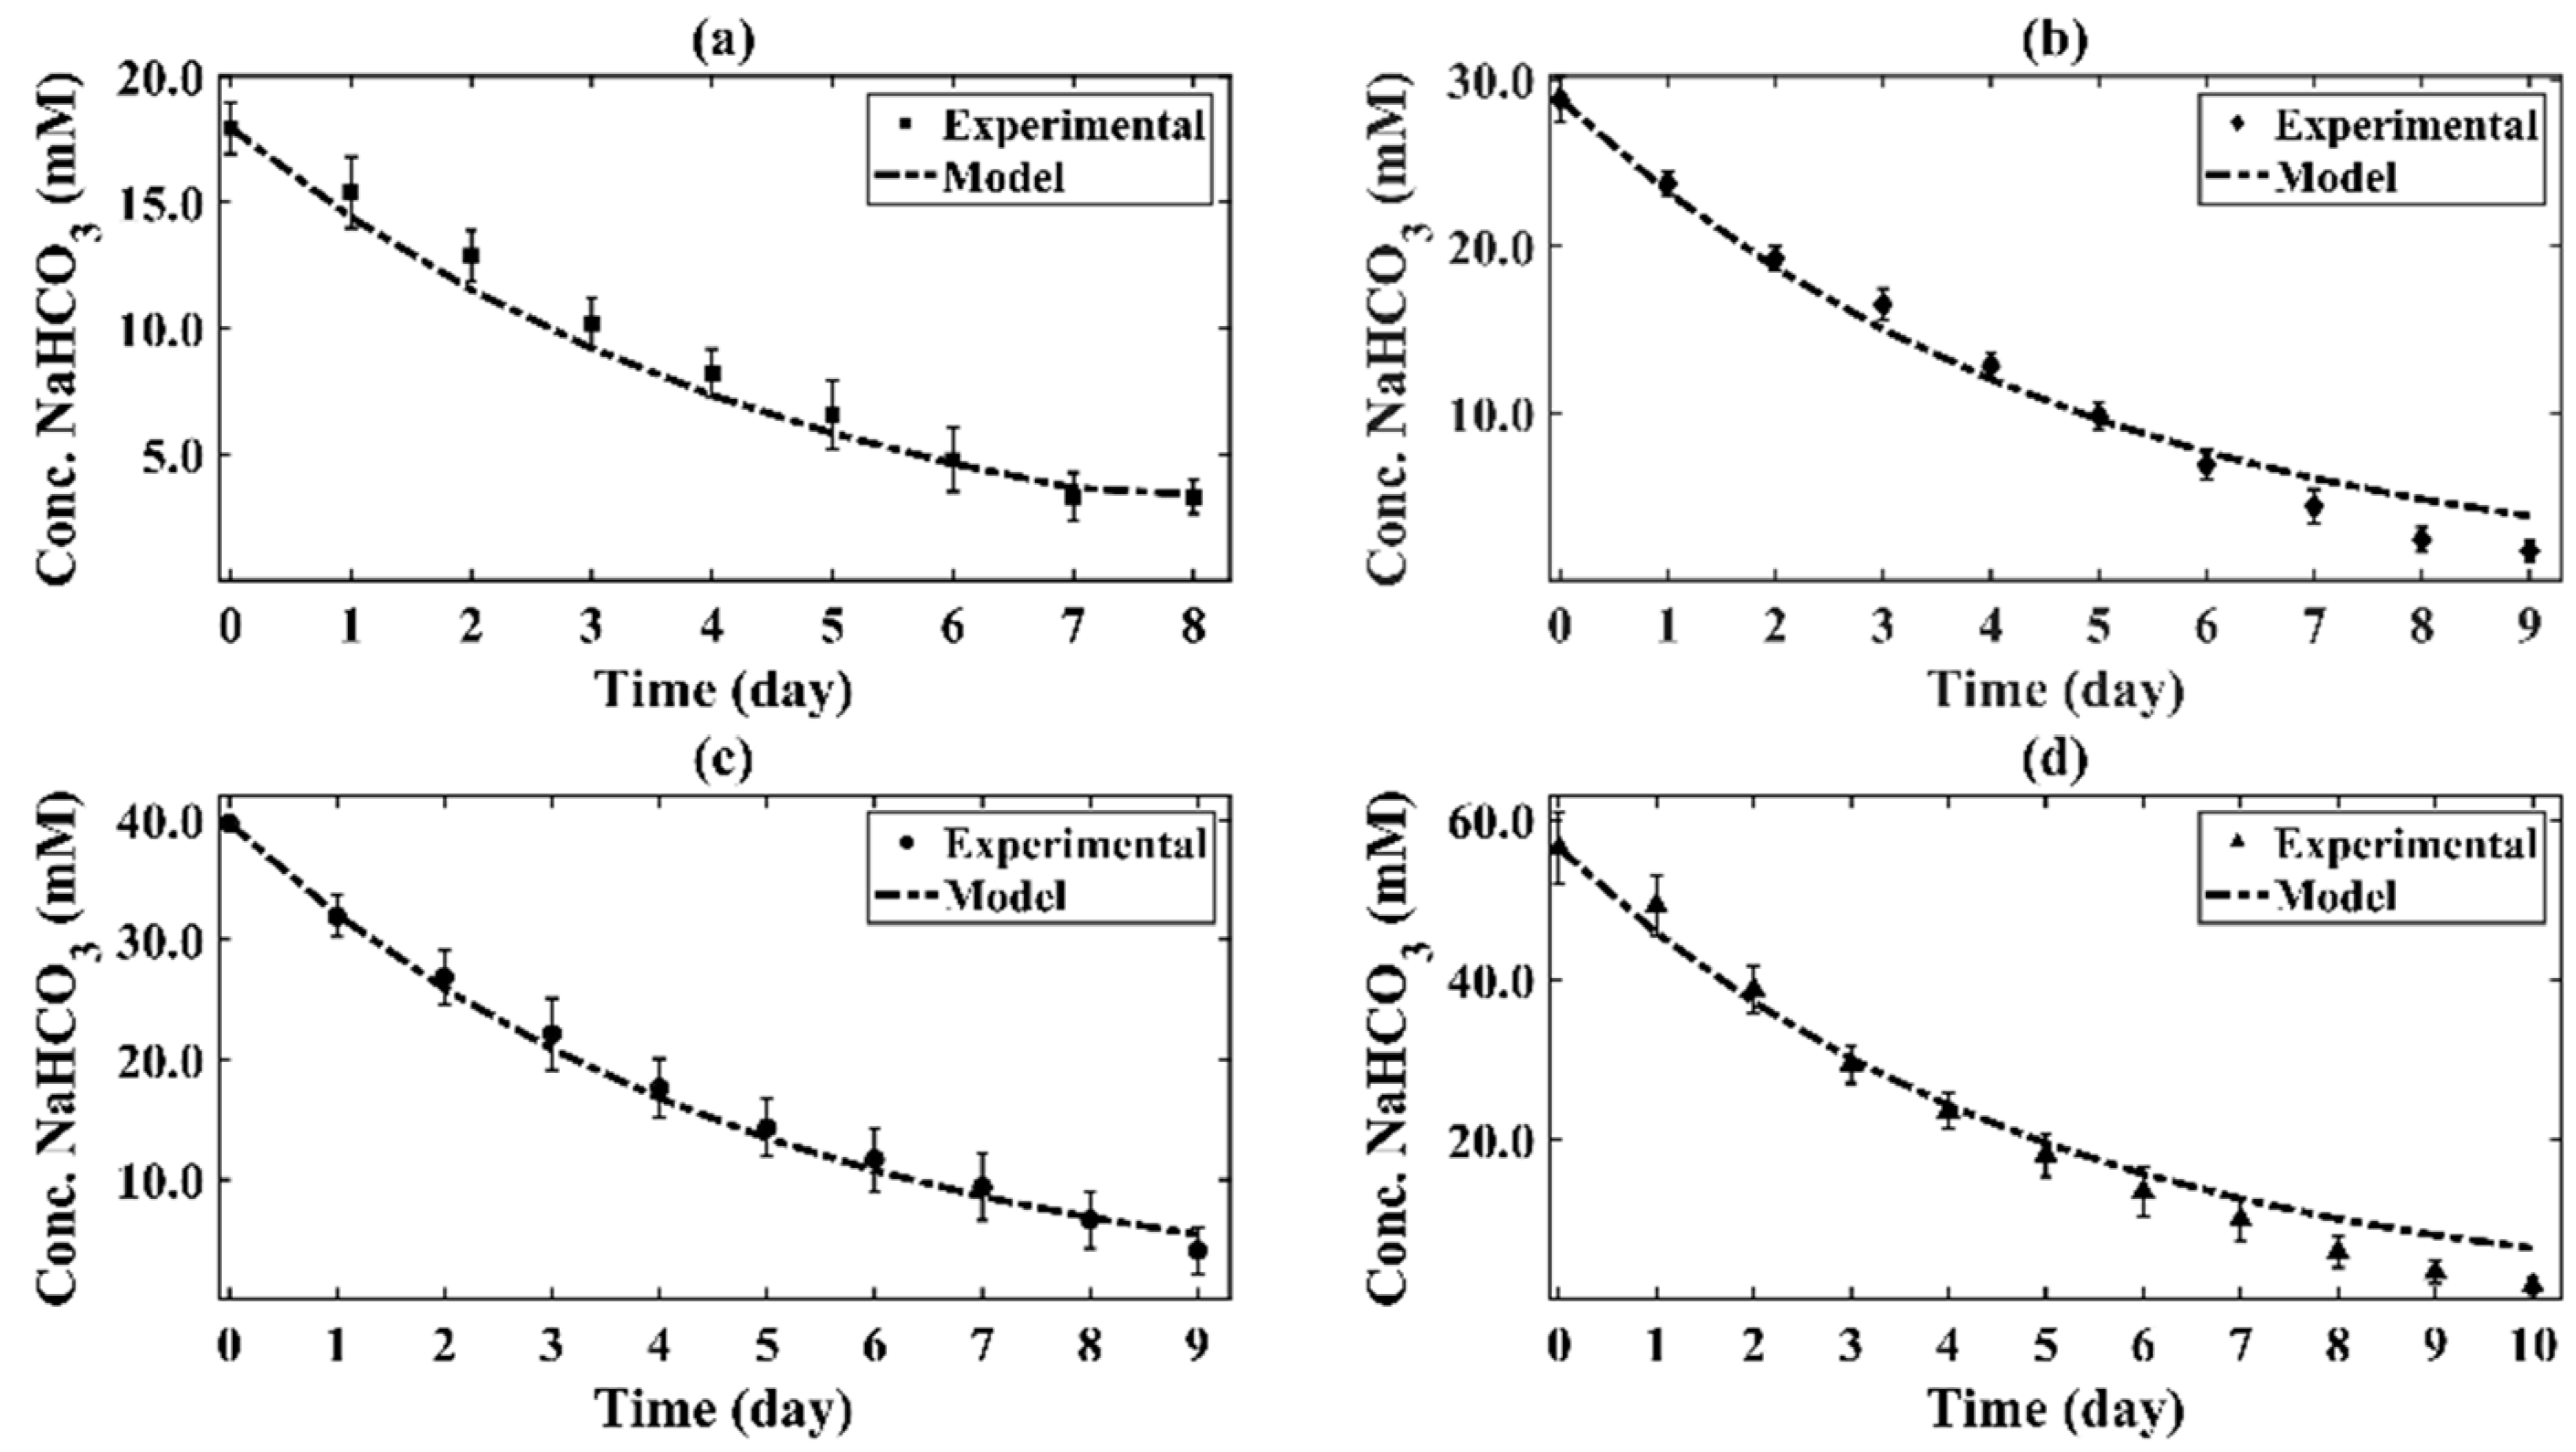
Green CPCC90 Chlorella vulgaris were grown with different concentrations of NaHCO3 species, which acted as an inorganic carbon source. Figure 5 reports the increase in inorganic carbon utilization with time as determined using Equation (2). It can be observed that the inorganic carbon conversion increased with culture time, reaching a maximum value of 27%, in the runs with 18 mM of NaHCO3. A similar conversion of 29.6% was reached for experiments with 28 mM of NaHCO3. On the other hand, when working with a higher concentration of inorganic carbon, the conversion into organic carbon decreased.
Thus, when feeding sodium bicarbonate to microalgae, inorganic carbon species are available for microalgae cell growth as bicarbonate H C O 3 ions. Once these bicarbonate ions diffuse through the cells, they can be converted to CO2 in a reaction catalyzed by the enzyme carbonic anhydrase, providing the required CO2 for the carbon fixation process [32].
Table 2 reports the reaction order and the reaction rate constant for the inorganic carbon (bicarbonate) consumption. One should note that few studies in the literature have reported the inorganic carbon conversion kinetic parameters. One should mention that the rate model obtained in our research is consistent with Jacob-Lopes, Gimenes Scoparo and Teixeira Franco [13], who reported a first-order removal of gaseous CO2 in the aqueous phase by a cyanobacteria species.
Moreover, Figure 6a–d report the NaHCO3 concentration changes with culture time, at four different initial concentrations, showing the good agreement between the experimental and the predicted concentrations.
Microalgae growth can be tracked using the progressive total organic carbon concentration increase with culture time. Table 3 reports the rate constants for the different bicarbonate concentrations, which are consistent with the already described TOC observed: (a) there is a kinetic constant increase in the 18 to 28 mM range, (b) there is a stable value of kinetic constants for 28, 40, and 60 mM of NaHCO3. Furthermore, the reported results confirm the effective applicability of the proposed zero-order model for the biotransformation of inorganic carbon into organic matter by CPCC90 Chlorella vulgaris during the growth phase, for all bicarbonate concentrations.
Total organic carbon increased with culture time during the growth phase, with the predicted organic carbon concentration for the growth phase following the proposed zero-order model closely, during the 2–10 days period. This consistent zero-order model agrees with the Monod model, with bicarbonate carbon concentration supplied at relatively high levels [12,14,19,23,33,34].
A maximum organic carbon concentration was reached in all cases, after 8 or 11 days of algae culture. Consequently, this maximum organic carbon concentration can be influenced by the initial bicarbonate concentration, which followed a nonlinear trend, as reported in Figure 7. Therefore, the maximum organic carbon concentration ( C o r g m a x ) predicted by the proposed kinetic model can be related to the initial inorganic carbon concentration, provided as NaHCO3, using γ and δ parameters, and estimated with a nonlinear regression as follows:
C o r g m a x = γ C i n 0 = γ C i n 0 e ( δ C i n 0 )
Figure 7 also shows the ability of the proposed model to predict maximum organic carbon concentrations using both Equations (11) and (12). Moreover, this figure demonstrates the adequacy of the calculated γ and δ parameters estimated via nonlinear regression.
Furthermore, and regarding the selective conversion of inorganic carbon into Chlorella vulgaris, a maximum selectivity ranging from 17.0% ± 1.4% to 33.0% ± 2.0% ( S e l e c t i v i t y = C o r g ( C i n , o C i n ) ) * 100 ) was obtained. The selectivity decreased with the initial sodium bicarbonate concentration. These results yielded stochiometric coefficients close to α 0.33 , φ 1 , and β + ω 1.67 , in Equation (3), and showed the promise of the bicarbonate conversion by Chorella vulgaris, via photosynthesis, in the PhotoBioCREC.

4.3. Kinetic Model

The kinetic modeling of microalgae allows the prediction of the PhotoBioCREC performance and the efficiency of carbon uptake by microalgae. During the lag phase, microorganisms adapt to the growth conditions (i.e., nutrients, temperature, and mixing) that can result in a partial inhibition of cell division [15]. As a result, the Heaviside step function included in the model, and presented in Equation (10), allows one to properly account for this phenomenon, predicting a close to null increase in biomass or organic carbon concentration during the lag phase. On the other hand, for the growth phase, the proposed model allows the prediction of total organic carbon concentration until it reaches the maximum value. After reaching the maximum concentration, there is a decline in the growth rate, as a result of the depletion of inorganic carbon supply.
Consequently, the kinetic model proposed in this research allowed us, in principle, to predict the CPCC90 Chlorella vulgaris growth rate, both for carbon conversion and maximum carbon fixation. In addition, and given the experimental runs developed in the PhotoBioCREC with concurrent macroscopic energy balances being established, this strategy allowed the evaluation of photon utilization efficiency, observed to be as high as 3.6% [1].
Figure 8a–d report the good agreement between the total organic carbon concentration, as predicted by the model developed in the present study and the experimental results obtained in the PhotoBioCREC prototype.
Figure 9 provides a further validation of the organic and inorganic carbon concentration model predictions, by comparing them with the experimental data. One can, on this basis, confirm the adequacy of the model proposed for the CPCC90 Chlorella vulgaris culture, ranging from 18 to 60 mM of NaHCO3. As a result, the proposed model of the present study can be considered suitable for the prediction of carbon conversion and the prediction of the selectivity of carbon capture by microalgae.

5. Conclusions

(a)
Sodium bicarbonate solutions are valuable vectors for CO2 capture by CPCC90 Chlorella vulgaris microalgae.
(b)
A PhotoBioCREC with controlled mixing and radiation conditions provides a suitable experimental prototype for the establishment of CPCC90 Chlorella vulgaris culture kinetics.
(c)
Measurements of bicarbonate and TOC changes with culture time show an up to 33.0% selective conversion of bicarbonates into microalgae, establishing Chlorella vulgaris photosynthesis in a PhotoBioCREC, as a promising process for carbon capture.
(d)
The developed experiments provide the needed data for the Chlorella vulgaris growth kinetic model.
(e)
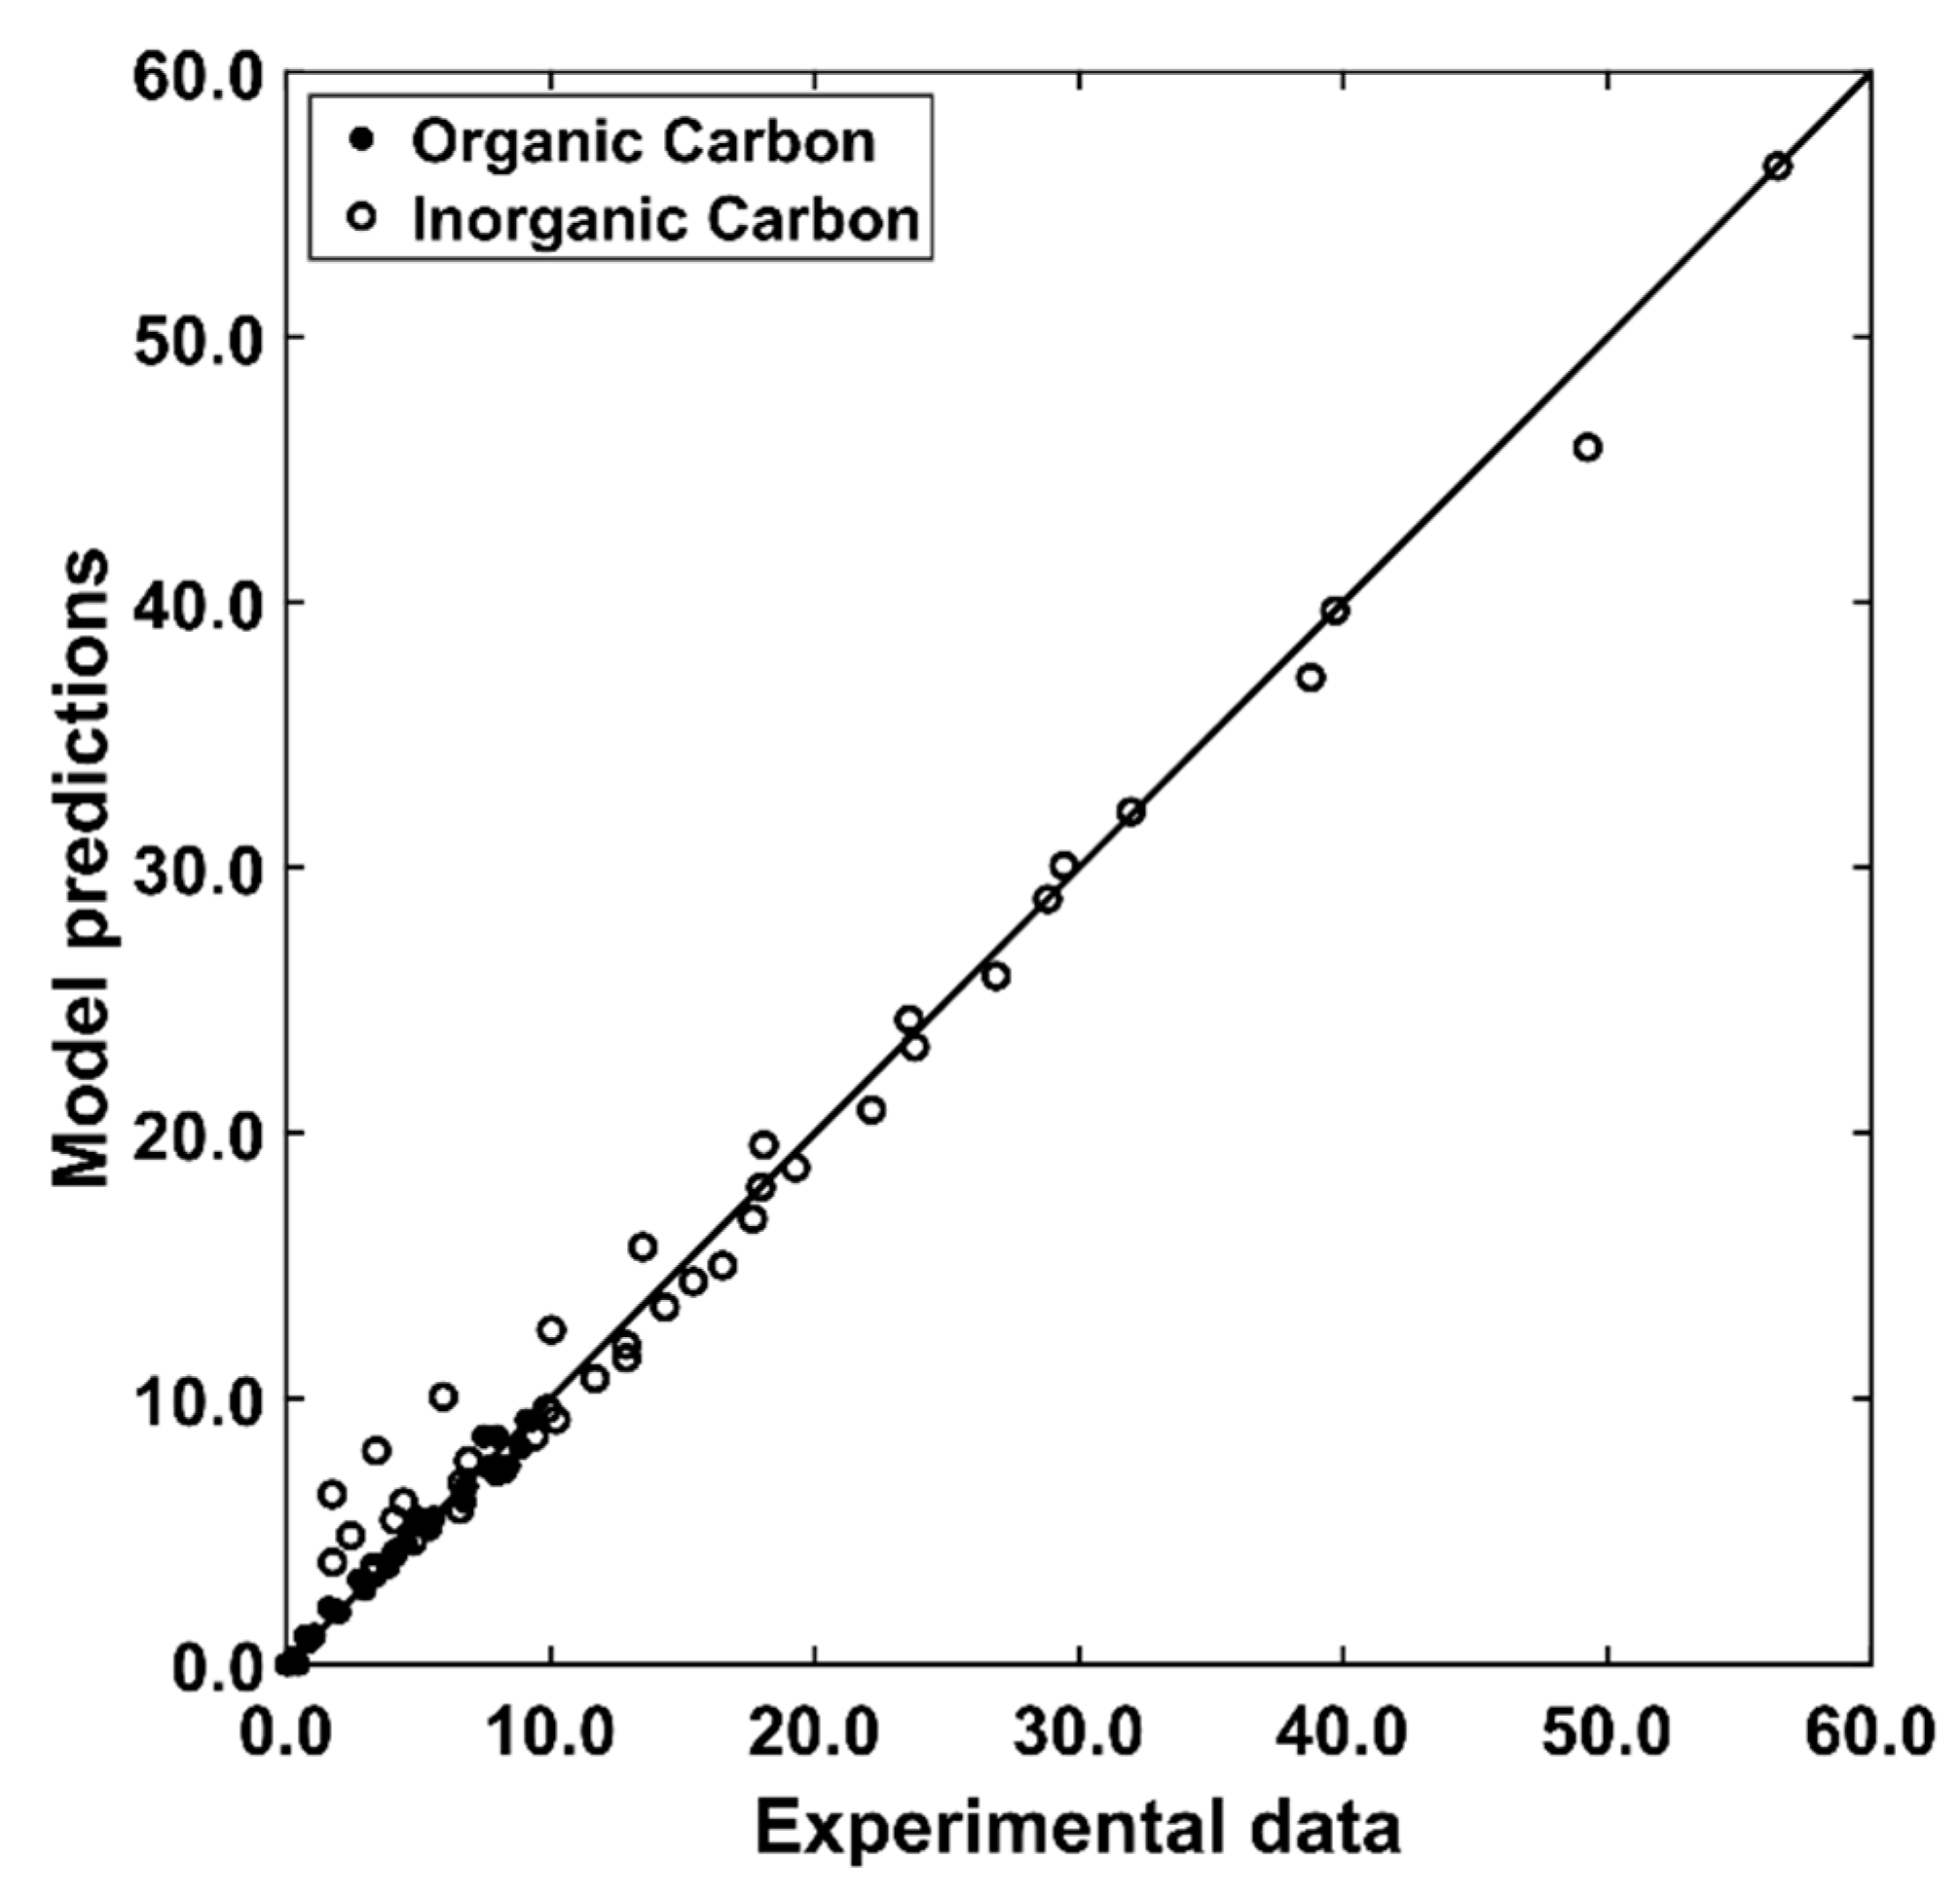
The proposed kinetics allows one to predict both bicarbonate concentration changes and organic carbon concentration changes, during various CPCC90 Chlorella vulgaris growth phases, when using bicarbonate initial concentrations ranging from 18 to 60 mM.
(f)
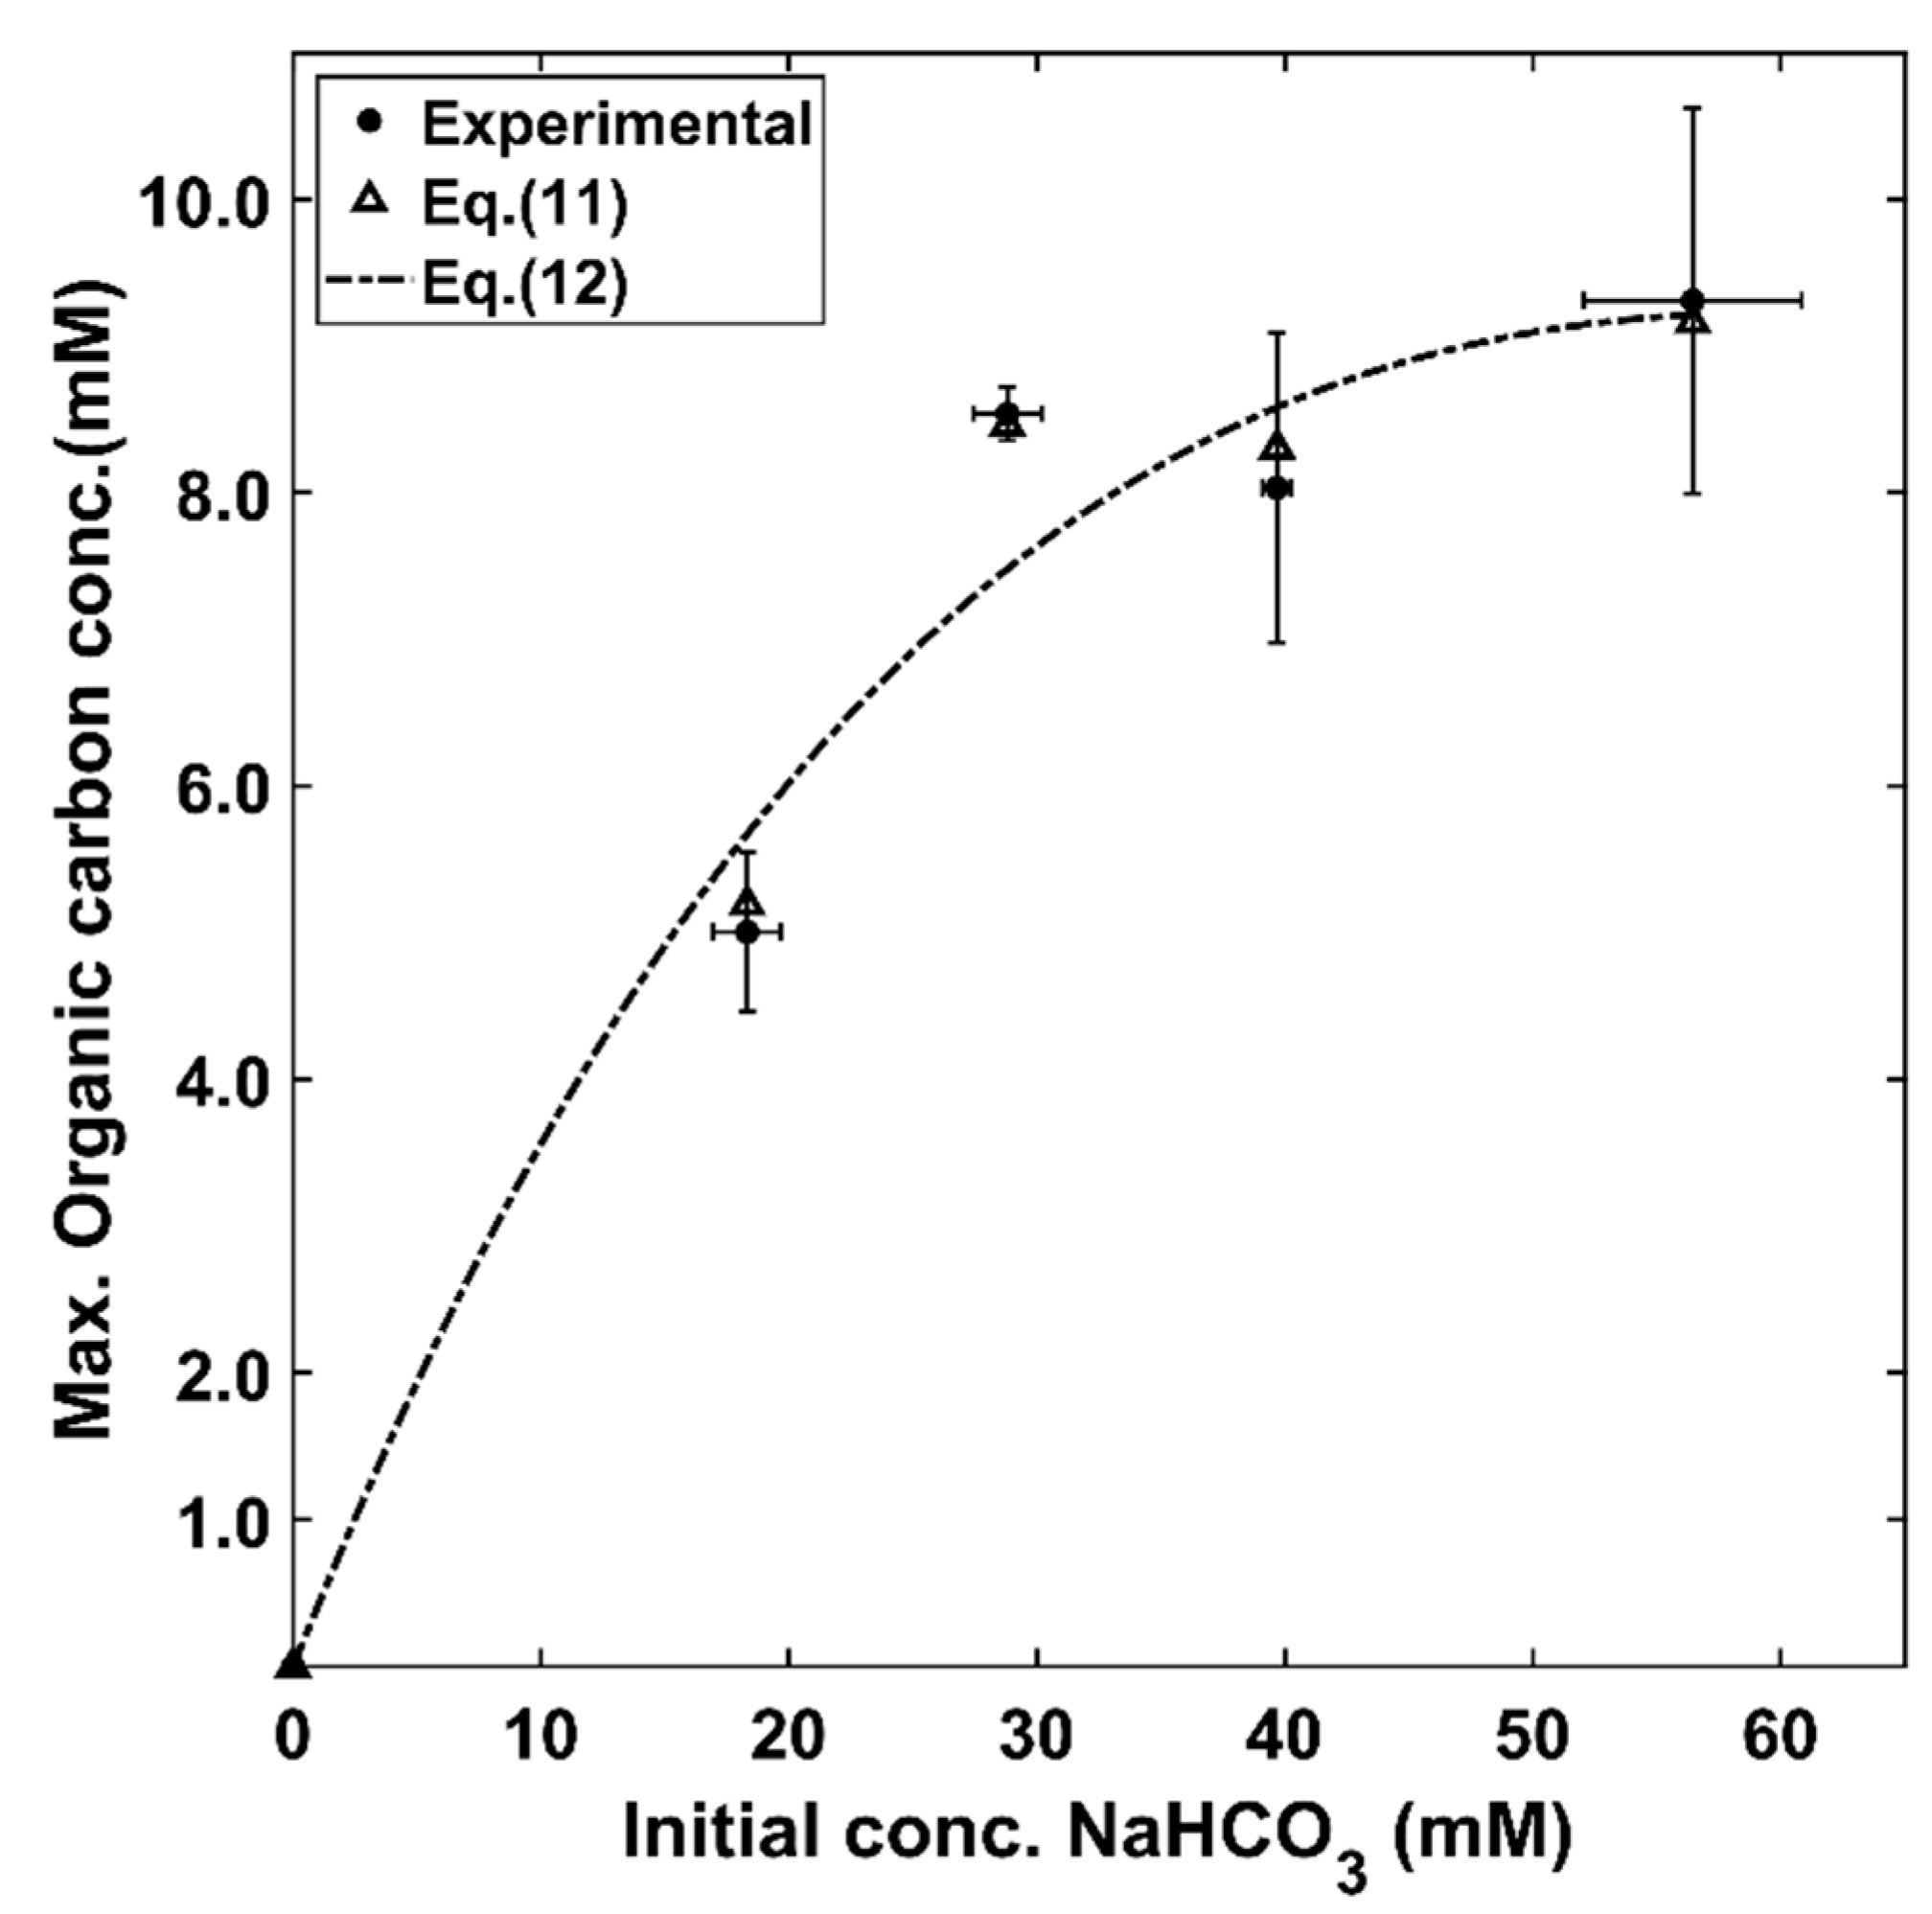
The proposed model also reliably permits one to establish maximum CPCC90 Chlorella vulgaris concentrations values, for various initial bicarbonate concentrations.

Author Contributions

M.C.-P. contributed with the proposed methodology, experimentation, formal analysis and writing. H.d.L. contributed to the planning of the project and research advice. Both authors were involved in the writing and review of the final manuscript draft. All authors have read and agreed to the published version of the manuscript.

Funding

This research was funded by the NSERC (Natural Sciences and Engineering Research Council) of Canada-HdL Discovery Grant. We also acknowledge the scholarship provided to M.C.-P. by the University of Costa Rica.

Institutional Review Board Statement

Not applicable.

Informed Consent Statement

Not applicable.

Data Availability Statement

Data set is available on request to the corresponding author.

Acknowledgments

Authors are grateful to the support provided by the staff of Biotron, the access to the Biotron facilities and the training for the characterization part of this research. We also appreciate the contribution of Florencia de Lasa regarding the enhancement of the image quality and the editing of the manuscript.

Conflicts of Interest

The authors declare no conflict of interest. The funders had no role in the design of the study; in the collection, analyses, or interpretation of data; in the writing of the manuscript, or in the decision to publish the results.

Nomenclature

BBMBold Basal Medium
C i n Inorganic carbon concentration mmole   L 1
C o r g Organic carbon concentration mmole   L 1
C i n 0 Initial inorganic carbon concentration mmole   L 1
C o r g m a x Maximum organic carbon concentration in mmole   L 1
k i n Reaction rate constant for inorganic carbon in mmole   L 1 day 1
k o r g , j Reaction rate constant for organic carbon for each initial concentration j in mmole   L 1 day 1
KConstant L   mmole 1
N i n Moles of inorganic carbon
N o r g Moles of organic carbon
r i n Molar rate of inorganic carbon consumption mmole   L 1 day 1
r o r g Molar rate of organic carbon formation mmole   L 1 day 1
t Time day
t l a g Lag phase time day
t f Time representing the end of the growth phase (day)
TOCTotal organic carbon
u ( t ) Two-value Heaviside function with u ( t ) = 0 for t < 0 and u ( t ) = 1 for t > 0
V f Liquid hold-up (mL)
α Stoichiometric coefficient
β Stoichiometric coefficient
ω Stoichiometric coefficient
φ Stoichiometric coefficient
γ Model parameter
δ Model parameter
τ Growth phase duration time ( day )
η Carbon conversion efficiency (%)

Appendix A. Kinetic Models Reported in the Literature

Table A1. Microalgae kinetic models reported in the technical literature.
AuthorsConditions of RunsQuantum Yield EvaluationKinetics
Mixing EvaluationRadiation Absorption EvaluationTOC/BiomassSubstrate
(CO2 or NaHCO3)
Novak and Brune [22]?noNoFirst order and Monodnone
de Morais and Costa [12]No(intermittent aeration with air-CO2)NoNoFirst orderNone
Jacob-Lopes et al. [13]No(bubble column PBR)NoNoFirst orderFirst order
Yeh et al. [23]YesNoNoFirst order and Monod modelNone
Chun-Yen et al. [34]YesNoNoFirst order and Monod modelNone
Kumar and Das [19]YesNoNoFirst order and logistic equationNone
Lam and Lee [14]YesNoNoFirst orderNone
Chang et al. [20]?NoNoFirst order, Logistic equationNone
Adamczyk et al. [2]?NoNoLogistic equationNone
This studyYesYesYesZero orderFirst order
Notes: (a) the “yes” corresponds to a quantitative evaluation of either “cell unit mixing” or “the cell unit radiation absorption” during runs; (b) the “No” corresponds to the lack of provided data about “mixing” or “radiation absorption”; (c) the “?” symbol corresponds to cases where there is uncertainty regarding “the mixing conditions” or “the radiation absorption”; and (d) the “zero order,” “first order,” or “the Monod model” corresponds to observed kinetics during experiments.

Appendix B. Determination of Parameters for Equation (3)

The proximate chemical formula for biomass, reported in Equation (3) as C H a O b , was determined based on the experimental elemental composition of biomass. The “a” and “b” parameters represent the H / C = 1.8 and O / C = 0.39 molar ratios, respectively, as reported in Table 3. As a result, the biomass chemical formula was established as C H 1.8 O 0.39 . To arrive at this, the stoichiometric coefficients of Equation (3) were estimated, by considering mole element balances and using experimental data as follows:
2 N a H C O 3 α C H 1.8 O 0.39 + β C O 2 + ω N a 2 C O 3 + φ N a O H + υ H 2 O
In the first step, from the elemental balance for Na, it was found that 2 = φ + 2 ω . In addition, when bicarbonate was consumed, φ = 1 and ω = 0.5 . From the experimental runs, it was observed that the selectivity (moles of organic carbon formed/moles of sodium bicarbonate consumed) was 33%, and as a result, α = 0.33 . Furthermore, from the carbon balance, it was also postulated that 2 = α + β + ω . Thus, β = 1.17 . Finally, from the hydrogen balance, 2 = α a + φ + 2 v was determined, and as a result, ν = 0.20 . Thus β + ω = 1.67.

Appendix C. Determination of Reaction Rate Constants

The rate constants k o r g and k i n , and the reaction order for inorganic carbon consumption ( n ) , were determined using a nonlinear regression. The integrated forms of Equations (5) and (7) were used to estimate the concentration of inorganic carbon, during culture time, and the concentration of organic carbon during the growth phase, respectively. These equations are as follows:
C i n C i n 0 = [ ( n 1 ) k i n t C i n 0 ( 1 n ) + 1 ] 1 ( 1 n )
C o r g = C o r g , i n + k o r g   ( t t i n )
In the next step, the sum of the squared estimated residuals ( S r ) were calculated for each model equation, considering the following:
S r = 1 n [ C e x p C m o d e l ] 2
Thus, during nonlinear regression, the n and k i n parameters in Equation (A1) were changed simultaneously, until the S r residual summation was minimized. Similarly, and for k o r in Equation (A2), it was regressed until S r reached a minimum value.

Appendix D. The Heaviside Step Function u ( t ) involved in Microalgae Growth Kinetics

The “Heaviside step function” u ( t ) is a typical function used in process control and reaction engineering [35]. This is a two-value function with two possible values “0” or “1”:
(a)
For t < 0 , the u ( t ) = 0
(b)
For t > 0 , the u ( t ) = 1
The adequacy of Equation (10) can be confirmed as follows:
(a)
During the lag phase: t < t l a g ,
u ( t t l a g ) = 0   and   u ( t t f ) = 0 ;   C o r g = 0
(b)
During the growth phase: t > t l a g ,
u ( t t l a g ) = 1 ,   and   u ( t t f ) = 0 ;   C o r g = k o r , j ( t t l a g )
(c)
During the stationary phase: t > t l a g ,
u ( t t l a g ) = 1 ,   u ( t t f ) = 1 ;   C o r g = C o r g m a x
Thus, and as shown here, the Heaviside step function provides the solution for the three phases of microalgae culture.

References

  1. Cordoba-Perez, M.; De Lasa, H. CO2-derived carbon capture and photon absorption efficiency by microalgae in novel photoBioCREC. Ind. Eng. Chem. Res. 2020, 59, 14710–14716. [Google Scholar] [CrossRef]
  2. Adamczyk, M.; Lasek, J.; Skawińska, A. CO2 Biofixation and Growth Kinetics of Chlorella vulgaris and Nannochloropsis gaditana. Appl. Biochem. Biotechnol. 2016, 179, 1248–1261. [Google Scholar] [CrossRef] [Green Version]
  3. Rawat, I.; Kumar, R.R.; Mutanda, T.; Bux, F. Biodiesel from microalgae: A critical evaluation from laboratory to large scale production. Appl. Energy 2013, 103, 444–467. [Google Scholar] [CrossRef]
  4. Zhao, B.; Su, Y. Process effect of microalgal-carbon dioxide fixation and biomass production: A review. Renew. Sustain. Energy Rev. 2014, 31, 121–132. [Google Scholar] [CrossRef]
  5. Perry, S.; Perry, R.H.; Green, D.W.; Maloney, J.O. Perry’s Chemical Engineers’ Handbook, 7th ed.; McGraw-Hill: New York, NY, USA, 1997; Volume 38, ISBN 0070498415. [Google Scholar]
  6. Chi, Z.; Fallon, J.V.O.; Chen, S. Bicarbonate produced from carbon capture for algae culture. Trends Biotechnol. 2011, 29, 537–541. [Google Scholar] [CrossRef]
  7. Merrett, M.J.; Nimer, N.A.; Dong, L.F. The utilization of bicarbonate ions by the marine microalga Nannochloropsis oculata (Droop) Hibberd. Plant, Cell Environ. 1996, 19, 478–484. [Google Scholar] [CrossRef]
  8. Vadlamani, A.; Viamajala, S.; Pendyala, B.; Varanasi, S. Cultivation of Microalgae at Extreme Alkaline pH Conditions: A Novel Approach for Biofuel Production. ACS Sustain. Chem. Eng. 2017, 5, 7284–7294. [Google Scholar] [CrossRef]
  9. Yadav, G.; Sen, R. Microalgal green refinery concept for biosequestration of carbon-dioxide vis-à-vis wastewater remediation and bioenergy production: Recent technological advances in climate research. J. CO2 Util. 2017, 17, 188–206. [Google Scholar] [CrossRef]
  10. White, D.; Pagarette, A.; Rooks, P.; Ali, S.T. The effect of sodium bicarbonate supplementation on growth and biochemical composition of marine microalgae cultures. J. Appl. Phycol. 2013, 25, 153–165. [Google Scholar] [CrossRef]
  11. Razzak, S.A.; Ali, S.A.M.; Hossain, M.M.; de Lasa, H. Biological CO2 fixation with production of microalgae in wastewater—A review. Renew. Sustain. Energy Rev. 2017, 76, 379–390. [Google Scholar] [CrossRef]
  12. de Morais, M.G.; Costa, J.A.V. Carbon dioxide fixation by Chlorella kessleri, C. vulgaris, Scenedesmus obliquus and Spirulina sp. cultivated in flasks and vertical tubular photobioreactors. Biotechnol. Lett. 2007, 29, 1349–1352. [Google Scholar] [CrossRef]
  13. Almomani, F.A.; Jacob-Lopes, E.; Gimenes Scoparo, C.H.; Teixeira Franco, T. Rates of CO2 removal by Aphanothece microscopica Nägeli in tubular photobioreactors. Chem. Eng. Process. Process Intensif. 2008, 47, 1365–1373. [Google Scholar] [CrossRef]
  14. Lam, M.K.; Lee, K.T. Effect of carbon source towards the growth of Chlorella vulgaris for CO2 bio-mitigation and biodiesel production. Int. J. Greenh. Gas Control 2013, 14, 169–176. [Google Scholar] [CrossRef]
  15. Monod, J. The Growth of Bacterial Cultures. Annu. Rev. Microbiol. 1949, 3, 371–394. [Google Scholar] [CrossRef] [Green Version]
  16. Andrews, J.F. A mathematical model for the continuous culture of microorganisms utilizing inhibitory substrates. Biotechnol. Bioeng. 1968, 10, 707–723. [Google Scholar] [CrossRef]
  17. Blanch, H.W.W.; Clarck, D.S.; Clark, D.S.S.; Clarck, D.S. Biochemical Engineering; Marcel Dekker, Inc.: New York, NY, USA, 1996. [Google Scholar]
  18. Martínez, M.E.; Jiménez, J.M.; El Yousfi, F. Influence of phosphorus concentration and temperature on growth and phosphorus uptake by the microalga Scenedesmus obliquus. Bioresour. Technol. 1999, 67, 233–240. [Google Scholar] [CrossRef]
  19. Kumar, K.; Das, D. Growth characteristics of Chlorella sorokiniana in airlift and bubble column photobioreactors. Bioresour. Technol. 2012, 116, 307–313. [Google Scholar] [CrossRef]
  20. Chang, H.-X.; Huang, Y.; Fu, Q.; Liao, Q.; Zhu, X. Kinetic characteristics and modeling of microalgae Chlorella vulgaris growth and CO2 biofixation considering the coupled effects of light intensity and dissolved inorganic carbon. Bioresour. Technol. 2016, 206, 231–238. [Google Scholar] [CrossRef]
  21. Almomani, F.A. Assessment and modeling of microalgae growth considering the effects of CO2, nutrients, dissolved organic carbon and solar irradiation. J. Environ. Manag. 2019, 247, 738–748. [Google Scholar] [CrossRef] [PubMed]
  22. Novak, J.T.; Brune, D.E. Inorganic carbon limited growth kinetics of some freshwater algae. Water Res. 1985, 19, 215–225. [Google Scholar] [CrossRef]
  23. Yeh, K.-L.; Chang, J.; Chen, W. Effect of light supply and carbon source on cell growth and cellular composition of a newly isolated microalga Chlorella vulgaris. Eng. Life Sci. 2010, 10, 201–208. [Google Scholar] [CrossRef]
  24. Babaei, A.; Mehrnia, M.R. Fouling in microalgal membrane bioreactor containing nitrate-enriched wastewater under different trophic conditions. Algal Res. 2018, 36, 167–174. [Google Scholar] [CrossRef]
  25. Hage, D.S.; Carr, J.D. Analytical Chemistry and Quantitative Analysis; Prentice Hall: Boston, MA, USA, 2011. [Google Scholar]
  26. Percopo, I.; Montresor, M.; Taxonomy, D.S.; Zoologica, S.; Dohrn, A. Microalgae Preparation for Scanning Electron Microscopy: Dehydration. Available online: https://www.assemblemarine.org/assets/Uploads/Documents/tool-box/Preparation-for-Scanning-Electron-Microscopy1.pdf (accessed on 19 May 2021).
  27. da Rosa, G.M.; Moraes, L.; Cardias, B.B.; Costa, J.A.V. Chemical absorption and CO2 biofixation via the cultivation of Spirulina in semicontinuous mode with nutrient recycle. Bioresour. Technol. 2015, 192, 321–327. [Google Scholar] [CrossRef] [PubMed]
  28. Sa, C.; Zebib, B.; Merah, O.; Pontalier, P. Morphology, composition, production, processing and applications of Chlorella vulgaris: A review. Renew. Sustain. Energy Rev. 2014, 35, 265–278. [Google Scholar] [CrossRef] [Green Version]
  29. Raheem, A.; Sivasangar, S.; Wan Azlina, W.A.K.G.; Taufiq Yap, Y.H.; Danquah, M.K.; Harun, R. Thermogravimetric study of Chlorella vulgaris for syngas production. Algal Res. 2015, 12, 52–59. [Google Scholar] [CrossRef]
  30. Arif, M.; Li, Y.; El-Dalatony, M.M.; Zhang, C.; Li, X.; Salama, E.S. A complete characterization of microalgal biomass through FTIR/TGA/CHNS analysis: An approach for biofuel generation and nutrients removal. Renew. Energy 2021, 163, 1973–1982. [Google Scholar] [CrossRef]
  31. Gautam, R.; Varma, A.K.; Vinu, R. Apparent Kinetics of Fast Pyrolysis of Four Different Microalgae and Product Analyses Using Pyrolysis-FTIR and Pyrolysis-GC/MS. Energy Fuels 2017, 31, 12339–12349. [Google Scholar] [CrossRef]
  32. Moroney, J.V.; Somanchi, A. How Do Algae Concentrate CO2 to Increase the Efficiency of Photosynthetic Carbon Fixation? Plant Physiol. 2002, 119, 9–16. [Google Scholar] [CrossRef] [Green Version]
  33. Yadav, N.; Gupta, N.; Singh, D.P. Ameliorating Effect of Bicarbonate on Salinity Induced Changes in the Growth, Nutrient Status, Cell Constituents and Photosynthetic Attributes of Microalga Chlorella vulgaris. Bull. Environ. Contam. Toxicol. 2021. [Google Scholar] [CrossRef] [PubMed]
  34. Chun-Yen, C.; Yeh, K.-L.; Huei-Meei, S.; Yung-Chung, L.; Wen-Ming, C.; Jo-Shu, C. Strategies to Enhance Cell Growth and Achieve High-Level Oil Production of a Chlorella vulgaris Isolate. Biotechnol. Prog. 2010, 26, 679–686. [Google Scholar] [CrossRef]
  35. Farlow, S.J. Partial Differential Equations for Scientists and Engineers; Dover Publications, Inc.: New York, NY, USA, 1993. [Google Scholar]
Figure 1. Different stages of CPCC90 Chlorella vulgaris growth in a PhotoBioCREC prototype.
Processes 09 01296 g001
Figure 2. Microscope images of CPCC90 Chlorella Vulgaris cells: (a) Inoculum cells, (b) a case where a 28 mM NaHCO3 solution was used and after 10 days of culture, (c) a case where a 60 mM NaHCO3 solution was used and after 12 days of culture (contrast and cell boundary definition have been modified to improve the resolution of the images).
Processes 09 01296 g002
Figure 3. Cell size distribution for different concentrations of inorganic carbon, as sodium bicarbonate: blue bars: 18 mM, orange bars: 28 mM, yellow bars: 40 mM, violet bars: 60 mM.
Processes 09 01296 g003
Figure 4. CPCC 90 Chlorella vulgaris cells analysis with (A) EDX and (B) SEM. Samples correspond to a 12 day cultivation time and are grown with a nominal concentration of 60 mM of NaHCO3.
Processes 09 01296 g004
Figure 5. Conversion efficiency of inorganic carbon provided as NaHCO3 into organic carbon as per Equation (2).
Processes 09 01296 g005
Figure 6. NaHCO3 concentration changes with culture time for nominal initial concentrations of (a) 18, (b) 28 (c) 40, (d) and 60 mM. Note: reported results include at least 3 repeats.
Processes 09 01296 g006
Figure 7. Maximum concentrations of total organic carbon as a function of initial NaHCO3. Note: γ = 0.42 ± 0.04 and δ = 0.02 ± 0.004 of Equation (12).
Processes 09 01296 g007
Figure 8. Comparison between experimental results and predicted values from the proposed kinetic model, for the determination of total organic carbon concentration for different initial nominal concentrations of NaHCO3: (a) 18, (b) 28, (c) 40, and (d) 60 mM.
Processes 09 01296 g008
Figure 9. Model validation for total organic carbon and bicarbonate experimental concentrations.
Processes 09 01296 g009
Table 1. Elemental analysis of the cells of CPCC90 Chlorella vulgaris using combined CHNS and EDX elemental analysis. Reported results are average values between repeats with ±0.003 being the largest standard deviation.
Composition
(%)
This StudyLiterature [29]
CPCC Chlorella vulgarisChlorella vulgaris
Carbon55.146.1–50.39
Hydrogen8.26.01–6.41
Oxygen 129.019.1–25.00
Nitrogen7.19.01–14.77
Sulfur0.60.4–6.05
Molar ratios
H/C1.81.43
C/N9.1
O/C0.390.339
1 Data calculated from combined CHNS and EDX analysis.
Table 2. Kinetic parameters for inorganic carbon consumption.
ParameterValue
n 0.95 ± 0.09
k i n   { ( mmole   L 1 ) 0.05 day 1 } 0.26 ± 0.09
Table 3. Reaction rate constants for total organic carbon formation and growth phase time.
Nominal Conc. of NaHCO3 k o r , j { m m o l e   L 1 d a y 1 } τ
( D a y )
180.86 ± 0.136
281.18 ± 0.057.2
401.06 ± 0.088
601.02 ± 0.119
Publisher’s Note: MDPI stays neutral with regard to jurisdictional claims in published maps and institutional affiliations.

