Article

Model-Based Evaluation of Hydrothermal Treatment for the Energy Efficient Dewatering and Drying of Sewage Sludge

Biorefineries Department, DBFZ Deutsches Biomasseforschungszentrum Gemeinnützige GmbH, Torgauer Straße 116, 04347 Leipzig, Germany
*
Author to whom correspondence should be addressed.
Processes 2021, 9(8), 1346; https://doi.org/10.3390/pr9081346
Submission received: 9 July 2021 / Accepted: 23 July 2021 / Published: 30 July 2021
(This article belongs to the Section Environmental and Green Processes)

Abstract

:
This research paper evaluates hydrothermal carbonization (HTC) as a possible treatment for sewage sludge, including phosphorus recycling. German governmental requirements force a high number of wastewater treatment plants (WWTP) to recover phosphorus from sewage sludge above limits of 20 g kgTS−1 before further disposal (e.g., co-incineration). The results show that pH reduction has a positive effect on shifting phosphorus to the liquid phase during HTC. Although the experimental results of this research do not yet achieve the necessary phosphorus reduction, various calculations are made to achieve this goal in future experimental studies. In order to be able to assess the energy benefits of HTC, Aspen Plus modeling was used to show the positive impact of implementing this technology in a WWTP. It is shown that the mechanical dewaterability of sewage sludge (SS) increases after HTC enabling energy savings by means of subsequent thermal drying. A heat optimized HTC is able to cut energy expenses by half, further providing a phosphorus-depleted hydrochar for extensive energetic use.

1. Introduction

In 2017, wastewater treatment plants in Germany produced around 1.7 million tons of dry matter of sewage sludge (SS) [1]. Its disposal challenges most municipal and industrial wastewater treatment plants (WWTPs). In 2017, 70% of SS accrued in Germany went into thermal disposal. Other uses include their applications in agriculture (18%) and landscaping purposes (10%) [2]. Key challenges of modern wastewater treatment include nutrient recovery (particularly for phosphorus and nitrogen) and sludge dewatering, as well as the handling of high heavy metal concentrations, especially for municipal and industrial WWTPs [3]. Management strategies for SS are influenced by several factors, such as transport costs, wastewater quality, technologies for nutrient removal, and legal restrictions [1].
In Germany, governmental requirements will grow stricter in the upcoming decade, prohibiting soil application of SS with a phosphorus content exceeding 20 g kgTS−1 [4]. All medium- and large-sized WWTPs in Germany with more than 50,000 population equivalents (PE) are forced to develop an adjusted disposal concept by 2023. This also includes a precise plan for the recovery of phosphorus. WWTPs with a size of more than 100,000 PE are then requested to realize those concepts by the beginning of 2029. Medium-sized WWTPs with more than 50,000 PE will follow until the beginning of 2032 [4]. The most widespread disposal method (via co-incineration) of SS will no longer be possible when the phosphorus content exceeds the limit mentioned before. As a result, mono-incineration capacities are massively built up in Germany right now [5]. Phosphorus can be recovered from the ash after incineration with a vast amount of different technologies. However, recycled phosphorus from mono-incineration is not directly available to plants when brought back to agriculture and requires some time to weather [6]. Additionally, the incineration of SS—no matter whether it is conducted using co- or mono-incineration—needs additional energy for thermal drying [7]. SS still has 65–95% water content after classical wastewater treatment [1,8].
A promising technology to improve the mechanical dewaterability with simultaneously allowing an integrated phosphorus recovery is hydrothermal carbonization (HTC) [7,9,10,11]. HTC takes place at an increased temperature (180–280 °C) and pressure slightly above the water saturation pressure at these temperatures to ensure that water remains in a liquid state [12,13]. As a result, HTC produces a solid product—called hydrochar (HC)—and liquid by-product (or process water (PW)). Recent literature has shown that phosphorus can be shifted to the resulting PW by a low pH during HTC [9,14,15]. The resulting HC subsequently shows a significantly lowered phosphorus concentration and could be able to fulfill the requirement mentioned before (<20 gP kgTS−1).
Based on these observations, this manuscript focuses on a model-based overall energetic optimization of HTC, mechanical dewatering, and thermal drying. Therefore, the behavior of SS during HTC under varying reaction conditions (such as temperature, holding time, and pH) was examined. After determination of optimal process parameters regarding a maximized phosphorus concentration in PW and a maximized energy yield for the resulting HC, model data were used to develop a process model consisting of a continuous HTC with heat integration, a mechanical dewatering with a belt filter, and a thermal drying of the HC assuming a drum dryer. This model was then evaluated focusing on the overall heat demand and potential energy production.

2. Materials and Methods

2.1. Materials

Approximately 10 kg of digested sewage sludge (DSS) were obtained from a municipal WWTP in Leipzig, Germany and stored at 4 °C until further use. The DSS was mechanically dewatered at the WWTP using a decanter centrifuge achieving a total solids (TS) content of 24.8%. Other properties of the used DSS can be found in Table 1.
To adjust the pH prior to HTC, concentrated sulfuric acid (18 M) was acquired from Carl Roth GmbH + Co. KG (Karlsruhe, Germany).

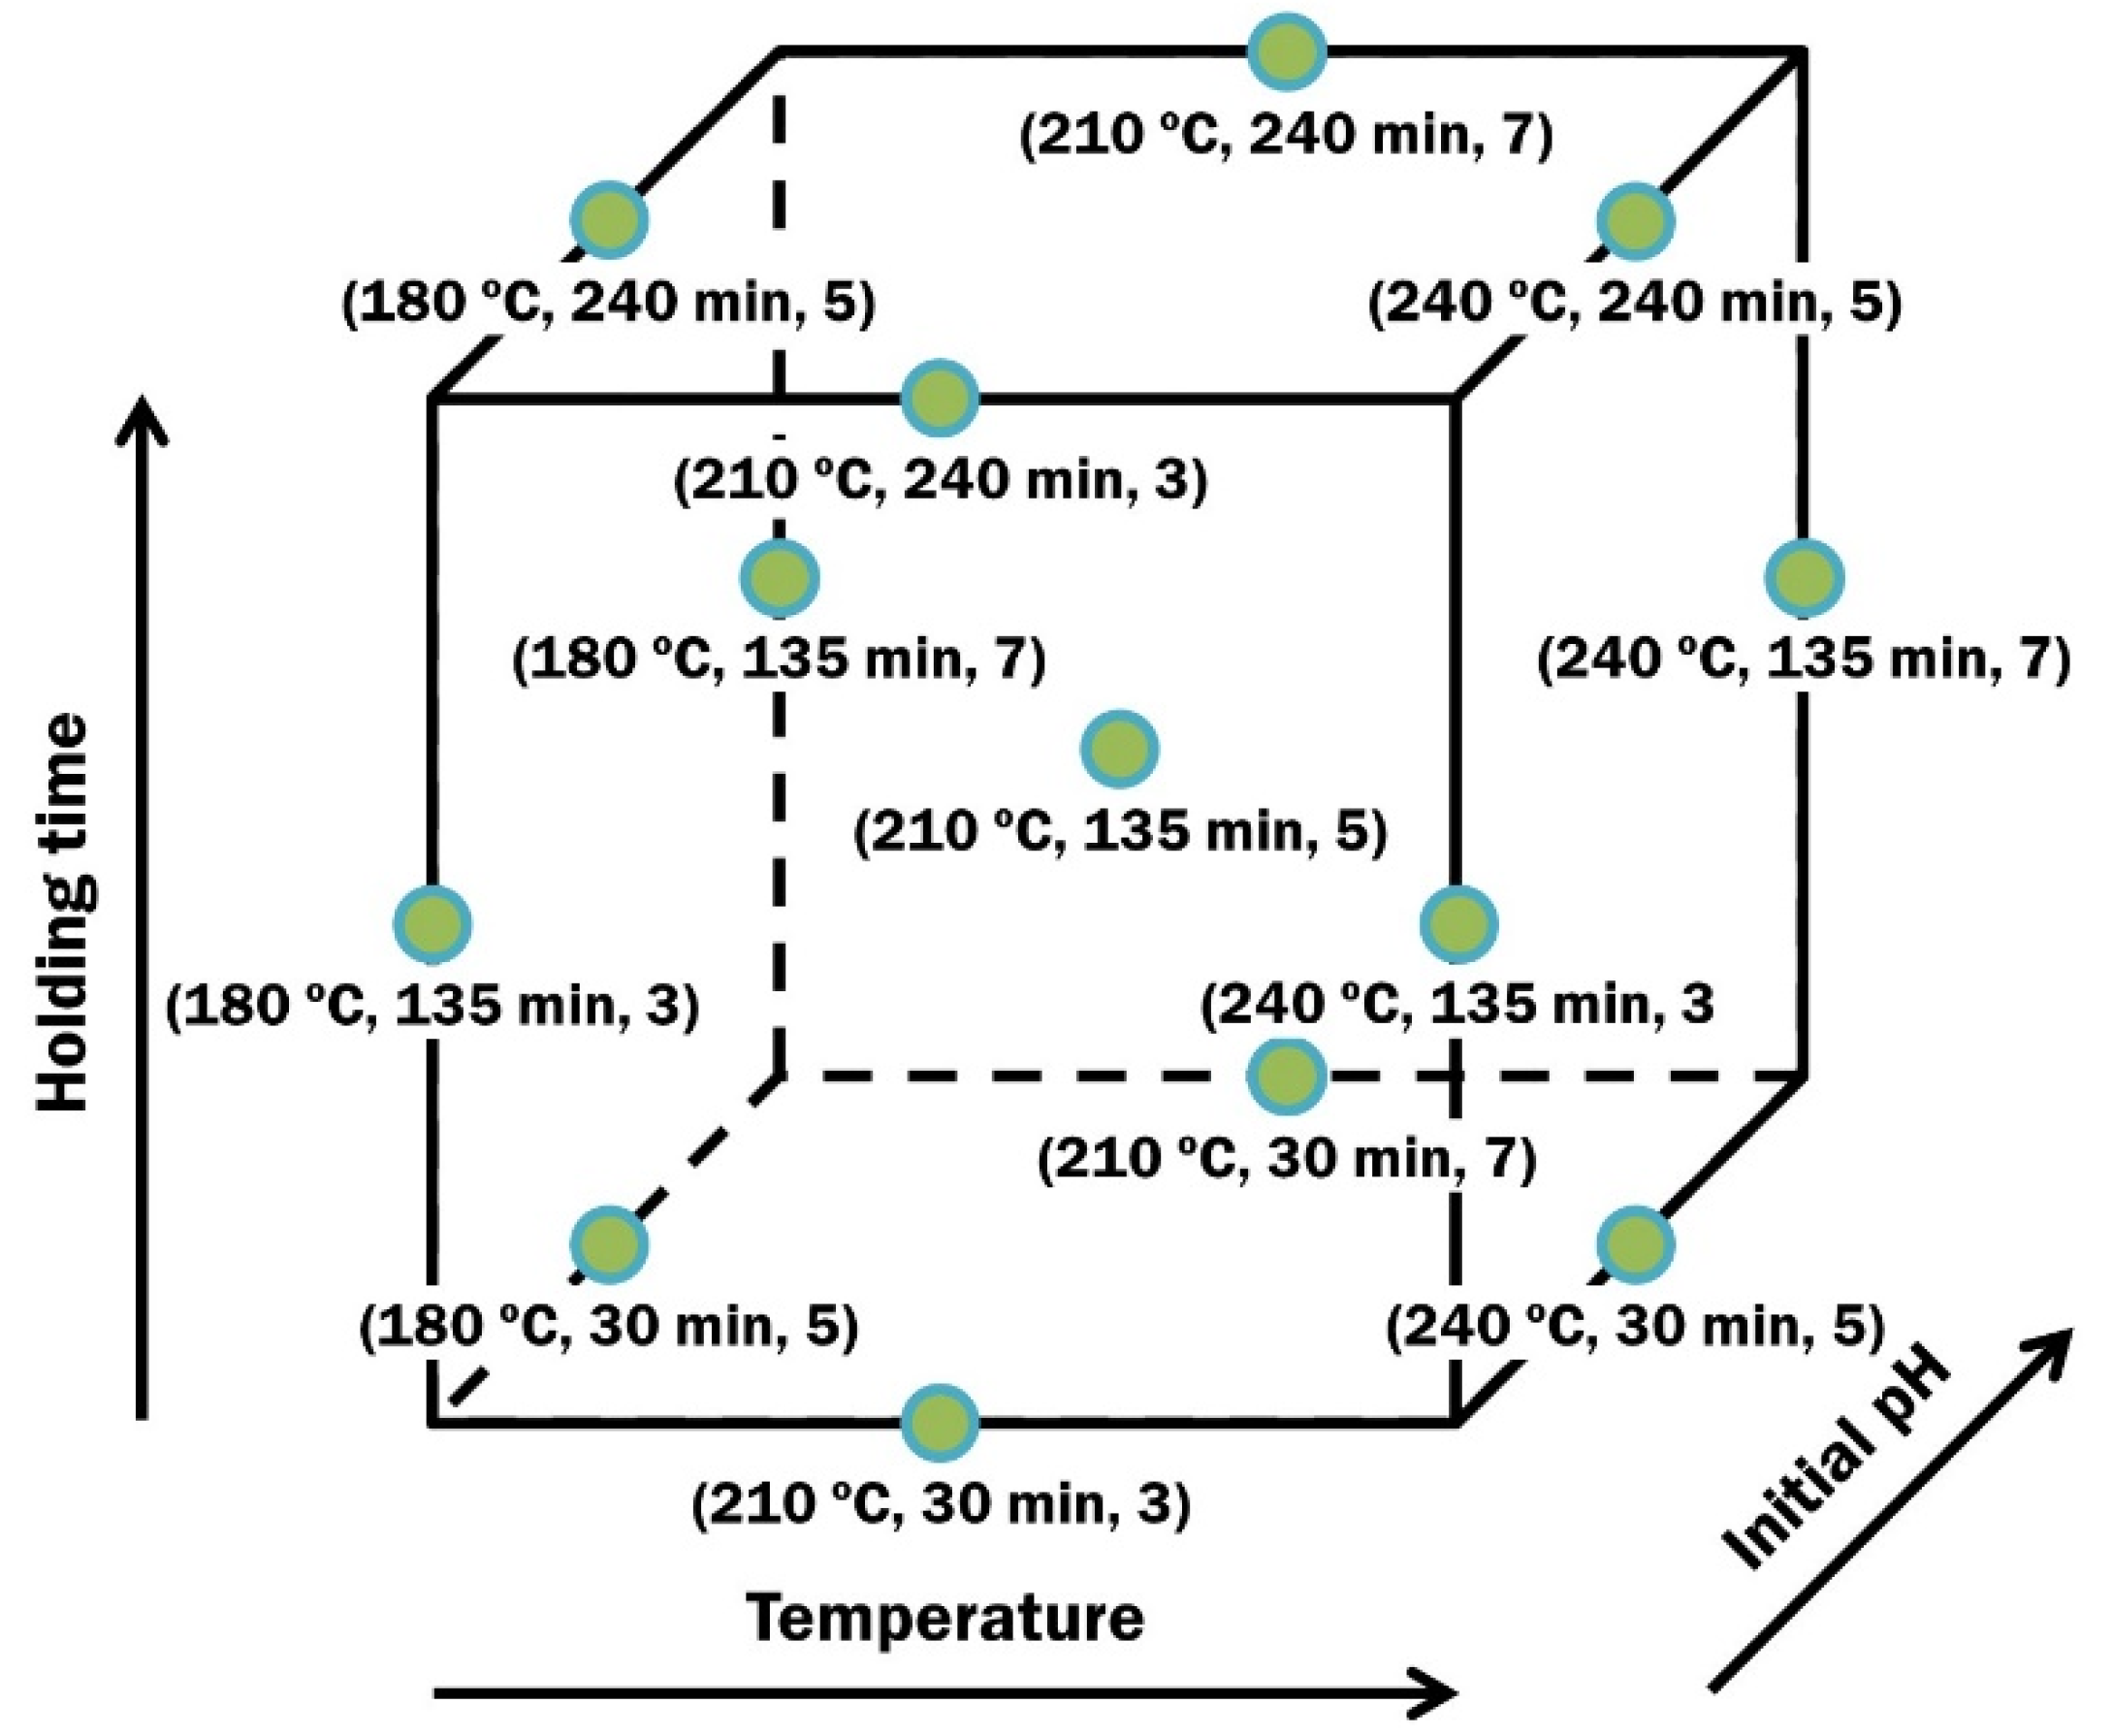
2.2. Conducting the Experiments

A design of experiments (DoE) approach was used to identify the influence of reaction temperature, holding time (starting when the reaction temperature was reached), and initial pH on HC and PW characteristics. A Box–Behnken design was chosen here. Reaction conditions varied from 180–240 °C, 30–240 min, and 3–7 as initial pH. The center point of this design space was carried out as a triplicate. Every other design point was only carried out once resulting in 15 HTC experiments overall. Those experiments were conducted in a randomized order. A graphical illustration of the design space can be found in Figure 1. The corresponding experimental plan can be found in Table A1 in the Appendix A.
To calculate the amount of sulfuric acid needed for each individual HTC experiment and a certain target initial pH, 10 g of DSS were weighed into an Erlenmeyer flask. 100 g of purified water were added and the mixture was placed on a shaker for 10 min at 130 rpm. The initial pH of that mixture was 8.3. Concentrated sulfuric acid was then slowly added under constant stirring until the targeted starting pHs of 3, 5, and 7 were reached. The amount of sulfuric acid added was determined gravimetrically.
For each HTC experiment, around 300 g of DSS was weighed into a stirred 0.5-L-HTC-reactor made of stainless steel (BR-500, Berghof Products + Instruments GmbH, Eningen, Germany). The calculated amount of concentrated sulfuric acid was added directly into the reactor. No additional water was added for these experiments. The stirrer was set at 100 rpm throughout the experiment. The reactor was then heated up electrically at an average heating rate of 2.4 K min−1 to the desired reaction temperature. Temperature was then maintained for the desired holding time. Afterwards, the heater was turned off and the reactor cooled down to room temperature via the environment. Residual pressure was vented into a hood.
The resulting HTC slurry was transferred into a small screw press to separate HC and PW. After separation, HC was dried at 105 °C for overnight and stored in zip-lock bags at room temperature until further use. The resulting PW was stored at 4 °C until further use.

2.3. Analytical Methods

Elemental analysis (C, H, N, S) of DSS and HC was conducted according to DIN EN 15104 using an elemental analyzer (vario MACRO CUBE, Elementar Analysensysteme GmbH, Langenselbold, Germany). Ash content of DSS and HC was determined gravimetrically by incineration at 550 °C according to DIN EN 14775. Oxygen content was then calculated by difference. The higher heating value (HHV) of the HC samples was measured according to DIN EN ISO 18125 using a bomb calorimeter (Parr Instrument Company, Moline, IL USA). HHV of DSS was calculated based on its elemental composition according to [16]. Phosphorus was measured spectrophotometrically according to DIN EN ISO 11885 using an ICP-OES (iCAP 6300, Thermo Fisher Scientific, Waltham, MA USA). Solid samples (DSS and HC) had to be prepared prior to ICP-OES using microwave digestion under the addition of nitric acid.

2.4. Calculations

The solid yield (SY) of HC based on TS was determined according to the following equation:
Solid yield [%TS] = (mHC × TSHC) ÷ (mDSS × TSDSS) × 100%
with mHC and mDSS as the masses of HC and DSS and TSHC and TSDSS as their corresponding total solids content, respectively.
SY and HHV can be used to calculate an energy yield (EY) according to the following equation:
Energy yield [%TS] = SY × HHVHC ÷HHVDSS
with HHVHC and HHVDSS as the respective HHVs of HC and DSS.
To account for the limited mechanical dewatering of the resulting HC in lab-scale using the small screw press, a theoretical concentration of P in hydrochar (PHC,theo.) at a certain TS content (TSHC,target) was calculated using the P concentration of the corresponding PW (PPW) according to the following equation:
PHC,theo. [g kgTS−1] = ((PHC × TSHC) − ((1 − TSHC ÷ TSHC,target) × PPW) ÷ TSHC
This equation assumes that the water that can theoretically be separated from the HC has the same concentration of P as the obtained PW. This allows for an estimate of the achievable P content in mechanically dewatered HC at a given TS to be discussed in the context of the threshold of 20 g kgTS−1 given by the revised German sewage sludge ordinance [4].

2.5. Statistical Evaluation and Regression Modeling

Statistical evaluation and regression modeling were conducted with the help of Design-Expert (v12, Stat-Ease, Inc., Minneapolis, MN, USA). Regression modeling was conducted with the aim to fit the experimental data to an amended second order model with the maximum amount of non-aliased model terms according to the number of unique process parameter combinations (12). The model is shown in the following equation:
y = β0 + βTxT + βtxt + βpHxpH + βTtxTxt + βTpHxTxpH + βtpHxtxpH + βT2xT2 + βt2xt2 + βpH2xpH2 + βT2txT2xt + βT2pHxT2xpH + βTt2xTxt2 + ε
where T denotes the reaction temperature, t denotes the holding time, and pH denotes the initial pH. Design-Expert was then used to reduce this model for maximizing the adjusted coefficient of determination (R2) while still keeping all hierarchical model terms.
Data for the P concentration of the resulting process water had to be transformed to allow for a realistic model without yielding negative P concentrations. Therefore, P concentration data were transformed using a logit function and limiting the response to the range from 0 to a maximum model-based P concentration. This maximum value (Pmod,max) was calculated according to the following equation:
Pmod,max = Pobs,max + Pobs,min
where Pobs,max and Pobs,min are the maximum and minimum P concentrations of the PW observed in the experiments.
Design-Expert was then also used to optimize the HTC process parameters for simultaneously achieving a maximized EY and maximized P concentration in the resulting PW based on the determined model equations. Model data at the optimized parameter set were then used for modeling in Aspen Plus (v10 Aspen Technology, Inc., Bedford, MA USA).

2.6. Aspen Plus Modeling

Flowsheeting was used to evaluate the overall heat demand of the described process consisting of a continuous HTC reactor (htc), one heat exchanger for heat integration (hx), a progressive cavity pump (pump) for high pressure feeding, a belt filter press (press), and a drum dryer (dryer) for mechanical dewatering and thermal drying of the resulting HC. Sewage sludge (ss) was modeled as a non-conventional (NC) material stream to meet the requirements of the operation units for the separation of solids (see Table A2 in the Appendix A). However, the NC stream was split into the contained water (ss-w) and its elemental composition (ss-s) for more accurate heat transfer examinations. Modeling HTC only considers the water content of SS, as it is very high (75.2%). The impact of the remaining components (such as ash, carbon, etc.) was neglected here. This approach offers the advantage that the method IAPWS-IF97 [17] can be used for more accurate heat integration calculations since it was specifically designed for water-only processes. The calculation methods for the dewatering units only play a minor role and were left at their default setting IDEAL.
ss-w is pumped through the counter current heat exchanger (hx) and the HTC reactor (htc), which is modeled as an RGIBBS unit and considers only the heat demand of water heated up to a reaction temperature of 197 °C. The reactor pressure of 20.4 bar is the sum of the water vapor pressure at reaction temperature and the partial pressure of gaseous compounds (mainly CO2) formed during the reaction [18]. Apart from this, the HTC reactor is a black box. The product slurry is flashed from reaction pressure to an optimized pressure turning part of the stream into steam. The steam is then used to pre-heat the feed stream in the heat exchanger (hx). The flowsheet of the described model can be found in Figure 2. The detailed Aspen Plus flowsheet can be seen in Figure A1 in the Appendix A.
The product slurry is then sent to the dewatering and drying part. Therefore, the previously separated compounds (ss-s) are again added to the slurry stream. For that, the changed elemental composition and the SY (loss of solids) after the HTC process were considered according to the experimental results. The following belt filter press (press) then separates PW from the HC, still showing a residual moisture of 30%. Subsequently, the mechanically dewatered HC is thermally dried in a drum dryer modeled as an RSTOIC (dryer) and an additional FLASH (exhaust) unit (see Table A3 in the Appendix A). The target TS of the resulting HC is 90%.
A number of unit operations were overwritten using calculator blocks (e.g., the change of the chemical composition between feedstock and HTC product during reaction). Besides that, calculators were used to adjust the drying process. That concerns the extraction of water from NC components as well as the calculation of the actual heat demand of the drum dryer according to the average heat demand of a drum drying process used in WWTPs taken from literature (850 kWh/tH2O) [8]. Detailed information on the calculators can be found in Table A4, Table A5, Table A6 and Table A7 in the Appendix A.
Further design assumptions and simplifications include a hot/cold outlet temperature approach within the heat exchanger of 10 K. Underlying complex chemical reactions were not included in the black-box-modeling of the HTC reactor. The overall electrical power consumption was also neglected, as it is only of minor importance compared to the achievable savings in the overall heat demand.
Finally, a sensitivity analysis was performed to investigate the impact of flash pressure reduction on the heat recovery to determine a potential heat demand minimum of the HTC reactor.

3. Results

3.1. Experimental Results

The experimental results confirmed common trends observed for hydrothermal carbonization. A detailed overview can be found in Table 2. More severe reaction conditions led to a decreasing solid yield but an increasing carbon content, which is well in the range of other reports using DSS in HTC [7,9,11]. However, the increasing carbon content is masked by the massive ash content of DSS, as most ash-forming components remain in the resulting HC. Looking at an ash-free carbon content (see Table 2) reveals its clear increase for all the experiments (CDSS = 53.8%TS,af).
Mechanical dewatering in lab-scale as described before revealed no significant impact of the reaction conditions on the drainability of the resulting HC, with an average of 41.2%TS and a standard deviation of only 1.5%TS. The same behavior applies to the measured HHV, as ash is a dominant component in HC from DSS, with the ash content ranging from 49.4–58.4%TS.
To estimate the achievable phosphorus concentration in the resulting HC when applying a more effective mechanical dewatering at larger scale (e.g., screw press, filter press, belt filter press), experimental results were used to calculate those theoretical values according to Equation (3). The results for a TS content of 50, 70, and 90% after mechanical dewatering are summarized in Table 3. Whereas 70%TS seems realistic as indicated by reports at demonstration-scale [7,11,19,20], a residual 90%TS is simply given for comparison.
From the data, it becomes clear that even an applied starting pH as low as 3 is not enough to shift enough phosphorus to the liquid phase after HTC to get below the threshold of 20 g kgTS−1. The share of phosphorus that needs to be shifted to the PW to fulfill the threshold in the resulting HC was calculated to be 57.4% for the DSS used here. The degree of dewatering obviously affects the concentration of phosphorus that needs to be found in the process water.
The parameter variation conducted here resulted in a maximum shift of phosphorus of only 8.3% to the PW in run 1 resulting in a phosphorus concentration of 2.4 g L−1. The previously mentioned shift of 57.4% of phosphorus to the PW would result in phosphorus concentrations of 13.3 or 10.4 g L−1 in PW when dewatering the resulting HC to 50 or 70%TS, respectively. Obviously, the starting pH needs to be even lower to shift significant amounts of phosphorus to the liquid phase during HTC.

3.2. Regression Modeling

Regression modeling was done according to the procedure described in detail by [9]. The parameters of interest in this study include (i) the parameters helpful for a general evaluation (TS, SY, HHV), (ii) the parameters that were used as optimization criteria (EY, P concentration in PW), and (iii) the parameters that are fed into the Aspen Plus model at the optimized process parameters (C, H, N, S, O, ash). Regression modeling used the maximum HTC reaction temperature (see Table A1) instead of the actual targeted process temperature to acknowledge the subsequent energetic optimization in Aspen Plus. All of the coded regression model coefficients can be found in Table 4. As the model terms of higher order (xT2xt, xT2xpH, xTxt2) were of lower significance in all of the models, they were again excluded from the models.
Adjusted R2 was the lowest for the regression model for TS (0.64), mainly caused by high deviations at the lowest reaction temperatures still yielding an acceptable fit. All other regression models showed a much better adjusted R2, with at least 0.8.
Coded regression model coefficients indicate the change of a certain output parameter when changing the input parameter by one level. In this study, one level corresponds to a temperature change of 30 °C, a prolonging of the holding time by 105 min, or a starting pH change of 2.
Table 4 shows that temperature and starting pH have a statistically significant influence (p < 0.05) on the output parameters in all models. In contrast to [9] also using DSS for HTC experiments, holding time also had a significant effect in nearly every model. They used a face-centered central composite design with a much narrower window for holding time corresponding to a 30 min increment per level. The prolonged holding time used here resulted in distinct effects, especially in the case of SY and, subsequently, EY. The effect of holding time is of the same order of magnitude as reaction temperature and initial pH, indicating that a very long holding time is unfavorable for achieving high yields. This is supported by other findings applying holding times of up to 10 h [21]. They further report comparable coded factors (e.g., −5.56 for temperature using the same increment of 30 °C) despite using a completely different feedstock (olive stone).
As expected, the concentration of phosphorus in the resulting PW is mainly influenced by pH. It can also be seen from Table 4 that a low starting pH negatively affects the final sulfur concentration in HC due to the use of sulfuric acid in these experiments. Experimental results and the corresponding model for the ash content of HC fit very well the general opinion of recent literature that an increased reaction temperature and prolonged holding time lead to an accumulation of ash, especially when using high-ash feedstocks like DSS [12,22].

3.3. Numerical Optimization of Process Parameters

Numerical optimization using Design-Expert was conducted with the primary target of simultaneously achieving a maximized EY and maximized P concentration in the resulting PW. As a result, the optimized parameter combinations (especially regarding reaction temperature and holding time) were close to the values at the lower end of the design space (197 °C, 30 min). Therefore, additional constraints by means of a minimized reaction temperature (197 °C) and minimized holding time (30 min) were included in the optimization. Results regarding starting pH were similar in the range of 3–3.2, again indicating that an even lower pH is needed to shift even more P into the liquid phase during HTC of DSS.
Overall optimization then led to the parameter combination of 197 °C, 30 min, and a starting pH of 3 used to determine the composition of the resulting HC needed for the subsequent modeling in Aspen Plus. Those values can be found in Table 5.

3.4. Flowsheeting Results

The following section discusses the results of the flowsheeting efforts concerning the implementation of HTC technology in a WWPT. Table 6 summarizes the mass balance of the developed process model (Figure 2). The IDs of the corresponding streams can be found in the detailed flowsheet in the appendix. The amount of SS used as input for the modeled HTC equals the output of a large scale WWTP in Germany with an assumed capacity of 500,000 PE.
Energy reduction of the temperature-intensive HTC is key for making this process more economically viable. Therefore, the fed SS is pre-heated with flashed steam from the product slurry in a highly efficient heat exchanger (hx) in this model. The remaining heat to meet reaction conditions is generated externally and introduced into the double-walled reactor typically via heat transfer oil. Minimizing the thermal energy demand directly correlates with the reduction of utility costs.

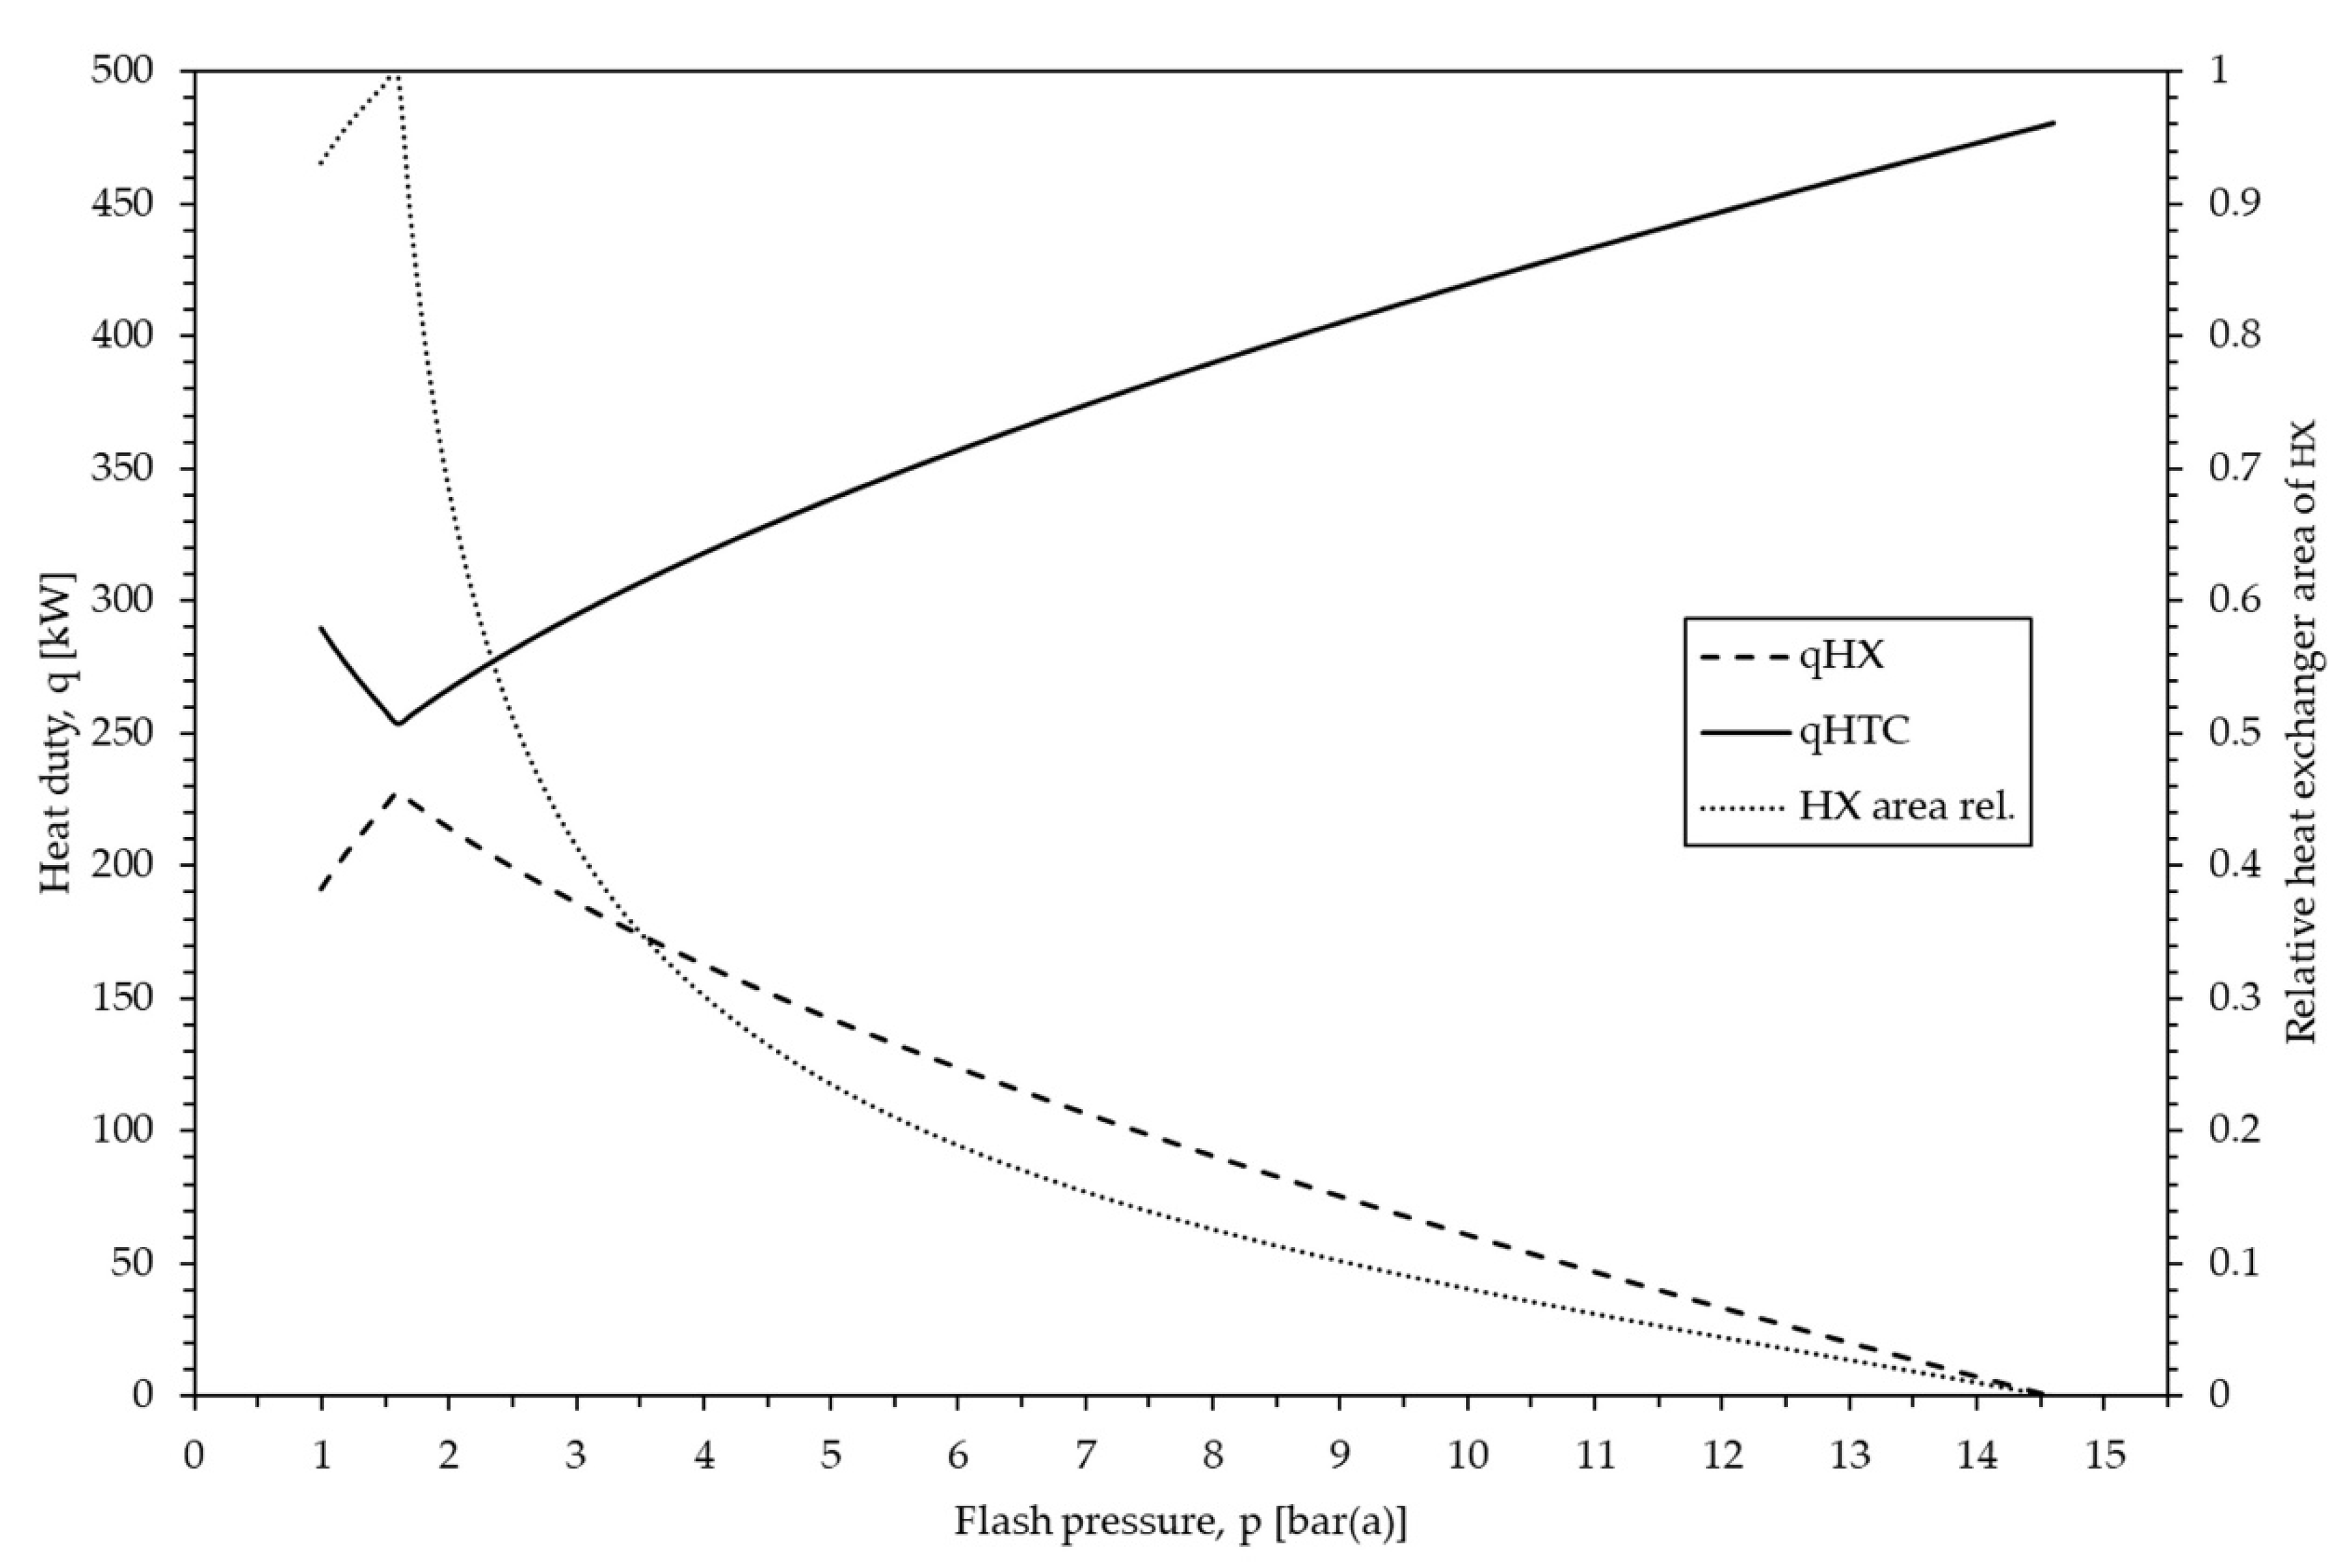
3.5. Sensitivity Analysis of the Flashing Pressure

Generating steam (htc-st1) is realized by flashing the reactor pressure to a defined level. The remaining slurry is treated in the belt filter press (press). Figure 3 compares the remaining heat duty that needs to be added to the reactor to obtain reaction conditions (qHTC) with the heat duty of the heat exchanger for pre-heating (qHX). The lowest overall heat demand of the reactor was calculated at a flashing pressure of 1.6 bar(a). At this point, flashed steam and the slurry stream both have a temperature of 113.3 °C.
Reducing the flashing pressure starting at the water saturation pressure of 14.6 bar(a) at the reaction temperature of 197 °C down to the optimum value of 1.6 bar(a) subsequently reduces the necessary heat duty of the HTC reactor itself using the heat provided by the increasing amount of flashed steam. The heat from the flashed steam can be efficiently used as long as the heat exchanger area of hx is large enough to allow for complete condensation of the flashed steam. Heat duty of the HTC reactor can be nearly halved down to 254 kW at this optimum flashing pressure compared to an energy demand of 481 kW when not flashing at all (Figure 3). This can be explained by the inherent thermodynamic benefits of steam compared to liquid water or an HTC product slurry. The mass balance in Table 6 shows that the steam amount (given as condensate) is around eight times less compared to the input (given as SS). However, good heat transfer can be achieved, since the enthalpy of dry saturated steam is roughly five times higher than liquid water within the investigated pressure range.
The model further indicates that the required heat exchanger area increases exponentially for the reduction of the heat duty of the reactor below 300 kW to allow for the aforementioned complete condensation of the flashed steam. For industrial applications, an optimum balance between investment costs and continuous energy savings has to be acknowledged. Further reducing the flashing pressure below the determined optimum of 1.6 bar(a) reduces the temperature level of the produced steam too far. Temperature is then too low to the contained energy at its full potential as the enthalpy of condensation remains unused.

3.6. Overall Energetic Considerations

In modern WWTPs, belt filter presses are an effective technology commonly used for the mechanical dewatering of SS achieving a TS content of max. 35% [3]. Even at such a very high TS content of SS, its HHV as received is 4.76 MJ kg−1. In order to avoid high costs for transportation as well as the potentially negative impacts on the incineration itself, mechanically dewatered SS is often thermally dried to achieve the TS contents of 85–95% [8,23]. HTC-plants at demonstration-scale using a subsequent mechanical dewatering have shown that TS contents of 70% can already be obtained after hydrothermal treatment [24].
Table 7 gives an overview on potential thermal energy savings adding a HTC to a common WWTP. Three scenarios are compared starting with a base scenario of a WWTP mechanically dewatering SS to 35%TS. The second scenario hydrothermally upgrades the SS to allow for a mechanical dewatering of up to 70%TS. The third scenario additionally includes the results of the energetic optimization of the HTC by flashing the product slurry and using the flashed steam for pre-heating SS. In all three cases, a subsequent thermal drying of the solid product to achieve 90%TS is included. For this drying, a continuous drum dryer with an average thermal energy demand of 850 kWh tH2O−1 was assumed [8]. Such a drum dryer would need an additional 60 kWh tH2O−1 of electrical power. In comparison, the total electrical power demand of mechanical dewatering is estimated to be about 20–30 kWh tTS−1 [3]. This equals 14–21 kWh tH2O−1 when mechanically dewatering from 35–70%TS. Therefore, electrical power demand for dewatering and drying is negligible compared to the potential savings in heat demand. An additional slurry pump to feed the HTC reactor and its agitation are assumed to add in total only 10–15 kWh tSS−1, which is also neglected in Table 7.
The energy demand needed for thermal drying can be reduced by 82% due to the much better mechanical dewatering after hydrothermal treatment reaching up to 70%TS. Of course, HTC itself will come with a certain amount of thermal energy demand that is calculated to be 160.3 kWh tSS−1 in scenario #2 implementing an HTC without heat recovery. Still, this would already reduce the overall thermal energy demand by 26% compared to the base scenario #1 directly drying SS to 90%TS. Furthermore, implementing the optimized flashing procedure described before will reduce the overall thermal energy demand by 53% due to the lowered thermal energy demand of the HTC itself. Thermal energy savings could then be as high as 151.5 kWh tSS−1.

3.7. Condsiderations Regarding Energy Generation by Incineration

Further energetic advantages of HTC technology can be achieved by using the produced HC as a fuel [25]. Table 8 compares the energetic potential of dried SS and HC. The small decrease in HHV of HC compared to the dried SS can be explained by the increase of the ash content in HC (49.0%TS) compared to SS (41.5%TS). Additionally, the loss of carbon by the formation of carbon based gases (primarily CO2) [18] and various organic compounds found in the resulting PW (e.g., formic and acetic acid) [26] further decreases HHV. The corresponding SY of 87.1% is considered in these calculations. Table 8 depicts the combustion of the achieved products in a common combined heat and power plant (CHP) with an assumed energetic efficiency of 80%. The heat of combustion is a key parameter for designing these plants and is of the same order of magnitude for both cases directly firing dried SS or producing HC from it. It is also assumed that 80% of the total amount of produced energy can be used thermally and 20% electrically. It is shown that the heat required for the HTC in both scenarios #2 and #3 (Table 7) could be easily covered by the energy provided from the combustion of HC (Table 8). Furthermore, the electrical power demand of the HTC (as well as the mechanical dewatering) could also be covered. As a side note, combustion of the dried SS would also be able to cover the energy demand of scenario #1 without HTC at all. However, in a combined process with an implemented HTC additional 51.2 kWh tSS−1 of thermal energy could be used for other needs at the WWTP or in its vicinity.

4. Conclusions

It is shown that treating SS with HTC at a low pH is able to shift phosphorus from the solid to the liquid phase. In addition, processed SS shows an increased mechanical dewaterability. In this study, the governmental requirement of 20 g kgTS−1 phosphorus in the solid phase was yet not achieved. However, depending on the substrate, it can be assumed that by lowering the pH even below 3, the requirements are in reach. Theoretically, extracting phosphorus from the pH driven equilibrium during the reaction could allow for more moderate pH values to achieve this threshold. In that case, an expensive mono-incineration plant would be obsolete and the discussed modular HTC concept would be a robust, effective addition to WWTPs.
Flowsheeting has shown that pre-heating the fed SS with flashed steam from the product slurry could reduce the heat demand of the energy intensive HTC process by 47%. The impact of a hydrothermal treatment on the entire SS drying process regarding thermal energy savings is as high as 53%. Additionally, at least part of the produced HC could be incinerated to supply the needed heat for the HTC and the thermal drying. Taking into account electric power generation could make the plant self-sufficient from an energetic point of view. The remainder of the produced HC could be used to generate an additional energy surplus.

Author Contributions

Conceptualization, DBFZ Deutsches Biomasseforschungszentrum Gemeinnützige GmbH; methodology, B.W.; validation, B.W., H.E. and P.K.; formal analysis, B.W. and P.K.; investigation, H.E., P.K. and B.W.; resources, H.E.; data curation, B.W. and P.K.; writing—original draft preparation, P.K.; writing—review and editing, P.K., B.W. and H.E.; visualization, B.W. and P.K.; supervision, B.W.; project administration, H.E.; funding acquisition, DBFZ Deutsches Biomasseforschungszentrum Gemeinnützige GmbH. All authors have read and agreed to the published version of the manuscript.

Funding

This research was funded by the Sächsische Aufbaubank (SAB) financed by the European Regional Development Fund (ERDF) under grant no. 100283030. This research also received funding by the German Federal Ministry of Transport and Digital Infrastructure (BMVI) in the framework of the Federal Government’s Mobility and Fuel Strategy (MKS).

Institutional Review Board Statement

Not applicable.

Informed Consent Statement

Not applicable.

Data Availability Statement

Not applicable.

Acknowledgments

The authors would like to thank all the technical staff at DBFZ Deutsches Biomasseforschungszentrum Gemeinnützige GmbH for helping with the experiments and the laboratory staff at DBFZ for conducting all the analyses.

Conflicts of Interest

The authors declare no conflict of interest. The funding agencies had no role in the design of the study; in the collection, analyses, or interpretation of data; in the writing of the manuscript, or in the decision to publish the results.

Appendix A

Table A1. Experimental plan, maximum temperatures, and time above 140 °C.
Run No.T
(°C)
Tmax
(°C)
T
(min)
t140
(min)
Starting pH
(-)
1210227301133
2240250301465
32402491352483
42102292403157
52102181352235
62102291352335
72402501352407
81802082402925
91802051351893
102402492403495
112102232403223
122102261352165
1318019730855
14210228301257
151802011351937

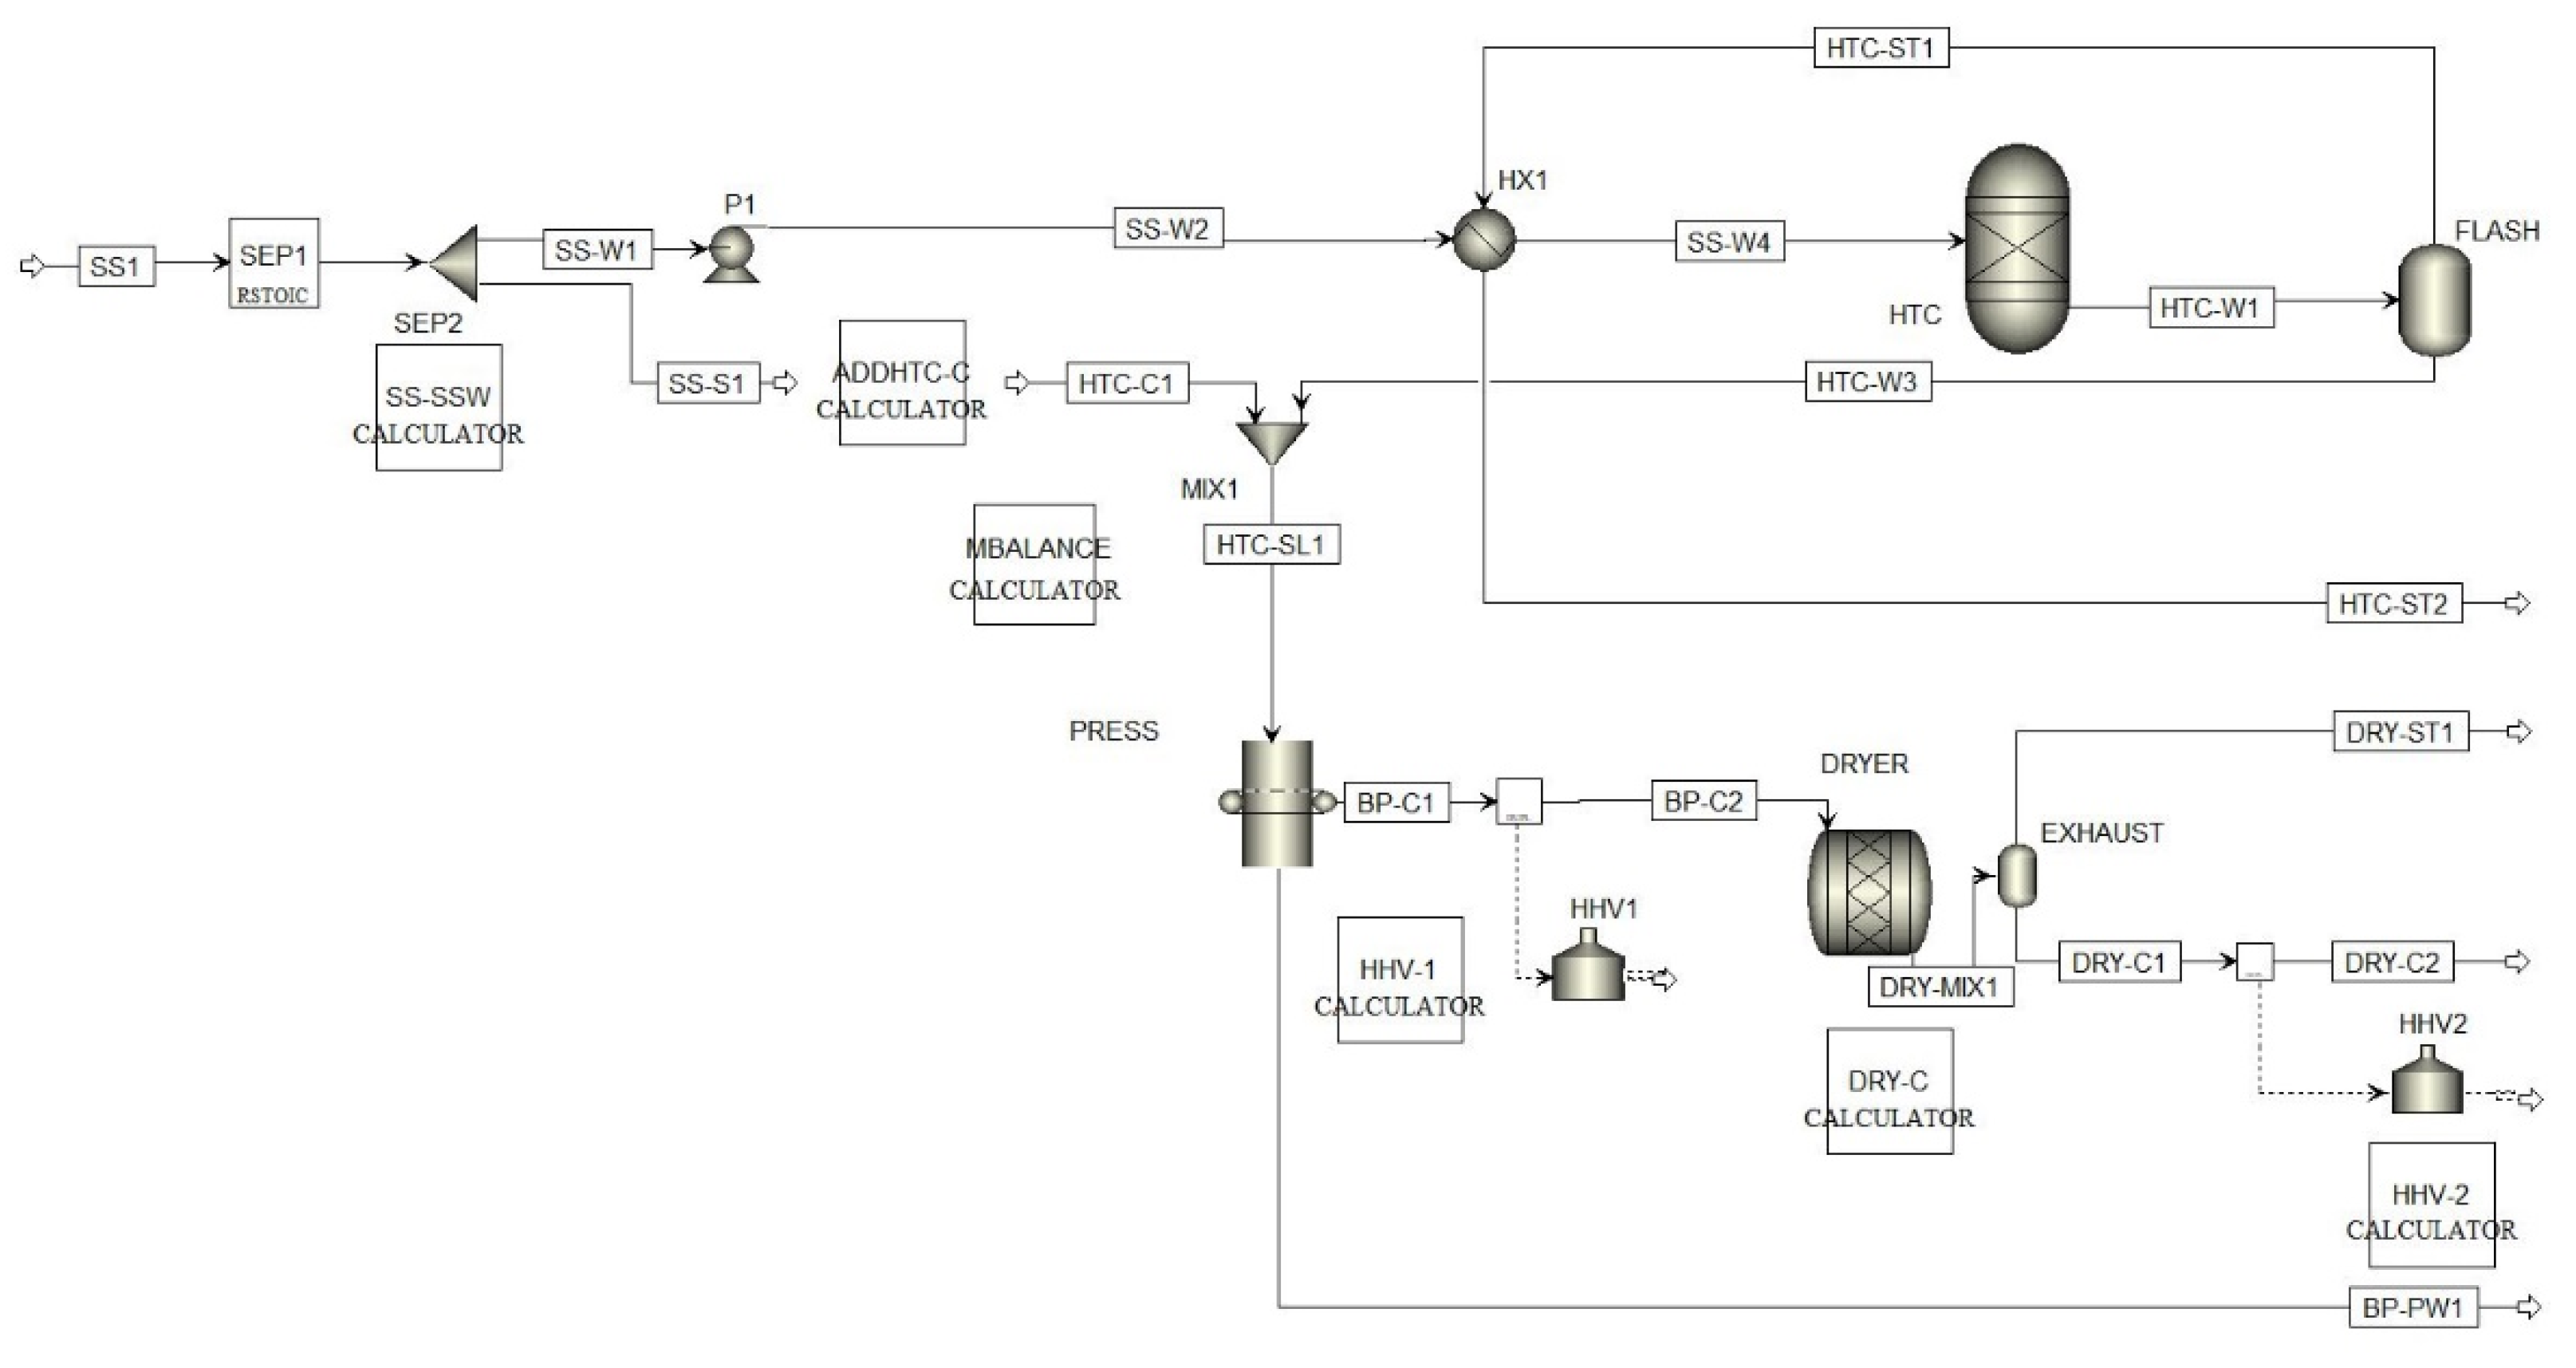
Appendix A.1. Aspen Flowsheet and Modelling Assumptions

Figure A1. Aspen Plus flowsheet of heat integrated HTC and subsequent drying including the used calculator blocks to manipulate unit operations.
Processes 09 01346 g0a1
Table A2. Ultimate and proximate analysis of the NC input stream ss1 in %.
Proximate AnalysisUltimate Analysis
Moisture75.2Ash41.5
FC7.2Carbon31.5
VM54.7Hydrogen4.3
Ash41.5Nitrogen4.8
Chlorine0.0
Sulfur1.7
Oxygen16.2
FC = fixed carbon; VM = volatile matte.
Table A3. Pseudo-reactions in RSTOIC unit operations for NC component handling regarding separation (sep1) and drying (dryer).
Specification TypeStoichiometry
Frac. conversionCOAL --> 0.0555084 WATER(MIXED)
The conversion rate can be chosen randomly since it will be manipulated by the below listed calculators.

Appendix A.2. Fortran Expressions of Underlying Calculator Blocks

//Calculator ss-ssw:
CONV = WSS/100
Table A4. Variables used in calculator block ss-ssw.
VariableInformation FlowDefinition
CONVExport variableBlock-Var Block = SEP1 Variable = CONV Sentence = CONV ID1 = 1
WSSImport variableCompattr-Var Stream = SS1 Substream = NC Component = COAL Attribute = PROXANAL Element = 1
//Calculator addhtc-c:
CW1=0.129*SSS1
CC1 = SS-W3-ST2-CW1
PC1 = PW3
TC1 = TW3
Table A5. Variables used in calculator block addhtc-c.
VariableInformation FlowDefinition
SSImport variableStream-Var Stream = SS1 Substream = NC Variable = MASS-FLOW Units = kg/hr
W3Import variableStream-Var Stream = HTC-W3 Substream = MIXED Variable = MASS-FLOW Units = kg/hr
PW3Import variableStream-Var Stream = HTC-W3 Substream = MIXED Variable = PRES Units = bar
PC1Export variableStream-Var Stream = HTC-C1 Substream = NC Variable = PRES Units = bar
TW3Import variableStream-Var Stream = HTC-W3 Substream = MIXED Variable = TEMP Units = C
TC1Export variableStream-Var Stream = HTC-C1 Substream = MIXED Variable = TEMP Units = C
CC1Export variableStream-Var Stream = HTC-C1 Substream = NC Variable = MASS-FLOW Units = kg/hr
ST2Import variableStream-Var Stream = HTC-ST2 Substream = MIXED Variable = MASS-FLOW Units = kg/hr
CW1Export variableStream-Var Stream = HTC-C1 Substream = MIXED Variable = MASS-FLOW Units = kg/hr
SSS1Import variableStream-Var Stream = SS-S1 Substream = NC Variable = MASS-FLOW Units=kg/hr
//Calculator mbalance:
NCSL1 = C1/(1-C1W/100)
MIXSL1 = SS-NCSL1-ST2
Table A6. Variables used in calculator block mbalance.
VariableInformation FlowDefinition
MIXSL1Export variableStream-Var Stream = HTC-SL1 Substream = MIXED Variable = MASS-FLOW Units = kg/hr
NCSL1Export variableStream-Var Stream = HTC-SL1 Substream = NC Variable = MASS-FLOW Units = kg/hr
SSImport variableStream-Var Stream = SS1 Substream = NC Variable = MASS-FLOW Units = kg/hr
ST2Import variableStream-Var Stream = HTC-ST2 Substream = MIXED Variable = MASS-FLOW Units = kg/hr
C1Import variableStream-Var Stream = HTC-C1 Substream = NC Variable = MASS-FLOW Units = kg/hr
C1WImport variableCompattr-Var Stream = HTC-C1 Substream = NC Component = COAL Attribute = PROXANAL Element = 1
//Calculator dry-c:
CONV = (WIN-WOUT)/(100-WOUT)
QS = 850
Q = QS*MF/1000*(WIN-WOUT)/100
Table A7. Variables used in calculator block dry-c.
VariableInformation FlowDefinition
WINImport variableCompattr-Var Stream = BP-C2 Substream = NC Component = COAL Attribute = PROXANAL Element = 1
WOUTImport variableBlock-Var Block = DRYER Variable = COMPATT Sentence = COMP-ATTR ID1 = NC ID2 = COAL ID3 = PROXANAL Element = 1
CONVExport variableBlock-Var Block = DRYER Variable = CONV Sentence = CONV ID1 = 1
MFImport variableStream-Var Stream = BP-C2 Substream = NC Variable = MASS-FLOW Units = kg/hr
QExport variableBlock-Var Block = DRYER Variable = DUTY Sentence = PARAM Units = kW

References

  1. Umweltbundesamt (UBA). Klärschlammentsorgung in der Bundesrepublik Deutschland, Dessau-Roßlau. 2018. Available online: https://www.umweltbundesamt.de/publikationen/klaerschlammentsorgung-in-der-bundesrepublik (accessed on 8 July 2021).
  2. Statistisches Bundesamt (Destatis). Abwasserbehandlung–Klärschlamm, Berlin 2015/2016. Available online: https://www.destatis.de/DE/Themen/Gesellschaft-Umwelt/Umwelt/Wasserwirtschaft/Publikationen/Downloads-Wasserwirtschaft/klaerschlamm-5322101169004.html (accessed on 8 July 2021).
  3. Union of the Baltic Cities (UBC); Luft, J.-E.; Ojala, T.; Ruokanen, L.; Zinchuk, O. Bewährte Verfahren in der Schlammbehandlung. 2012. Available online: https://www.ubc-sustainable.net/library/publication/bew%C3%A4hrte-verfahren-der-schlammbehandlung (accessed on 8 July 2021).
  4. Verordnung über die Verwertung von Klärschlamm, Klärschlammgemisch und Klärschlammkompost (Klärschlammverordnung—AbfKlärV). 2017. Available online: https://www.gesetze-im-internet.de/abfkl_rv_2017/BJNR346510017.html (accessed on 8 July 2021).
  5. EUWID Wasser und Abwasser. Report Klärschlamm 2018: Die neue Klärschlammverordnung Paradigmenwechsel für die Abwasserentsorgung. 2017. Available online: https://www.euwid-wasser.de/klaerschlamm-report-2018 (accessed on 8 July 2021).
  6. Gerhardt, A.; Kabbe, C.; Rastetter, N.; Stemann, J.; Wilken, V. Sustainable Sewage Sludge Management Fostering Phosphorus Recovery and Energy Efficiency: Deliverable D 8.1 Quantification of Nutritional Value and Toxic Effects of Each P Recovery Product. 2015. Available online: https://zenodo.org/record/242550/files/P-REX%20D8.1%20Quantification%20of%20nutritional%20value%20and%20toxic%20effects%20of%20each%20P%20recovery%20product.pdf?download=1 (accessed on 8 July 2021).
  7. Escala, M.; Zumbühl, T.; Koller, C.; Junge, R.; Krebs, R. Hydrothermal Carbonization as an Energy-Efficient Alternative to Established Drying Technologies for Sewage Sludge: A Feasibility Study on a Laboratory Scale. Energy Fuels 2012, 27, 454–460. [Google Scholar] [CrossRef]
  8. Geyer, J. Klärschlammtrocknung in Deutschland: Stand und Perspektiven. Energie Abfall 2013, 2013, 927–948. [Google Scholar]
  9. Lühmann, T.; Wirth, B. Sewage Sludge Valorization via Hydrothermal Carbonization: Optimizing Dewaterability and Phosphorus Release. Energies 2020, 13, 4417. [Google Scholar] [CrossRef]
  10. Danso-Boateng, E.; Shama, G.; Wheatley, A.D.; Martin, S.J.; Holdich, R.G. Hydrothermal carbonisation of sewage sludge: Effect of process conditions on product characteristics and methane production. Bioresour. Technol. 2015, 177, 318–327. [Google Scholar] [CrossRef] [PubMed] [Green Version]
  11. Reza, M.T.; Andert, J.; Wirth, B.; Busch, D.; Pielert, J.; Lynam, J.G.; Mumme, J. Hydrothermal Carbonization of Biomass for Energy and Crop Production. Appl. Bioenergy 2014, 1, 11–29. [Google Scholar] [CrossRef]
  12. Libra, J.A.; Ro, K.S.; Kammann, C.; Funke, A.; Berge, N.D.; Neubauer, Y.; Titirici, M.-M.; Fühner, C.; Bens, O.; Kern, J.; et al. Hydrothermal carbonization of biomass residuals: A comparative review of the chemistry, processes and applications of wet and dry pyrolysis. Biofuels 2011, 2, 71–106. [Google Scholar] [CrossRef] [Green Version]
  13. Shi, Y.; Luo, G.; Rao, Y.; Chen, H.; Zhang, S. Hydrothermal conversion of dewatered sewage sludge: Focusing on the transformation mechanism and recovery of phosphorus. Chemosphere 2019, 228, 619–628. [Google Scholar] [CrossRef] [PubMed]
  14. Wang, T.; Zhai, Y.; Zhu, Y.; Peng, C.; Wang, T.; Xu, B.; Li, C.; Zeng, G. Feedwater pH affects phosphorus transformation during hydrothermal carbonization of sewage sludge. Bioresour. Technol. 2017, 245, 182–187. [Google Scholar] [CrossRef]
  15. Channiwala, S.A.; Parikh, P.P. A unified correlation for estimating HHV of solid, liquid and gaseous fuels. Fuel 2002, 81, 1051–1063. [Google Scholar] [CrossRef]
  16. IAPWS Industrial Formulation 1997 for the Thermodynamic Properties of Water and Steam. In International Steam Tables; Wagner, W.; Kretzschmar, H.-J. (Eds.) Springer: Berlin, Heidelberg, Germany, 2008; pp. 7–150. ISBN 978-3-540-21419-9. [Google Scholar]
  17. Ramke, H.-G. Hydrothermal Carbonization of Organic Waste. In Proceedings of the Twelfth International Waste Management and Landfill Symposium, Cagliari, Italy, 5–9 October 2009. [Google Scholar]
  18. Wang, L.; Li, A. Hydrothermal treatment coupled with mechanical expression at increased temperature for excess sludge dewatering: The dewatering performance and the characteristics of products. Water Res. 2015, 68, 291–303. [Google Scholar] [CrossRef] [PubMed]
  19. Meng, D.; Jiang, Z.; Yoshikawa, K.; Mu, H. The effect of operation parameters on the hydrothermal drying treatment. Renew. Energy 2012, 42, 90–94. [Google Scholar] [CrossRef]
  20. Álvarez-Murillo, A.; Román, S.; Ledesma, B.; Sabio, E. Study of variables in energy densification of olive stone by hydrothermal carbonization. J. Anal. Appl. Pyrolysis 2015, 113, 307–314. [Google Scholar] [CrossRef]
  21. Reza, M.T. Hydrothermal Carbonization of Lignocellulosic Biomass. PhD’s Thesis, University of Nevada, Reno, NV, USA, 2013. [Google Scholar]
  22. Wiechmann, B.; Dienemann, C.; Kabbe, C. Sewage Sludge Management in German. Available online: https://www.umweltbundesamt.de/en/publikationen/sewage-sludge-management-in-germany (accessed on 18 May 2021).
  23. HTP-Fachforum 2019: Hydrothermale Prozesse zur Stofflichen und Energetischen Wertschöpfung. 5. HTP-Fachforum, Leipzig, 25–26 September 2019; DBFZ Leipzig: Leipzig, Germany. 2019. Available online: https://www.dbfz.de/pressemediathek/publikationsreihen-des-dbfz/tagungsreader/5-fachforum-hydrothermale-prozesse (accessed on 8 July 2021).
  24. Erlach, B.; Wirth, B.; Tsatsaronis, G. Co-production of electricity, heat and biocoal pellets from biomass: A techno-economic comparison with wood pelletizing. In Proceedings of the World Renewable Energy Congress 2011, Linkoping, Sweden, 8–13 May 2011. [Google Scholar]
  25. Köchermann, J.; Görsch, K.; Wirth, B.; Mühlenberg, J.; Klemm, M. Hydrothermal carbonization: Temperature influence on hydrochar and aqueous phase composition during process water recirculation. J. Environ. Chem. Eng. 2018, 6, 5481–5487. [Google Scholar] [CrossRef]
  26. Berge, N.D.; Ro, K.S.; Mao, J.; Flora, J.R.V.; Chappell, M.A.; Bae, S. Hydrothermal carbonization of municipal waste streams. Environ. Sci. Technol. 2011, 45, 5696–5703. [Google Scholar] [CrossRef] [PubMed]
Figure 1. Graphical illustration of the chosen design space.
Processes 09 01346 g001
Figure 2. Flowsheet of the modeled hydrothermal carbonization (HTC) process with pre-heating and subsequent mechanical dewatering and thermal drying. (hx = heat exchanger, ss-w = water content of sewage sludge, ss-s = solids content of sewage sludge).
Processes 09 01346 g002
Figure 3. Sensitivity analysis of the flashing pressure for the heat exchanger and the reactor heat duty, as well as the heat exchanger area of HX.
Processes 09 01346 g003
Table 1. Characterization of the used digested sewage sludge.
CHNSOAshPHHVarHHVdaf
(%TS)(g kgTS−1)(MJ kgTS−1)
31.54.34.81.716.241.547.013.623.3
TS = total solids; HHV = higher heating value; ar = as received; daf = dry and ash-free.
Table 2. Overview of the experimental results.
Run No.TSHC
(%FM)
SY
(%)
C
(%TS)
C
(%TS,af)
HHV
(MJ kgTS−1)
EY
(%)
PHC
(g kgTS−1)
PPW
(mg L−1)
140.077.229.058.412.973.234.42410
242.775.728.062.812.771.051.8391
342.472.527.862.012.767.835.91110
441.561.729.768.013.661.657.6134
542.080.028.861.212.976.249.2300
640.670.428.362.512.866.149.5375
741.252.429.671.113.552.361.7146
839.876.629.360.513.375.048.6598
940.976.828.858.112.772.035.12340
1044.562.128.566.713.461.148.3436
1140.268.528.459.312.663.430.71660
1242.070.628.863.413.369.246.7484
1339.784.929.558.313.282.244.2927
1441.972.330.065.013.873.354.2171
1538.669.530.261.713.769.952.3202
TS = total solids; HC = hydrochar; FM = fresh matter; SY = solid yield; af = ash-free; HHV = higher heating value; EY = energy yield; PW = process water.
Table 3. Theoretical phosphorus concentrations of hydrochar at a given degree of dewatering.
Run No.TSHCPPWPHC at a. r.PHC at 50%TSPHC at 70%TSPHC at 90%TS
(%FM](mg L−1)(g kgTS−1)
140.0241034.433.231.831.0
242.739151.851.751.551.4
342.4111035.935.534.834.5
441.513457.657.557.557.4
542.030049.249.148.948.8
640.637549.549.449.149.0
741.214661.761.761.661.5
839.859848.648.348.047.8
940.9234035.134.132.732.0
1044.543648.348.247.947.8
1140.2166030.729.929.028.5
1242.048446.746.546.246.0
1339.792744.243.743.242.9
1441.917154.254.154.054.0
1538.620252.352.252.152.0
TS = total solids; HC = hydrochar; FM = fresh matter; PW = process water; a. r. = as-received.
Table 4. Coded regression model coefficients for all parameters of interest.
Target ValueCoded Regression Model Coefficients
xTxtxpHxTxtxTxpHxtxpHxT2xt2xpH2
TS (%)1.57 −0.18 2.99 0.15 −0.77
SY (%TS)−6.37−4.92−2.66 4.98 −1.04 −4.90
HHV (MJ kgTS−1)−0.21−0.060.45−0.39 0.10
EY (%TS)−6.90−4.580.02 4.43 −0.782.26−4.10
P in PW (mg L−1)−0.73−0.37−2.48 0.130.550.04 0.83
C (%TS)−0.63 0.70 0.47
H (%TS)−0.07−0.010.07−0.06−0.080.11 0.160.21
N (%TS)−0.44−0.200.020.12−0.41−0.140.090.11
S (%TS)0.410.07−1.71 0.27
O (%TS)−3.22−0.30 −0.78
Ash (%TS)4.030.681.051.181.75 −0.13−0.94−0.37
TS = total solids; SY = solid yield; HHV = higher heating value; EY = energy yield; P = phosphorus; PW = process water; C = carbon; H = hydrogen; N = nitrogen; S = sulfur; O = oxygen.
Table 5. Elemental composition of the resulting hydrochar after optimization.
CHNSOAshSYHHVarHHVdaf
(%TS)(MJ kgTS−1)
29.13.63.95.88.649.087.113.025.5
SY = solid yield; TS = total solids; HHV = higher heating value; ar = as received; daf = dry and ash-free.
Table 6. Mass balance under optimal conditions (mechanical dewatering to 70%TS, flash pressure 1.6 bar(a)), resulting in a hydrochar with 90% total solids content.
SSCondensateExhaust AirHCPW
Mass flow (kg h−1)3000.00369.58188.18720.031704.67
IDsshtc-st2dry-st1dry-c2bp-pw1
SS = sewage sludge; HC = hydrochar; PW = process water.
Table 7. Comparison of three scenarios and their thermal energy needed to supply a solid product with a total solids content of 90%.
#ScenarioQHTCQDryerQTotal
(kWh tSS−1)
1WWTP, no HTC, TS = 35% after MDW0.0288.5288.5
2HTC, no heat recovery, TS = 70% after 2nd MDW160.352.5212.8
3HTC, flash to 1.6 bar(a), TS = 70% after 2nd MDW84.552.5137.0
SS = sewage sludge; TS = total solids; MDW = mechanical dewatering.
Table 8. Comparison of the potential energetic use of dried sewage sludge and hydrochar (both at 90%TS) in a combined heat and power plant.
FuelHHV (MJ kg−1)Heat of Combustion (kW)Qtotal *QthermalQelectrical
(kWh tSS−1)
Sewage sludge (TS = 90%)12.22810.8749.5599.6149.9
Hydrochar (TS = 90%)11.72340.4624.1499.3124.8
* assumed efficiency of the combined heat and power plant is 80% with a share of thermal and electrical output of 80/20.
Publisher’s Note: MDPI stays neutral with regard to jurisdictional claims in published maps and institutional affiliations.

