Article

Application of the Modified Fuzzy-PID-Smith Predictive Compensation Algorithm in a pH-Controlled Liquid Fertilizer System

College of Mechanical and Electrical Engineering, Shihezi University, Shihezi 832003, China
*
Author to whom correspondence should be addressed.
Processes 2021, 9(9), 1506; https://doi.org/10.3390/pr9091506
Submission received: 2 August 2021 / Revised: 21 August 2021 / Accepted: 23 August 2021 / Published: 26 August 2021
(This article belongs to the Special Issue Contemporary Methods for Process Modelling and Control)

Abstract

:
An appropriate pH value of liquid fertilizer can enable crops to better absorb nutrients from fertilizers. However, the mixed liquid fertilizer with high concentration of liquid fertilizer and irrigation water has a high pH value, which affects the absorption of nutrients by crops. Therefore, the precise regulation of liquid fertilizer pH value is an important link to realize the integration of water and fertilizer in modern agriculture. Due to pipeline transportation and diffusion of the regulating liquid and liquid fertilizer, the pH value control system has the characteristics of time-varying, non-linear and time-delayed models, and it is difficult for ordinary controllers to accurately control the pH value of liquid fertilizer. Therefore, modern agriculture urgently needs a controller that can adapt to non-linear and uncertain systems. According to the characteristics of the pH regulation process of liquid fertilizer, this study proposes and designs a modified fuzzy-PID-Smith predictive compensation algorithm, which adds the fuzzy-PID algorithm to the predictor of the conventional Smith algorithm to compensate for the error between the actual and theoretical models in order to reduce the decline of control quality caused by the model mismatch to the control system. To verify the practicability and robustness of the algorithm in practical applications, a liquid fertilizer pH value control system with STM32F103ZET6 as the control core was developed. The pH control system with fuzzy-PID and Smith algorithm as controller was used as the control group. The model was simulated and tested under two conditions of exact matching and imprecise matching, and performance tests were carried out under different output flow rates. The results showed that the maximum overshoot of the modified fuzzy-PID-Smith predictive compensation algorithm was significantly less than that of the other two algorithms at different output flow rates, with an average of 0.23%. The average steady-state time of adjusting the pH value of liquid fertilizer from 7.3 to 6.8 was 72 s, which was superior to the 145 s and 3.2% of fuzzy-PID and 130 s and 1.4% of the Smith controller.

1. Introduction

In recent years, with the advancement of agricultural mechanization and modernization, the integration of water and fertilizer technology has rapidly developed. The integration of water and fertilizer is a new agricultural technology that integrates agricultural irrigation and fertilization control. According to the nutrient demand of crop growth, this technology accurately regulates the pH value and EC value of water and fertilizer and gives the optimal pH value of water and fertilizer for crop growth, which is conducive to the absorption of liquid fertilizer nutrients by crop roots and the promotion of crop growth [1]. After adjusting the pH value, water and fertilizer can effectively improve the soil quality and reduce the pollution of fertilizer in the environment [2].
However, In precision agriculture, the regulation process of liquid fertilizer pH value has the volume delay of pipeline transmission and a reaction delay of the neutralization process, resulting in time-varying, hysteresis and non-linearity of the system [3,4]. Understanding how to apply fertilizer quickly and effectively adjust the pH value of water and fertilizer in the process is a hot issue in today’s water and fertilizer integration technology [5]. Tan et al. [6] obtained the parameters of the static antititration relationship through a genetic algorithm, linearized the regulation process model, and then applied the PID controller after parameter optimization to the pH value regulation device. The experiment showed that the controller had a faster response speed and smaller overshoot in pH regulation. Zou Zhiyun et al. [7] proposed a non-linear Hammerstein MAC algorithm, which can track the set value in time and suppress interference. Through simulations and experiments, it was found that even in the case of model mismatch, the non-linear Hammerstein MAC algorithm showed good robustness and stability. Homero J. Sena et al. [8] designed a real-time adaptive correction of artificial neural network prediction through the extended Kalman filter (EKF). Compared with the MPC of the artificial neural network, this algorithm reduced the oscillation of the system and the sum of square error of the controlled pH value by 64.3%. Sanaz Mahmoodi et al. [9] designed a Wiener–Laguerre model. The linear and non-linear parts of the Wiener structure of the model were Laguerre filters and simple polynomials. Based on this model, the pH neutralization process identification was evaluated in different orders. Experimental results showed that the model fitted well and improved the quality of the model. E. Ali [10] designed an adaptive PI algorithm to predict the closed-loop response of the model and sensitivity to the algorithm parameter settings according to the characteristics of the pH neutralization process and then adjusted the controller parameters online.
Adjusting and optimizing a fuzzy algorithm can improve the control effect of a non-linear system noticeably. B. Demaya et al. [11] associated the gradient algorithms and Rosenbrok’s algorithms with the qualitative supervision level of multilayer structure to optimize the fuzzy controller, and put the optimized fuzzy controller into the chaotic system for simulation experiment. The results showed that the algorithm had good control effect in linear, nonlinear, stable and unstable systems. T. Nalovsky et al. [12] improved the fuzzy PI control system of superheated steam temperature for a once-through boiler, optimizing the parameters of the fuzzy function of high-pressure steam temperature by minimizing the minimum deviation between the actual temperature output calculated by the standard and the response output with fixed parameters. The simulation results showed that the system can significantly improve the controlled process. Shahid Hussain et al. [13,14,15]. undertook in depth research on the optimization and application of fuzzy control. When an EV parking lot is faced with a huge charging load, Shahid Hussain proposed a fuzzy logic weighting scheme, which assigns weights to the relevant states of each vehicle and schedules the charging operation according to the weights, so as to optimize the distribution of charging power for an EV. Under the constraint of a power grid, a two-stage fuzzy logic reasoning algorithm was proposed to optimize the performance quality of the EV parking lot. In the first stage, the total charge–discharge energy of the EV is obtained by the next travel distance of EV, and in the second stage, the charging amount of the EV is regulated by preference variables.
At present, the most common method to overcome pure hysteresis in industry is Smith predictive control [16]. Guangda Chen [17] proposed a Smith predictor combined with linear active disturbance rejection control (LADRC), which solves the problem of the estimated and actual models in the Smith predictor needing to be accurately matched. It was proven after simulation testing and application experiments. The performance indicators of this algorithm are better than those of traditional algorithms. Haocai Huang et al. [18] put a first-order filter in the Smith predictor in view of the characteristics of large inertia, time delay and a complex and changeable environment in the process of deep-sea hydraulic oil replenishment. The simulation results of the controller showed that the algorithm has small oscillations and overshoots and can reach the steady state of the system in a short time. The algorithm also confirmed the simulation results in practical applications. Vicente Feliu-Batlle and Raul Rivas-Perez [19] established a dynamic model of heating furnace crude oil temperature control. To ensure the stability and sensitivity of the control, they designed a proportional integral controller embedded in the Smith predictor. The simulation results showed that the system can effectively suppress the interference and maintain steady-state control in the dynamic changes of parameters.
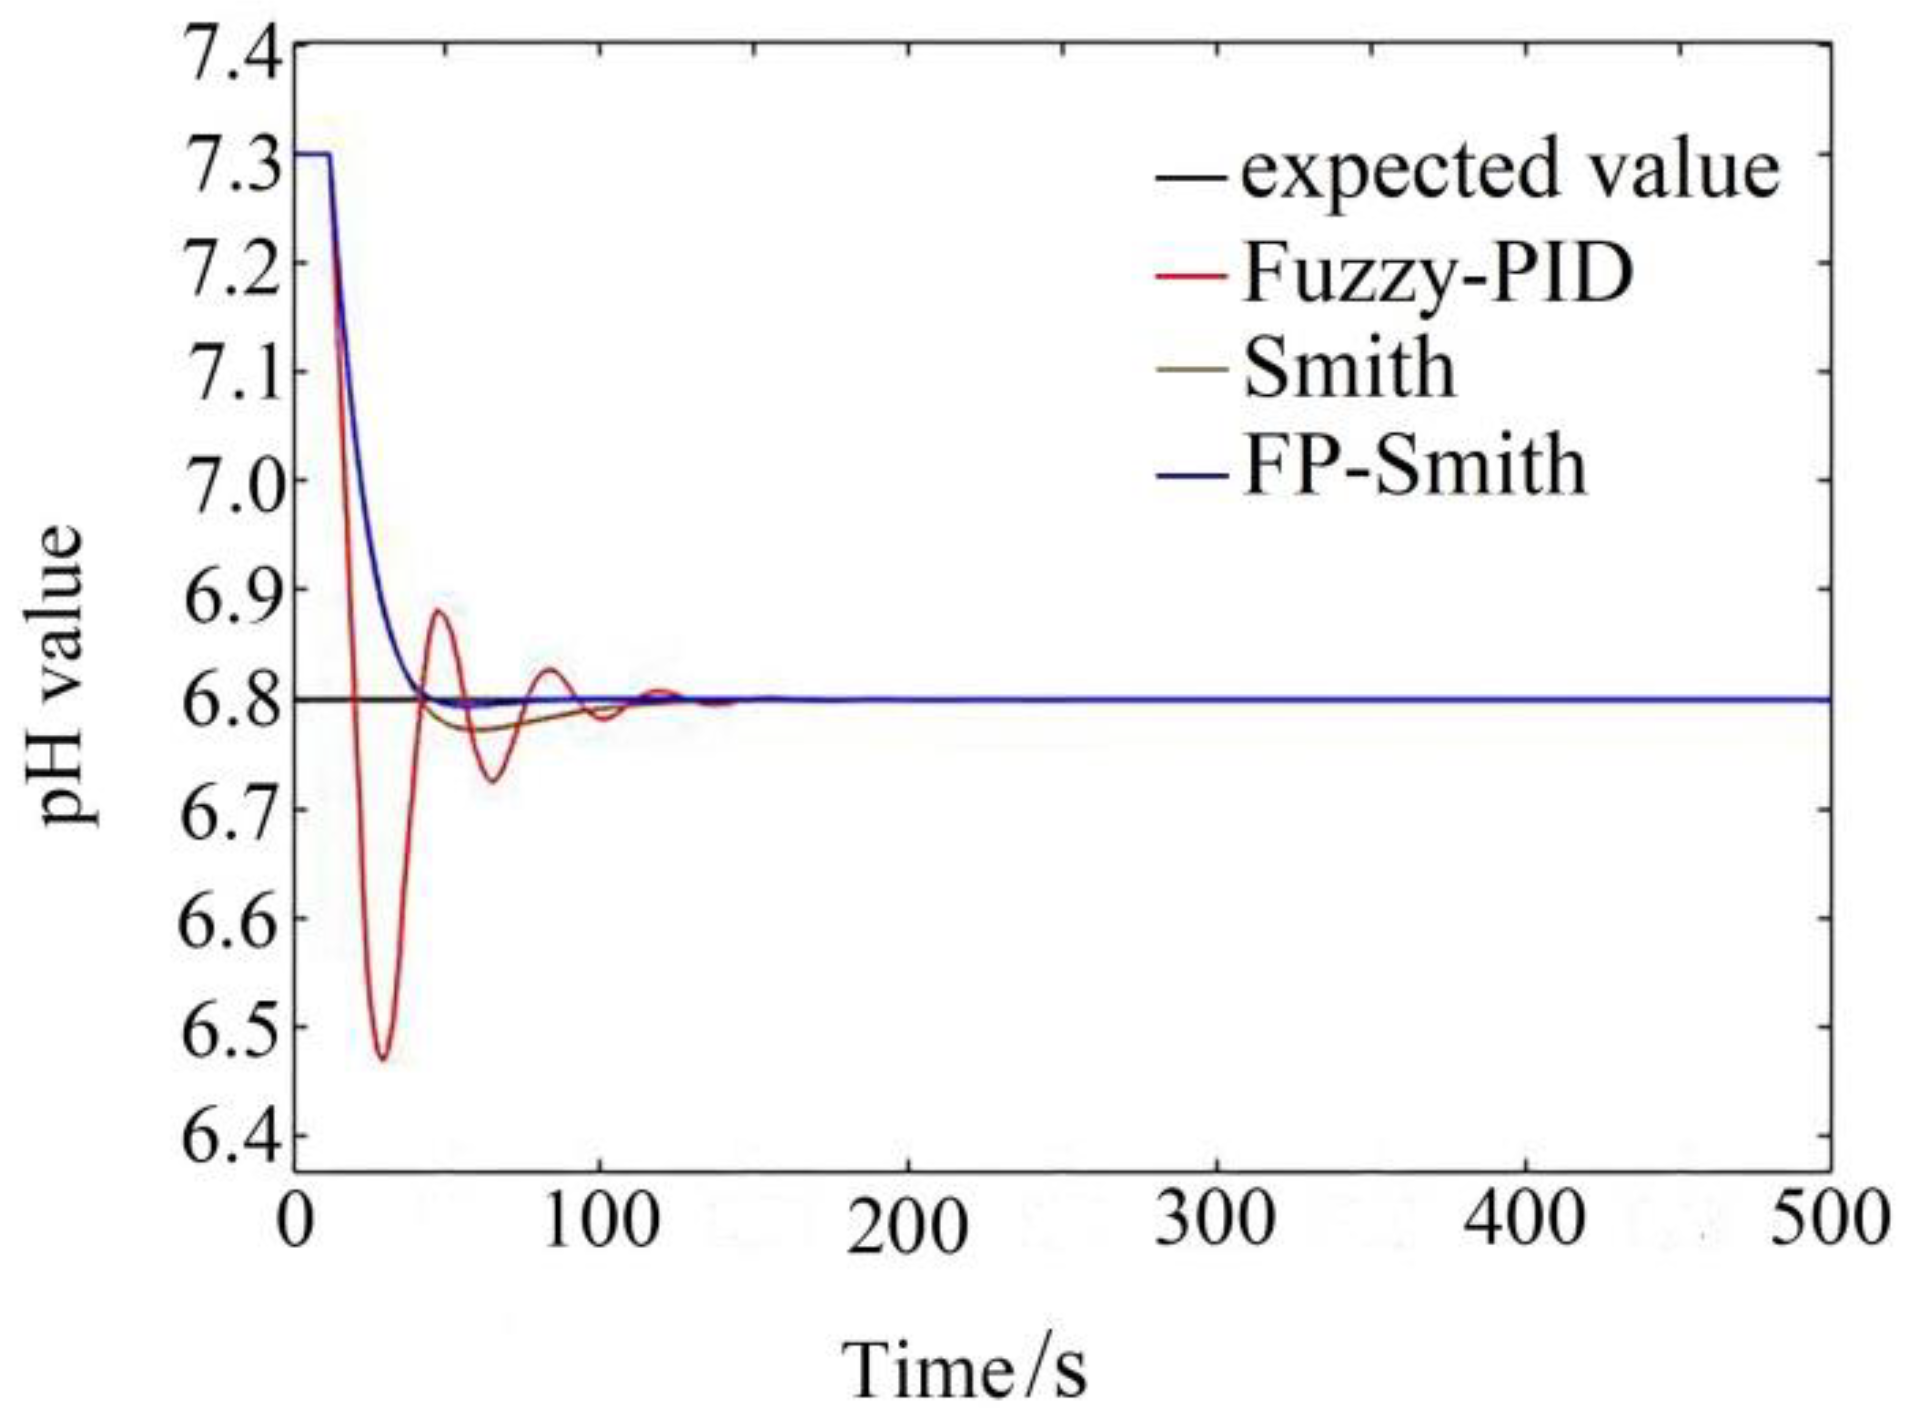
In this paper, fuzzy-PID, Smith and modified fuzzy-PID-Smith controllers (hereinafter referred to as FP-Smith controllers) for adjusting the pH value of liquid fertilizers were designed. The simulation analysis was carried out for two cases of model matching and non-matching, and the step response curve was obtained. The performance evaluation of the controller through four aspects—rise time, peak time, maximum overshoot and steady-state time [20]—indicates that the FP-Smith controller has the best control effect. In addition, based on STM32F103ZET6, four control algorithms were applied to the pH control system of liquid fertilizer, and the effectiveness of the three algorithms was verified by experiments. The results further showed that the FP-Smith predictor compensator can effectively solve the time-variation, time-delay and non-linearity of the pH control model of liquid fertilizer. Thus, this approach meets the requirements of precise control of the pH value of liquid fertilizer by the controller.
The purpose of this paper is to propose a modified fuzzy-PID-Smith predictive compensation control algorithm in view of the time-varying, time-lag, and non-linear characteristics of pH adjustment when water and fertilizer are mixed. This algorithm can quickly adjust the pH value of water and fertilizer to the set value in the pH value adjustment and reduce the adverse effects of system time delay on controller performance.
The chapters of this article are as follows: the second section introduces the working principle of the pH value control system, establishes a mathematical model of pH value control, and analyses the characteristics of liquid fertilizer pH value control. In the third section, the mathematical derivation of the FP-Smith predictive compensator algorithm is carried out, the fuzzy-PID, Smith, and FP-Smith predictive compensators are simulated and analyzed, and the model is evaluated through simulation analysis. The fourth section introduces the test platform and devices and analyses the experimental results to verify the simulation results. The fifth section analyses the performance of the controller through experiments. The sixth section draws conclusions.

2. pH Control Equipment and Control Model

2.1. pH Control Equipment

The structure of the pH control equipment is shown in Figure 1. The control device is composed of hose pumps, solenoid valves, reservoirs, regulating liquid tanks, flow metres, pH composite electrodes and stirring pumps. The mixing tank includes inlets for water, fertilizer and conditioning liquid, and the outlet is connected to a field drip irrigation belt to form a precise fertilization system. The dilution ratio of liquid fertilizer was 1:10, and the pH value of the diluted solution was 7.3. The dilute hydrochloric acid solution was stored in an adjusted solution tank at a concentration of 0.2 mol/L. There were flow metres and pressure gauges at the inlet and outlet of the fertilizer tank, and a pH sensor was placed in the fertilizer tank to detect the pH value of the fertilizer solution. The material-conveying device used in the control device is a hose pump, which is composed of a pump body and a three-phase asynchronous motor. The material to be conveyed is wrapped by a hose, the three-phase asynchronous motor is connected to the pump body of the hose pump, and the material is transported by the pressure formed by the squeezing of the hose on the roller. The control system achieves precise regulation by changing the frequency of the frequency converter connected to the hose pump to control the outlet flow of the hose pump.
The control system employs an STM32F103ZET6 single-chip microcomputer. We wrote the FP-Smith predictive compensation algorithm into a single-chip microcomputer, and took the input pH value as the set value and the collected pH value of the mixed fertilizer solution as the feedback value. After calculation, the flow of the required adjusted solution was obtained, and the flow was converted into the operation frequency of the hose pump [21] to regulate the pH value of the mixed fertilizer solution.
During the operation of the system, after the pH value of the mixed fertilizer solution and the fertilizer flow rate are set at the monitoring terminal, the fertilizer and clean water are respectively pumped out from the fertilizer storage tank and the reservoir by the fertilizer pumping hose pump and the water pumping hose pump in a certain proportion and mixed in the mixing tank. When the control system detects that the pH value of the solution in the mixing tank is different from the expected value, the solenoid valve opens and adjusts the hose pump to run at a certain frequency. The adjusted solution is drawn into the mixing tank by the hose pump, and the mixing pump stirs the mixed fertilizer liquid until the control system detects that the pH value of the mixed fertilizer solution reaches the set value, and the system reaches the steady state.

2.2. Description of the Mixed Fertilizer pH Adjustment Process

In the process of adjusting and controlling the mixed liquid fertilizer, it is assumed that the liquid in the mixing tank is fully mixed, and that the pH value is unaffected by the temperature change of the liquid. The entire liquid fertilizer pH control model is regarded as a continuous stirred tank reactor (CSTR) model [22,23]. Irrigation water and liquid fertilizer are weakly alkaline, and the adjusting solution is a dilute hydrochloric acid solution. Accordingly, the pH adjustment process in the fertilizer tank can be regarded as a strong acid and weak alkali neutralization process [24]. A schematic diagram of the pH adjustment process is shown in Figure 2.

2.2.1. Static Model

The ionization process for dilute hydrochloric acid can be described as:
H C l = H + + C l
Liquid fertilizer ionization processes can be described as:
B ( O H ) p B ( O H ) p 1 + + O H K b 1 = [ B ( O H ) p 1 + ] [ O H ] / [ B ( O H ) p ] B ( O H ) p 1 + B ( O H ) p 2 2 + + O H K b 2 = [ B ( O H ) p 2 2 + ] [ O H ] / [ B ( O H ) p 1 ] B ( O H ) ( p 1 ) + B p + + O H
K b p = [ B p + ] [ O H ] / [ B ( O H ) ( p 1 ) + ]
here Kbp is the ionization balance constant for each stage of the fertilizer. The ionization equilibrium constant reflects the ionization capacity of weak electrolytes.
The ionizing balance equation of water can be described as:
H 2 O H + + O H
K w = [ H + ] [ O H ]
where xi is the ion concentration of alkali ions in the mixed fertilizer liquid.
x i = [ B ( O H ) p ] + [ B ( O H ) p 1 + ] + + [ B p + ]
In the mixture, according to the charge balance equation (the positive charge of the cation band is equal to the negative charge of the anion band), it can be concluded that:
[ C l ] + [ O H ] = [ B ( O H ) p 1 + ] + 2 [ B ( O H ) p 2 2 + ] + + p [ B p + ] + [ H + ]
We define:
i = 1 n b i ( [ H + ] ) x i = [ B ( O H ) p 1 + ] + 2 [ B ( O H ) p 2 2 + ] + + p [ B p + ]
where:
b i ( [ H + ] ) = p i [ H + ] p i + ( p i 1 ) K w K b p i [ H + ] p i 1 + + K w p i 1 [ H + ] K b 2 i K b 3 i K b p i [ H + ] p i + K w K b p i [ H + ] p i 1 + + K w p i 1 [ H + ] K b 2 i K b 3 i K b p i + K w p i K b 1 i K b 2 i K b p i
Simplifying the pH regulation model as the neutralization of dilute hydrochloric acid with a primary weak alkali results in the charge balance equation:
[ C l ] + [ O H ] i = 1 n = 1 b i ( [ H + ] ) x i [ H + ] = 0
where, put n = 1, i = 1 into Equation (7):
b 1 ( [ H + ] ) = i = 1 1 b 1 ( [ H + ] ) = [ H + ] [ H + ] + K w K b 1 = 1 1 + [ O H ] K b 1
Taking pH as the process quantity, the static regulation pH value equation of liquid fertilizer can be obtained from Equation (8) as follows:
y 1 + 10 p H 14 1 1 + 10 p K b + p H 14 x i 10 14 = 0
where p K b is the ionization equilibrium constant of the weak alkali of fertilizer, p K b = lg ( K b ) , and y 1 = [ C l ] .

2.2.2. pH Dynamic Governance Model

Depending on the principle of material conservation, dynamic equations for the status variables of different items in the mixing tank can be listed as:
{ V d y 1 d t = Q a C a O m y 1 V d x 1 d t = Q f C f + Q w C w O m x 1
The flow of liquid from the input and output should be dynamically balanced, then:
O m = Q a + Q f + Q w
According to Equations (10) and (12), the mathematical model of the pH value control process of liquid fertilizer can be obtained. From Equations (11) and (12), it can be observed that the dynamic process of pH adjustment is slightly non-linear. When the output flow of the mixed fertilizer in the mixing tank is much larger than the input flow of the adjusted solution, the adjustment process can be considered linear. However, Equation (10) describes the static model of pH adjustment with strong non-linearity. Additionally, the process of dynamic regulation of pH is bound to be time-lagged and time-varying. Therefore, the pH adjustment process has the characteristics of non-linearity and time lag. These characteristics will seriously affect the controller performance.

2.3. System Identification

This paper takes the liquid fertilizer pH value control system as the research object, integrates the control characteristics and model complexity, and uses the first-order system transfer function with a delay link to describe the mathematical model of the pH value control system [25]. The transfer function is shown in Equation (13):
G ( s ) = K T s + 1 e τ s
Given the open-loop system step response of pH = 6.8, a system sampling interval time T = 1 s, an initial parameter of the mixed solution in the mixing tank pH = 7.3, we obtained a step response curve of the system. We then used a first-order approximation method through computer fitting for a step response curve of the system to obtain the system transfer function:
G ( s ) = 0.99 e 12 s 29 s + 1
where K is the gain coefficient, τ is the delay time, and T is the time constant. The system has a delay of 12 s, τ / T 0.3 . Therefore, the pH adjustment process of liquid fertilizer is a large lag process.

3. pH Control System Controller Design Research and Simulation

3.1. Design of the Fuzzy-PID Controller

PID control is the most widely used controller in the industrial field and calculates the deviation between the input and output of the system in accordance with the proportional, integral, and differential functional relationship [26]. The PID controller equation is Equation (15):
u ( t ) = K p [ e ( t ) + 1 T i e ( t ) d t + T d d e ( t ) d t ]
Fuzzy-PID uses the deviation between the input and feedback as well as the rate of change as input [27] and automatically adjusts the three parameters of the PID through certain rules [28]. The input of the fuzzy algorithm in the control system of the pH value of liquid fertilizer based on fuzzy-PID is the deviation and the deviation change rate between the set pH value and the actual value [29], in which the deviation is e and the deviation rate of change is ec. The variation range of e and ec is [−7, 7], the domain of the universe is set to [−0.7, 0.7] through a quantization factor of 0.1, and the variation range of its output Kp, Ki, Kd is [−0.3, 0.3], [−0.03, 0.03], [−0.1, 0.1]. The fuzzy subsets of e, ec, Kp, Ki, and Kd are selected as [NB, NM, NS, ZO, PM, PS, PB], which are expressed as negative big, negative middle, negative small, zero, positive small, positive middle and positive big. The membership function of e and ec is shown in Figure 3.
The Madmdani method is used for fuzzy logic reasoning, and the center of gravity method is used to defuzzify the output results. The fuzzy rules are shown in Table 1. The contents in the table represent the three outputs of the fuzzy algorithm, Kp/Ki/Kd.
PID parameter tuning methods are generally the Cohen–Coon and Ziegler/Nichols methods. By comparison of calculation and simulation, the simulation results of PID parameters obtained by the Cohen–Coon method are better. Therefore, in this paper, the Cohen–Coon method is used to set the three parameters of PID, Kp, Ti, and Td. A fuzzy algorithm is used to set the parameters accurately. The Cohen–Coon method assigns the dominant poles of the system to attenuate the transition curve of the plant at a rate of 4:1 to obtain the optimal PID parameters. The setting formula is shown in Equation (16):
{ K p = T K τ ( 4 3 + τ 4 T ) T i = τ ( 32 + 6 τ T 13 + 8 τ T ) T d = τ ( 4 11 + 2 τ T )
The mathematical model of the research object in this paper is shown in Equation (14), where K = 0.99, T = 29, τ = 12, and the PID parameter tuning value of the Cohen–Coon parameter tuning method can be obtained: Kp = 3.5, Ki = 0.14, Kd = 14.21.
The fuzzy-PID controller and control system model are shown in Figure 4.

3.2. Design of the Smith Predictor

Industrial process control is often accompanied by a certain degree of delay link. The delay link causes the system to produce a larger overshoot and a slower response speed. The Smith predictor is widely used in time-delay systems [30], which can significantly improve the control performance of the time-delay system and reduce its instability.
The Smith controller adds a predictor to the system to estimate the lag of the system, thereby significantly reducing the overshoot and response time. The principle structure diagram of Smith predictive compensation control is shown in Figure 5:
The figure G 0 ( s ) e τ s is the theoretical model of the system without lag, the pure lag part of the model e τ 2 s theory, G 0 ( s ) e τ 1 s is the transfer function of the Smith estimated model, G c 1 ( s ) is the controller, and when G 0 ( s ) = G 0 ( s ) the model is accurate, τ1 is τ2, at which point the closed-loop transfer function of the system is:
Y ( s ) R ( s ) = G c 1 ( s ) G 0 ( s ) e τ s 1 + G c 1 ( s ) G 0 ( s )
The characteristic equation of a closed-loop system is:
D ( s ) = 1 + G c ( s ) G 0 ( s ) = 0
The characteristic equation of the system does not include the pure lag link, so the system eliminates the effect of pure lag on the control quality of the system. The simulation model of the pH value control system based on the Smith controller is shown in Figure 6.
When the model is inaccurate, G 0 ( s ) e τ s G 0 ( s ) e τ s and τ1τ2, and the model’s transfer function is Equation (19).
Y ( s ) R ( s ) = G c 1 ( s ) G 0 ( s ) e τ 1 s 1 + G c ( s ) [ G 0 ( s ) + G 0 ( s ) e τ 1 s G 0 e τ 2 s ]
It can be obtained from the formula that the greater the error between the actual model and the simulation model, the worse the control effect of the Smith predictor. The Smith controller cannot correct the error between the actual model and simulation model in time. Therefore, the Smith controller is not applicable to the situation where the actual model differs greatly from the theoretical model [31].

3.3. Design of the Fuzzy-PID-Smith (FP-Smith) Predictive Compensator

FP-Smith predictive control adopts the addition of a predictive compensator to offset the time-delay term in the closed-loop characteristic equation, and the addition of a suitable compensation controller greatly reduces the impact of the time-delay term on the system [32]. A schematic diagram of the FP-Smith predictive compensator is shown in Figure 7.
The transfer function between the system output and the input is:
Y ( s ) R ( s ) = G c 1 ( s ) G 0 ( s ) e τ s 1 + G c 1 ( s ) G 0 ( s ) 1 + G 0 ( s ) G c 2 e τ s 1 + G c 2 e τ s G 0 ( s )
The system’s characteristic equation is:
D ( s ) = 1 + G c 1 ( s ) G 0 ( s ) 1 + G 0 ( s ) G c 2 e τ s 1 + G c 2 e τ s G 0 ( s ) = 0
If the mode of Gc2(s) selected is small enough,
1 + G 0 ( s ) G c 2 ( s ) e τ s 1
1 + G c 2 ( s ) G 0 ( s ) 1
The closed-loop characteristic equation of the system then becomes:
Y ( s ) R ( s ) = G c 1 ( s ) G 0 ( s ) e τ s 1 + G c 1 ( s ) G 0 ( s )
D ( s ) = 1 + G c 1 ( s ) G 0 ( s ) = 0
The stability of the system has nothing to do with the compensation controller and has nothing to do with the time delay of the controlled object. Equation (25) shows that the system model does not contain a time delay term.
For the controlled object with first-order inertia and pure hysteresis, to make the system have no static error, the Gc1(s) controller adopts the PI controller and uses the decay curve method for parameter-tuning PI controller parameters Kp = 0.28 and Ki = 0.11. The compensation controller adopts the fuzzy-PID algorithm, and the system takes the error and error rate of change between the actual and theoretical models as the input of the fuzzy-PID algorithm. The fuzzy structure is shown in Section 3.1. The simulation model of the pH value regulation system based on the FP-Smith predictive compensation controller is shown in Figure 8.

4. Simulation Results

4.1. The Model Is Accurate

In this paper, a pH value control system of liquid fertilizer based on a fuzzy-PID controller, Smith controller and modified fuzzy-PID-Smith predictive compensator was designed, and the simulation results were obtained and compared. According to the actual situation, the initial pH value of the mixed liquid fertilizer was 7.3, the pH value of the adjusted liquid fertilizer was reduced to 6.8, and the simulation time was 500 s. The response speed of the controller and the steady state of the process are the focus of ongoing research [33]. The performance indicators of the controller are evaluated by rise time, peak time, steady state time, and maximum overshoot. The rise time is the time when the system reaches the steady state value for the first time. The peak time is the time when the system reaches the peak value for the first time, and the steady state time is the time it takes for the system to reach steady state. The steady state error is ±0.05. The rise, peak, and adjustment times reflect the response speed of the controller, and the maximum overshoot reflects the stability of the controller’s control process [34]. The response curves of the three controllers when the models are accurately matched are shown in Figure 9, and the performance indicators are shown in Table 2.
In the case of the accurate model, the three controllers show different performances. The steady-state time of the FP-Smith controller is 37.9 s, and the overshoot reaches 0.1%, which is significantly smaller than the other two controllers, reflecting that this control has a faster response speed and better stability. The Smith controller’s steady-state time and rise time are slower, 77.1 s and 41.4 s, respectively, reflecting the poor response speed of the controller. The rising speed of the fuzzy-PID controller is significantly faster than that of the other controllers. The controller produces larger oscillations and overshoots. The maximum overshoot reaches 4.9%, and the overall control effect is poor.

4.2. Model Mismatch

In the actual liquid fertilizer pH adjustment process, due to the high complexity of the system and environmental changes, it was difficult to obtain an accurate mathematical model of the system, which led to deviations between the theoretical model and the actual measurement [35]. This model mismatch will seriously affect the control results of the controller, making it difficult for the controller to operate accurately and steadily. Therefore, this article simulates the three controllers to test the performance of the controllers when the models do not match.
According to the actual situation, we set the actual model K = 1.5, T = 29, τ = 13 s and added the interference with an amplitude of 0.5. The step response curves of the three controllers in the case of model mismatch are shown in Figure 10, and the performance indicators of the controllers are shown in Table 3.
In the case of model mismatch, the three controllers showed different advantages. Fuzzy-PID quickly reached a steady state but then produced a larger oscillation, and the maximum overshoot reached 5.1%. The larger overshoot led to an increase in the steady-state time so that the stability of the system decreased. The maximum overshoot of the Smith and FP-Smith controllers reached 0.9% and 0.3%, respectively, which was significantly smaller than the maximum overshoot of fuzzy-PID. The steady-state time and rise time of FP-Smith were significantly faster than those of the Smith controller.
By comparing the simulation results in the two cases of model matching and mismatch, the modified FP-Smith controller can quickly and effectively reduce the interference to the control performance caused by the error of the actual model and theoretical model and meet the requirements of the equipment for accurate pH control.

5. Analysis of Experimental Results

5.1. Experimental Device and System Design

To verify the practicability of the FP-Smith control algorithm, a liquid fertilizer pH control platform was built. The platform used STM32F103ZET6 as the control unit and collected sensor signals through the I/O port of the single-chip microcomputer. The single-chip microcomputer controls the output frequency of the inverter by outputting a 0–10 V analogue electrical signal and adjusts the speed of each hose pump to change the fertilizer liquid flow. The maximum delivery flow of the hose pump could reach 1 m3/h, the rated power was 1.5 kW, and the rated voltage was 380 V. We employed the Shenzhen Wanchuan frequency converter, the model was V8 M 4T 2R2GB (2.2 kW), the output frequency range was 0–400 Hz, and the rated voltage was 380 V. The pH sensor adopted the E-201-C composite electrode of the Lei Magnetic Company, with an accuracy of 0.01. The volume of the fertilizer tank was 100 L, and the volume of the fertilizer solution was maintained at 50 L during the adjustment process. The experimental platform for pH regulation and detection of liquid fertilizer is shown in Figure 11.
The data detection system employed the USB2881 data collector of the Beijing Altai Company, which was equipped with an Altai advanced measurement and control system that was used to display and save the data of the connected equipment in real time. It had 12 analogue signal acquisition channels and could switch between different sampling frequencies. A schematic diagram of the data acquisition and control system is shown in Figure 12.

5.2. Analysis of Experimental Results

Fifty litres of fertilizer solution were mixed with dilute hydrochloric acid solution, and the pH value of the mixed solution stabilized at 7.3. The fertilizer solution flow rate was controlled at 0.4 m3/h, 0.6 m3/h, and 0.8 m3/h. Through the Fuzzy-PID, Smith, and modified FP-Smith algorithms, three control algorithms were compared and tested, and the control effect of the system was manifested in the four indicators of rise time, peak time, steady-state time and maximum overshoot. The target steady-state interval of the system steady-state time was ±0.05. The detection data are shown in Figure 13, Figure 14 and Figure 15. Table 4, Table 5 and Table 6 show the performance indicators of the three controllers under different irrigation output flows.
It can be seen from Table 4, Table 5 and Table 6 that as the irrigation volume changes, the performance of the controller also changes. With the increase in irrigation volume, the response speed of the three controllers was significantly improved, but the amount of overshoot also increased by a certain amount.
It can be seen from Table 4 that although fuzzy-PID has smaller rise and peak time than the other two algorithms, the steady-state time of FP-Smith is the shortest, which takes 89 s and only has an overshoot of 0.2%. This means that the fast response of fuzzy-PID in the control process is accompanied by violent oscillations. FP-Smith considers both the response speed and the stability of the control process at a flow rate of 0.4 m3/h.
From Table 5, it can be concluded that at an output flow of 0.6 m3/h, the response speed of the three controllers is improved compared to 0.4 m3/h. The FP-Smith controller has the largest increase speed, which is an increase of 44 s. The overshoot of the fuzzy-PID and FP-Smith controllers increased, which means that although the increase in flow speeds up the system response speed, it also causes a decrease in stability.
Table 6 shows that a further increase in the irrigation output flow does not further increase the degree of influence on the controller. The response speed of the three controllers is slightly improved compared to 0.6 m3/h. The steady-state time and maximum overshoot of the FP-Smith controller have obvious advantages compared to the other two algorithms. Compared with the fuzzy-PID and Smith controllers, the steady-state time is reduced by 157.4% and 90.2%, respectively, and the maximum overshoot is reduced by 3.4% and 1.4%, respectively. In the case of higher output flow, the FP-Smith controller can still take into account the response speed and the stability of the control process, and the performance is better. Therefore, in practical applications, the requirements of the pH value control system for the control performance of the controller are met.
Figure 16 shows the changes in each index of the FP-Smith algorithm under different output flows. With the increase in irrigation flow, the FP-Smith time in the three indicators of rise, peak, and steady-state times advanced. The reduction in steady-state time reflects the fact that the modified FP-Smith predictive compensation controller can adapt to changes in the external environment. At the same time, its maximum overshoot was at a relatively low level, which suggests that it has good robustness.

6. Conclusions

In this paper, a modified fuzzy-PID-Smith predictive compensation controller was designed based on the mathematical model of the pH control system. Compared with the fuzzy-PID controller and Smith controller in simulation and practical applications, the performance of the controller was tested. The results show that the modified fuzzy-PID-Smith predictive compensation controller can adjust the pH value of liquid fertilizer to the expected value in the shortest time and has a small overshoot in both simulation and practical application.
Under different fertilizer flow rates, the average maximum overshoot of the pH value regulated by the modified fuzzy-PID-Smith predictive compensation controller was 0.23%, and the average time for the pH value of liquid fertilizer to reach steady state from 7.3 to 6.8 was 30 s, which was better than the fuzzy-PID and Smith algorithms. This shows that the modified fuzzy-PID-Smith predictive compensation controller can be adapted for different fertilization modes.
The modified fuzzy-PID-Smith predictive compensation controller can effectively solve the adverse effects of time-varying, time delay and non-linearity of the model on the controller in liquid fertilizer pH control and has good dynamic performance and robustness, which meets the control requirements of liquid fertilizer pH control in practical applications.

Author Contributions

This study was conceptualized by Y.S. and L.Z. The software was designed by Y.S. and validated by X.H., X.M. and Z.M., Y.S. provided resources and Y.S. curated data. The original draft of the manuscript was prepared by Y.S., Z.H. and X.M. reviewed and edited the manuscript. L.Z., C.D. and Z.M. assisted with project administration and X.H. and H.L. managed funding acquisition. All authors have read and agreed to the published version of the manuscript.

Funding

This research was funded by the National Natural Science Foundation of China, grant number 52065055.

Institutional Review Board Statement

Not applicable.

Informed Consent Statement

Not applicable.

Data Availability Statement

All relevant data presented in the article are stored according to institutional requirements and, as such, are not available online. However, all data used in this Manuscript can be made available upon request to the authors.

Conflicts of Interest

The authors declare no conflict of interest.

References

  1. Kuzman, B.; Petković, B.; Denić, N.; Petković, D.; Ćirković, B.; Stojanović, J.; Milić, M. Estimation of optimal fertilizers for optimal crop yield by adaptive neuro fuzzy logic. Rhizosphere 2021, 18, 100358. [Google Scholar] [CrossRef]
  2. Liu, C.; Wang, R.; Wang, W.; Hu, X.; Cheng, Y.; Liu, F. Effect of fertilizer solution concentrations on filter clogging in drip fertigation systems. Agric. Water Manag. 2021, 250, 106829. [Google Scholar] [CrossRef]
  3. AlRassas, A.M.; Al-qaness, M.A.; Ewees, A.A.; Ren, S.; Abd Elaziz, M.; Damaševičius, R.; Krilavičius, T. Optimized ANFIS Model Using Aquila Optimizer for Oil Production Fore-casting. Processes 2021, 9, 1194. [Google Scholar] [CrossRef]
  4. Hu, D.; Li, G.; Deng, F. Gain-Scheduled Model Predictive Control for a Commercial Vehicle Air Brake System. Processes 2021, 9, 899. [Google Scholar] [CrossRef]
  5. Hermansson, A.W.; Syafiie, S. Model predictive control of pH neutralization processes: A review. Control Eng. Pract. 2015, 45, 98–109. [Google Scholar] [CrossRef]
  6. Tan, W.W.; Lu, F.; Loh, A.P.; Tan, K.C. Modeling and control of a pilot pH plant using genetic algorithm. Eng. Appl. Artif. Intell. 2005, 18, 485–494. [Google Scholar] [CrossRef]
  7. Zou, Z.; Yu, M.; Wang, Z.; Liu, X.; Guo, Y.; Zhang, F.; Guo, N. Nonlinear Model Algorithmic Control of a pH Neutralization Process. Chin. J. Chem. Eng. 2013, 21, 395–400. [Google Scholar] [CrossRef]
  8. Sena, H.J.; Silva, F.V.D.; Fileti, A.M.F. ANN model adaptation algorithm based on extended Kalman filter applied to pH control using MPC. J. Process Control 2021, 102, 15–23. [Google Scholar] [CrossRef]
  9. Mahmoodi, S.; Poshtan, J.; Jahed-Motlagh, M.R.; Montazeri, A. Nonlinear model predictive control of a pH neutralization process based on Wiener–Laguerre model. Chem. Eng. J. 2009, 146, 328–337. [Google Scholar] [CrossRef]
  10. Ali, E. pH Control Using PI Control Algorithms with Automatic Tuning Method. Chem. Eng. Res. Des. 2001, 79, 611–620. [Google Scholar] [CrossRef]
  11. Demaya, R.B.; Palm, S.; Boverie, A. Multilevel qualitative and numerical optimization of fuzzy controllers. In Proceedings of the 1995 IEEE International Conference on Fuzzy Systems, Yokohama, Japan, 20–24 March 1995. [Google Scholar]
  12. Nalovsky, T. Optimization of Fuzzy Controller Parameters for the Temperature Control of Superheated Steam. Procedia Eng. 2015, 100, 1547–1555. [Google Scholar] [CrossRef] [Green Version]
  13. Hussain, S.; Ahmed, M.A.; Lee, K.-B.; Kim, Y.-C. Fuzzy Logic Weight Based Charging Scheme for Optimal Distribution of Charging Power among Electric Vehicles in a Parking Lot. Energies 2020, 13, 3119. [Google Scholar] [CrossRef]
  14. Hussain, S.; Lee, K.-B.; Ahmed, M.A.; Hayes, B.; Kim, Y.-C. Two-Stage Fuzzy Logic Inference Algorithm for Maximizing the Quality of Performance under the Operational Constraints of Power Grid in Electric Vehicle Parking Lots. Energies 2020, 13, 4634. [Google Scholar] [CrossRef]
  15. Hussain, S.; Ahmed, M.A.; Kim, Y.-C. Efficient Power Management Algorithm Based on Fuzzy Logic Inference for Electric Vehicles Parking Lot. IEEE Access 2019, 7, 65467–65485. [Google Scholar] [CrossRef]
  16. Chen, H.; Zouaoui, Z.; Chen, Z. Neuro-Fuzzy Modified Smith predictor for IPDT and FOPDT Processes Control. IFAC Proc. Vol. 2013, 46, 839–844. [Google Scholar] [CrossRef] [Green Version]
  17. Chen, G.; Liu, D.; Mu, Y.; Xu, J.; Cheng, Y. A Novel Smith Predictive Linear Active Disturbance Rejection Control Strategy for the First-Order Time-Delay Inertial System. Math. Probl. Eng. 2021, 2021, 1–13. [Google Scholar] [CrossRef]
  18. Huang, H.; Zhang, S.; Yang, Z.; Tian, Y.; Zhao, X.; Yuan, Z.; Hao, S.; Leng, J.; Wei, Y. Modified Smith fuzzy PID temperature control in an oil-replenishing device for deep-sea hydraulic system. Ocean Eng. 2017, 149, 14–22. [Google Scholar] [CrossRef]
  19. Feliu-Batlle, V.; Rivas-Perez, R. Control of the temperature in a petroleum refinery heating furnace based on a robust modified Smith predictor. ISA Trans. 2020, 112, 251–270. [Google Scholar] [CrossRef]
  20. Jin, X.; Chen, K.; Zhao, Y.; Ji, J.; Jing, P. Simulation of hydraulic transplanting robot control system based on fuzzy PID controller. Measurement 2020, 164, 108023. [Google Scholar] [CrossRef]
  21. Navarro, J.L.; Díez, J.L.; Valera, A.; Valera, A.; Vallés, M. Remote Fuzzy Control of a DC Motor. IFAC Proc. Vol. 2008, 41, 13652–13658. [Google Scholar] [CrossRef] [Green Version]
  22. Domanski, P.D.; Lawrynczuk, M. Control Quality Assessment for Processes With Asymmetric Properties and its Application to pH Reactor. IEEE Access 2020, 8, 94535–94546. [Google Scholar] [CrossRef]
  23. Wright, R.A.; Kravaris, C. Nonlinear control of pH processes using the strong acid equivalent. Ind. Eng. Chem. Res. 1991, 30, 1561–1572. [Google Scholar] [CrossRef]
  24. Wiącek, J. Geometrical parameters of binary granular mixtures with size ratio and volume fraction: Experiments and DEM simulations. Granul. Matter 2016, 18, 1–10. [Google Scholar] [CrossRef] [Green Version]
  25. Salehi, S.; Shahrokhi, M.; Nejati, A. Adaptive nonlinear control of pH neutralization processes using fuzzy approximators. Control Eng. Pract. 2009, 17, 1329–1337. [Google Scholar] [CrossRef]
  26. So, G.-B. A Modified 2-DOF Control Framework and GA Based Intelligent Tuning of PID Controllers. Processes 2021, 9, 423. [Google Scholar] [CrossRef]
  27. Lu, J.; Chen, G.; Ying, H. Predictive fuzzy PID control: Theory, design and simulation. Inf. Sci. 2001, 137, 157–187. [Google Scholar] [CrossRef]
  28. Urrea, C.; Páez, F. Design and Comparison of Strategies for Level Control in a Nonlinear Tank. Processes 2021, 9, 735. [Google Scholar] [CrossRef]
  29. AlSabbah, S.; Aldhaifallah, M.; Al-Jarrah, M. Design of Multiregional Supervisory Fuzzy PID Control of pH Reactors. J. Control Sci. Eng. 2015, 2015, 1–9. [Google Scholar] [CrossRef] [Green Version]
  30. Lai, Z.; Wu, P.; Wu, D. Application of fuzzy adaptive control to a MIMO nonlinear time-delay pump-valve system. ISA Trans. 2015, 57, 254–261. [Google Scholar] [CrossRef] [PubMed]
  31. Wei, Q.-Y.; Wang, W.-Q. Research on fuzzy self-adaptive PI-Smith control in long time-delay system. J. China Univ. Posts Telecommun. 2011, 18, 114–128. [Google Scholar] [CrossRef]
  32. Song, M.; Liu, H.; Xu, Y.; Wang, D.; Huang, Y. Decoupling Adaptive Smith Prediction Model of Flatness Closed-Loop Control and its Application. Processes 2020, 8, 895. [Google Scholar] [CrossRef]
  33. Jesus, I.S.; Barbosa, R.S. Smith-fuzzy fractional control of systems with time delay. AEU Int. J. Electron. Commun. 2017, 78, 54–63. [Google Scholar] [CrossRef]
  34. Rubinow, S.I.; Keller, J.B. The transverse force on a spinning sphere moving in a viscous fluid. J. Fluid Mech. 1961, 11, 447–459. [Google Scholar] [CrossRef]
  35. Sun, J.; Zhang, D.-H.; Li, X.; Zhang, J.; Du, D.-S. Smith prediction monitor AGC system based on fuzzy self-tuning PID control. J. Iron Steel Res. Int. 2010, 17, 22–26. [Google Scholar] [CrossRef]
Figure 1. A diagram of the structure of the pH-controlled liquid fertilizer device. 1. Water source, 2. fertilizer tank, 3. regulating tank, 4. check valve, 5. solenoid valve, 6. hose pump, 7. flow metre, 8. pressure gauge, 9. mixing tank, 10. level metre, 11. Y filter, 12. holding valve, 13. drip irrigation belt, 14. pH sensor, 15. stirring pump.
Processes 09 01506 g001
Figure 2. A diagram of the pH adjustment process. 1. V, mixed tank volume, 2. Qa acid input flow, 3. Ca acid concentration, 4. Qf fertilizer input flow, 5. Cf fertilizer concentration, 6. Cm mixed fertilizer concentration, 7. Om mixed fertilizer outflow flow.
Processes 09 01506 g002
Figure 3. The membership function of the fuzzy controller e, ec, Kp, Ki and Kd.
Processes 09 01506 g003
Figure 4. Simulation model of the pH value control system based on the fuzzy-PID controller.
Processes 09 01506 g004
Figure 5. Smith predictive compensator structure schematic diagram.
Processes 09 01506 g005
Figure 6. Simulation model of the pH value control system based on the Smith controller.
Processes 09 01506 g006
Figure 7. Schematic diagram of modified fuzzy-PID-Smith predictor compensator.
Processes 09 01506 g007
Figure 8. Simulation model of the pH value control system based on the FP-PID-Smith predictive compensation controller.
Processes 09 01506 g008
Figure 9. Controller step response diagram under the accurate model.
Processes 09 01506 g009
Figure 10. The step response curve of the controller when the model does not match.
Processes 09 01506 g010
Figure 11. Liquid fertilizer pH adjustment and detection experimental platform.
Processes 09 01506 g011
Figure 12. A diagram of the data acquisition and control system.
Processes 09 01506 g012
Figure 13. The control result curve of the three controllers under a 0.4 m3/h output flow rate.
Processes 09 01506 g013
Figure 14. The control result curve of the three controllers under a 0.6 m3/h output flow rate.
Processes 09 01506 g014
Figure 15. The control result curve of the three controllers under a 0.8 m3/h output flow rate.
Processes 09 01506 g015
Figure 16. Performance changes of FP-smith under three different irrigation output flows.
Processes 09 01506 g016
Table 1. Fuzzy rule table.
ece
NBNMNSZOPSPMPB
NBPB/NB/NBPB/NB/NBPM/NM/NMPM/NM/NMPS/NS/NSZO/ZO/ZOZO/ZO/ZO
NMPB/NB/NBPB/NB/NBPM/NM/NMPS/NS/NSPS/NS/NSZO/ZO/ZONS/ZO/ZO
NSPM/NB/NBPM/NB/NBPM/NS/NSPS/NS/NSZO/ZO/ZONS/PS/PSNS/PS/PS
ZOPM/NM/NMPS/NS/NSPS/NS/NSZO/ZO/ZONS/PS/PSNM/PM/PMNM/PM/PM
PSPS/NS/NSPS/NS/NSZO/ZO/ZONS/PS/PSNS/NS/NMNM/NM/NMNM/PB/PB
PMZO/ZO/ZOZO/ZO/ZONS/PS/PSNM/PS/PSNS/PS/PSNM/PB/PBNB/PB/PB
PBZO/ZO/ZONS/ZO/ZONM/PS/PSNM/PM/PMNM/PS/PSNB/PB/PBNB/PB/PB
Table 2. Controller performance indicators under the precise model.
the Controller TypeRise Time(s)Peak Time(s)Steady-State Time(s)Maximum Over-Conditioning
Fuzzy-PID20.20129.37387.9264.9%
Smith41.43060.22777.1350.4%
FP-Smith45.63256.81637.9510.1%
Table 3. Controller performance indicators under the precise model.
the Controller TypeRise Time(s)Peak Time(s)Steady-State Time(s)Maximum Over-Conditioning
Fuzzy-PID23.85534.479134.7325.1%
Smith28.63938.47962.1240.9%
FP-Smith63.27284.44055.1350.3%
Table 4. Performance indicators of the three controllers under a 0.4 m3/h output flow rate.
the Controller TypeRise Time(s)Peak Time(s)Steady-State Time(s)Maximum Over-Conditioning
Fuzzy-PID60801322.6%
Smith1121321491.5%
FP-Smith114139890.2%
Table 5. Performance indicators of the three controllers under a 0.6 m3/h output flow rate.
the Controller TypeRise Time(s)Peak Time(s)Steady-State Time(s)Maximum Over-Conditioning
Fuzzy-PID49711463.3%
Smith10111512501%
FP-Smith70134650.3%
Table 6. Performance indicators of the three controllers under a 0.8 m3/h output flow rate.
the Controller TypeRise Time(s)Peak Time(s)Steady-State Time(s)Maximum Over-Conditioning
Fuzzy-PID46671573.6%
Smith861021161.6%
FP-Smith66116610.2%
Publisher’s Note: MDPI stays neutral with regard to jurisdictional claims in published maps and institutional affiliations.

