Article

Analysis of Two Single and Three Double Long-Chain Quaternary Ammonium Compounds via Non-Aqueous Capillary Electrophoresis with Indirect Ultraviolet Detection

1
Beijing Key Laboratory of Diagnostic and Traceability Technologies for Food Poisoning, Beijing Center for Disease Prevention and Control, Beijing 100013, China
2
School of Public Health, Capital Medical University, Beijing 100069, China
*
Author to whom correspondence should be addressed.
These authors contributed equally to this work.
Separations 2023, 10(7), 387; https://doi.org/10.3390/separations10070387
Submission received: 18 May 2023 / Revised: 28 June 2023 / Accepted: 29 June 2023 / Published: 1 July 2023

Abstract

:
A novel method utilizing non-aqueous capillary electrophoresis (NACE) with indirect ultraviolet detection (IUD) has been developed for the analysis of five quaternary ammonium compounds (QACs). The QACs analyzed in this study include dodecyl trimethyl ammonium bromide, tetradecyl trimethyl ammonium bromide, dioctyl dimethyl ammonium chloride, octyldecyl dimethyl ammonium chloride and didecyl dimethy ammonium bromide. The separation process was carried out on an uncoated fused quartz capillary with a total length of 50.2 cm (effective length 40.0 cm) and a diameter of 50 μm. The separation buffer consisted of a mixture of MeOH/ACN (90:10, v/v) containing 2 mmol/L sodium acetate, 2 mmol/L trifluoroacetic acid (TFA) and 16 mmol/L dodecyl dimethyl benzyl ammonium chloride. The sample buffer utilized a mixture of MeOH/ACN (20:80, v/v) containing 2 mmol/L TFA. During analysis, a separation voltage of 7 kV was applied, resulting in a current of approximately 2.3 μA. The detection wavelength was set at 214 nm to ensure optimal sensitivity. Under optimal conditions, the method exhibited excellent performance characteristics, with a limit of detection of 0.5 mg/L and a limit of quantitation of 5.0 mg/L for the five QACs. Linear calibration curves were obtained in a concentration range of 5.0 to 100.0 mg/L, with correlation coefficients exceeding 0.999 for all compounds. The recoveries of the five QACs ranged from 92.3% to 114.7%, with relative standard deviations below 7.4%. To assess the applicability of the NACE-IUD method, 17 commercially available samples were successfully analyzed. The results confirmed the suitability of the method for accurate determination of the five QACs in disinfectant products. Notably, this method offers an environmentally friendly approach for the analysis of these QACs.

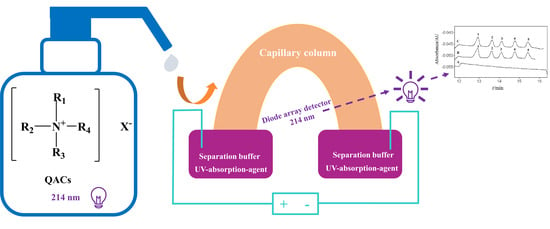
Graphical Abstract

1. Introduction

Quaternary ammonium compounds (QACs) are extensively utilized as the main active ingredients in various applications, including household products, food processing, clinical environments and personal care items, like hand sanitizer and disinfectant wipes. These compounds exhibit broad-spectrum antimicrobial effects against bacteria, fungi and viruses [1]. Typically, the recommended working concentration of QACs does not exceed 1000 mg/L [2]. For terminal disinfection in intensive care units, surface wiping with concentrations of 1000–2000 mg/L is advised [3]. QACs consist of positively charged nitrogen atoms linked to alkyl chains, primarily methyl or benzyl groups [4]. To enhance water solubility, hydrophilic parts of QACs are often composed of chloride ions (Cl) or bromide ions (Br). Based on their chain segment structures, QACs can be classified as single long-chain, double long-chain, heterocyclic and gemini compounds [5]. Single long-chain QACs, such as dodecyl trimethyl ammonium bromide (DTAB) and tetradecyl trimethyl ammonium bromide (TTAB), possess effective antibacterial properties and typically contain one alkyl chain (n ≥ 8). The length of the alkyl chain is related to the antimicrobial efficacy, with QACs featuring an alkyl chain length of 12–16 exhibiting the strongest effects [6]. Double long-chain QACs exhibit enhanced antimicrobial activity against Gram-positive bacteria compared to single long-chain compounds [7]. Didecyl dimethy ammonium bromide (DDAB) represents a type of double long-chain QAC that is considered safer and less harmful than single long-chain QACs [8,9]. Dioctyl dimethyl ammonium chloride (DDAC) and octyldecyl dimethyl ammonium chloride (ODAC) are synthesized by modifying the functional groups and anions of single long-chain QACs. Approximately 36% of disinfectant formulations contain mixtures of QACs with different alkyl chain lengths and other adjuncts to enhance antibacterial efficacy [10,11].
In China, the State Administration for Market Regulation permits the use of DTAB, TTAB, DDAC, ODAC and DDAB (Table 1) in disinfectants [12]. These five QACs exhibit good water solubility and strong polarity, enabling the formation of micelles in aqueous solution at low concentrations. Various methods, including titration [13] and ion-selective electrode potentiometric titration [14], have been recommended or reported for determining the total content of QACs. However, these methods cannot differentiate between QAC species or measure their individual content accurately. Additionally, colorful or cloudy samples may affect the visual determination of the titration endpoint. Although potentiometric titration avoids color interference and the use of indicators, the surfactant electrode’s lifetime is reduced by common additives like ethanol in disinfectants, leading to increased analysis costs. High-performance liquid chromatography (HPLC) is often coupled with a universal detector, such as ultraviolet detectors (UV) [15], evaporative light-scattering detectors (ELSDs) [16] or mass spectrometry detector (MS) [17], to detect, identify and quantify QAC species in disinfectant products. MS detectors offer high sensitivity for analyzing QAC residues in food or environmental samples. However, when analyzing disinfectant samples containing QACs at % levels [18], the samples must be diluted at least 104 times, resulting in significant error amplification. Moreover, MS detectors are more expensive than UV detectors, and their operation requires skilled professionals. The strong adsorption characteristics of QACs often lead to peak tailing when using HPLC with an initial mobile phase of 45% acetonitrile [16]. QACs can also contaminate the ion source, necessitating frequent cleaning, which is a cumbersome process and reduces the ion source’s lifespan. The lack of chromophore makes UV detection unsuitable for these five QACs since they do not exhibit significant ultraviolet absorption.
Capillary electrophoresis (CE) is a cost-effective, environmentally friendly and high-resolution technique for charged analytes [19,20]. CE is typically performed using aqueous buffers, but for QACs with poor water solubility, the use of a non-aqueous solvent as the separation medium offers advantages [21]. Indirect UV detection is a simple method for analyzing QACs without chromophores, eliminating the need for a derivatization step to convert the analytes into a UV-responsive state [22]. Previous studies have employed non-aqueous CE with indirect UV detection to separate and determine QACs. Weiss et al. achieved the simultaneous separation of four single long-chain QAC homologues using a 57.5% tetrahydrofuran–phosphate buffer system and determined TTAB in disinfectants, with the theoretical plate number for DTAB exceeding 1.5 × 10⁵/m [23]. Shamsi et al. utilized a borate buffer containing methanol to simultaneously analyze DDAB with tetraethylammonium, 2-chloroethyltrimethylammonium chloride, tetrabutylammonium and tetrahexylammonium [24]. Heinig et al. improved upon Weiss et al.’s work by using 50% tetrahydrofuran and pH 4.4 phosphate buffer solution to achieve the simultaneous separation and determination of four single long-chain QAC homologues and three double long-chain QAC homologues in facial cleanser samples [25]. Liu et al. added sodium dodecyl sulfate to Heinig et al.’s separation buffer, enabling the simultaneous separation of the four single long-chain QAC homologues and four double-long-chain QAC homologues in hair conditioner and liquid fabric-softener samples [26]. Koike et al. employed a phosphate buffer (pH 2.0) containing 50% acetonitrile to simultaneously analyze 24 single long-chain QAC homologues, including C8–C18 alkylbetaines and alkylamidopropylbetaines, in hand sanitizer and shampoo samples [27]. Moreira et al. developed non-aqueous microchip electrophoresis and a capacitively coupled contactless conductivity detection method utilizing a mixture of methanol and acetonitrile and sodium deoxycholate to efficiently separate 10 quaternary ammonium salts. This method was employed to determine the corrosion inhibitor in oil pipeline coatings, yielding theoretical plate numbers of 8.7 × 10⁴–3.0 × 10⁵/m [28]. These studies demonstrate that the non-aqueous separation system, wherein the separation and the sample buffers are prepared using organic solvents, effectively minimizes analyte adsorption to the capillary’s inner wall, resulting in higher separation efficiency.
Considering that the National Standard GB 38598-2020 requires the labeling of active ingredient contents in disinfectants, stable active ingredients like QACs must fall within 90–110% of the specified value [29] to ensure disinfection efficacy. However, results obtained through the simple National Standard titration method often deviate from the declared content range, emphasizing the need for an NACE-IUD method that minimizes QAC adsorption to enhance determination accuracy. Ensuring that the QAC content matches the label is crucial for maintaining product quality and disinfection efficacy. Thus, the present study aimed to develop a simple NACE-IUD method for the simultaneous separation and determination of these five QACs in commercial disinfectant products.

2. Materials and Methods

2.1. Reagents and Chemicals

The chemicals used in this study were purchased from reputable suppliers and were of analytical reagent grade, unless otherwise specified. Sodium hydroxide, phosphoric acid, sodium dihydrogen phosphate and anhydrous sodium acetate were purchased from China National Pharmaceutical Group Co., Ltd. (Beijing, China). Methanol (MeOH, chromatographic grade), acetonitrile (ACN, chromatographic grade), glacial acetic acid (ACS grade) and trifluoroacetic acid (TFA, ACS grade) were all obtained from Merck (Shanghai, China). Dodecyl trimethyl ammonium bromide (DTAB, purity 99.0%), tetradecyl trimethyl ammonium bromide (TTAB, purity ≥ 99.0%), dioctyl dimethyl ammonium chloride (DDAC, purity 99.0%), octyldecyl dimethyl ammonium chloride (ODAC, purity 98.0%), dodecyl dimethyl ammonium bromide (DDAB, purity 98.0%) and dodecyl dimethyl benzyl ammonium chloride (DDBAC, purity ≥ 95%) were supplied by Aladdin Biochemical Technology Co., LTD (Shanghai, China). Ultrapure water was obtained from a Milli-Q purification system (Millipore, Bedford, MA, USA) with a specific resistance of 18.2 MΩ.
The stock mixed standard solutions of the QAC (10 g/L) were prepared by dissolving 100.0 mg of each QAC standard in 10 mL of ACN and stored at −20 °C. Working mixed standard solutions of 1 g/L were prepared by diluting the stock solutions with ACN. Mixed standard solutions at different concentrations (5.0, 10.0, 20.0, 40.0, 60.0, 80.0 and 100.0 mg/L) were obtained from the working mixed standard solutions by dilution with sample buffer, which consisted of a mixture of MeOH and ACN in a 20:80 ratio (v/v) and contained 2 mmol/L TFA. All solutions, including stock solutions and mixed standard solutions, were stored at 4 °C.

2.2. Sample Preparation

For liquid samples:
Transfer 0.2 mL of the liquid samples to a 10 mL centrifuge tube. Dilute the sample by adding 1.8 mL of sample buffer (MeOH/ACN, 20:80, v/v, containing 2 mmol/L TFA) to the centrifuge tube. Vortex the tube for 30 s to ensure thorough mixing. Repeat the above steps for a total of three replicates. Analyze each replicate separately.
For wet tissue samples:
Squeeze the liquid from the wet tissue into a 2 mL centrifuge tube. Transfer 0.2 mL of the liquid sample to a 10 mL centrifuge vial with a cap. Dilute the sample by adding 1.8 mL of sample buffer (MeOH/ACN, 20:80, v/v, containing 2 mmol/L TFA) to the centrifuge vial. Vortex the vial for 30 s to ensure thorough mixing. Repeat the above steps for a total of three replicates. Analyze each replicate separately.
Note: if the measured concentrations of QACs in the samples are higher than the upper linearity range of the method, additional dilutions should be performed. Serially dilute the 0.2 mL liquid sample with 1.8 mL of sample buffer until the measured concentrations fall within the linearity range of the method.

2.3. Instrumental Analysis

The analysis was performed using a PA 800 Plus CE apparatus (Beckman Coulter, United States) equipped with a diode array detector (DAD). The CE system utilized an uncoated fused quartz capillary with the following specifications: 50 μm internal diameter, 50.2 cm total length and 40.0 cm effective length. The capillary was obtained from Yongnian Ruifeng Chromatographic Device Co., Ltd. (Handan, China). The operating temperature of the cartridge was set at 25 °C. The electrophoretic separation voltage applied during analysis was 7 kV, while the operating current was maintained at 2.3 μA. The detection wavelength used for monitoring the analytes was 214 nm. During the injection process, the sample was introduced into the capillary using a pressure of 0.5 psi, and the injection time was 14 s. The separation buffer employed for the CE analysis consisted of a mixture of MeOH and ACN in a ratio of 90:10 (v/v). The buffer also contained 2 mmol/L sodium acetate, 2 mmol/L TFA and 16 mmol/L DDBAC. Before the initial use of a new capillary, it underwent a washing procedure to ensure its cleanliness. The capillary was sequentially flushed with 1 mol/L NaOH aqueous solution for 30 min, followed by ultrapure water for 2 min and, finally, with the separation buffer for 5 min. Between consecutive runs, the capillary was preconditioned with the separation buffer for 3 min. This step aimed to ensure the stability of the baseline, reproducibility of the corrected peak area and migration time of each analyte in order to obtain reliable and consistent results.

2.4. Method Validation

In the analysis, several validation parameters were assessed, including the limit of detection (LOD), limit of quantitation (LOQ), linearity, recovery and precision.
The LOD and LOQ of the five QACs were determined based on the spiked concentrations that corresponded to signal-to-noise ratios of 10 and 3, respectively. This means that the LOD is the lowest concentration of the analyte that can be reliably detected, while the LOQ is the lowest concentration that can be accurately quantified. To establish the linearity of the method, a linear regression equation was constructed. The corrected peak area, which is obtained by dividing the peak area by the migration time, was plotted on the y-axis, while the seven different concentrations (5.0, 10.0, 20.0, 40.0, 60.0, 80.0 and 100.0 mg/L) of the mix standard solutions were plotted on the x-axis. This regression equation helps determine the relationship between concentration and response, enabling accurate quantitation of unknown samples within the linear range. Recovery was evaluated by analyzing samples spiked with QACs at concentrations of 20, 40 and 60 mg/L. The recovery is calculated as the measured concentration of the spiked samples divided by the spiked concentration of the standard solution, expressed as a percentage. This parameter assesses the accuracy and efficiency of the method in extracting and quantifying the analytes from the sample. Precision was expressed as the relative standard deviation (RSD), which indicates the variability in the results. Intra-day RSD was calculated by using the recoveries of seven replicates analyzed within a single day, while inter-day RSD was calculated by using the recoveries from three consecutive days. These RSD values provide information about the reproducibility and reliability of the method over time.
Overall, these validation parameters help assess the sensitivity, accuracy, linearity and precision of the analytical method used for the determination of QACs in the samples.

2.5. Application in Real Samples

The developed NACE-IUD method was employed to detect five QACs in 17 commercially available disinfectant products. These products were obtained from local supermarkets or online stores and included a variety of disinfectant items, such as laundry detergents, hand sanitizers, skin cleaners, disinfectants and disinfectant wet wipes. In order to prepare the samples for analysis, certain steps were followed. If needed, the samples were heated and dried to remove any excess moisture. Subsequently, they were redissolved using the sample buffer. After redissolution, the samples were appropriately diluted for injection into the CE system. By applying the NACE-IUD method to these samples, the presence and concentrations of the five QACs could be determined. This allowed for the evaluation of the QAC content in different types of disinfection products available on the market.

3. Results and Discussion

3.1. Optimization of Separation Buffer

3.1.1. Organic Solvent and Its Content

In the analysis of QACs using CE, the concentrations of QACs can reach levels where they tend to aggregate and form micelles when dissolved in aqueous solutions, particularly when the concentrations exceed the critical micelle concentration (CMC) [30]. The CMC of QACs typically falls within the range of micromolar (μmol/L) to millimolar (mmol/L) concentrations. Although organic solvents can disrupt the formation of micelles, complete destruction of micelles is not achievable when the total concentration of QACs is high. The presence of micelles can result in issues, such as tailing peaks, poor separation efficiency and inconsistent migration times. To address these challenges and improve separation efficiency, the addition of organic solvents to the CE system is necessary. In this case, organic solvents, such as MeOH and ACN, were used to increase the solubility of QACs, disrupt micellle formation and reduce QAC adsorption onto the capillary inner wall. The addition of organic solvents also helps improve the stability of migration time and baseline in the CE system [23,24,25,26,27]. To optimize the separation efficiency, different proportions of MeOH and ACN were tested. Pure MeOH or ACN resulted in issues, such as drifting baselines or increased noise signals. However, when gradually increasing the proportion of ACN in a mixture of MeOH and ACN, better results were obtained, including a more stable baseline, improved peak shapes and reduced migration time variations. It is important to note that the choice of MeOH and ACN in the separation buffer was influenced by several factors. When the volume ratios of MeOH and ACN exceeded 90:10 (v/v), the CE equipment’s current became unstable or even interrupted, preventing the proper execution of the separation procedure. Based on the experimental results, a MeOH and ACN mixture with a volume ratio of 90:10 (v/v) was selected as the optimal composition for the separation buffer in order to achieve stable baselines, well-defined peaks and consistent migration times during the analysis of QACs using CE.

3.1.2. Ultraviolet Absorption Agent and Its Concentration

In the absence of a chromophore in the five QACs, indirect UV detection was employed for their analysis. Indirect UV detection involves the use of an ultraviolet absorption agent as a background electrolyte, which serves as the chromophore [31]. The analytes cause a change in the background signal, and this change is detected. In this case, DDBAC was used as an ultraviolet absorption agent in the aqueous separation buffer to facilitate the detection of QACs without chromophores [23,27]. When the QACs pass through the DAD, their presence results in a decrease in absorbance, which is detected as negative peaks. To visualize these negative peaks as positive peaks, the output is reversed using the P/ACE station software. To optimize the performance of the indirect UV detection method, different concentrations of DDBAC were investigated while keeping other CE conditions unchanged. Concentrations of DDBAC ranging from 8 to 18 mmol/L were tested. It was observed (Figure 1) that as the concentration of DDBAC increased, the separation, migration time and sensitivity of the five QACs also improved. The chromatographic peak symmetry was enhanced with high DDBAC concentrations. However, it was found that when the DDBAC concentration reached 18 mmol/L, the increase in sensitivity was not significant, and the working current of the CE equipment was prone to interruptions. Additionally, an increase in baseline noise was observed in proportion to the absorbance. Therefore, based on these findings, a concentration of 16 mmol/L DDBAC was determined to be the optimal choice. This concentration provided a balance between sensitivity, stability and baseline noise for the analysis of the five QACs.

3.1.3. Conjugated Acid–Base Pair and Their Concentration

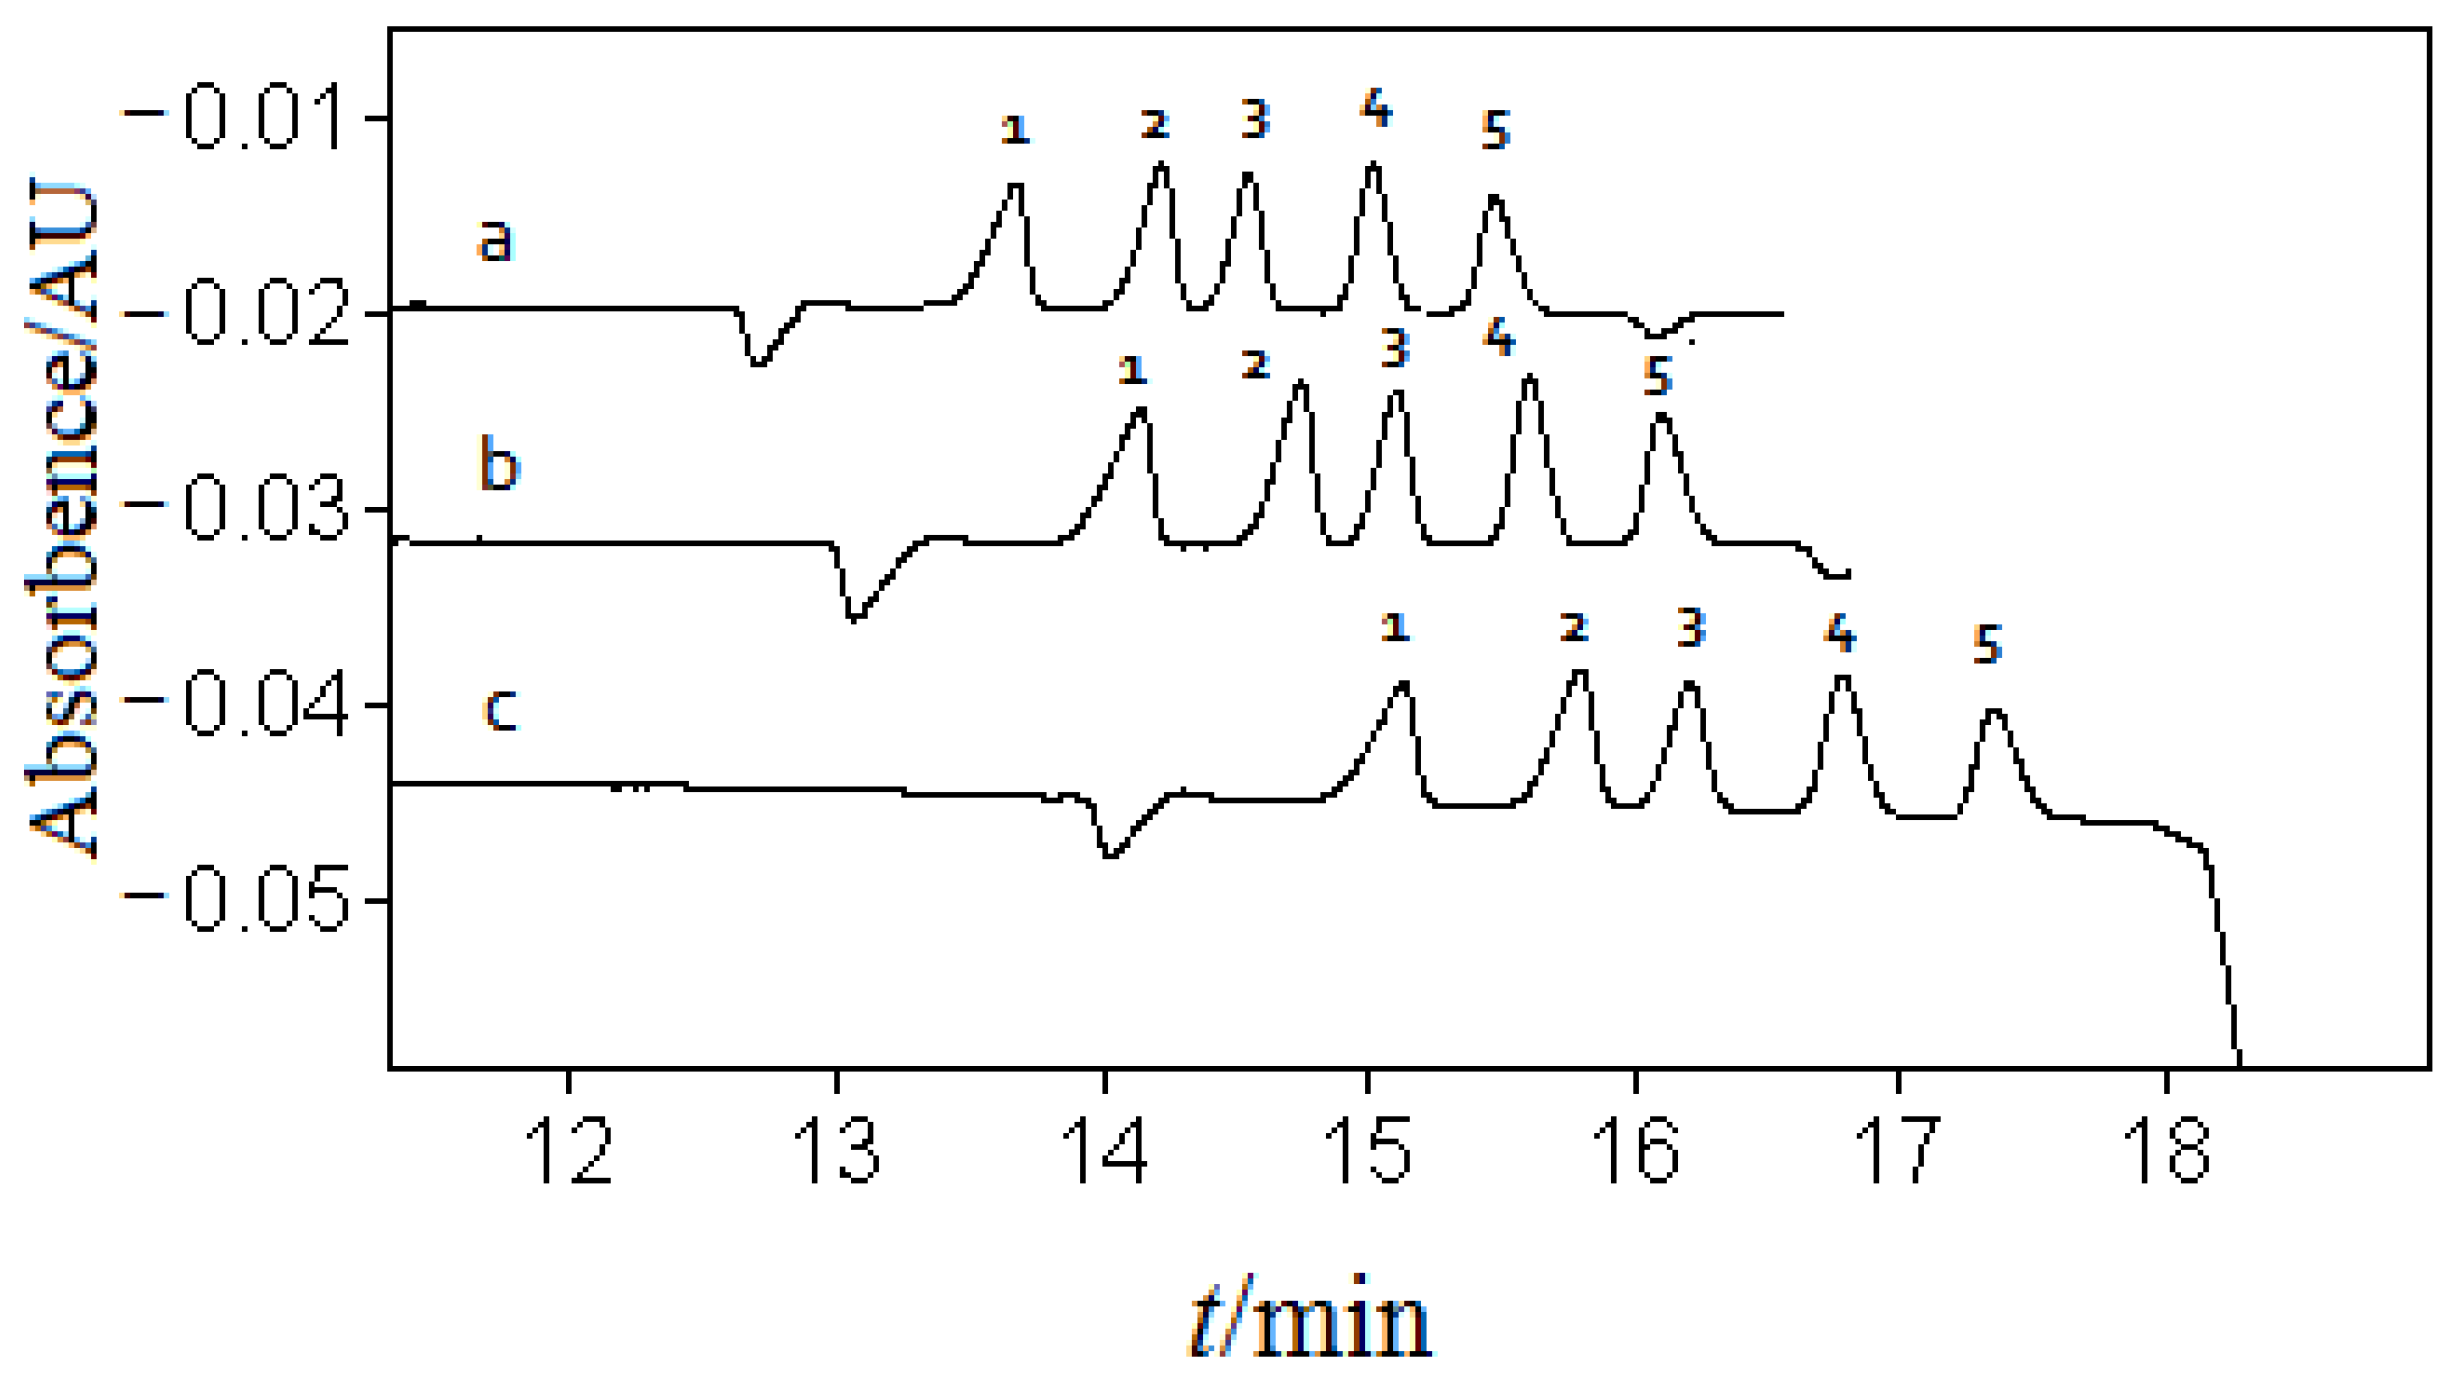
In CE, it is necessary to include a conjugated acid–base pair in the separation buffer to enhance electrical conductivity and decrease the CMC. Commonly used electrolytes for this purpose include sodium acetate, sodium phosphate, sodium dihydrogen phosphate and ammonium acetate. In this study, sodium acetate was chosen for its compatibility with the solvents and its potential for sample stacking effects. The concentration of sodium acetate was investigated while keeping other CE conditions constant. Concentrations of 1, 2 and 3 mmol/L of sodium acetate were tested. Increasing the concentration of sodium acetate has the effect of reducing the electroosmotic flow (EOF) in CE. This reduction in EOF leads to an increase in the effective separation distance and improves the separation efficiency. Figure 2 illustrates these improvements. However, it was observed that the working current of the CE equipment became unstable when 3 mmol/L of sodium acetate was used. Moreover, high ionic concentrations can generate a Joule heat effect, which can result in flat peaks and low resolution [32]. Based on these findings, a concentration of 2 mmol/L of sodium acetate was chosen for further study. This concentration provided a balance between reducing the EOF, improving separation efficiency and maintaining a stable current without generating excessive heat.
In the CE separation buffer, the choice of acid is limited when the concentration of sodium acetate is low (2 mmol/L). The three most commonly used acids in this context are acetic acid, trichloroacetic acid and TFA. As the acidity increases, the pH of the separation buffer decreases, leading to the full suppression of the ionization of hydroxyl groups on the inner wall of the quartz capillary. This results in a decrease in charge density and EOF of the CE system [33]. Among the three acids, TFA was selected for the separation buffer due to its superior chromatographic performance for the five QACs being analyzed. The concentration of TFA was investigated at 1, 2 and 3 mmol/L, respectively. Considering factors, such as signal response, chromatographic separation and apparatus stability, the final choice was determined to be 2 mmol/L of TFA in the conjugated acid–base pair in the separation buffer. This concentration proved to be the optimal performance for the analysis of the five QACs.

3.2. Optimization of Sample Buffer

3.2.1. The Choice of the Type and Concentration of Organic or Inorganic Acid

To ensure effective sample stacking and achieve narrower and sharper peak shapes, the conductivity of the sample buffer should be relatively lower than that of the separation buffer. In this study, the sample buffer was optimized considering the 2 mmol/L concentration of sodium acetate and the choice of acid. Acetic acid, trichloroacetic acid and TFA were considered as options for the sample buffer. As mentioned above, the decrease in pH due to increased acidity in the separation buffer leads to weaker capillary wall dissociation, lower charge density and decreased EOF [33]. Considering the best chromatographic performance of the five QACs, TFA was selected as the acid in the separation buffer. Now, for the sample buffer, the concentration of TFA was investigated at 1, 2 and 3 mmol/L, respectively. After evaluating factors, such as signal response, separation efficiency and CE stability, it was determined that 2 mmol/L of TFA in the sample buffer provided high signal response, good separation performance and stable CE conditions. Therefore, the optimal concentration of the organic acid in the sample buffer was determined to be 2 mmol/L of TFA, considering the overall performance of the analysis.

3.2.2. The Choice of Solvent and Its Content

In order to ensure quantitative accuracy and precision, the type and content of the solvent in the sample buffer were thoroughly investigated. The solvent in the sample buffer plays a crucial role in the analysis [34]. To determine the optimal solvent type and its content in the sample buffer, various combinations were tested while keeping the other CE conditions constant, as mentioned in Section 2.3. The solvent options include 100% MeOH, 100% ACN and different volume ratios of MeOH and ACN mixtures (10:90, 20:80, 40:60, 50:50, 60:40, 70:30, 80:20 and 90:10, v/v). It was observed that the electric current became unstable when using sample buffers consisting of 100% MeOH, 100% ACN or MeOH/ACN mixtures with a ratio of 10:90 (v/v). Additionally, an increase in the MeOH content in the MeOH/ACN mixture led to decreased sensitivity and increased migration time of the five QACs. This can be attributed to the fact that ACN is more effective than MeOH in disrupting micelles [35]. Based on these observations, the optimal solvent in the sample buffer was determined to be a mixture of MeOH and ACN with a proportion of 20:80 (v/v). This composition provided stability in the electric current and ensured suitable sensitivity and migration time for the analysis of the five QACs.

3.3. Optimization of Separation Voltage

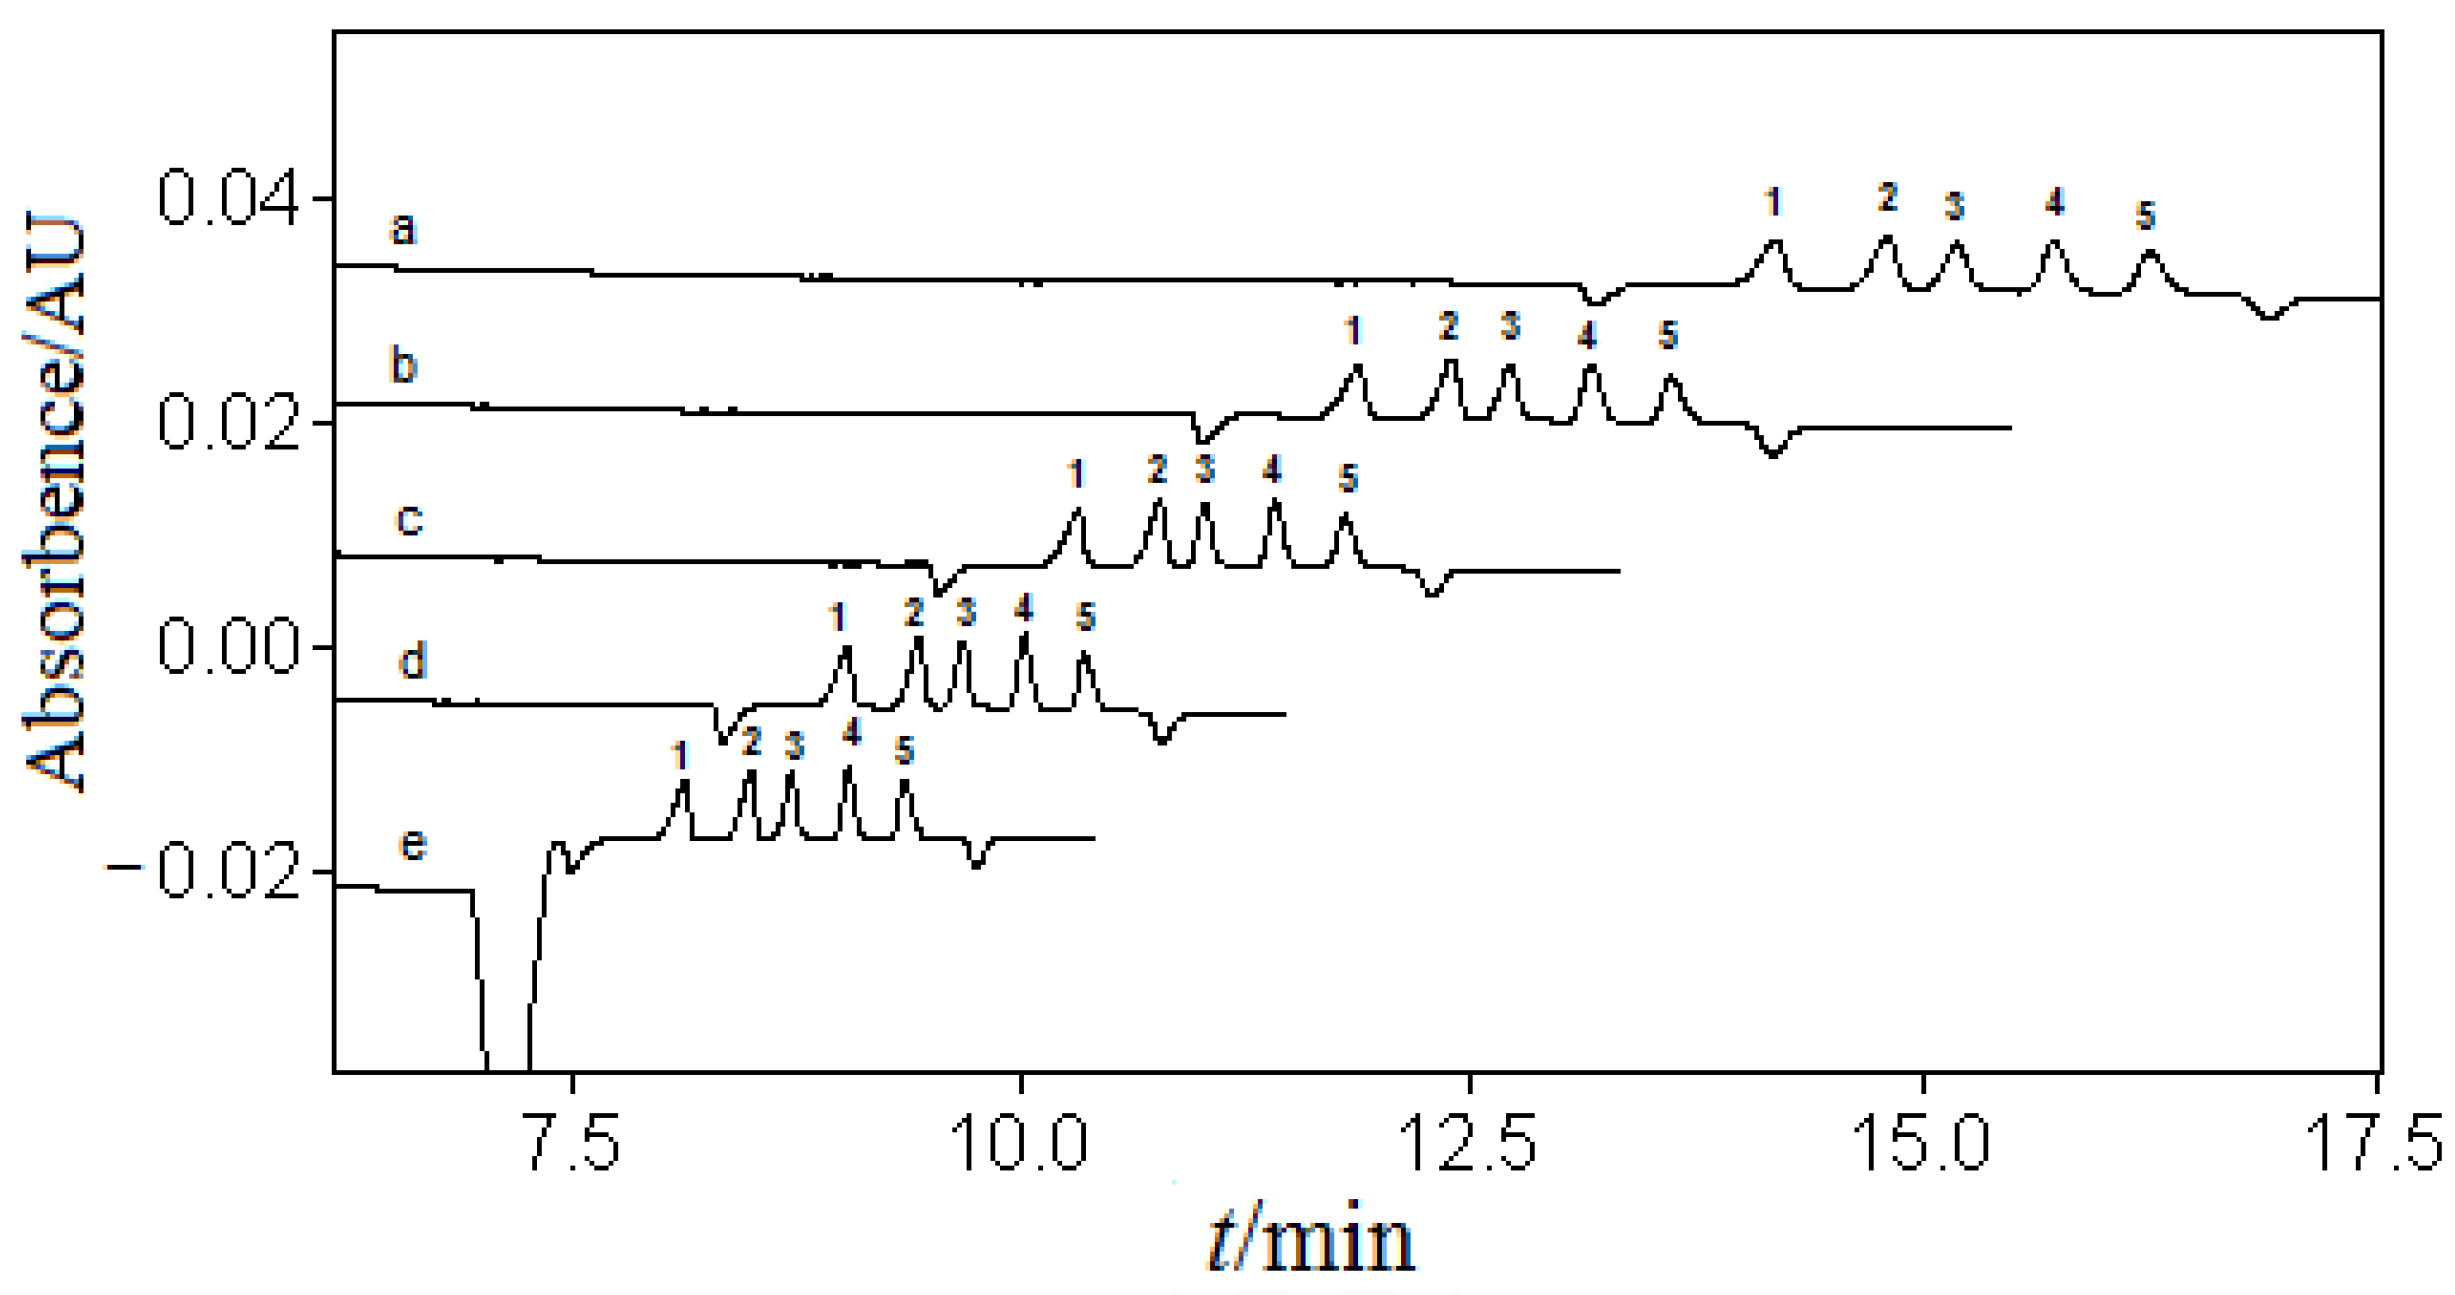
The separation voltage plays a significant role in the migration time of analytes and the separation efficiency in CE [36]. In this study, the effect of different separation voltages on the analysis of the five QACs was investigated. Various separation voltages, ranging from 5 kV to 9 kV, were tested, while keeping the previously selected conditions constant. It was observed that the migration time of the analytes and the separation efficiency were noticeably influenced by the separation voltage. Higher separation voltages generally result in shorter migration times for the analytes. However, an increase in voltage also leads to an elevation in Joule heat, which can disturb the baseline and cause undesirable effects [37]. On the other hand, lower separation voltages tend to broaden the electrophoretic peaks of the QACs and reduce the overall separation efficiency. Considering that NACE typically exhibits lower electric current and Joule heat compared to aqueous CE [38], higher separation voltage can be used in this study. However, it was observed that when the separation voltage was lower or higher than 7 kV, the peak symmetry decreased, peak broadening occurred and instability in the noise signal was observed (Figure 3). Based on these observations, 7 kV was determined as the optimal separation voltage in this study. This voltage provided a good compromise between sensitivity, separation efficiency and stability, ensuring satisfactory peak symmetry and minimizing peak broadening and noise instability.

3.4. Method Validation

The LOD and LOQ values were determined for the five QACs (DTAB, TTAB, DDAC, ODAC and DDAB) using the developed NACE-IUD method. The LOD was found to be 0.5 mg/L, while the LOQ was 5.0 mg/L for all five QACs.
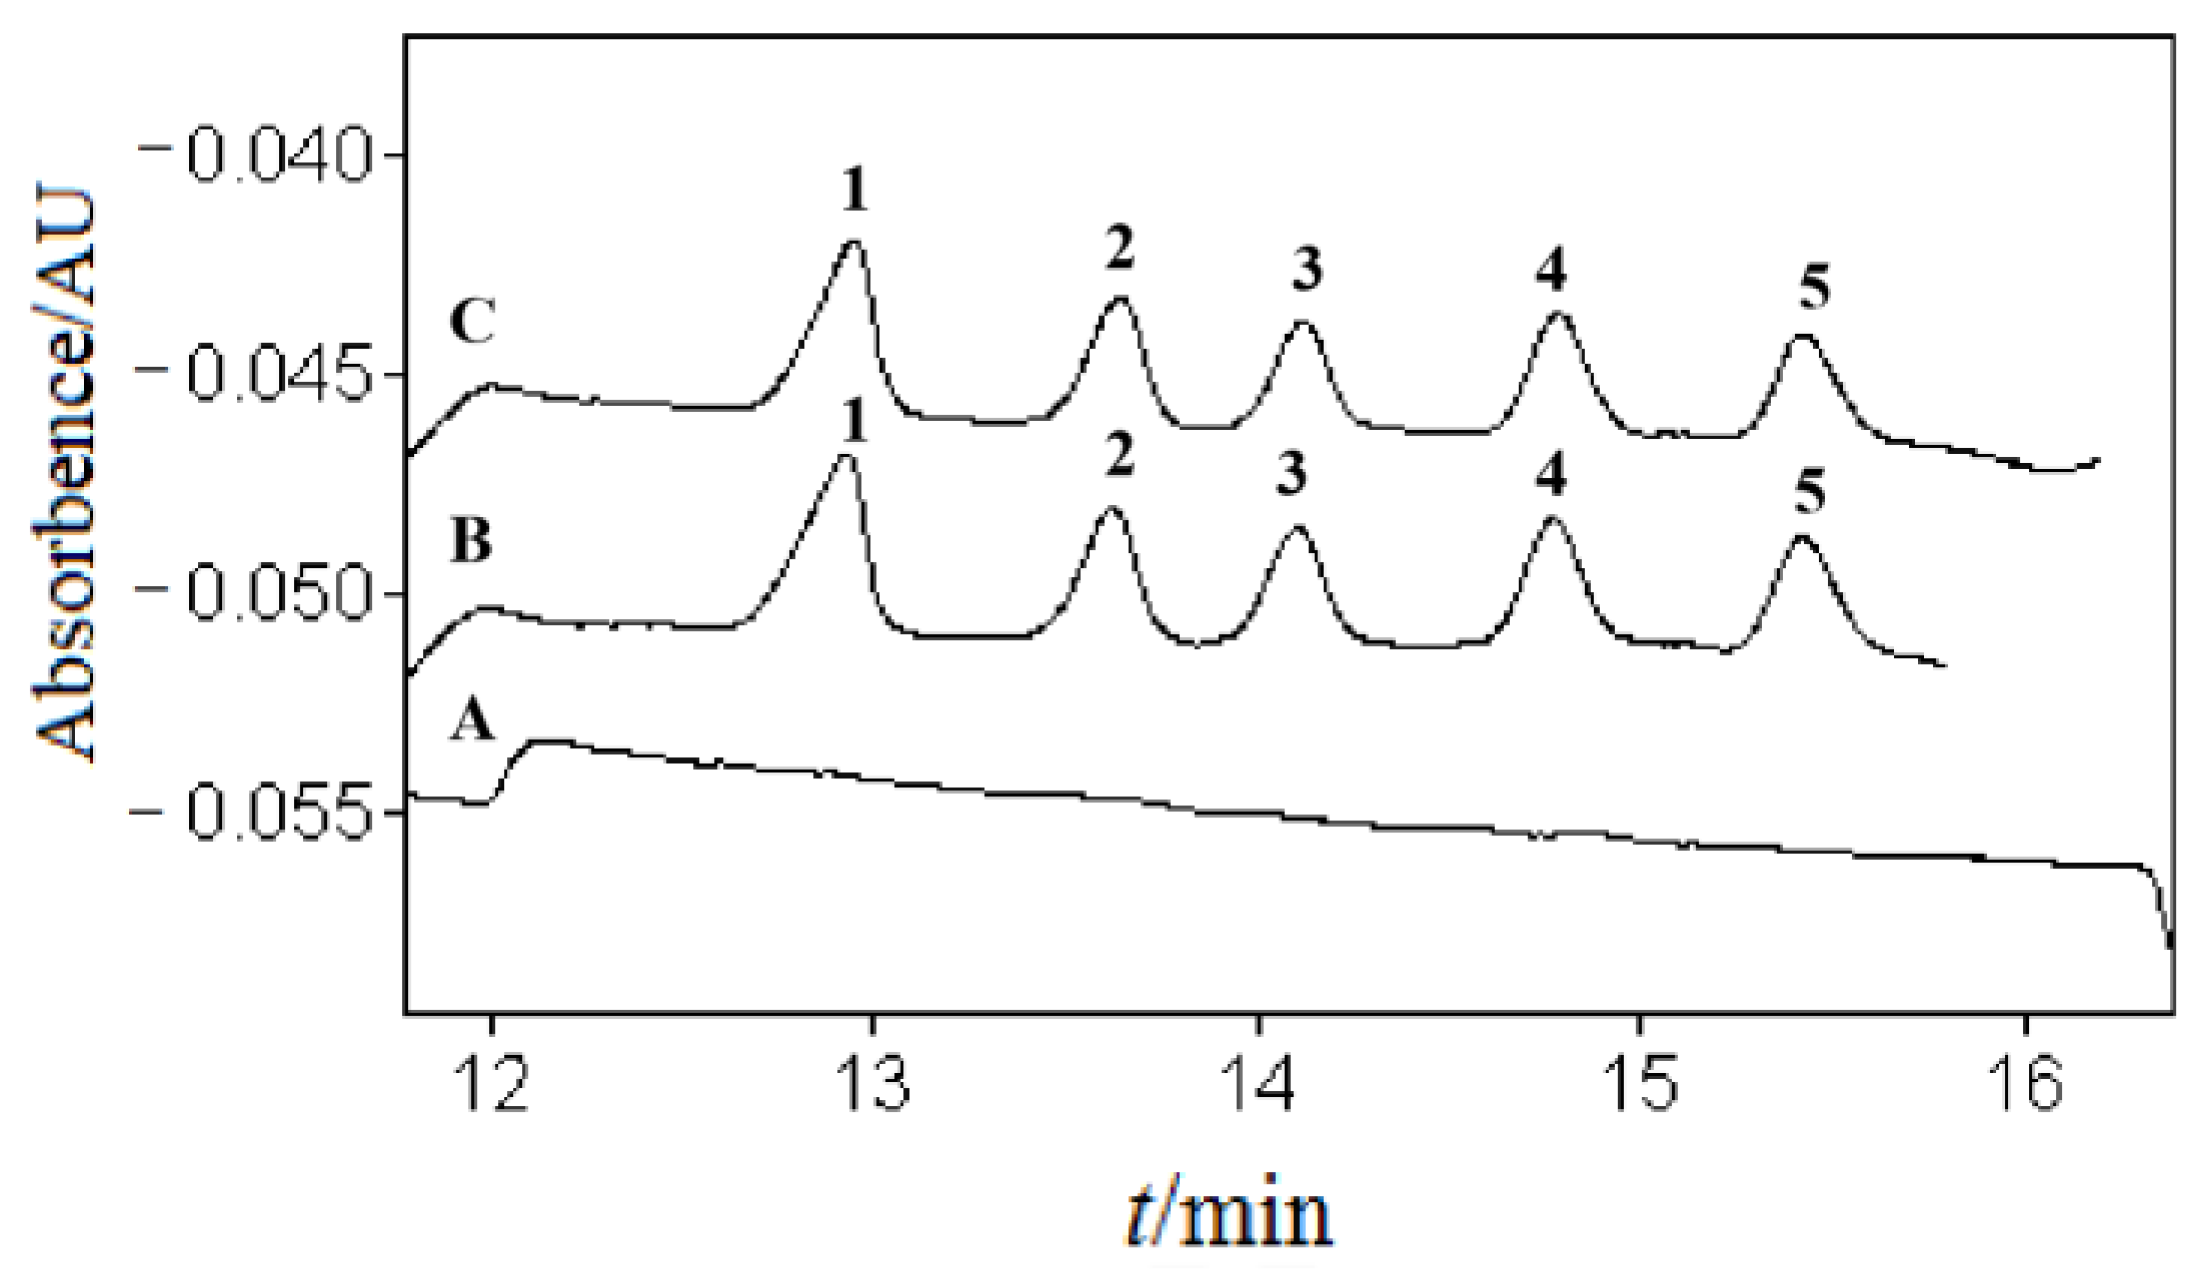
The linearity range of the method was determined to be 5–100 mg/L, and the correlation coefficients for the calibration curves were all above 0.9991 (Table 2), indicating a strong linear relationship between the concentration of the QACs and their corrected peak areas. Table 3 presents the recovery results for fortified samples of the five QACs at different concentrations. The recoveries ranged from 92.3% to 114.7% for the spiked concentration of 20–60 mg/L. The intra-day relative standard deviations (RSDs) were between 0.4% and 3.8%, while the inter-day RSD ranged from 0.9% to 7.4%. These results demonstrate good recovery and precision of the NACE-IUD method. To evaluate the selectivity of the method, electropherograms of a blank disinfectant sample, mixed standard solution of the five QACs and spiked samples were compared. Figure 4 shows that no interference peaks were observed near the migration time of each QAC, indicating good selectivity of the method. The separation of the five QACs was achieved in less than 16 min with good resolution. The calculated theoretical plate numbers for DTAB, TTAB, DDAC, ODAC and TTAB were 97,907, 122,734, 139,955, 121,930 and 145,824, respectively, indicating high separation efficiency. The resolution values between DTAB and TTAB, TTAB and DDAC, DDAC and ODAC and ODAC and DDAB were 2.382, 1.635, 2.379 and 2.205, respectively. These values are favorable for accurate integration and quantitation of the peaks.

3.5. Application in Real Samples

The developed NACE-IUD method was successfully applied to analyze seventeen commercially available disinfectant products. These products represented a wide range of disinfection applications. The electropherograms of the samples were compared with those of the standard solutions to identify the presence of the five QACs. The detection rate of DDAB in the samples was 100% (17/17), indicating that DDAB is a commonly used component in disinfection products. On the other hand, the detection rates for ODAC, DDAC, TTAB and DTAB were lower, with 52.9% (9/17), 47.1% (8/17), 11.8% (2/17) and 11.8% (2/17), respectively. This suggests that these QACs were present in a smaller number of disinfection products. The concentrations of these five QACs in the disinfectant products varied widely, ranging from 0.01 to 30.7 g/L on average (Table 4). This indicates the presence of different levels of QACs in the tested products, with some products containing higher concentrations than others. Overall, the results demonstrate the practicality of the NACE-IUD method for the analysis of QACs in commercially available disinfectant products. It provides valuable information about the presence and concentrations of these QACs, allowing for quality control and regulatory compliance in the disinfection industry.

4. Conclusions

The developed NACE-IUD method with indirect UV detection proved to be effective for the determination of two single long-chain QACs (DTAB and TTAB) and three double long-chain QACs (DDAC, ODAC and DDAB) in disinfectant products. Since these QACs lack chromophores, the method utilized an indirect UV detection approach. The separation buffer contained 16 mmol/L DDBAC as an ultraviolet absorption agent, along with a MeOH/ACN (90:10, v/v) mixture, 2 mmol/L sodium acetate and 2 mmol/L TFA. The sample buffer consisted of a mixture of MeOH/ACN (20:80, v/v) and 2 mmol/L TFA. The analysis of 17 commercially available disinfectant products using this method revealed that DDAB was the most frequently detected QAC in these products. The method demonstrated practicability, ease of use, satisfactory accuracy and good precision in the analysis of QACs in disinfectant products. Overall, the NACE-IUD method with indirect UV detection offers a reliable and efficient approach for the simultaneous determination of multiple QACs in disinfectant products, proving to be valuable information for quality control and regulatory purposes.

Author Contributions

Writing—original draft preparation, K.Y. and R.J.; validation, P.W.; conceptualization, J.Z.; methodology, B.S.; writing—review and editing, supervision, X.D. All authors have read and agreed to the published version of the manuscript.

Funding

This research was funded by Capital’s Funds for Health Improvement and Research (CFH 2022-4G-30118) and Beijing Municipal Science and Technology Project (Z211100007021008).

Data Availability Statement

The data supporting reported results can be obtained from the corresponding author upon request.

Conflicts of Interest

The authors declare no conflict of interest.

References

  1. Hora, P.I.; Pati, S.G.; McNamara, P.J.; Arnold, W.A. Increased use of quaternary amonium compounds during the SARS-CoV-2 pandemic and beyond: Consideration of environmental implications. Environ. Sci. Technol. Lett. 2020, 7, 622–631. [Google Scholar] [CrossRef]
  2. Tezel, U.; Pavlostathis, S.G. Quaternary ammonium disinfectants: Microbial adaptation, degradation and ecology. Curr. Opin. Biotechnol. 2015, 33, 296–304. [Google Scholar] [CrossRef]
  3. WS/T 367-2012; Regulation of Disinfection Technique in Healthcare Settings. China Standards Press: Beijing, China, 2012.
  4. Mohapatra, S.; Yutao, L.; Goh, S.G.; Ng, C.; Luhua, Y.; Tran, N.H.; Gin, K.Y. Quaternary ammonium compounds of emerging concern: Classification, occurrence, fate, toxicity and antimicrobial resistance. J. Hazard. Mater. 2023, 445, 130393. [Google Scholar] [CrossRef]
  5. Zhou, Z.; Zhou, S.; Zhang, X.; Zeng, S.; Xu, Y.; Nie, W.; Zhou, Y.; Xu, T.; Chen, P. Quaternary ammonium salts: Insights into synthesis and new directions in antibacterial applications. Bioconjugate Chem. 2023, 34, 302–325. [Google Scholar] [CrossRef] [PubMed]
  6. Kaur, R.; Liu, S. Antibacterial surface design—Contact kill. Prog. Surf. Sci. 2016, 91, 136–153. [Google Scholar] [CrossRef]
  7. Jennings, M.C.; Minbiole, K.P.C.; Wuest, W.M. Quaternary ammonium compounds: An antimicrobial mainstay and platform for innovation to address bacterial resistance. Acs Infect. Dis. 2015, 1, 288–303. [Google Scholar] [CrossRef] [PubMed]
  8. Lin, W.; Niu, B.; Yi, J.; Deng, Z.; Song, J.; Chen, Q.; Baynes, R.E. Toxicity and metal corrosion of glutaraldehyde-didecyldimethylammonium bromide as a disinfectant agent. Biomed. Res. Int. 2018, 2018, 9814209. [Google Scholar] [CrossRef] [Green Version]
  9. Jantafong, T.; Ruenphet, S.; Punyadarsaniya, D.; Takehara, K. The study of effect of didecyl dimethyl ammonium bromide on bacterial and viral decontamination for biosecurity in the animal farm. Vet. World 2018, 11, 706–711. [Google Scholar] [CrossRef]
  10. Fait, M.E.; Bakas, L.; Garrote, G.L.; Morcelle, S.R.; Saparrat, M.C.N. Cationic surfactants as antifungal agents. Appl. Microbiol. Biotechnol. 2019, 103, 97–112. [Google Scholar] [CrossRef]
  11. Gerba, C.P. Quaternary ammonium biocides: Efficacy in application. Appl. Environ. Microb. 2015, 81, 464–469. [Google Scholar] [CrossRef] [Green Version]
  12. GB 38850-2020; State Administration for Market Regulation; Standardization Administration of China. List for Materials and Restricted Substances in Disinfectant. China Standards Press: Beijing, China, 2020.
  13. GB/T 26369-2020; State Administration for Market Regulation; Standardization Administration of China. Hygienic Requirement for Quaternary Ammonium Disinfectant. China Standards Press: Beijing, China, 2020.
  14. Price, R.; Wan, P. Determination of quaternary ammonium compounds by potentiometric titration with an ionic surfactant electrode: Single-laboratory validation. J. AOAC Int. 2010, 93, 1542–1552. [Google Scholar] [CrossRef] [Green Version]
  15. Smolinska, M.; Ostapiv, R.; Yurkevych, M.; Poliuzhyn, L.; Korobova, O.; Kotsiumbas, I.; Tesliar, H.; Danielson, N.D. Determination of benzalkonium chloride in a disinfectant by UV spectrophotometry and gas and high-performance liquid chromatography: Validation, comparison of characteristics, and economic feasibility. Int. J. Anal. Chem. 2022, 2022, 2932634. [Google Scholar] [CrossRef] [PubMed]
  16. Zheng, G.J.; Lin, Y.K.; Yang, J.Q. Determination of 7 kinds of quaternary ammonium salt in disinfectants by HPLC. Chin. J. Anal. Instrum. 2021, 4, 49–53. [Google Scholar] [CrossRef]
  17. Li, Z.; Lakuleswaran, M.; Kannan, K. LC-MS/MS methods for the determination of 30 quaternary ammonium compounds including benzalkonium and paraquat in human serum and urine. J. Chromatogr. B 2023, 1214, 123562. [Google Scholar] [CrossRef]
  18. GB/T 39873-2021; State Administration for Market Regulation; Standardization Administration of China. Determination of Quaternary Ammonium Salt in Disinfectant-Liquid Chromatography-Tandem Mass Spectrometry. China Standards Press: Beijing, China, 2021.
  19. Mohorič, U.; Beutner, A.; Krickl, S.; Touraud, D.; Kunz, W.; Matysik, F. Surfactant-free microemulsion electrokinetic chromatography (SF-MEEKC) with UV and MS detection-a novel approach for the separation and ESI-MS detection of neutral compounds. Anal. Bioanal. Chem. 2016, 408, 8681–8689. [Google Scholar] [CrossRef] [PubMed]
  20. Konop, M.; Rybka, M.; Waraksa, E.; Laskowska, A.K.; Nowiński, A.; Grzywacz, T.; Karwowski, W.J.; Drapała, A.; Kłodzińska, E.M. Electrophoretic determination of trimethylamine (TMA) in biological samples as a novel potential biomarker of cardiovascular diseases methodological approach. Int. J. Environ. Res. Public Health 2021, 18, 12318. [Google Scholar] [CrossRef]
  21. Buglione, L.; See, H.H.; Hauser, P.C. Study on the effects of electrolytes and solvents in the determination of quaternary ammonium ions by nonaqueous capillary electrophoresis with contactless conductivity detection. Electrophoresis 2013, 34, 317–323. [Google Scholar] [CrossRef] [PubMed]
  22. Da Silva, A.P.; Nishida, S.; Calixto, L.A.; Da Silva, H.D.T.; Moraes, M.L.L. Evaluation of the stability of polyamines in human serum at different storage temperatures using capillary electrophoresis with indirect ultraviolet detection. Biomed. Chromatogr. 2023, 37, e5601. [Google Scholar] [CrossRef]
  23. Weiss, C.S.; Hazlett, J.S.; Datta, M.H.; Danzer, M.H. Determination of quaternary ammonium compounds by capillary electrophoresis using direct and indirect UV detection. J. Chroamtogr. A 1992, 608, 325–332. [Google Scholar] [CrossRef]
  24. Shamsi, S.A.; Danielson, N.D. Individual and simultaneous class separations of cationic and anionic surfactants using capillary electrophoresis with indirect photometric detection. Anal. Chem. 1995, 67, 4210–4216. [Google Scholar] [CrossRef]
  25. Heinig, K.; Vogt, C.; Werner, G. Determination of cationic surfactants by capillary electrophoresis with indirect photometric detection. J. Chromatogr. A 1997, 781, 17–22. [Google Scholar] [CrossRef]
  26. Liu, H.; Ding, W. Determination of homologues of quaternary ammonium surfactants by capillary electrophoresis using indirect UV detection. J. Chromatogr. A 2004, 1025, 303–312. [Google Scholar] [CrossRef] [PubMed]
  27. Koike, R.; Kitagawa, F.; Otsuka, K. Simultaneous determination of amphoteric surfactants in detergents by capillary electrophoresis with indirect UV detection. J. Chromatogr. A 2007, 1139, 136–142. [Google Scholar] [CrossRef]
  28. Moreira, R.C.; Lopes, M.S.; Medeiros Junior, I.; Coltro, W.K.T. High performance separation of quaternary amines using microchip non-aqueous electrophoresis coupled with contactless conductivity detection. J. Chromatogr. A 2017, 1499, 190–195. [Google Scholar] [CrossRef] [PubMed]
  29. Walbroehl, Y.; Jorgenson, J.W. On-column UV absorption detector for open tubular capillary zone electrophoresis. J. Chromatogr. A 1984, 315, 135–143. [Google Scholar] [CrossRef]
  30. Vereshchagin, A.N.; Frolov, N.A.; Egorova, K.S.; Seitkalieva, M.M.; Ananikov, V.P. Quaternary ammonium compounds (QACs) and ionic liquids (ILs) as biocides: From simple antiseptics to tunable antimicrobials. Int. J. Mol. Sci. 2021, 22, 6793. [Google Scholar] [CrossRef]
  31. Peres, R.G.; Moraes, E.P.; Micke, G.A.; Tonin, F.G.; Tavares, M.F.M.; Rodriguez-Amaya, D.B. Rapid method for the determination of organic acids in wine by capillary electrophoresis with indirect UV detection. Food Control 2009, 20, 548–552. [Google Scholar] [CrossRef]
  32. Do Nascimento, M.P.; Marinho, M.V.; Sousa, R.A.D.; Leal De Oliveira, M.A. Mixture design of an electrolyte system for the simultaneous separation of Cl, SO42−, NO3, NO2, and HCO3 in shrimp-farming water by CZE-UV. Anal. Methods 2023, 15, 311–321. [Google Scholar] [CrossRef]
  33. Guo, H.; Lu, K.; Zhang, J. Generation and influencing factors of electroosmotic flow in capillary electrophoresis based on chromatographic function. Chin. Cent. South Pharm. 2019, 17, 84–87. [Google Scholar]
  34. Jiang, R.K.; Ding, X.J. Simultaneous determination of triclosan, triclocarban and p-chloro-m-xylenol in disinfectang, personal care products and oiltment bu non-aquaeous capillary electrophoresis. Chin. J. Chromatogr. 2023, 41, 168–177. [Google Scholar] [CrossRef]
  35. Lin, C.; Lin, W.; Chiou, W. Capillary zone electrophoretic separation of alkylbenzyl quaternary ammonium compounds: Effect of organic modifier. J. Chromatogr. A 1996, 722, 345–352. [Google Scholar] [CrossRef]
  36. Liu, L.; You, W.; Zheng, L.; Chen, F.; Jia, Z. Determination of peimine and peiminine in Bulbus Fritillariae Thunbergii by capillary electrophoresis by indirect UV detection using N-(1-naphthyl)ethylenediamine dihydrochloride as probe. Electrophoresis 2012, 33, 2152–2158. [Google Scholar] [CrossRef] [PubMed]
  37. Gao, Q.; Araia, M.; Leck, C.; Emmer, Å. Characterization of exopolysaccharides in marine colloids by capillary electrophoresis with indirect UV detection. Anal. Chim. Acta 2010, 662, 193–199. [Google Scholar] [CrossRef] [PubMed]
  38. Cheng, J.; Wang, L.; Liu, W.; Chen, D.D.Y. Quantitative nonaqueous capillary electrophoresis–mass spectrometry method for determining active ingredients in plant extracts. Anal. Chem. 2017, 89, 1411–1415. [Google Scholar] [CrossRef] [Green Version]
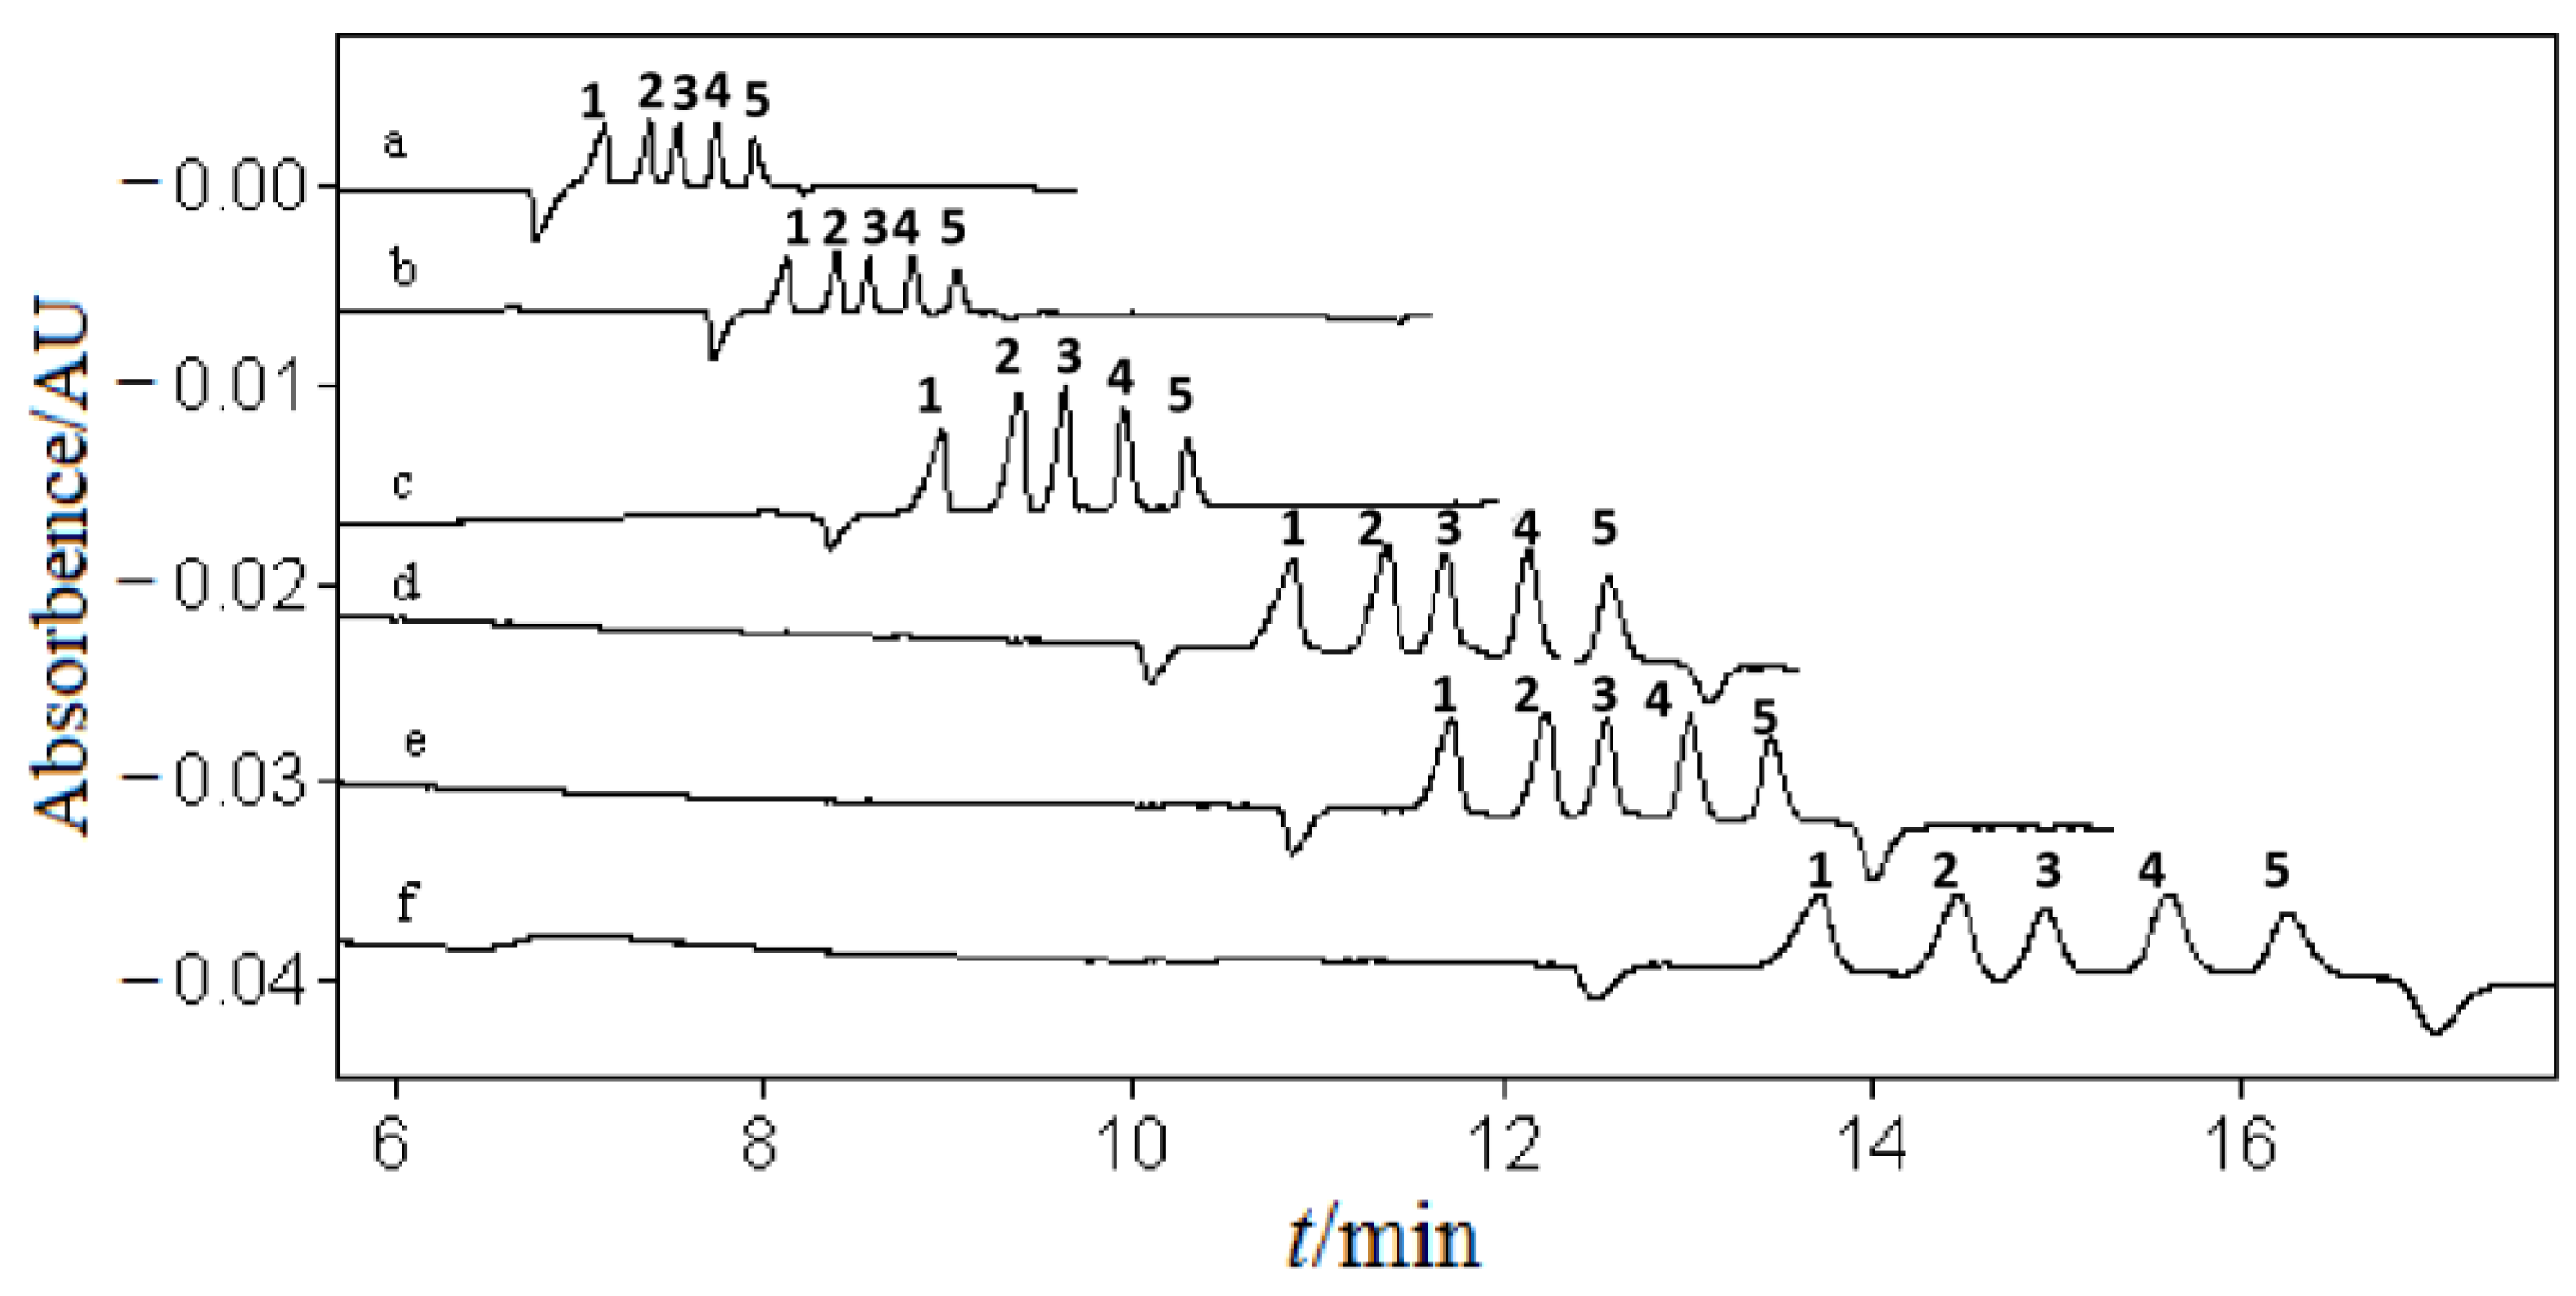
Figure 1. Electropherograms of the optimization of DDBAC concentration (mmol/L): a. 8; b. 10; c. 12; d. 14; e. 16; f. 18. 20 mg/L of mixed standard solution of five QACs. 1. DTAB; 2. TTAB; 3. DDAC; 4. ODAC; 5. DDAB. CE conditions: uncoated fused quartz capillary (50 μm internal diameter, 50.2 cm total length, and 40.0 cm effective length); detector: DAD; separation voltage: 7 kV; injection time: 14 s; ultraviolet-absorption-agent: DDBAC; detection wavelength: 214 nm.
Separations 10 00387 g001
Figure 2. Electropherograms of optimization of TFA concentration in the separation buffer TFA concentration (mmol/L): a. 1; b. 2; c. 3. 1. DTAB; 2. TTAB; 3. DDAC; 4. ODAC; 5. DDAB. The other conditions are the same as in Figure 1.
Separations 10 00387 g002
Figure 3. Electropherograms of separation voltage on migration time separation voltage (kV): a. 5; b. 6; c. 7; d. 8; e. 9. 1. DTAB; 2. TTAB; 3. DDAC; 4. ODAC; 5. DDAB. The other conditions are the same as in Figure 1.
Separations 10 00387 g003
Figure 4. Electropherograms of (A) blank disinfectant sample, (B) 40 mg/L of mixed standard solution of five QACs, and (C) five QACs spiked at a concentration of 40 mg/L in blank disinfectant sample. 1. DTAB; 2. TTAB; 3. DDAC; 4. ODAC; 5. DDAB. The other conditions are the same as in Figure 1.
Separations 10 00387 g004
Table 1. Chemical information of five QACs.
Chemical NameMolecular FormulaCAS NumberChemical Structure
Dodecyl trimethyl ammonium bromideC15H34BrN1119-94-4Separations 10 00387 i001
Tetradecyl trimethyl ammonium bromideC17H38BrN1119-97-7Separations 10 00387 i002
Dioctyl dimethyl ammonium chlorideC18H40ClN5538-94-3Separations 10 00387 i003
Octyldecyl dimethyl ammonium chlorideC20H44ClN32426-11-2Separations 10 00387 i004
Didecyl dimethyl ammonium bromideC22H48BrN2390-68-3Separations 10 00387 i005
Table 2. Linearity range, equation of linear regression and correlation coefficient of five QACs.
AnalytesLinearity Range (mg/L)Equation of Linear RegressionCorrelation Coefficient
DTAB5–100y = 71.124x − 58.8610.9994
TTAB5–100y = 44.845x − 7.7520.9995
DDAC5–100y = 36.408x − 7.9110.9996
ODAC5–100y = 41.05x − 32.0930.9991
DDAB5–100y = 36.25x − 24.1210.9998
Table 3. Recoveries, intra-day RSD (n = 7) and inter-day RSD (n = 3) of the developed method.
AnalytesSpiked Levels
(mg/L)
Recoveries
(%)
Intra-day RSD
(%)
Inter-day RSD
(%)
DTAB20106.43.85.1
40109.30.61.4
6093.22.94.7
TTAB20109.73.77.2
40113.70.54.4
6095.62.43.3
DDAC20110.42.85.1
40110.70.41.9
6092.32.84.3
ODAC20114.73.67.4
40112.60.52.2
6094.12.73.8
DDAB20112.52.54.5
40108.60.40.9
6095.22.95.2
Table 4. Concentrations of five QACs in commercially available disinfectant products.
SampleBrandSample TypeAverage Concentrations (g/L)
DTABTTABDDACODACDDAB
1Jian ZhisuDisinfectant laundry detergents//14.530.725.2
2Lv SanDisinfectant laundry detergents////26.8
3Shu BitaiHand sanitizers////1.4
4An LijiuSkin cleaners///1.01.1
5NeosanitizSkin cleaners////0.49
6Luo WaDisinfectants//5.311.08.0
7Yi KangDisinfectants//0.81.61.9
8Xi DebaoDisinfectants////30.0
9Jing GuanDisinfectants////0.9
10Mo RunlaiDisinfectants////1.5
11Jie LijiaDisinfectants0.20.10.50.82.5
12Jian ZhisuDisinfectants//0.010.030.02
13Xin PuDisinfectants////0.8
14Li ErkangDisinfectants//0.10.30.1
15An JieDisinfectants////0.7
16Yi KanghuoxingDisinfectants//3.95.33.2
17Xiao BoshiDisinfectant wet wipes0.10.10.70.91.1
Detection rate (%) 11.811.847.152.9100.0
“/” stands for “not detected”.
Disclaimer/Publisher’s Note: The statements, opinions and data contained in all publications are solely those of the individual author(s) and contributor(s) and not of MDPI and/or the editor(s). MDPI and/or the editor(s) disclaim responsibility for any injury to people or property resulting from any ideas, methods, instructions or products referred to in the content.