Abstract
Alzheimer’s disease (AD) is a progressive neurodegenerative condition characterized by memory and cognitive decline in older individuals. Beta-amyloid (Aβ), a significant component of senile plaques, is recognized as a primary contributor to AD pathology. Hence, substances that can inhibit Aβ production and/or accumulation are crucial for AD prevention and treatment. Agrimonia pilosa LEDEB. (A. pilosa) (Rosaceae), specifically its aerial parts, was identified in our previous screening study as a promising candidate with inhibitory effects on Aβ production. Therefore, in this study, A. pilosa extract was investigated for its anti-amyloidogenic effects, and its bioactive principles were isolated and identified. The ethanol extract of A. pilosa reduced the levels of sAPPβ and β-secretase by approximately 3% and 40%, respectively, compared to the DMSO-treated control group in APP-CHO cells (a cell line expressing amyloid precursor protein), which were similar to those in the positive control group. In addition, the ethanol extract of A. pilosa also hindered Aβ’s aggregation into fibrils and facilitated the disaggregation of Aβ aggregates, as confirmed by a Thioflavin T (Th T) assay. Subsequently, the active constituents were isolated using a bioassay-guided isolation method involving diverse column chromatography. Eleven compounds were identified—epi-catechin (1), catechin (2), (2S, 3S)-dihydrokaempferol 3-O-β-D-glucopyranoside (3), (-)-epiafzelechin 5-O-β-D-glucopyranoside (4), kaempferol 3-O-β-D-glucopyranoside (5), apigenin 7-O-β-D-glucopyranoside (6), dihydrokaempferol 7-O-β-D-glucopyranoside (7), quercetin 3-O-β-D-glucopyranoside (8), (2S, 3S)-taxifolin 3-O-β-D-glucopyranoside (9), luteolin 7-O-β-D-glucopyranoside (10), and apigenin 7-O-β-D-methylglucuronate (11)—identified through 1D and 2D NMR analysis and comparison with data from the literature. These compounds significantly decreased Aβ production by reducing β- and γ-secretase levels. Moreover, none of the compounds affected the expression levels of sAPPα or α-secretase. Further, compounds 1, 2, 4, 8, and 10 demonstrated a dose-dependent reduction in Aβ aggregation and promoted the disaggregation of pre-formed Aβ aggregates. Notably, compound 8 inhibited the aggregation of Aβ into fibrils by about 43% and facilitated the disassembly of Aβ aggregates by 41% compared to the control group containing only Aβ. These findings underscore the potential of A. pilosa extract and its constituents to mitigate a crucial pathological aspect of AD. Therefore, A. pilosa extract and its active constituents hold promise for development as therapeutics and preventatives of AD.
1. Introduction
Alzheimer’s disease, first described by the German physician Alois Alzheimer in 1906, is a neurodegenerative disorder and the most prevalent form of dementia, primarily affecting individuals aged 65 and older [1]. Recent reports indicate that the global population of dementia patients, concentrated in regions like East Asia, South Asia, North America, and Western Europe, reached 50 million in 2021 [2], with projections suggesting it will rise to 131.5 million by 2050 [3]. AD progressively affects various cognitive functions, language, learning, behavior, and spatial orientation, primarily due to memory loss [4]. Despite its severe impact, the current treatments aim to delay cognitive decline, manage memory loss, and alleviate clinical symptoms but do not achieve satisfactory therapeutic effects or halt disease progression [5]. The pathogenesis of AD remains unclear; however, post-mortem brain tissue analysis reveals key neuropathological features, including the formation of senile plaques composed of amyloid-β peptide fibrils and intracellular neurofibrillary tangles (NFTs) of hyperphosphorylated tau protein [6]. Several hypotheses about AD’s pathogenesis are debated [7], with a prominent focus on the defective cleavage of amyloid precursor protein (APP) leading to Aβ plaque formation [7]. Aβ, a peptide consisting of 38–43 amino acids, is produced from APP through sequential cleavage by β-secretase (BACE1) and γ-secretase enzyme complexes (presenilin 1 or 2, presenilin enhancer 2, anterior pharynx, and nicastrin) [8]. Alternative non-amyloidogenic processing of APP by α-secretase, which cleaves the transmembrane protein within the Aβ sequence in APP, precludes the formation of full-length Aβ, and subsequent cleavage by γ-secretase generates an N-terminally truncated peptide, p3 [8]. The first cleavage by β-secretase releases the soluble APP amino-terminal fragments (sAPPβ) into the extracellular space. Concurrently, it generates carboxy-terminal fragments (CTFs). These CTFs are then further cleaved by γ-secretase, resulting in the production of p3 peptides and Aβ peptides [8]. An imbalance between Aβ production and clearance results in its accumulation, leading to the formation of soluble oligomers and insoluble fibrillar structures deposited in senile plaques, disrupting neuronal function and triggering neurotoxic responses by the microglia, ultimately causing synaptic dysfunction and brain damage [9]. Additionally, Aβ aggregation generates free radicals that contribute to neuronal cell death observed in AD [10]. Therefore, strategies aimed at reducing neurotoxic Aβ production and inhibiting its aggregation hold promise as therapeutic and preventive approaches to AD [11].
Agrimonia pilosa LEDEB (A. pilosa), also known as Agrimoniae herba, hairy vein agrimony, or agrimony, belongs to the Rosaceae family [12]. This perennial herb is native to Korea, Japan, China, India, and central Europe [12,13,14], thriving in both full sun and semi-shade environments regardless of soil fertility [13,14]. It typically grows to a height of 50–120 cm and is characterized by a covering of white hairs [12,13]. The leaves are elongated ovals, measuring 2.5–7 cm in length and 1.5–3.5 cm in width, with a green surface [13,14]. The young leaves of A. pilosa are edible, and the entire plant is utilized in traditional oriental medicine [13,14]. A. pilosa is recognized for its diverse physiological functions [15,16,17,18,19,20]. It exhibits antioxidant activity, attributed to its polyphenols [15], and has been reported to possess tumor-suppressing properties [16], antiviral effects [17], and antibacterial capabilities [18]. Furthermore, studies have shown that A. pilosa can improve the blood sugar levels in diabetic mice [19], and in RAW 264.7 cells activated with lipopolysaccharide, it increased pro-inflammatory cytokines, inducible nitric oxide synthase (iNOS), and reactive oxygen species (ROS), while also exerting an anti-inflammatory effect by suppressing ROS expression [20]. In addition, the administration of A. pilosa significantly alleviated the effects of ischemic brain damage and improved neural function, Na+/K+ ATPase activity, and neural energy metabolism [21]. Additionally, an inhibitory effect of A. pilosa on the enzyme cholinesterase has been reported [22]. Moreover, A. pilosa is known to contain various chemical constituents such as flavonoids, isocoumarins, triterpenes, tannins, organic acids, and phloroglucinol derivatives [21]. For examples, flavonoids such as tiliroside, 3-methoxy quercetin, quercitrin, and quercetin from A. pilosa showed significant inhibitory effects on acetylcholinesterase [23]. And acylphloroglucinolated catechins and three phenylethylisocoumarin glycosides isolated from A. pilosa showed inhibitory activity against lipopolysaccharide-induced NO production in BV2 microglial cells [24]. However, research specifically on Aβ production and aggregation has not yet been documented.
In this research, we investigated the impact of the ethanol extract of A. pilosa (APE) on Aβ production in APP-CHO cells, which are Chinese hamster ovary cells engineered to express amyloid precursor protein (APP). This was evaluated using Western blot analysis. Additionally, we examined its effects on Aβ aggregation using the Thioflavin T (Th T) assay. Subsequently, APE underwent diverse column chromatography (CC) to isolate its active constituents, following a bioassay-guided isolation approach. The structures of the isolated compounds were elucidated using NMR data and compared with known references. To assess the inhibitory effects on Aβ production, we measured markers such as sAPPα, sAPPβ, α-secretase, β-secretase, and γ-secretase levels via Western blot analysis.
2. Materials and Methods
2.1. Preparation of APE
The aerial parts of A. pilosa (4 kg) were purchased from a commercial market (Handsherb, Yeongcheon, Republic of Korea). A voucher specimen (C20210107) was deposited in the Pharmacognosy Laboratory of the College of Pharmacy at Dankook University (Cheonan, Republic of Korea). The dried and pulverized A. pilosa was extracted using 80% ethanol (EtOH, 30 L, 12 h, 4 times) at room temperature. The resulting filtrate was concentrated under a vacuum to yield 150 g of APE, which was then used for the subsequent investigations.
2.2. Isolation of the Active Components
APE was partitioned based on solvent polarity using n-hexane (Hx), dichloromethane (DCM), ethyl acetate (EA), and water (DW). After concentration under a vacuum, we obtained four fractions: Hx (29.5 g), DCM (18.2 g), EA (69.1 g), and DW (30.0 g). The EA fraction, which exhibited the highest efficacy in reducing sAPPβ and β-secretase levels, was fractionated by silica gel (70–230-mesh, Watchers, Tokyo, Japan) open CC with a solvent mixture of chloroform and methanol (100:1), and 8 fractions (EA1~EA8) were obtained. Subfraction 6 (EA6) was then fractionated by silica gel open CC with a solvent mixture of chloroform and methanol (100:5~100:30), and 8 fractions (EA6-1~EA6-8) were obtained. Subfraction 6-2 (EA6-2) was further fractionated using a Sephadex LH-20 (GE Healthcare, Danderyd, Sweden) for open CC with a solvent mixture of water and methanol (9:1~5:5), and 9 fractions (EA6-2-1~EA6-2-9) were obtained. As a result, EA6-2-3 (compound 1, 168 mg) and EA6-2-7 (compound 2, 178 mg) were obtained as pure compounds. Subfraction 6-5 (EA6-5) was further fractionated using a Sephadex LH-20 for open CC with a solvent mixture of water and methanol (9:1~5:5), and 9 fractions (EA6-5-1~ EA6-5-16) were obtained. As a result, EA6-5-11 (compound 3, 139 mg) was obtained as a pure compound. Subfraction 6-5-15 (EA6-5-15) was further fractionated using a Sephadex LH-20 for open CC with a solvent mixture of water and methanol (9:1~1:9), and 6 fractions (EA6-5-15-1~EA6-5-15-6) were obtained. As a result, EA6-5-15-3 (compound 5, 27 mg) and EA6-5-15-6 (compound 6, 15 mg) were obtained as pure compounds. Subfraction 6-6 (EA6-6) was further fractionated using a Sephadex LH-20 for open CC with a solvent mixture of water and methanol (9:1~5:5), and 24 fractions (EA6-6-1~ EA6-6-24) were obtained. As a result, EA6-6-19 (compound 4, 4 mg) was obtained as a pure compound. Subfraction 7 (EA7) was then fractionated by silica gel open CC with a solvent mixture of chloroform and methanol (100:10~100:30), and 8 fractions (EA7-1~EA7-8) were obtained. Subfraction 7-3 (EA7-3) was further fractionated using a Sephadex LH-20 for open CC with a solvent mixture of water and methanol (9:1~5:5), and 18 fractions (EA7-3-1~EA7-3-18) were obtained. As a result, EA7-3-15 (compound 8, 37 mg) was obtained as a pure compound. Subfraction 7-3-5 (EA7-3-5) was further fractionated by silica gel open CC with a solvent mixture of chloroform and methanol (100:10~100:50), and 8 fractions (EA7-3-5-1~EA7-3-5-8) were obtained. As a result, EA7-3-5-2 (compound 7, 11 mg) was obtained as a pure compound. Subfraction 7-5 (EA7-5) was further fractionated using a Sephadex LH-20 for open CC with a solvent mixture of water and methanol (9:1~1:9), and 14 fractions (EA7-5-1~EA7-5-14) were obtained. As a result, EA7-5-6 (compound 9, 47 mg) was obtained as a pure compound. Compound 10 (12 mg) was obtained as a pure compound through crystallization in subfraction 7-6 (EA7-6). Subfraction 4 (EA4) was further fractionated by silica gel open CC with a solvent mixture of chloroform and methanol (100:1), and 14 fractions (EA4-1~EA4-14) were obtained. Subfraction 4-8 (EA4-8) was further fractionated using C18 (Watchers) open CC with a solvent mixture of water and methanol (9:1~1:9), and 16 fractions (EA4-8-1~EA4-8-16) were obtained. As a result, compound 11 (12 mg) was obtained as a pure compound through crystallization in subfraction 4-8 (EA4-8-14). We isolated a total of 11 compounds from this fraction and determined their structures based on NMR data.
2.3. Cell Culture and Viability
The APP-CHO cells were cultured in RPMI 1640 medium (Welgene, Gyeongsan, Republic of Korea) supplemented with 10% heat-inactivated fetal bovine serum (FBS, Gibco, Grand Island, NY, USA) and geneticin (Thermo Fisher Scientific, Waltham, MA, USA) at a concentration of 50 μg/mL. The cells were maintained in a humidified atmosphere with 5% CO2 at 37 °C. The cell viability was assessed using the MTT (Biosesang, Yongin, Republic of Korea) assay. Briefly, the APP-CHO cells were seeded at a density of 2 × 10⁴ cells per well in a 96-well plate with 100 μL of medium per well. The plates were incubated overnight at 37 °C to allow cell adherence. Prior to treatment with the test samples, the medium was replaced with RPMI 1640 without FBS for 1 h. Test samples dissolved in DMSO (Biosesang, Yongin, Republic of Korea) were then added to the respective wells, and the plates were further incubated at 37 °C for 24 h. After incubation, 10 μL of 5 mg/mL MTT solution was added to each well and incubated at 37 °C for 3 h. The medium was aspirated, and 100 μL of DMSO was added to solubilize the formazan crystals. The plates were subsequently incubated at room temperature for 30 min, and the absorbance was measured at 540 nm using an E-max precision microplate reader (BioTek, Winooski, VT, USA). Each experiment was conducted in triplicate.
2.4. Western Blot Analysis
APP-CHO cells seeded in 6-well plates at a density of 6 × 10⁵ cells in 1000 μL of medium per well were incubated overnight at 37 °C to allow for cell adhesion. The medium was then replaced with RPMI 1640 without FBS for 1 h, followed by treatment with the test samples at 37 °C. After 24 h, cells were washed with PBS and lysed using Laemmli sample buffer. Cell lysates were subjected to 7.5% SDS-PAGE to separate proteins based on size and transferred onto a PVDF membrane (Merck, Burlington, MA, USA) using the Trans-Blot® TurboTM system (Bio-Rad, Hercules, CA, USA). The membrane was blocked with 5% skim milk in PBS for 1 h and incubated overnight at 4 °C with primary antibodies including sAPPβ (1:1000, Immuno-Biological Laboratories, Fujioka, Japan), β-secretase (1:1000, EMD Millipore, Burlington, MA, USA), sAPPα (1:1000, Immuno-Biological Laboratories), ADAM10 (1:1000, EMD Millipore), presenilin-1 (1:1000, EMD Millipore), and α-tubulin (1:1000, Sigma Aldrich, St. Louis, MO, USA). After washing the membrane three times for 20 min each with PBS-T (0.1% Tween 20 in PBS), secondary antibodies conjugated to horseradish peroxidase (EC 1.11.1.7) (1:1000, Bio-Rad) were applied. Protein visualization was performed using the ChemiDocTM XRS+ system (Bio-Rad). The band signal intensities were quantified using Bio-Rad software (version 5.2.1) and normalized to the α-tubulin signal intensity. The results were expressed as a percentage relative to the DMSO-treated control group.
2.5. The Th T Assay
A Th T (Sigma Aldrich, St. Louis, MA, USA) assay was conducted in order to assess the Aβ aggregation. Aβ (1–42) (GL Biochem, Shanghai, China) was dissolved in DMSO to a concentration of 1 mg/mL, and test samples were also prepared in DMSO. To evaluate the impact of the test samples on Aβ aggregation, 20 μM of Aβ (1–42) was incubated with varying concentrations of the test samples at 37 °C. After 24 h, 3 μM of Th T was added, and the fluorescence was measured using an E-max precision microplate reader (BioTek) with excitation at 442 nm and emission at 485 nm. Aβ treated with DMSO alone served as the control, and each assay was conducted at least three times. To investigate the disaggregation effects of the test samples on pre-formed Aβ aggregates, Th T assays were performed similarly. Initially, 20 μM of Aβ (1–42) was incubated at 37 °C for 24 h to induce aggregation. Subsequently, various concentrations of the test samples were added and further incubated at 37 °C for an additional 24 h. Following this incubation period, 3 μM of Th T was added, and the fluorescence was measured after 30 min using the E-max precision microplate reader (BioTek) under the same conditions. Aβ treated with DMSO alone served as the control, and each assay was performed in triplicate.
2.6. HPLC Analysis of APE
For HPLC fingerprint analysis of the isolated compounds present in APE, a Waters system consisting of a Waters e2695/Waters 2998 photo-diode array detector and the CAPCELL PAK C18, UG80 (5 um, 4.6 mm I.D. × 250 mm) (Shiseido, Tokyo, Japan), was used. A flow rate of 1 mL/min, and gradient elution of 0.1% formic acid (Fisher Chemical, New Hampshire, USA) in water (solvent A) and acetonitrile (solvent B), 0–40 min; solvent B from 5 to 40%, 40–41 min; solvent B from 40 to 80%, 41–50 min; and solvent B from 80 to 80% and an injection volume of 20 μL were applied; the chromatograms were monitored at 280 nm.
2.7. Statistical Analysis
The data are presented as means ± SD for the in vitro study. The statistical analyses were performed by first conducting a variance test using Levene’s test. If the resulting p-value was greater than 0.05, we accepted the assumption of homogeneity of variances. Subsequently, two or more group comparisons were assessed using one-way analysis of variance (ANOVA), followed by Fisher’s least significant difference test (SPSS version 27.0, Armonk, NY, USA). If the p-value from Levene’s test was less than 0.05, indicating heterogeneity of variances, we employed alternative tests. In such cases, two or more group comparisons were evaluated using Tamhane’s T2 test and Dunnett’s test (SPSS version 27.0, Armonk, NY, USA). Statistically significant differences between groups were considered when the p-value was below 0.05 (p < 0.05).
3. Results
3.1. APE Decreased the Levels of sAPPβ and β-Secretase in the APP-CHO Cells
The potential cytotoxicity of APE was assessed using the MTT assay, which revealed that APE did not reduce the viability of the APP-CHO cells to below 80% at up to 100 μg/mL (Supplementary Figure S1). In other words, APE is not toxic up to 100 μg/mL, and thus this was applied for the Western blot. In the amyloidgenic pathway of APP, Aβ is produced from APP by sequential proteolytic cleavages by β-and γ-secretases. In this process, β-secretase cleaves APP into two fragments, sAPPβ and CTF-β. Thus, the amount of Aβ produced was quantified by measuring the levels of sAPPβ and β-secretase through Western blot analysis. The butanol-partitioned fraction of Dryopteris crassirhizoma root (50 μg/mL) extract served as a positive control (PC) [25]. As depicted in Figure 1, APE demonstrated a dose-dependent reduction in sAPPβ production. Treatment with 100 μg/mL of APE decreased the sAPPβ levels to only 3% of those in the DMSO-treated control group. Additionally, there was a significant dose-dependent decrease in β-secretase levels following APE treatment. Specifically, the application of 100 μg/mL of APE reduced the β-secretase levels to approximately 40% of those in the DMSO-treated control group, nearing the levels observed in the positive control.

Figure 1.
The effect of APE on the levels of sAPPβ and β-secretase. (A) The amounts of sAPPβ and β-secretase were assessed using Western blot analysis in the APP-CHO cells treated with varying concentrations (100, 50, 25, and 12.5 μg/mL) of APE. The graphs depict the levels of sAPPβ (B) and β-secretase (C) relative to those in the DMSO-treated control group. Data are presented as means ± SD of three independent experiments, with the values expressed as a percentage relative to the DMSO-treated control group. * p < 0.05 indicates statistical significance compared to the control group (CTR:DMSO-treated control, PC: positive control, extract of D. crassirhizoma roots, APE: ethanol extract of A. pilosa).
3.2. The Solvent-Partitioned Fractions of APE Decreased the Levels of sAPPβ and β-Secretase in the APP-CHO Cells
APE was fractionated based on solvent polarity into four fractions: Hx, DCM, EA, and DW. The potential cytotoxicity of these solvent-partitioned fractions was evaluated using the MTT assay, and none of these fractions decreased the viability of the APP-CHO cells below 80% (Supplementary Figure S2). Therefore, a concentration of 50 μg/mL was selected to investigate the effects of the fractions on sAPPβ production.
The impact of these solvent-partitioned fractions on the levels of sAPPβ and β-secretase was assessed via Western blot analysis. As depicted in Figure 2, all fractions reduced sAPPβ production and β-secretase levels. While the Hx fraction showed the highest effect on sAPPβ levels, it did not significantly reduce β-secretase levels. In contrast, the EA fraction significantly decreased both sAPPβ and β-secretase levels. Hence, the EA fraction was chosen for further investigation.
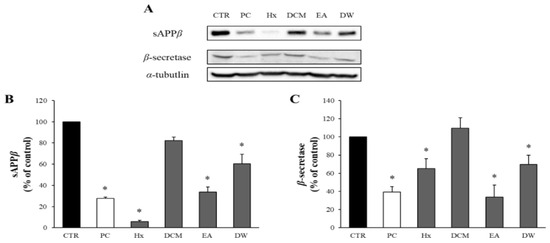
Figure 2.
The effects of the solvent-partitioned fractions on sAPPβ and β-secretase. (A) The amounts of sAPPβ and β-secretase in APP-CHO cells treated with the 4 solvent-partitioned fractions (50 μg/mL) were assessed using Western blot analysis. (B,C) The graphs display the levels of sAPPβ and β-secretase, presented as a percentage of the DMSO-treated control group. Data are presented as means ± SD of three independent experiments, with values expressed as a percentage relative to the DMSO-treated control group. * p < 0.05 indicates statistical significance compared to the control group (CTR: DMSO-treated control, PC: positive control, extract of D. crassirhizoma roots, Hx: n-hexane, DCM: dichloromethane, EA: ethyl acetate, DW: water).
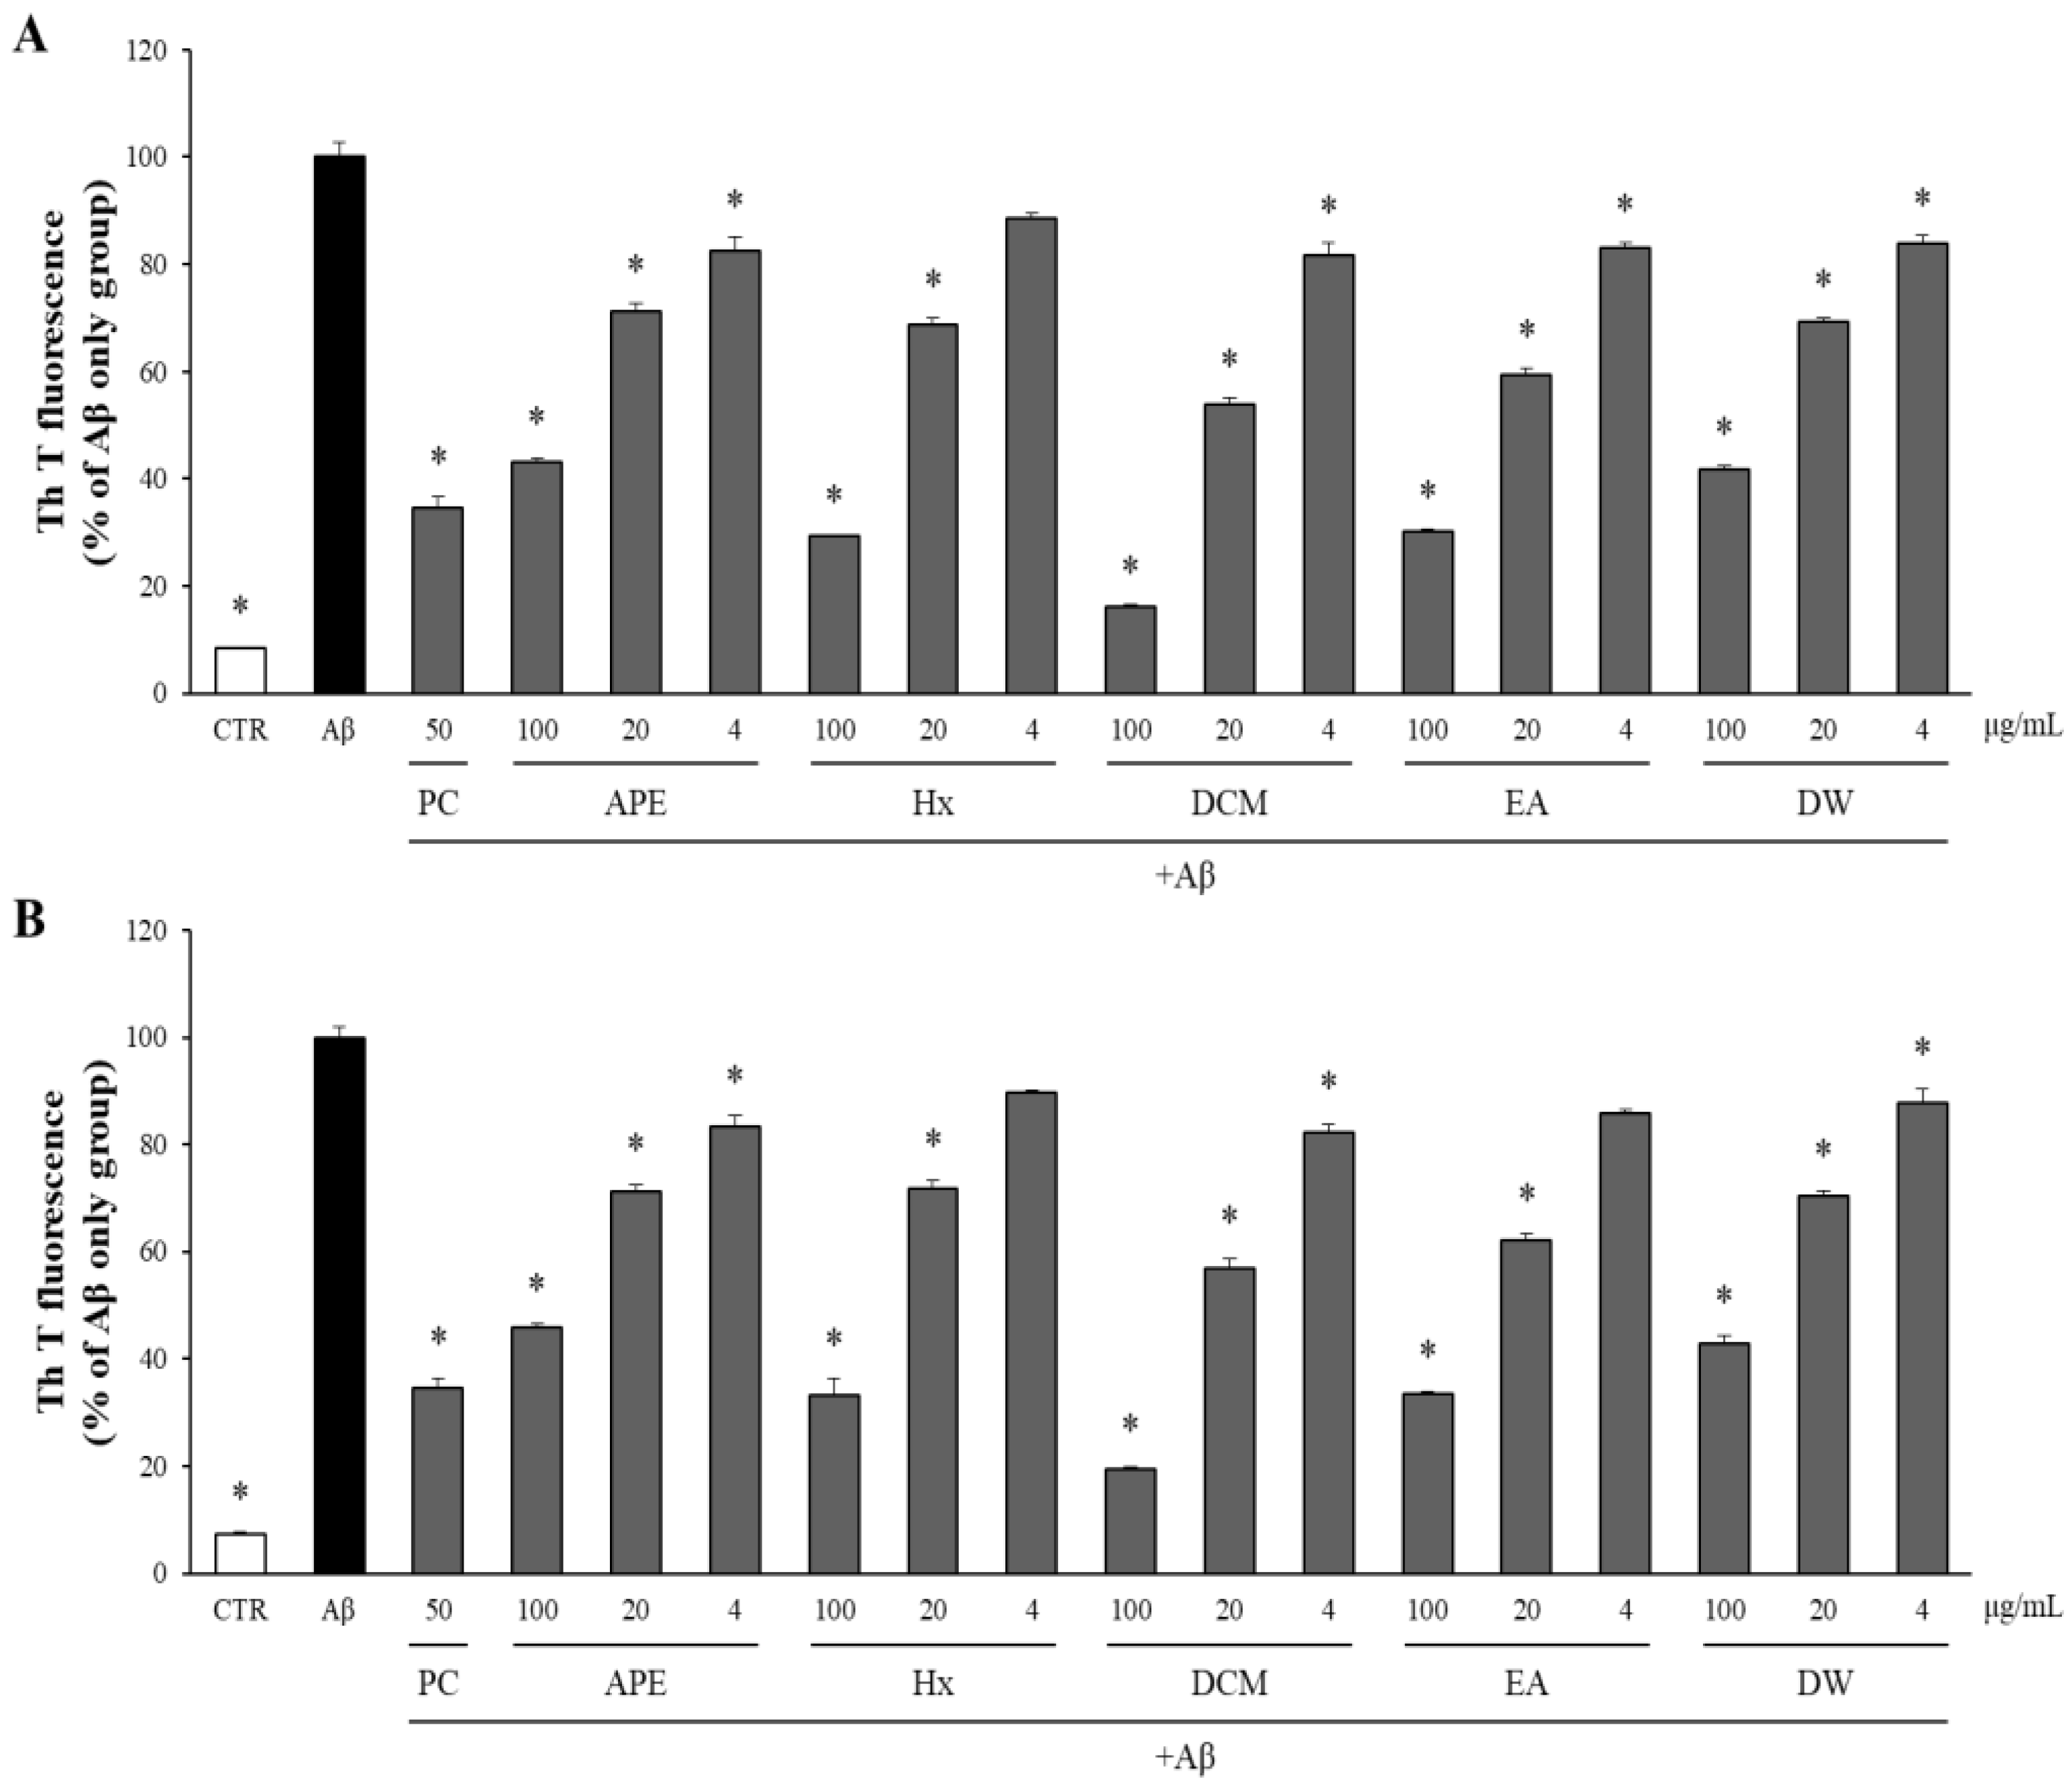
3.3. Both APE and Its Solvent-Partitioned Fractions Decreased Aβ Aggregation and Enhanced the Disaggregation of Pre-Aggregated Aβ
The effects of APE and its solvent-partitioned fractions on Aβ aggregation and disaggregation were evaluated using the Th T assay. Quercetin (50 μg/mL) served as a positive control (PC) [26]. As depicted in Figure 3A, both APE and the four solvent-partitioned fractions exhibited significant and dose-dependent reductions in Aβ aggregation compared to the DMSO-treated Aβ-only control group. To assess their impact on the disaggregation of pre-formed Aβ aggregates, APE and its fractions were incubated with pre-aggregated Aβ for an additional 24 h at concentrations of 100, 20, and 4 μg/mL. Subsequent measurement of the Aβ aggregation levels using the Th T assay demonstrated that APE and its fractions facilitated the disaggregation of Aβ aggregates into monomers, as illustrated in Figure 3B.
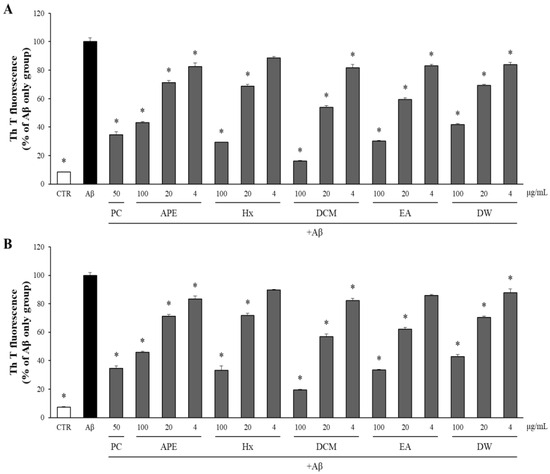
Figure 3.
The effect of APE and its solvent-partitioned fractions on Aβ aggregation and disaggregation. (A) Aβ was exposed to concentrations of 100, 20, and 4 μg/mL of APE and the solvent-partitioned fractions. Following a 24 h incubation period, Aβ aggregation was assessed using the Th T assay. (B) Aβ aggregates that had been pre-formed for 24 h were exposed to APE and the solvent-partitioned fractions at concentrations of 100, 20, and 4 μg/mL. Following an additional 24 h incubation, the extent of Aβ aggregation was assessed using the Th T assay. All data are presented as means ± SD of three independent experiments. * p < 0.05, significantly different from the Aβ-only group (PC: positive control, quercetin, 50 μg/mL).
3.4. Isolation of Active Constituents from APE and Structural Identification
The ethyl acetate (EA) fraction of APE was subjected to successive fractionation steps using various open CC techniques. This approach followed the bioassay-guided isolation method detailed in the Section 2. As a result, 11 compounds were isolated, each with a purity exceeding 95%, and their structures were elucidated by analyzing the NMR data and comparing them with relevant references (Figure 4). The 1H and 13C NMR spectral data for the isolated compounds are provided in Supplementary Figure S3–S24.
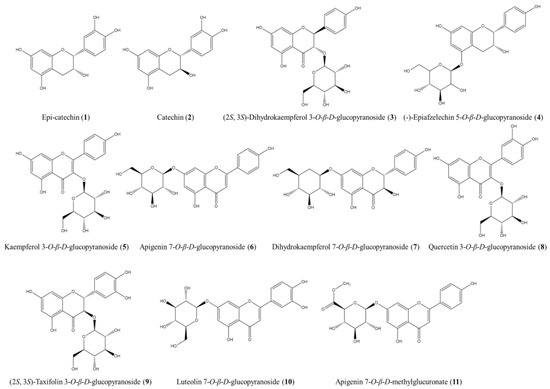
Figure 4.
The structures of the compounds isolated and identified from the EA fraction of APE.
These compounds were identified as epi-catechin (1) [27], catechin (2) [28], (2S, 3S)-dihydrokaempferol 3-O-β-D-glucopyranoside (3) [29], (-)-epiafzelechin 5-O-β-D-glucopyranoside (4) [30], kaempferol 3-O-β-D-glucopyranoside (5) [31], apigenin 7-O-β-D-glucopyranoside (6) [32], dihydrokaempferol 7-O-β-D-glucopyranoside (7) [33], quercetin 3-O-β-D-glucopyranoside (8) [34], (2S, 3S)-taxifolin 3-O-β-D-glucopyranoside (9) [35], luteolin 7-O-β-D-glucopyranoside (10) [36], and apigenin 7-O-β-D-methylglucuronate (11) [37].
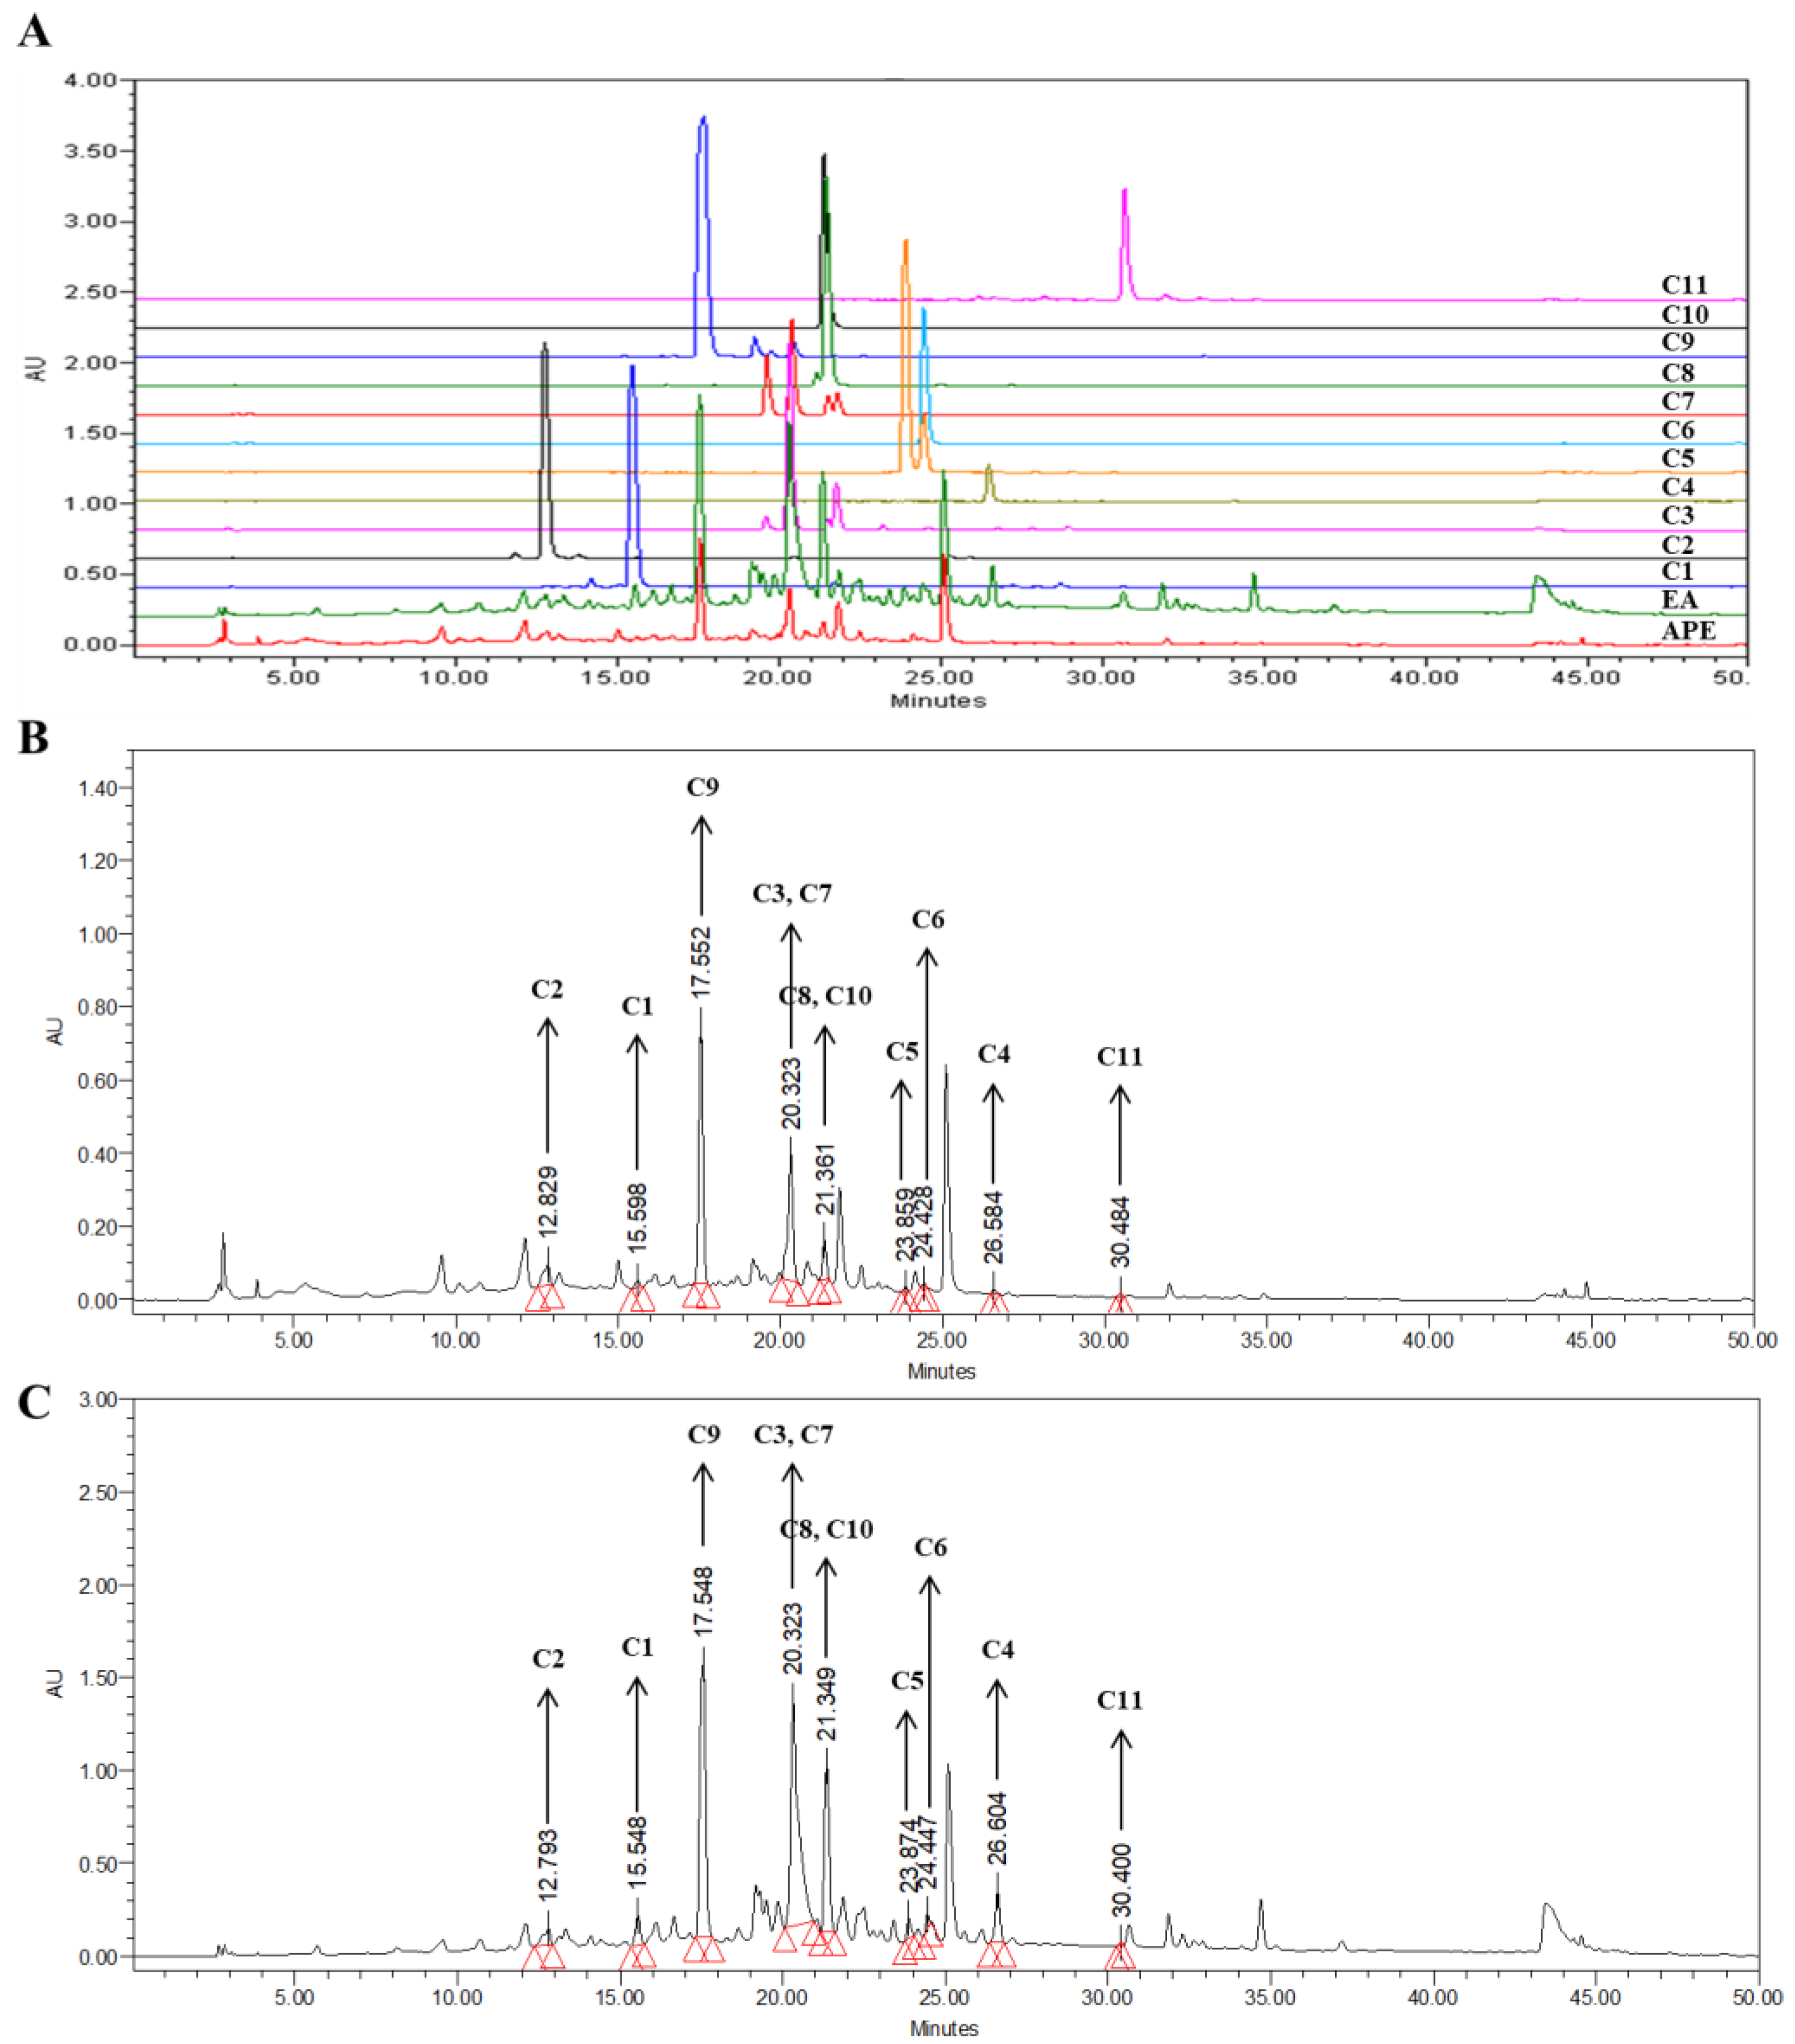
3.5. The HPLC Fingerprints of APE and the EA Fraction
To analyze the HPLC fingerprints, HPLC chromatograms of APE, the EA fraction, and the compounds isolated were obtained using HPLC-PDA at 280 nm. The peaks in the HPLC chromatograms of APE and the EA fraction were compared to those of the compounds isolated. Peaks for the same retention time and PDA absorption spectrum were determined as matching the compounds isolated. In APE and the EA fraction, all the compounds isolated from APE were detected, and compounds 3, 7, and 9 showed high contents (Figure 5). Among them, compound 9 could be set as a marker compound for the quality control of APE and the EA fraction because compound 9 was clearly separated from the other compounds, and its content in the extract was high compared to the others.

Figure 5.
HPLC chromatogram of the APE, EA fraction, and isolated compounds. (A) A chromatogram of compounds 1–11, (B) APE, and (C) EA fraction recorded at wavelength of 280 nm (APE: A. pliosa, 20 mg/mL; EA: ethyl acetate fraction of A. pliosa, 20 mg/mL; C1: compound 1; C2: compound 2; C3: compound 3; C4: compound 4; C5: compound 5; C6: compound 6; C7: compound 7; C8: compound 8; C9: compound 9; C10: compound 10; and C11: compound 11; all isolated compounds were analyzed at 1 mg/mL).
3.6. Inhibitory Effects of the Isolated Compounds on the Levels of sAPPβ and β-Secretase
The compounds isolated from the EA fraction of APE were evaluated for potential cytotoxicity at concentrations of 50 and 10 μg/mL using the MTT assay. None of these compounds decreased the viability of the APP-CHO cells to below 80% (Supplementary Figure S25); thus, subsequent studies were conducted using concentrations of 50 and 10 μg/mL.
The effects of these compounds on sAPPβ and β-secretase were analyzed via Western blotting. Compounds 1–11 reduced sAPPβ production. Particularly, compounds 4 and 6 at 50 μg/mL decreased the sAPPβ levels to 40% compared to the DMSO-treated control group, while compound 8 achieved a reduction to 30%. Furthermore, all the compounds significantly decreased the levels of β-secretase compared to the DMSO-treated control group. Compounds 4 and 9 (50 μg/mL) also significantly reduced the β-secretase levels to 50% and 60%, respectively, of those in the DMSO-treated control group (Figure 6).

Figure 6.
The effects of compounds 1–11 on sAPPβ and β-secretase. (A–C,J–L) The supernatant and cell lysates obtained from APP-CHO cells treated with the compounds (50 and 10 μg/mL) were subjected to Western blot analysis to determine the levels of sAPPβ and β-secretase, respectively. (D–I,M–R) Graphs showing changes in the levels of sAPPβ and β-secretase proteins. Data are presented as means ± SD of three independent experiments, with values expressed as a percentage relative to the DMSO-treated control group. * p < 0.05 indicates statistical significance (PC: positive control, extract of D. crassirhizoma roots).
3.7. Inhibitory Effects of the Isolated Compounds on γ-Secretase Levels
In the amyloidogenic pathway of APP, Aβ is produced by the cleavage of β-secretase and γ-secretase, so the levels of γ-secretase were also analyzed through Western blot analysis. As shown in Figure 7, all the compounds except compounds 5 and 6 reduced the levels of γ-secretase compared to the DMSO-treated control group. Notably, compounds 3 and 4 at 50 μg/mL significantly decreased the γ-secretase levels to only 38 and 44%, respectively, compared to the DMSO-treated control group.
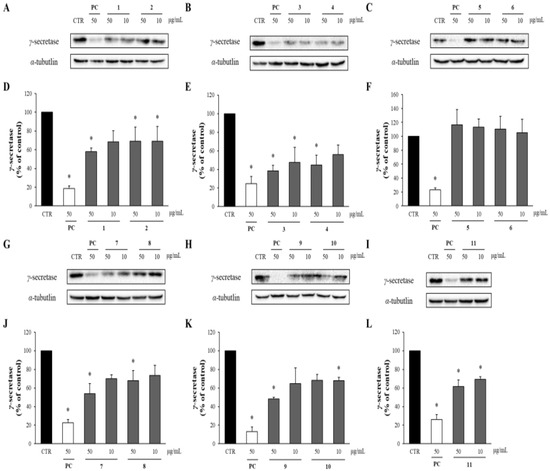
Figure 7.
The effects of compounds 1–11 on the levels of γ-secretase. (A–C, G–I) APP-CHO cells treated with 50 and 10 μg/mL of compounds were subjected to Western blot analysis in order to determine the levels of γ-secretase in the cell lysates. (D–F, J–L) Graphs showing changes in the γ-secretase proteins. Data are presented as means ± SD of three independent experiments, with values expressed as a percentage relative to the DMSO-treated control group. * p < 0.05 indicates statistical significance compared to the control group. * p < 0.05 indicates a significant differences compared to the control group (PC: positive control, extract of D. crassirhizoma roots).
3.8. Effects of the Isolated Compounds on sAPPα and α-Secretase Levels
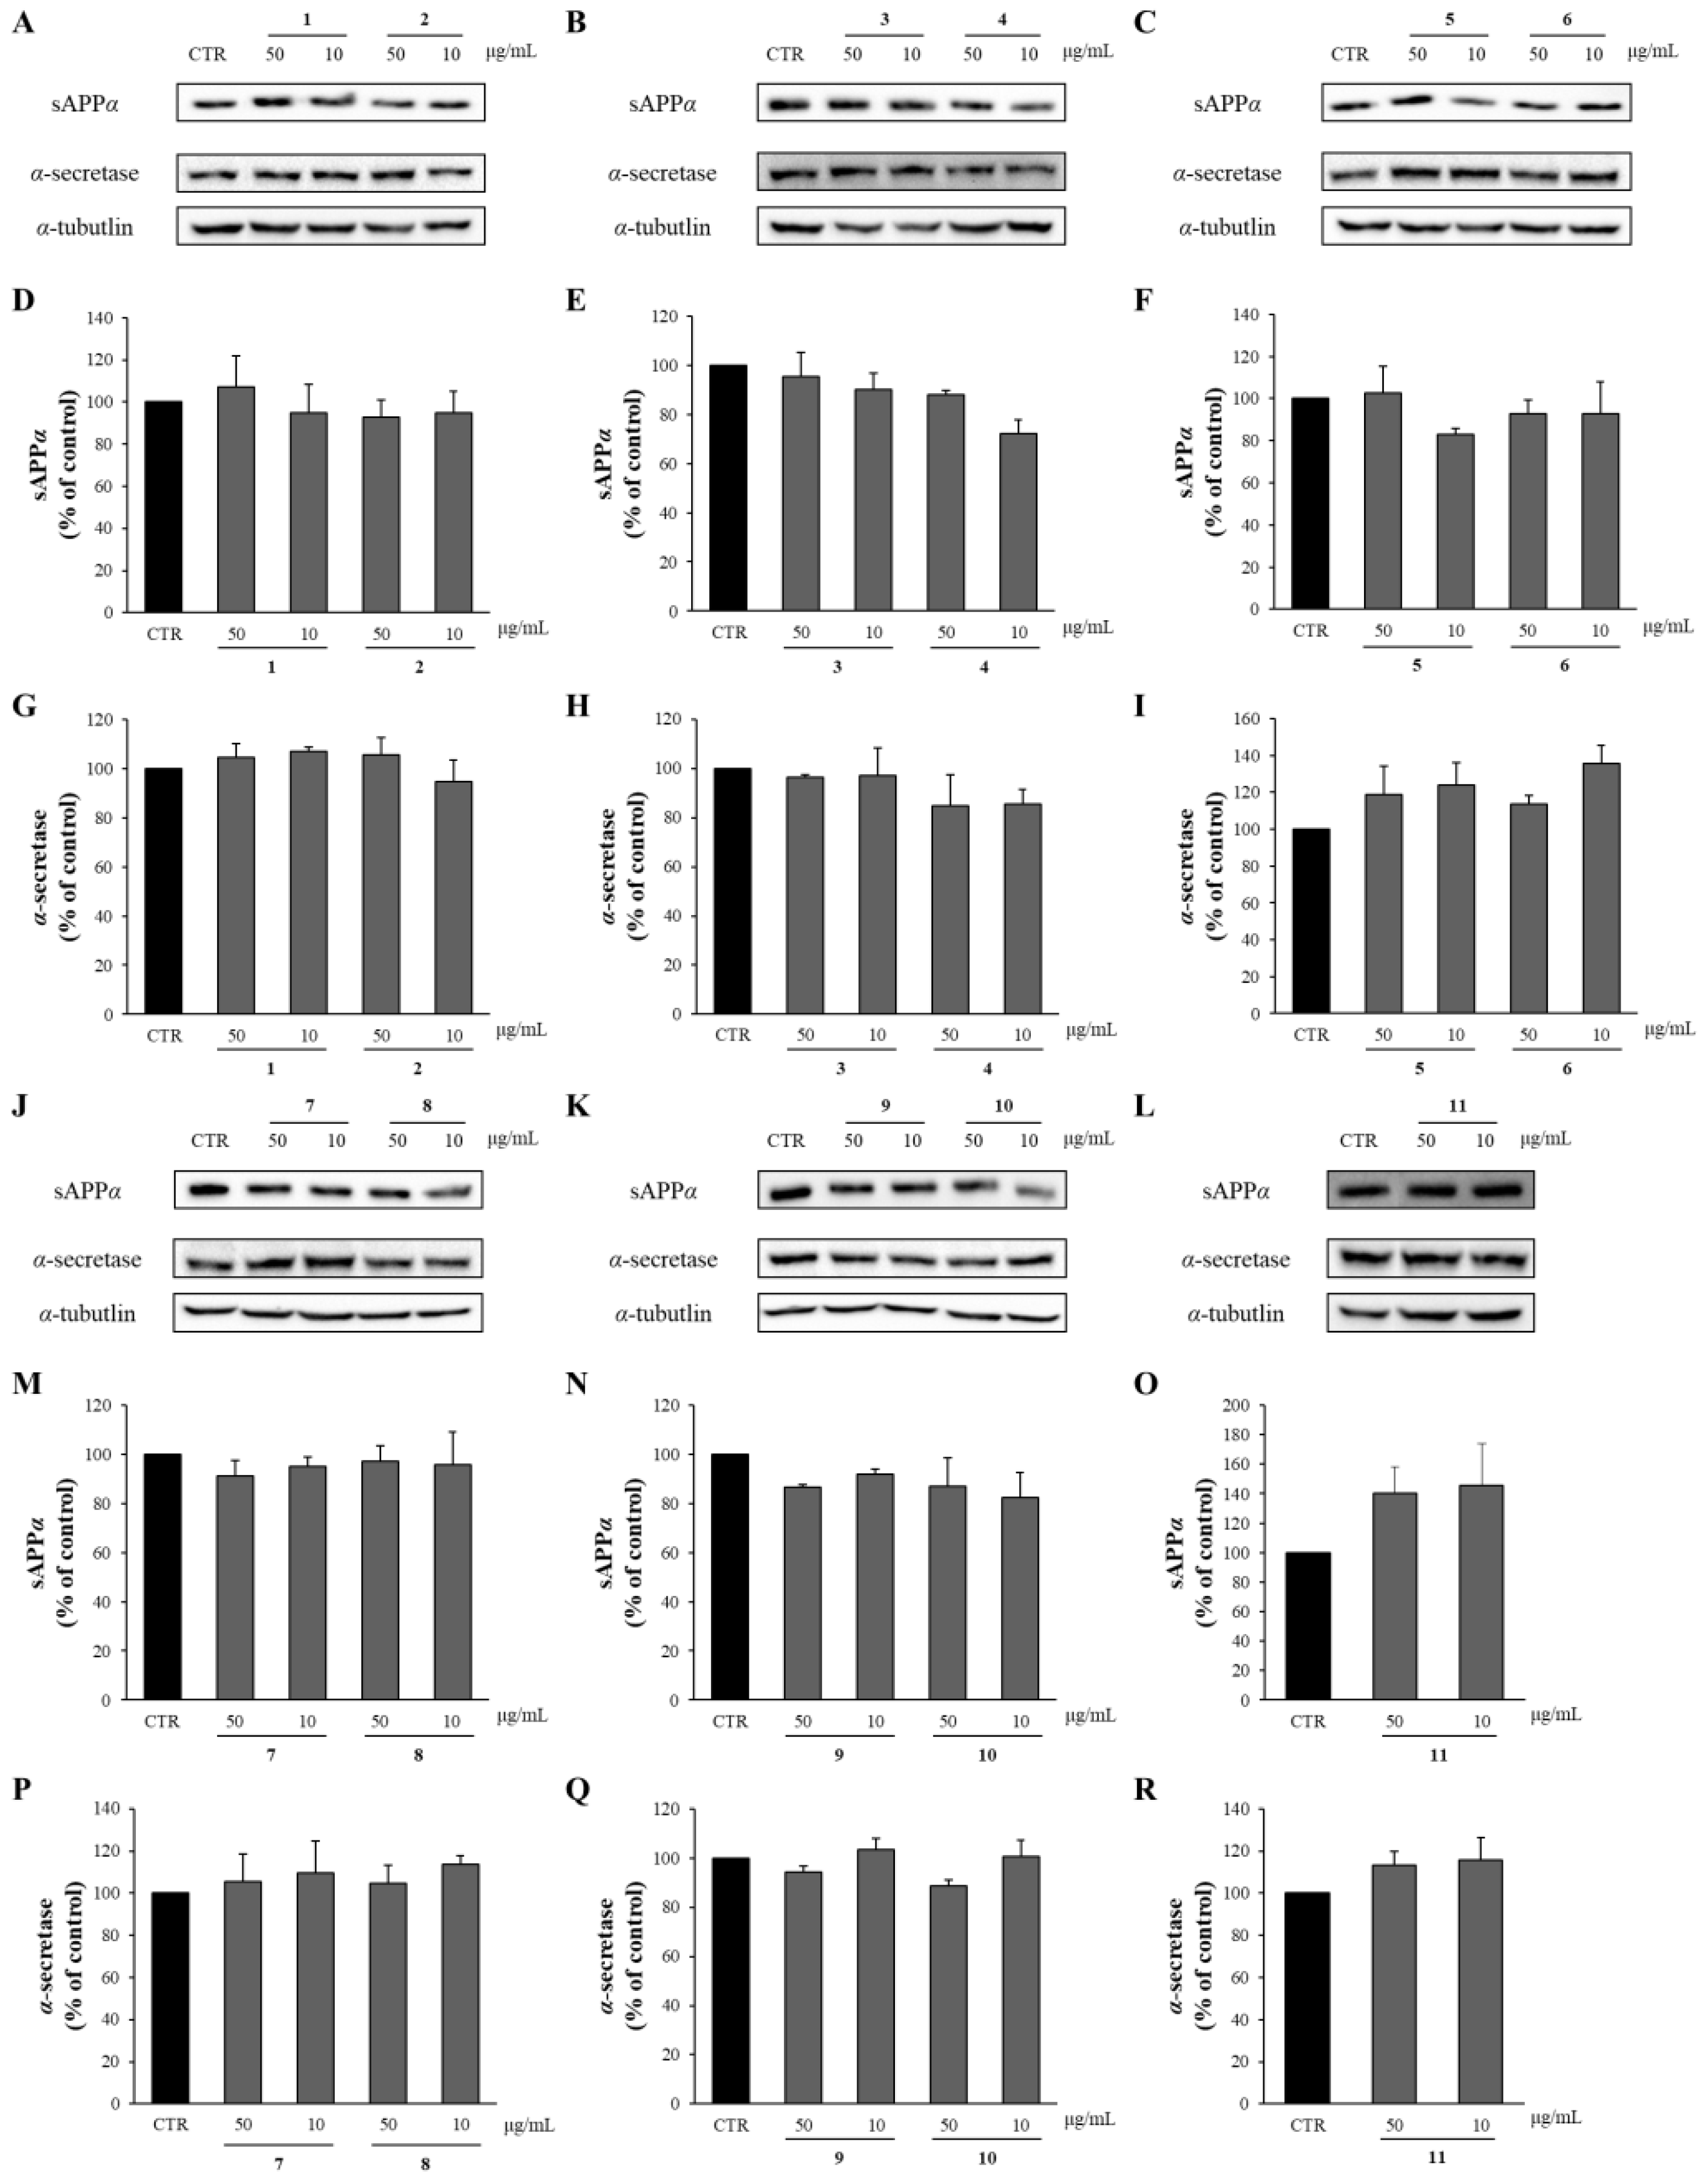
APP is cleaved by α-secretase within the Aβ domain, which precludes the production of intact Aβ in the non-amyloidogenic pathway. Instead, APP ectodomain fragments, sAPPα are released from the cells. Thus, the effects of the compounds from APE on the levels of sAPPα and α-secretase were determined through Western blot analysis. As shown in Figure 8, all the compounds isolated from APE showed no significant differences in sAPPα and α-secretase levels compared to the DMSO-treated control group.
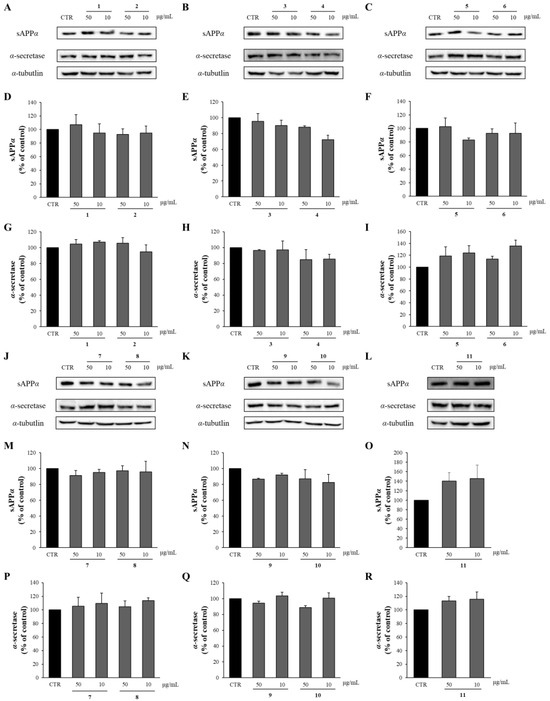
Figure 8.
The effects of compounds 1–11 on sAPPα and α-secretase. (A–C,J–L) APP-CHO cells treated with 50 and 10 μg/mL of compounds were subjected to Western blot analysis in order to determine the levels of sAPPα in the supernatant and those of α-secretase in the cell lysates. (D–I,M–R) Graphs showing changes in the levels of sAPPα and α-secretase proteins. Data are presented as means ± SD of three independent experiments, with values expressed as a percentage relative to the DMSO-treated control group. * p < 0.05 indicates statistical significance compared to the control group.
3.9. Compounds from APE Inhibited Aβ Aggregation and Promoted the Disaggregation of Pre-Aggregated Aβ
Compounds 1, 2, 4, 8, and 10, which exhibited significant inhibition of Aβ production, were assessed for their effects on both the aggregation and disaggregation of Aβ using the Th T assay. As illustrated in Figure 9A, these compounds at 100 μg/mL significantly reduced the Aβ aggregation compared to the Aβ-only control group. Notably, compound 8 at 100 μg/mL was particularly effective among the eleven isolated compounds, reducing Aβ aggregation to 43% of the level observed in the Aβ-only control group. To evaluate the impact of these compounds on the disaggregation of pre-formed Aβ aggregates, Aβ was pre-aggregated for 24 h, followed by incubation with the compounds at concentrations of 100, 50, and 10 μg/mL. The extent of Aβ aggregation was subsequently measured using the Th T assay. As depicted in Figure 9B, compounds 1, 2, 4, 8, and 10 at 100 μg/mL significantly promoted the disaggregation of the Aβ aggregates into monomers compared to in the Aβ-only control group. Compound 8 at 100 μg/mL, in particular, was the most effective among the isolated compounds, facilitating the disaggregation of Aβ to 41% of the level observed in the Aβ-only control group.
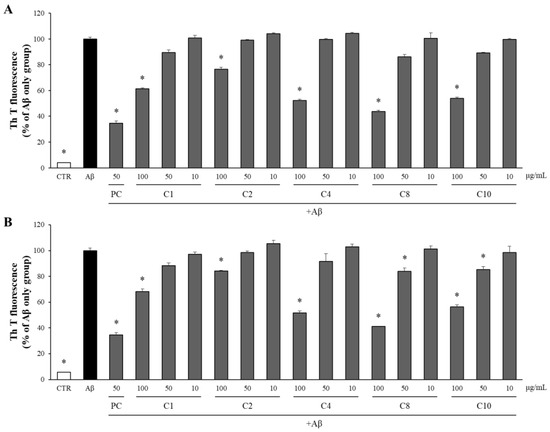
Figure 9.
The effects of the compounds on the aggregation and disaggregation of Aβ. (A) The compounds isolated from APE were incubated with Aβ at concentrations of 100, 50, and 10 μg/mL. After 24 h, the aggregation of Aβ was assessed using the Th T assay. (B) The compounds isolated from APE were added to Aβ aggregates pre-formed for 24 h at concentrations of 100, 50, and 10 μg/mL. After an additional 24 h, the disaggregation of Aβ was evaluated using the Th T assay. All data are presented as means ± SD of three independent experiments. * p < 0.05, significantly different from the Aβ-only group (PC: positive control, quercetin, 50 μg/mL).
4. Discussion
Aβ is produced following the sequential cleavage of APP by β- and γ-secretases in the amyloidogenic pathway [8]. In the alternative non-amyloidogenic pathway, APP is cleaved within the Aβ domain by α-secretase, and this precludes the formation of Aβ [8]. In addition, as a secondary mechanism to secretase reduction, secretase reduction increases autophagic flux, resulting in increased Aβ clearance, which means a reduction in cerebral toxic substances [38]. The produced monomer forms of Aβ aggregate into neurotoxic Aβ oligomers and fibrils, eventually deposited as senile plaques [39]. Furthermore, the Aβ aggregates promote the production of free radicals such as ROS that react rapidly with proteins and lipids, resulting in the formation of toxic oxidized proteins and peroxidized lipids [40]. Persistent Aβ aggregation also induces the sustained activation of the innate immune system and activates microglial cells, which, in turn, secretes various proinflammatory cytokines and chemokines, leading to neuroinflammation [41]. This process exacerbates microglia-mediated neuronal loss and synaptic degeneration, which are significant contributors to the development of AD [42]. In this study, APE effectively decreased Aβ production by decreasing the β-secretase levels, which is a crucial enzyme in the amyloidogenic pathway for Aβ production from APP. Furthermore, APE demonstrated significant reductions in Aβ aggregation and facilitated the disaggregation of pre-formed Aβ aggregates. These results suggest that APE may have had positive effects in treating AD.
This study marks the first report on the inhibitory effects of APE on the production and aggregation of Aβ and the promotion of Aβ disaggregation. Based on the bioassay-guided isolation, 11 flavonoids were isolated and identified. Among them, (-)-epiafzelechin 5-O-β-D-glucopyranoside (4) and apigenin 7-O-β-D-glucopyranoside (6) significantly reduced Aβ production by reducing the levels of β-secretase and γ-secretase in the APP-CHO cells, but there was no significant change in the levels of α-secretase. Moreover, epi-catechin (1), catechin (2), (-)-epiafzelechin 5-O-β-D-glucopyranoside (4), quercetin 3-O-β-D-glucopyranoside (8), and luteolin 7-O-β-D-glucopyranoside (10) also significantly reduced Aβ aggregation and promoted the disaggregation of pre-formed Aβ aggregates.
All isolates isolated in this study except epi-catechin (1) and (-)-epiafzelechin 5-O-β-D-glucopyranoside (4) were previously isolated from A. pilosa [43,44,45,46,47,48,49]. Epi-catechin (1) and catechin (2) isolated from cocoa had neuroprotective effects by increasing the viability of PC12 cells in response to Aβ-induced neurotoxicity [50]. In addition, epi-catechin (1), catechin (2), and (2S, 3S)-dihydrokaempferol 3-O-β-D-glucopyranoside (3) had potent antioxidant activity in an in vitro assay [29,51]. Moreover, epi-catechin (1) has an important role as a bioactive natural product, and a recent study revealed that procyanidins, condensed tannins of (-)-epicatechin, are a potent virucidal agent against SARS-CoV-2 [52]. Kaempferol 3-O-β-D-glucopyranoside (5) is known to have antioxidant effects by upregulating the nuclear factor erythroid 2-related factor 2 (Nrf2)/heme oxygenase (HO)-1 signaling pathway through decreasing reactive oxygen species (ROS) in lipopolysaccharide(LPS)-stimulated BV2 cells [53]. Apigenin 7-O-β-D-glucopyranoside (6) and luteolin 7-O-β-D-glucopyranoside (10) exhibited very high binding affinity to acetyl cholinesterase (AChE) and butyrylcholinesterase (BChE) and the potential for anti-inflammatory effects [54]. Quercetin 3-O-β-D-glucopyranoside (8) improves Aβ25-35-induced memory deficits and cognitive impairment and promotes brain protection against oxidative stress [55]. However, a positive effect of isolated compounds 1–11 on Aβ production and aggregation has not been reported previously.
Flavonoids, secondary metabolites, have garnered significant interest in the pharmaceutical industry owing to their wide range of therapeutic properties [56]. They are also noted for their potential in alleviating cognitive decline, restoring memory function, and delaying the onset of conditions associated with AD [57]. Several flavonoids, such as quercetin and epigallocatechin gallate (EGCG), have shown the ability to ameliorate Aβ pathology in in vitro and in vivo studies [58,59]. Well-known examples of flavonoid-mediated inhibition of APP processing were reported with quercetin and quercetin-3-O-rutinoside, with significantly increased degradation of β-secretase in SH-SY5Y cells overexpressing APPswe [60]. Furthermore, (-)-epicatechin inhibited β- and γ-secretase-dependent APP processing with a low IC50 value of 20.5 nM, which led to reduced Aβ pathology in TASTPM transgenic AD mice [61]. Moreover, EGCG is a well-known example of an inhibitor of APP processing [62]. EGCG has been shown to dose-dependently increase the ratio of mature ADAM10 (mADAM10) to pro-ADAM10 in vitro, which correlates with a switch to non-amyloidogenic processing and reduced Aβ production [63]. The finding that EGCG enhances non-amyloidogenic APP processing was confirmed in vivo in several different mouse models of AD [64]. The administration of EGCG has been shown to reduce both soluble and insoluble Aβ levels by promoting α-secretase activity while simultaneously downregulating β- and γ-secretase activities [65]. Another instance involves baicalein, a flavone that promotes the non-amyloidogenic cleavage of APP and concurrently inhibits amyloidogenic cleavage through a pathway dependent on GABAA receptors [66].
Several studies have suggested that the inclusion of an O-quinone moiety in flavonoids or phenolic compounds containing catechol could facilitate the formation of covalent adducts with Aβ [67]. This interaction may play a crucial role in reducing Aβ aggregation [68]. Moreover, research has indicated that the hydroxyl groups and phenolic rings present in flavonoids play a critical role in their non-covalent interactions with β-sheet structures, which are characteristic of amyloid proteins [69]. For instance, investigations into quercetin have specifically highlighted its ability to potentially hinder Aβ aggregation by engaging in hydrophobic interactions and hydrogen bonding with the β-sheets that form [26].
Oxidative stress is a common pathological feature observed in AD [70], and the antioxidant properties of flavonoids are credited for their neuroprotective effects [71]. Oxidative stress diminishes α-secretase activity and promotes the activation of redox-sensitive cell signaling pathways, such as c-Jun N-terminal kinase, thereby increasing the expression of β- and γ-secretase [72]. Consequently, flavonoids may mitigate the detrimental effects of oxidative stress during the progression of AD [73]. Moreover, flavonoids are recognized for their ability to inhibit AChE and BChE, with their effectiveness influenced by the number and position of hydroxyl groups in the phenyl ring [74]. Therefore, the presence of a high concentration of flavonoids in APE suggests potential benefits in treating or preventing AD via multiple mechanisms of action.
To overcome the limitations of the in vitro experiments in this study, additional in vivo animal studies and potential variability in the composition of botanical extracts should be investigated in the future. In addition, a requirement for high doses of the extract to achieve beneficial effects could cause toxicity and limit the use of the extract. Therefore, the optimal extraction method should be developed before in vivo animal studies.
5. Conclusions
In this study, Agrimonia pilosa LEDEB. and its EA fraction significantly reduced the production of sAPPβ and the levels of β-secretase in APP-CHO cells, while APE and its EA fraction inhibited Aβ aggregation and promoted the disaggregation of Aβ aggregates. Eleven flavonoids were isolated and identified. All the compounds significantly reduced Aβ production by decreasing the levels of β-secretase and γ-secretase. Especially, (-)-epiafzelechin 5-O-β-D-glucopyranoside (4) was the most effective in terms of the reduction in Aβ and β-secretase, and (2S, 3S)-dihydrokaempferol 3-O-β-D-glucopyranoside (3) and (-)-epiafzelechin 5-O-β-D-glucopyranoside (4) significantly decreased the levels of γ-secretase compared to those in the DMSO-treated control group. Moreover, epi-catechin (1), catechin (2), (-)-epiafzelechin 5-O-β-D-glucopyranoside (4), quercetin 3-O-β-D-glucopyranoside (8), and luteolin 7-O-β-D-glucopyranoside (10) significantly reduced Aβ aggregation in a dose-dependent manner and promoted the disaggregation of pre-formed Aβ aggregates. These results suggest that APE and its active constituents efficiently blocked one of the major pathologic hallmarks in AD. Therefore, APE and its active constituents might have the potential to be developed as therapeutics and preventatives of AD.
Supplementary Materials
The following supporting information can be downloaded at https://www.mdpi.com/article/10.3390/separations11080243/s1. Figure S1: Effect of A. pilosa extract on the viability of APP-CHO cells. Figure S2: Effect of the solvent-partitioned fractions on the viability of APP-CHO cells. Figure S3: 13C NMR spectrum of compound 1 (400 MHz, DMSO-d6). Figurs S4: 1H NMR spectrum of compound 1 (100 MHz, DMSO-d6). Figure S5: 13C NMR spectrum of compound 2 (400 MHz, DMSO-d6). Figure S6: 1H NMR spectrum of compound 2 (100 MHz, DMSO-d6). Figure S7: 13C NMR spectrum of compound 3 (400 MHz, DMSO-d6). Figure S8: 1H NMR spectrum of compound 3 (100 MHz, DMSO-d6). Figure S9: 13C NMR spectrum of compound 4 (400 MHz, DMSO-d6). Figure S10: 1H NMR spectrum of compound 4 (100 MHz, DMSO-d6). Figure S11: 13C NMR spectrum of compound 5 (400 MHz, DMSO-d6). Figure S12: 1H NMR spectrum of compound 5 (100 MHz, DMSO-d6). Figure S13: 13C NMR spectrum of compound 6 (400 MHz, DMSO-d6). Figure S14: 1H NMR spectrum of compound 6 (100 MHz, DMSO-d6). Figure S15: 13C NMR spectrum of compound 7 (400 MHz, MeOH-d4). Figure S16: 1H NMR spectrum of compound 7 (100 MHz, MeOH-d4). Figure S17: 13C NMR spectrum of compound 8 (400 MHz, MeOH-d4). Figure S18: 1H NMR spectrum of compound 8 (100 MHz, MeOH-d4). Figure S19: 13C NMR spectrum of compound 9 (400 MHz, DMSO-d6). Figure S20: 1H NMR spectrum of compound 9 (100 MHz, DMSO-d6). Figure S21: 13C NMR spectrum of compound 10 (400 MHz, DMSO-d6). Figure S22: 1H NMR spectrum of compound 10 (100 MHz, DMSO-d6). Figure S23: 13C NMR spectrum of compound 11 (400 MHz, DMSO-d6). Figure S24: 1H NMR spectrum of compound 11 (100 MHz, DMSO-d6). Figure S25: Effect of compounds isolated from A. pilosa on the viability of APP-CHO cells.
Author Contributions
Conceptualization, S.-Y.P. and K.W.H.; methodology, C.H.L.; software, M.S.K.; validation, C.H.L., M.S.K. and Y.S.K.; formal analysis, C.H.L.; investigation, C.H.L.; resources, S.-Y.P.; data curation, M.S.K.; writing—original draft preparation, S.-Y.P. and K.W.H.; writing—review and editing, K.W.H.; visualization, Y.S.K.; supervision, S.-Y.P.; project administration, K.W.H.; funding acquisition, S.-Y.P. All authors have read and agreed to the published version of the manuscript.
Funding
This research was funded by the National Research Foundation of Korea (NRF) grant funded by the Korean government (MSIT) (No. RS-2024-00344498).
Data Availability Statement
The original contributions presented in the study are included in the article/Supplementary Material, further inquiries can be directed to the corresponding author.
Acknowledgments
The authors thank the Center for Bio-Medical Engineering Core Facility at Dankook University for NMR experiments.
Conflicts of Interest
The authors declare no conflicts of interest.
References
- Alzheimer, A. Über eine eigenartige Erkrankung der Hirnrinde. Allg. Z. Psychiatr. Psych. Gerichtl. Med. 1907, 64, 146–168. [Google Scholar]
- Guzman-Martinez, L.; Calfío, C.; Farias, G.A.; Vilches, C.; Prieto, R.; Maccioni, R.B. New frontiers in the prevention, diagnosis, and treatment of Alzheimer’s disease. J. Alzheimers Dis. 2021, 82, 51–63. [Google Scholar] [CrossRef] [PubMed]
- Tiwari, S.; Atluri, V.; Kaushik, A.; Yndart, A.; Nair, M. Alzheimer’s disease: Pathogenesis, diagnostics, and therapeutics. Int. J. Nanomed. 2019, 19, 5541–5554. [Google Scholar] [CrossRef] [PubMed]
- Mueller, K.D.; Hermann, B.; Mecollari, J.; Turkstra, L.S. Connected speech and language in mild cognitive impairment and Alzheimer’s disease: A review of picture description tasks. J. Clin. Exp. Neuropsychol. 2018, 40, 917–939. [Google Scholar] [CrossRef]
- Yu, T.-W.; Lane, H.-Y.; Lin, C.-H. Novel therapeutic approaches for Alzheimer’s disease: An updated review. Int. J. Mol. Sci. 2021, 22, 8208. [Google Scholar] [CrossRef]
- Kumar, A.; Singh, A.; Ekavali. A review on Alzheimer’s disease pathophysiology and its management: An update. Pharmacol. Rep. 2015, 67, 195–203. [Google Scholar] [CrossRef]
- Hardy, J.A.; Higgins, G.A. Alzheimer’s disease: The amyloid cascade hypothesis. Science. 1992, 256, 184–185. [Google Scholar] [CrossRef] [PubMed]
- Chow, V.W.; Mattson, M.P.; Wong, P.C.; Gleichmann, M. An overview of APP processing enzymes and products. Neuromolecular Med. 2010, 12, 1–12. [Google Scholar] [CrossRef]
- Braak, H.; Braak, E. Staging of Alzheimer’s disease-related neurofibrillary changes. Neurobiol. Aging 1995, 16, 271–278. [Google Scholar] [CrossRef]
- Varadarajan, S.; Yatin, S.; Aksenova, M.; Butterfield, D.A. Review: Alzheimer’s amyloid beta-peptide-associated free radical oxidative stress and neurotoxicity. J. Struct. Biol. 2000, 130, 184–208. [Google Scholar] [CrossRef]
- Mucke, L. Neuroscience: Alzheimer’s disease. Nature 2009, 461, 895–897. [Google Scholar] [CrossRef] [PubMed]
- Jin, T.; Chi, L.; Ma, C. Agrimonia pilosa: A phytochemical and pharmacological review. Evid. Based Complement. Altern. Med. 2022, 2022, 3742208. [Google Scholar] [CrossRef] [PubMed]
- Wen, S.; Zhang, X.; Wu, Y.; Yu, S.; Zhang, W.; Liu, D.; Yang, K.; Sun, J. Agrimonia pilosa Ledeb.: A review of its traditional uses, botany, phytochemistry, pharmacology, and toxicology. Heliyon 2022, 8, e09972. [Google Scholar] [CrossRef] [PubMed]
- Hsu, M.F.; Young, J.H.; Wang, J.P.; Teng, C.M. Effect of hsien-ho-t’sao (Agrimonia pilosa) on experimental thrombosis in mice. Am. J. Chin. Med. 1987, 15, 43–51. [Google Scholar] [CrossRef]
- Zhu, L.; Tan, J.; Wang, B.; He, R.; Liu, Y.; Zheng, C. Antioxidant activities of aqueous extract from Agrimonia pilosa Ledeb. and its fractions. Chem. Biodivers. 2009, 10, 1716–1726. [Google Scholar] [CrossRef] [PubMed]
- Koshiura, R.; Miyamoto, K.; Ikeya, Y.; Taguchi, H. Antitumor activity of methanol extract from roots of Agrimonia pilosa Ledeb. Jpn. J. Pharmacol. 1985, 38, 9–16. [Google Scholar] [CrossRef] [PubMed]
- Shin, W.-J.; Lee, K.-H.; Park, M.-H.; Seong, B.-L. Broad-spectrum antiviral effect of Agrimonia pilosa extract on influenza viruses. Microbiol. Immunol. 2010, 54, 11–19. [Google Scholar] [CrossRef] [PubMed]
- Yamaki, M.; Kashihara, M.; Ishiguro, K.; Takagi, S. Antimicrobial Principles of Xian he cao (Agrimonia pilosa). Planta. Med. 1989, 55, 169–170. [Google Scholar] [CrossRef]
- Jung, C.H.; Zhou, S.; Ding, G.X.; Kim, J.H.; Hong, M.H.; Shin, Y.-C.; Kim, G.J.; Ko, S.-G. Antihyperglycemic activity of herb extracts on streptozotocin-induced diabetic rats. Biosci. Biotechnol. Biochem. 2006, 10, 2556–2559. [Google Scholar] [CrossRef]
- Jung, C.H.; Kim, J.-H.; Park, S.J.; Kweon, D.-H.; Kim, S.-H.; Ko, S.-G. Inhibitory effect of Agrimonia pilosa Ledeb. on inflammation by suppression of iNOS and ROS production. Immunol. Investig. 2010, 39, 159–170. [Google Scholar] [CrossRef]
- Zhu, L.; Chen, J.; Tan, J.; Liu, X.; Wang, B. Flavonoid from Agrimonia pilosa Ledeb: Free radical scavenging and DNA oxidative damage protection activities and analysis of bioactivity-structure relationship based on molecular and electronic structures. Molecules 2017, 22, 195. [Google Scholar] [CrossRef] [PubMed]
- Kubínová, R.; Švajdlenka, E.; Jankovská, D. Anticholinesterase, antioxidant activity and phytochemical investigation into aqueous extracts from five species of Agrimonia genus. Nat. Prod. Res. 2016, 30, 1174–1177. [Google Scholar] [CrossRef] [PubMed]
- Jung, M.; Park, M. Acetylcholinesterase inhibition by flavonoids from Agrimonia pilosa. Molecules 2007, 12, 2130–2139. [Google Scholar] [CrossRef] [PubMed]
- Kim, H.W.; Park, J.; Kang, K.B.; Kim, T.B.; Oh, W.K.; Kim, J.; Sung, S.H. Acylphloroglucinolated catechin and phenylethyl isocoumarin derivatives from Agrimonia pilosa. J. Nat. Prod. 2016, 79, 2376–2383. [Google Scholar] [CrossRef] [PubMed]
- Kim, J.-M.; Hwang, K.W.; Joo, H.-B.; Park, S.-Y. Anti-amyloidogenic properties of Dryopteris crassirhizoma roots in Alzheimer’s disease cellular model. J. Food. Biochem. 2015, 39, 478–484. [Google Scholar] [CrossRef]
- Alghamdi, A.; Birch, D.J.S.; Vyshemirsky, V.; Rolinski, O.J. Impact of the flavonoid quercetin on β-amyloid aggregation revealed by intrinsic fluorescence. J. Phys. Chem. B 2022, 126, 7229–7237. [Google Scholar] [CrossRef]
- El-Razek, M.A. NMR assignments of four catechin epimers. Asian J. Chem. 2007, 19, 4867–4872. [Google Scholar]
- Donovan, J.L.; Crespy, V.; Oliveira, M.; Cooper, K.A.; Gibson, B.B.; Williamson, G. (+)-Catechin is more bioavailable than (−)-cathchin: Relevance to the bioavailability of catechin from cocoa. Free Radic. Res. 2006, 7, 1029–1034. [Google Scholar] [CrossRef]
- Kang, J.; Xie, C.; Li, Z.; Nagarajan, S.; Schauss, A.G.; Wu, T.; Wu, X. Flavonoids from acai (Euterpe oleracea Mart.) pulp and their antioxidant and anti-inflammatory activities. Food Chem. 2011, 128, 152–157. [Google Scholar] [CrossRef]
- Sethi, V.K.; Taneja, S.C.; Dhar, K.L.; Atal, C.K. (-)-Epiafzelechin 5-O-β-D-glucoside from Crataeva religiosa. Phytochemistry 1984, 23, 2402–2403. [Google Scholar] [CrossRef]
- Duong, P.Q.; Duyen, N.T.; Quyen, P.T.; Tung, N.Q.; Son, V.H.; Hung, V.D.; Quang, L.D. Isolation and identification of phenolic compounds from the leaf extract of Cassia alata L. Vietnam J. Chem. 2017, 55, 589–594. [Google Scholar]
- Peng, H.-Y.; Zhang, X.-H.; Xu, J.-Z. Apigenin-7-O-β-D-glycoside isolation from the highly copper-tolerant plant Elsholtzia splendens. J. Zhejiang Univ. Sci. B 2016, 17, 447–454. [Google Scholar] [CrossRef] [PubMed]
- Markham, K.R.; Webby, R.F.; Vilain, C. 7-O-methyl-(2R:3R)-dihydroquercetin 5-O-β-D-glycoside and other flavonoids from Podocarpus nivalis. Phytochemistry 1984, 23, 2049–2052. [Google Scholar] [CrossRef]
- Islam, M.; Al-Amin, M.; Mahboob, M.; Siddiqi, A.; Akter, S.; Haque, M.M.; Sultana, N.; Chowdhury, A.M.S. Isolation of quercetin-3-o-beta-d-glucopyranoside from the leaves of Azadirachta indica and antimicrobial and cytotoxic screening of the crude extracts. Dhaka Univ. J. Sci. 2012, 60, 11–14. [Google Scholar] [CrossRef]
- Sakushima, A.; Ohno, K.; Coskun, M.; Seki, K.-I.; Ohkura, K. Separation and identification of taxifolin 3-O-glucoside isomers from Chamaecyparis obtuse (Cupressaceae). Nat. Prod. Lett. 2002, 16, 383–387. [Google Scholar] [CrossRef] [PubMed]
- Lin, L.-C.; Pai, Y.-F.; Tsai, T.-H. Isolation of luteolin-7-O-glucoside from Dendranthema morifolium Ramat Tzvel and their pharmacokinetics in rats. J. Agric. Food Chem. 2015, 63, 7700–7706. [Google Scholar] [CrossRef] [PubMed]
- Lin, J.-H.; Lin, Y.-T.; Huang, Y.-J.; Wen, K.-C.; Chem, R.-M.; Ueng, T.-H.; Liao, C.-H. Isolation and cytotoxicity of flavonoids from Daphnis genkwae Flos. J. Food Drug Anal. 2001, 9, 6–11. [Google Scholar] [CrossRef]
- Cai, Z.; Zhou, Y.; Liu, Z.; Ke, Z.; Zhao, B. Autophagy dysfunction upregulates beta-amyloid peptides via enhancing the activity of γ-secretase complex. Neuropsychiatr. Dis. Treat. 2015, 11, 2091–2099. [Google Scholar] [CrossRef]
- Madhu, P.; Mukhopadhyay, S. Distinct types of amyloid-β oligomers displaying diverse neurotoxicity mechanisms in Alzheimer’s disease. J. Cell Biochem. 2021, 122, 1594–1608. [Google Scholar] [CrossRef]
- Chauhan, A.; Chauhan, V. Beneficial effects of walnuts on cognition and brain health. Nutrients 2020, 12, 550. [Google Scholar] [CrossRef]
- Thakur, S.; Dhapola, R.; Medhi, B.; Reddy, D.H. Neuroinflammation in Alzheimer’s disease: Current progress in molecular signaling and therapeutics. Inflammation 2023, 46, 1–17. [Google Scholar] [CrossRef]
- Gerrits, E.; Brouwer, N.; Kooistra, S.M.; Woodbury, M.E.; Vermeiren, Y.; Lambourne, M.; Mulder, J.; Kummer, M.; Möller, T.; Biber, K.; et al. Distinct amyloid-β and tau-associated microglia profiles in Alzheimer’s disease. Acta Neuropathol. 2021, 141, 681–696. [Google Scholar] [CrossRef] [PubMed]
- Liu, H.X.; Liu, Z.X.; Jiang, Q.H.; Ding, L.Q.; Chen, L.X.; Qiu, F. Phenolic constituents of whole plant of Agrimonia pilosa Ledeb. J. China Pharm. Univ. 2010, 4, 286–289. [Google Scholar]
- Seo, U.M.; Nguyen, D.H.; Zhao, B.T.; Min, B.S.; Woo, M.H. Flavanonol glucoside from the aerial parts of Agrimonia pilosa Ledeb. and their acetylcholinesterase inhibitory effects. Carbohydr. Res. 2017, 445, 75–79. [Google Scholar] [CrossRef] [PubMed]
- Kato, H.; Li, W.; Koike, M.; Wang, Y.; Koike, K. Phenolic glycosides from Agrimonia pilosa. Phytochemistry 2010, 71, 1925–1929. [Google Scholar] [CrossRef]
- Liu, W.J.; Liang, J.Y.; Sun, J.B.; Feng, F. Research progress of the Agrimonia pilosa Ledeb. on the chemical constituents and aharmacological activity. Strait Pharm. J. 2016, 2, 1–7. [Google Scholar]
- Nguyen, D.H.; Seo, U.M.; Zhao, B.T.; Le, D.D.; Seong, S.H.; Choi, J.S.; Min, B.S.; Woo, M.H. Ellagitannin and flavonoid constituents from Agrimonia pilosa Ledeb. with their protein tyrosine phosphatase and acetylcholinesterase inhibitory activities. Bioorg. Chem. 2017, 72, 293–300. [Google Scholar] [CrossRef] [PubMed]
- Li, X.; Ye, M.; Yu, X.; He, W.; Li, R. Studies on chemical constituents of Agrimonia pilosa L. J. Beijing Med. Univ. 1995, 27, 60. [Google Scholar]
- Lu, F.; Ba, X.; He, Z. Chemical constituents of Agrimonia herba. Chin. Tradit. Herb. Drugs 2012, 5, 851–855. [Google Scholar]
- Heo, H.J.; Lee, C.Y. Epicatechin and catechin in Cocoa inhibit amyloid β protein induced apopotosis. J. Agric. Food Chem. 2005, 53, 1445–1448. [Google Scholar] [CrossRef]
- Graham, H.N. Green tea composition, consumption, and polyphenol chemistry. Prev. Med. 1992, 21, 334–350. [Google Scholar] [CrossRef] [PubMed]
- Sureram, S.; Chutiwitoonchai, N.; Pooprasert, T.; Sangsopha, W.; Limjiasahapong, S.; Jariyasopit, N.; Sirivatanauksorn, Y.; Khoomrung, S.; Mahidol, C.; Ruchirawat, S.; et al. Discovery of procyanidin condensed tannins of (-)-epicatechin from kratom, mitragyna speciosa, as virucidal agents against SARS-CoV-2. Int. J. Biol. Macromol. 2024, 273, 133059. [Google Scholar] [CrossRef]
- Lim, H.J.; Prajapati, R.; Seong, S.H.; Jung, H.A.; Choi, J.S. Antioxidant and antineuroinflammatory mechanisms of kaempferol-3-O-β-glucuronate on lipopolysaccharide-stimulated BV2 microglial cells through the Nrf2/HO-1 signaling cascade and MAPK/NF-κB pathway. ACS Omega 2023, 8, 6538–6549. [Google Scholar] [CrossRef] [PubMed]
- Istifli, E.S.; Sarikurkcu, C. Assessment of apigenin-7-glucoside and luteolin-7-glucoside as multi-targeted agents against Alzheimer’s disease: A molecular docking study. Int. J. Plant Bas. Pharm. 2021, 1, 56–64. [Google Scholar] [CrossRef]
- Kim, J.H.; Lee, J.M.; Lee, S.H.; Cho, E.J. Quercetin and quercetin-3-β-D-glucoside improve cognitive and memory function in Alzheimer’s disease mouse. Appl. Biol. Chem. 2016, 59, 721–728. [Google Scholar] [CrossRef]
- Ullah, A.; Munir, S.; Badshah, S.L.; Khan, N.; Ghani, L.; Poulson, B.G.; Emwas, A.-H.; Jaremko, M. Important flavonoids and their role as a therapeutic agent. Molecules 2020, 25, 5243. [Google Scholar] [CrossRef]
- Calderaro, A.; Patanè, G.T.; Tellone, E.; Barreca, D.; Ficarra, S.; Misiti, F.; Laganà, G. The neuroprotective potentiality of flavonoids on Alzheimer’s disease. Int. J. Mol. Sci. 2022, 23, 14835. [Google Scholar] [CrossRef] [PubMed]
- Kong, Y.; Li, K.; Fu, T.; Wan, C.; Zhang, D.; Song, H.; Zhang, Y.; Liu, N.; Gan, Z.; Yuan, L. Quercetin ameliorates Aβ model by modulating cell cycle-related protein expression. Oncotarget 2016, 7, 67716–67731. [Google Scholar] [CrossRef]
- Youn, K.; Ho, C.-T.; Jun, M. Multifaceted neuroprotective effects of (-)-epigallocatechin-3-gallate (EGCG) in Alzheimer’s disease. An overview of pre-clinical studies focused on β-amyloid peptide. Food Sci. Hum. Wellness 2022, 11, 483–493. [Google Scholar] [CrossRef]
- Martín-Aragón, S.; Jiménez-Aliaga, K.L.; Benedí, J.; Bermejo-Bescós, P. Neurohormetic responses of quercetin and rutin in a cell line over-expressing the amyloid precursor protein (APPswe cells). Phytomedicine 2016, 23, 1285–1294. [Google Scholar] [CrossRef]
- Cox, C.J.; Choudhry, F.; Peacey, E.; Perkinton, M.S.; Richardson, J.C.; Howlett, D.R.; Lichtenthaler, S.F.; Francis, P.T.; Williams, R.J. Dietary (-)-epicatechin as a potent inhibitor of βγ-secretase amyloid precursor protein processing. Neurobiol. Aging 2015, 36, 178–187. [Google Scholar] [CrossRef]
- Lin, C.-L.; Chen, T.-F.; Chiu, M.-J.; Way, T.-D.; Lin, J.-K. Epigallocatechin gallate (EGCG) suppresses beta-amyloid-induced neurotoxicity through inhibiting c-Abl/FE65 nuclear translocation and GSK3 beta activation. Neurobiol. Aging 2009, 30, 81–92. [Google Scholar] [CrossRef] [PubMed]
- Fernandez, J.W.; Rezai-Zadeh, K.; Obergon, D.; Tan, J. EGCG functions through estrogen receptor-mediated activation of ADAM10 in the promotion of non-amyloidogenic processing of APP. FEBS Lett. 2010, 584, 4259–4267. [Google Scholar] [CrossRef] [PubMed]
- Mori, T.; Koyama, N.; Tan, J.; Segawa, T.; Maeda, M.; Town, T. Combined treatment with the phenolics (-)-epigallocatechin-3-gallate and ferulic acid improves cognition and reduces Alzheimer-like pathology in mice. J. Biol. Chem. 2019, 294, 2714–2731. [Google Scholar] [CrossRef]
- Lee, J.W.; Lee, Y.K.; Ban, J.O.; Ha, T.Y.; Yun, Y.P.; Han, S.B.; Oh, K.W.; Hong, J.T. Green tea (-)-epigallocatechin-3-gallate inhibits beta-amyloid-induced cognitive dysfunction through modification of secretase activity via inhibition of ERK and NF-kappaB pathways in mice. J. Nutr. 2009, 139, 1987–1993. [Google Scholar] [CrossRef]
- Zhang, S.-Q.; Obregon, D.; Ehrhart, J.; Deng, J.; Tian, J.; Hou, H.; Giunta, B.; Sawmiller, D.; Tan, J. Baicalein reduces β-amyloid and promotes nonamyloidogenic amyloid precursor protein processing in an Alzheimer’s disease transgenic mouse model. J. Neurosci. Res. 2013, 91, 1239–1246. [Google Scholar] [CrossRef]
- Sato, M.; Murakami, K.; Uno, M.; Nakagawa, Y.; Katayama, S.; Akagi, K.-I.; Masuda, Y.; Takegoshi, K.; Irie, K. Site-specific inhibitory mechanism for amyloid β42 aggregation by catechol-type flavonoids targeting the Lys residues. J. Biol. Chem. 2013, 288, 23212–23224. [Google Scholar] [CrossRef] [PubMed]
- Velander, P.; Wu, L.; Hildreth, S.B.; Vogelaar, N.J.; Mukhopadhyay, B.; Helm, R.F.; Zhang, S.; Xu, B. Catechol-containing compounds are a broad class of protein aggregation inhibitors: Redox state is a key determinant of the inhibitory activites. Pharmacol. Res. 2022, 184, 106409. [Google Scholar] [CrossRef]
- Gargari, S.A.; Barzegar, A.; Tarinejad, A. The role of phenolic OH groups of flavonoid compounds with H-bond formation ability to suppress amyloid mature fibrils by destabilizing β-sheet comformation of monomeric Aβ17-42. PLoS ONE 2018, 13, e0199541. [Google Scholar]
- Bai, R.; Guo, J.; Ye, X.-Y.; Xie, Y.; Xie, T. Oxidative stress: The core pathogenesis and mechanism of Alzheimer’s disease. Ageing Res. Rev. 2022, 77, 101619. [Google Scholar] [CrossRef]
- Shen, N.; Wang, T.; Gan, Q.; Liu, S.; Wang, L.; Jin, B. Plant flavonoids: Classification, distribution, biosysthesis, and antioxidant activity. Food Chem. 2022, 383, 132531. [Google Scholar] [CrossRef] [PubMed]
- Zhao, Y.; Zhao, B. Oxidative stress and the pathogenesis of Alzheimer’s disease. Oxid. Med. Cell. Longev. 2013, 2013, 316523. [Google Scholar] [CrossRef] [PubMed]
- Hole, K.L.; Williams, R.J. Flavonoids as an intervention for Alzheimer’s disease: Progress and hurdles towards defining a mechasism of action. Brain Plast. 2020, 6, 167–192. [Google Scholar] [CrossRef] [PubMed]
- Katalinić, M.; Rusak, G.; Barović, J.D.; Sinko, G.; Jelić, D.; Antolović, R.; Kovarik, Z. Structural aspects of flavonoids as inhibitors of human butyrylcholinesterase. Eur. J. Med. Chem. 2010, 45, 186–192. [Google Scholar] [CrossRef] [PubMed]


Disclaimer/Publisher’s Note: The statements, opinions and data contained in all publications are solely those of the individual author(s) and contributor(s) and not of MDPI and/or the editor(s). MDPI and/or the editor(s) disclaim responsibility for any injury to people or property resulting from any ideas, methods, instructions or products referred to in the content. |
© 2024 by the authors. Licensee MDPI, Basel, Switzerland. This article is an open access article distributed under the terms and conditions of the Creative Commons Attribution (CC BY) license (https://creativecommons.org/licenses/by/4.0/).