Article

Experimental Study on Vehicle Pressure Swing Adsorption Oxygen Production Process Based on Response Surface Methodology

1
School of Energy and Environmental Engineering, University of Science and Technology Beijing, Beijing 100083, China
2
Songshan Lake Materials Laboratory, Dongguan 523830, China
3
China Railway 20th Bureau Group Co., Ltd., Xi’an 710016, China
4
Key Laboratory of Plateau Oxygen and Living Environment of Tibet Autonomous Region, College of Science, Tibet University, Lhasa 850001, China
*
Authors to whom correspondence should be addressed.
Separations 2024, 11(9), 267; https://doi.org/10.3390/separations11090267
Submission received: 18 July 2024 / Revised: 2 September 2024 / Accepted: 3 September 2024 / Published: 11 September 2024
(This article belongs to the Special Issue Recent Advances in Gas Separation and Purification)

Abstract

:
In recent years, the number of people driving from plain areas to the western plateau of China has been increasing, and their safety is threatened by acute high-altitude reactions caused by hypoxia. Vehicle-mounted pressure swing adsorption oxygen supply technology can help solve this problem. For the optimization of vehicle pressure swing adsorption oxygen production, the influence of different pressure equalization methods on oxygen production efficiency was studied. The best oxygen production performance was achieved when the initial upper pressure equalization method and the simultaneous pressure equalization method were used. Using a 160 W air compressor, the product gas flow rate could reach 2.5 L/min with an oxygen concentration of 93.48%. The impact of adsorption time, equalization time, flow rate, and throttle inner diameter on oxygen concentration and recovery rate was analyzed using the response surface method. The order of the four factors affecting oxygen concentration is as follows: flow rate > adsorption time > equalization time > throttle inner diameter. After optimization, the product gas flow rate was 2.6 L/min, the oxygen concentration was 92.11%, and the oxygen recovery rate was 44.51%.

Graphical Abstract

1. Introduction

The global plateau area is vast. Countries such as Lesotho, Kyrgyzstan, Tajikistan, Nepal, Bhutan, etc., are plateau countries, and in addition, countries such as China, Brazil, and Australia also have large plateau areas. A plateau region is rich in mineral resources and tourism resources. The fastest way to bring direct economic benefits to people is to develop mineral resources and tourism in the plateau region. However, the thin air, atmospheric pressure, and oxygen content in the air in the plateau region are lower than those in the plain region, and people who often live in the plain region will often have symptoms of altitude sickness, such as dyspnea, when they first arrive at the plateau region, resulting in abnormal changes in the metabolism, function, and morphological structure of the human body, that is, hypoxia, with an incidence of about 40–70% [1,2]. Hypoxia not only affects people’s sleep quality, but ultimately leads to lower daytime productivity and lower cognitive function [3,4,5,6]. Hypoxia also affects the nervous system, respiratory system, circulatory system, and digestive system of the human body to varying degrees [7,8]. A few people will suffer from typhoid fever, fatigue, and upper respiratory tract infection, leading to further aggravation of symptoms, and finally developing diseases such as high altitude cerebral edema or high altitude pulmonary edema. Severe hypoxia can even lead to shock or cardiac arrest [9]. In order to protect the physical and mental health of plateau people and further promote the development of scientific economy in the plateau area, it is the key to solving the problem of hypoxia.
The Pressure Swing Adsorption (PSA) method has been widely used in vehicle-mounted oxygen production equipment due to its advantages of fast start stop, economical price, small volume, easy adjustment of purity flow rate, and simple structure [10,11,12]. In order to meet the requirements of the vehicle, the onboard oxygen generation device must first meet the power requirements of the vehicle. Half of the vehicle’s cigarette lighters can provide a maximum power supply of 180 W.
Currently, some scholars have researched onboard oxygen production. Niu et al. [13] found that onboard oxygen production devices in high-altitude environments need to provide the human body with an oxygen concentration of no less than 50% (50% represents the volume fraction of oxygen in the mixture, and the expression of oxygen concentration is the same below). Song Lanting et al. [14] developed a high-altitude vehicle-mounted PSA oxygen generation system. The system can provide oxygen for 2–4 people simultaneously, with a maximum oxygen concentration of 94%, an oxygen flow rate of 3 L/min, and a power of 240 W. For general vehicles, the power of the onboard oxygen production device is relatively high because the power of the cigarette lighter is generally below 180 W. The vehicle-mounted membrane separation oxygen generator designed by Yan Zedong et al. [15] has an oxygen production concentration of (26.7 ± 0.8)%, an enriched oxygen flow rate of (5.4 ± 0.4) L/min, and a total power of 46 W. However, its oxygen production concentration is relatively low, and its effect on alleviating high-altitude reactions is limited.
PSA oxygen production is a multi-factor coupled process not only affected by a single factor. As an experimental design and method for multi-factor analysis, response surface methodology [16,17,18,19] is characterized by the ability to consider the impact of multiple factors on system output simultaneously. Establishing a mathematical model to accurately describe the relationship between factors and response achieves optimization and an understanding of complex systems. Lv Aihui et al. [20] used response surface methodology to analyze the two-bed small-scale PSA oxygen production process. The results showed that altitude had the most significant impact on oxygen concentration, followed by adsorption time, and the effect of pressure equalization time was the smallest. Chen et al. [21] and Zhang et al. [22] optimized the PSA hydrogen production process using response surface methodology, indirectly demonstrating the reliability of optimizing the PSA oxygen production process using response surface methodology.
This research investigates the onboard pressure swing adsorption process for oxygen production by optimizing the process parameters and the structure. Utilizing the response surface methodology, the process parameters are further optimized. The objective is to enhance the performance and efficiency of the onboard oxygen production device, thereby guiding the improvement of performance and optimizing the process of the onboard PSA oxygen production device.

2. Experimental Introduction

2.1. Nitrogen and Oxygen Separation Mechanism

The pressure swing adsorption process for oxygen takes advantage of the differential adsorption capacities of nitrogen and oxygen on the same adsorbent at varying pressures and at a specific temperature, achieving the separation of nitrogen and oxygen by adjusting the adsorption bed pressure.
The pressure swing adsorption method utilizes zeolite molecular sieve as the core material, with a strong electric field of cations on the inner pore surface. Due to the different polarizability of nitrogen and oxygen (N2: 1.74 × 10⁻²⁴ cm3/molecule, O2: 0.0101. 3 × 10⁻²⁴ cm3/molecule), the molecular sieve exhibits adsorption selectivity for these molecules by subjecting them to different forces. As pressure increases in the bed during the process, the trapping probability of nitrogen with a strong quadrupole effect also increases, leading to the selective adsorption of nitrogen and enrichment of oxygen for separation.

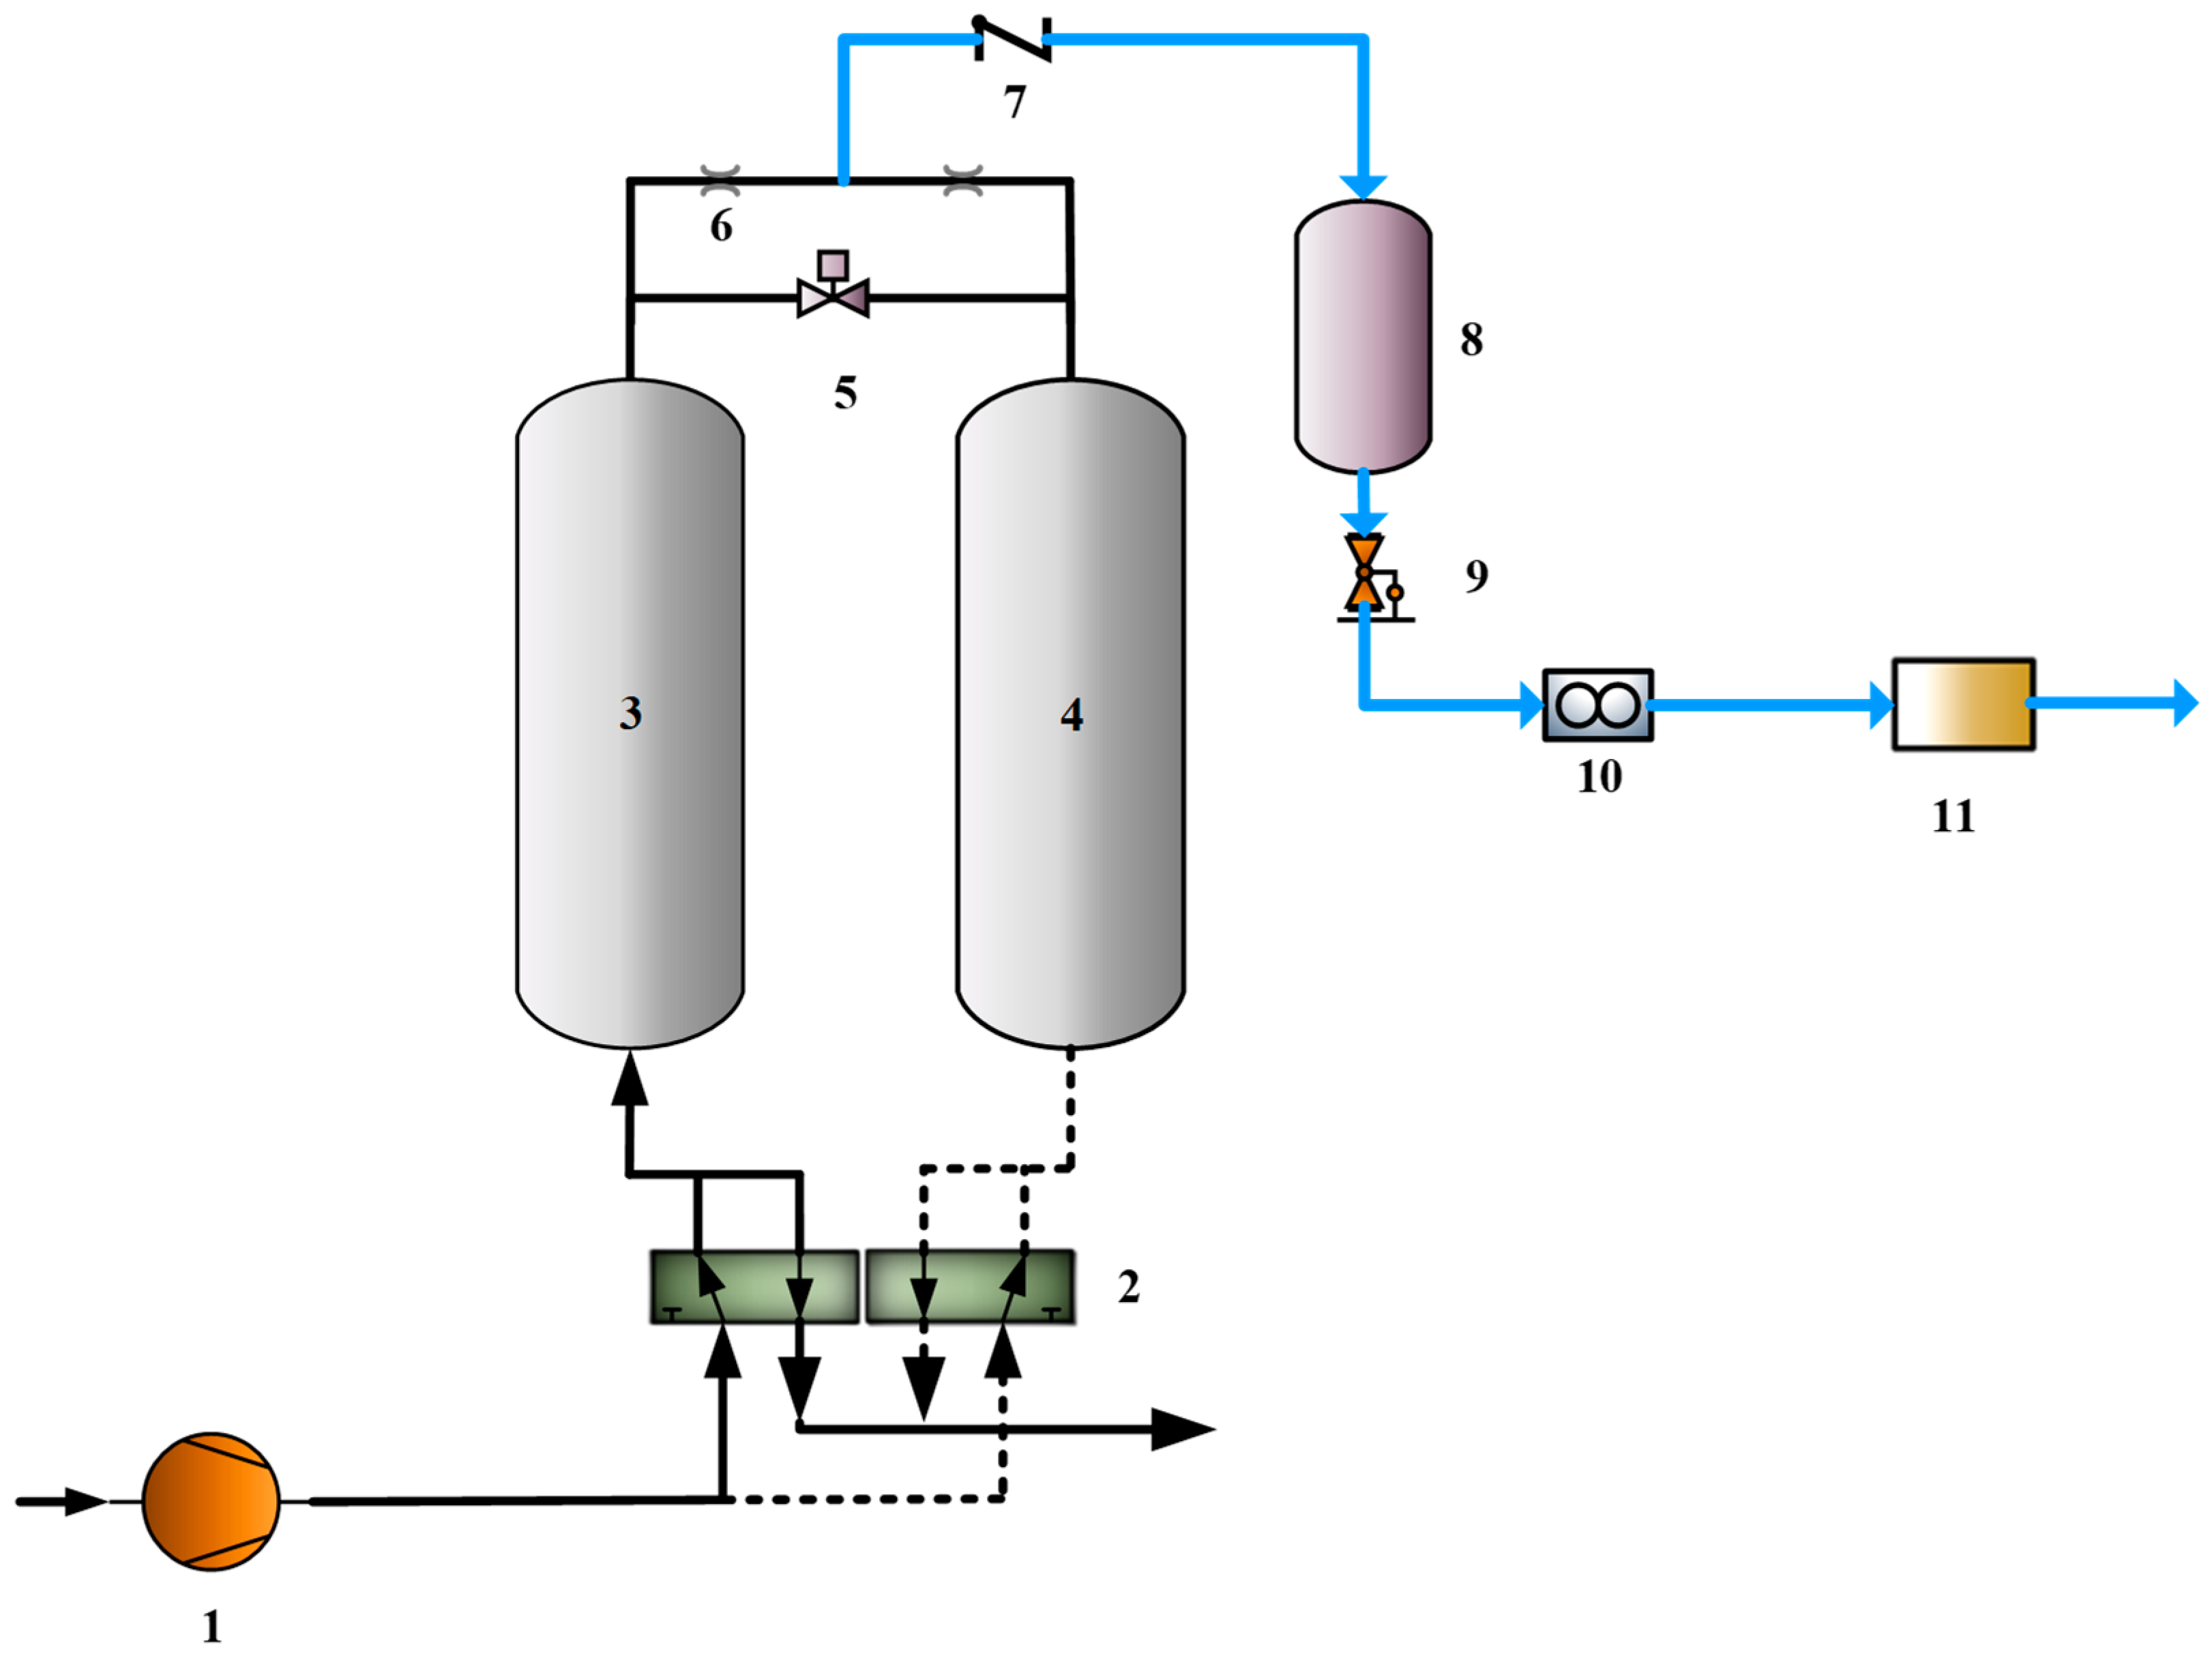
2.2. Oxygen Production Process

A vehicle-mounted PSA oxygen production device is constructed to explore the practical feasibility of the process and the changes in relevant parameters. The oxygen production unit utilizes a Li-LSX molecular sieve from Luoyang Jalon Micro-Nano New Materials Co., Ltd., Luoyang, China, achieving the separation and purification of oxygen through a cyclic process of pressurized adsorption and de-pressured desorption. The flowchart of the device is shown in Figure 1, which includes core components such as a compressor, an aluminum alloy adsorption bed, a 2-position 5-way valve, an oxygen storage tank, a flow meter, an oxygen meter, and a Programmable Logic Controller (PLC) control system. Specifically, the compressor serves as the power source for the device and provides stable airflow. The high-efficiency molecular sieve in the aluminum alloy adsorption bed utilizes its efficient adsorption performance to achieve nitrogen and oxygen separation. The combination valve controls gas path switching, ensuring smooth progress in the oxygen production process. Different equalizing methods can be selected by controlling the opening and closing of the 2-position 5-way valve and upper equalizing valve. PLC is used to control the timing of valve opening and closing.
The Cv value of the throttle, as an important parameter to measure its gas flow capacity, directly reflects the efficiency of the throttle on gas flow. Specifically, the higher the Cv value, the stronger the flow capacity of the throttle to the gas under the same conditions, and it can effectively handle the larger flow of gas. The formula for calculating Cv value is as follows:
C v = Q G ( 273 + T ) 249 P 1
where: Q—flow rate through throttles, unit Nm3/h;
G—the proportion of circulation medium and air, G = 1;
T—fluid temperature, unit of °C;
P1—absolute inlet pressure; Unit kgf/cm2 (1 kgf/cm2 = 98.07 × 10⁻³ MPa)
In this paper, all Cv values were obtained under the maximum pressure of 0.1 MPa at the front end of the throttle hole and a fluid temperature of 20 °C.
The equation of oxygen recovery is as follows:
η O 2 = Q O T C O T , O Q F C F , O
where, Q O T   —oxygen flow (L/min);
C O T , O —oxygen concentration in the product gas (%);
Q F —air intake flow rate (L/min);
C F , O —oxygen concentration in the air (%), the average is 21%.
The molecular sieve materials’ specifications utilized in the experiment are detailed in Table 1. The technical parameters of experimental instruments and equipment are shown in Table 2.
The process flow of this experimental device can be divided into five steps: pressurization, adsorption, depressurizing pressure equalization, desorption and purge, and pressurizing pressure equalization. The process flow diagram is shown in Figure 2, and the step sequence table of the PSA oxygen production device is shown in Table 3.
Step 1: The air enters the adsorption bed A for nitrogen and oxygen separation. In the adsorption bed, most of the nitrogen and a small amount of oxygen in the air are adsorbed in the adsorbent, and the remaining oxygen is gradually enriched at the top of the bed and then flows out through the pipeline. Part of which enters the oxygen storage tank as product gas, and the other part enters the adsorption bed B for purging after the flow is restricted by throttles. At the same time, the adsorption bed B is reversely vented to desorbed the bed layer.
Step 2: After completing the adsorption, the remaining high-pressure air in the bed is sent from the adsorption bed A to the adsorption bed B with relatively low pressure through the upper pressure-equalizing valve and the 2-position 5-way valve to reduce the compressor power consumption.
Step 3: Adsorption bed A reverse exhaust for desorption. In this process, the adsorption bed is controlled by a valve to communicate with the outside atmosphere, and the pressure in the bed is rapidly reduced. As the pressure decreases, the adsorption capacity of the adsorbent decreases, and the originally adsorbed nitrogen is desorbed and discharged to the atmosphere through the discharge pipe at the bottom of the bed. Compressed air is fed into adsorption bed B, where the pressure equalization process has been completed, to boost the pressure and separate the high concentration of oxygen. One part is sent to the oxygen storage tank, and the other goes to the adsorption bed A to purge the molecular sieve layer.
Step 4: After the completion of desorption and purging, the high-pressure air is sent from the adsorption bed B through the upper pressure equalizing valve and the 2-position 5-way valve back to the adsorption bed A that has completed the working cycle.
These four steps are cycled to produce a high concentration of oxygen continuously.

2.3. Multi-Factor Experimental Design Based on Response Surface Methodology

Based on single-factor experiments, response surface methodology was used to analyze the effects of different process parameters on oxygen concentration and recovery rate. The experimental factors examined were adsorption time, pressure equalization time, oxygen flow rate, and throttle inner diameter, denoted as A, B, C, and D, respectively. Each factor was assigned three coding levels, namely −1, 0, and 1. The coding values were represented as x1, x2, and x3. The experimental factors are shown in Table 4.

3. Results and Discussion

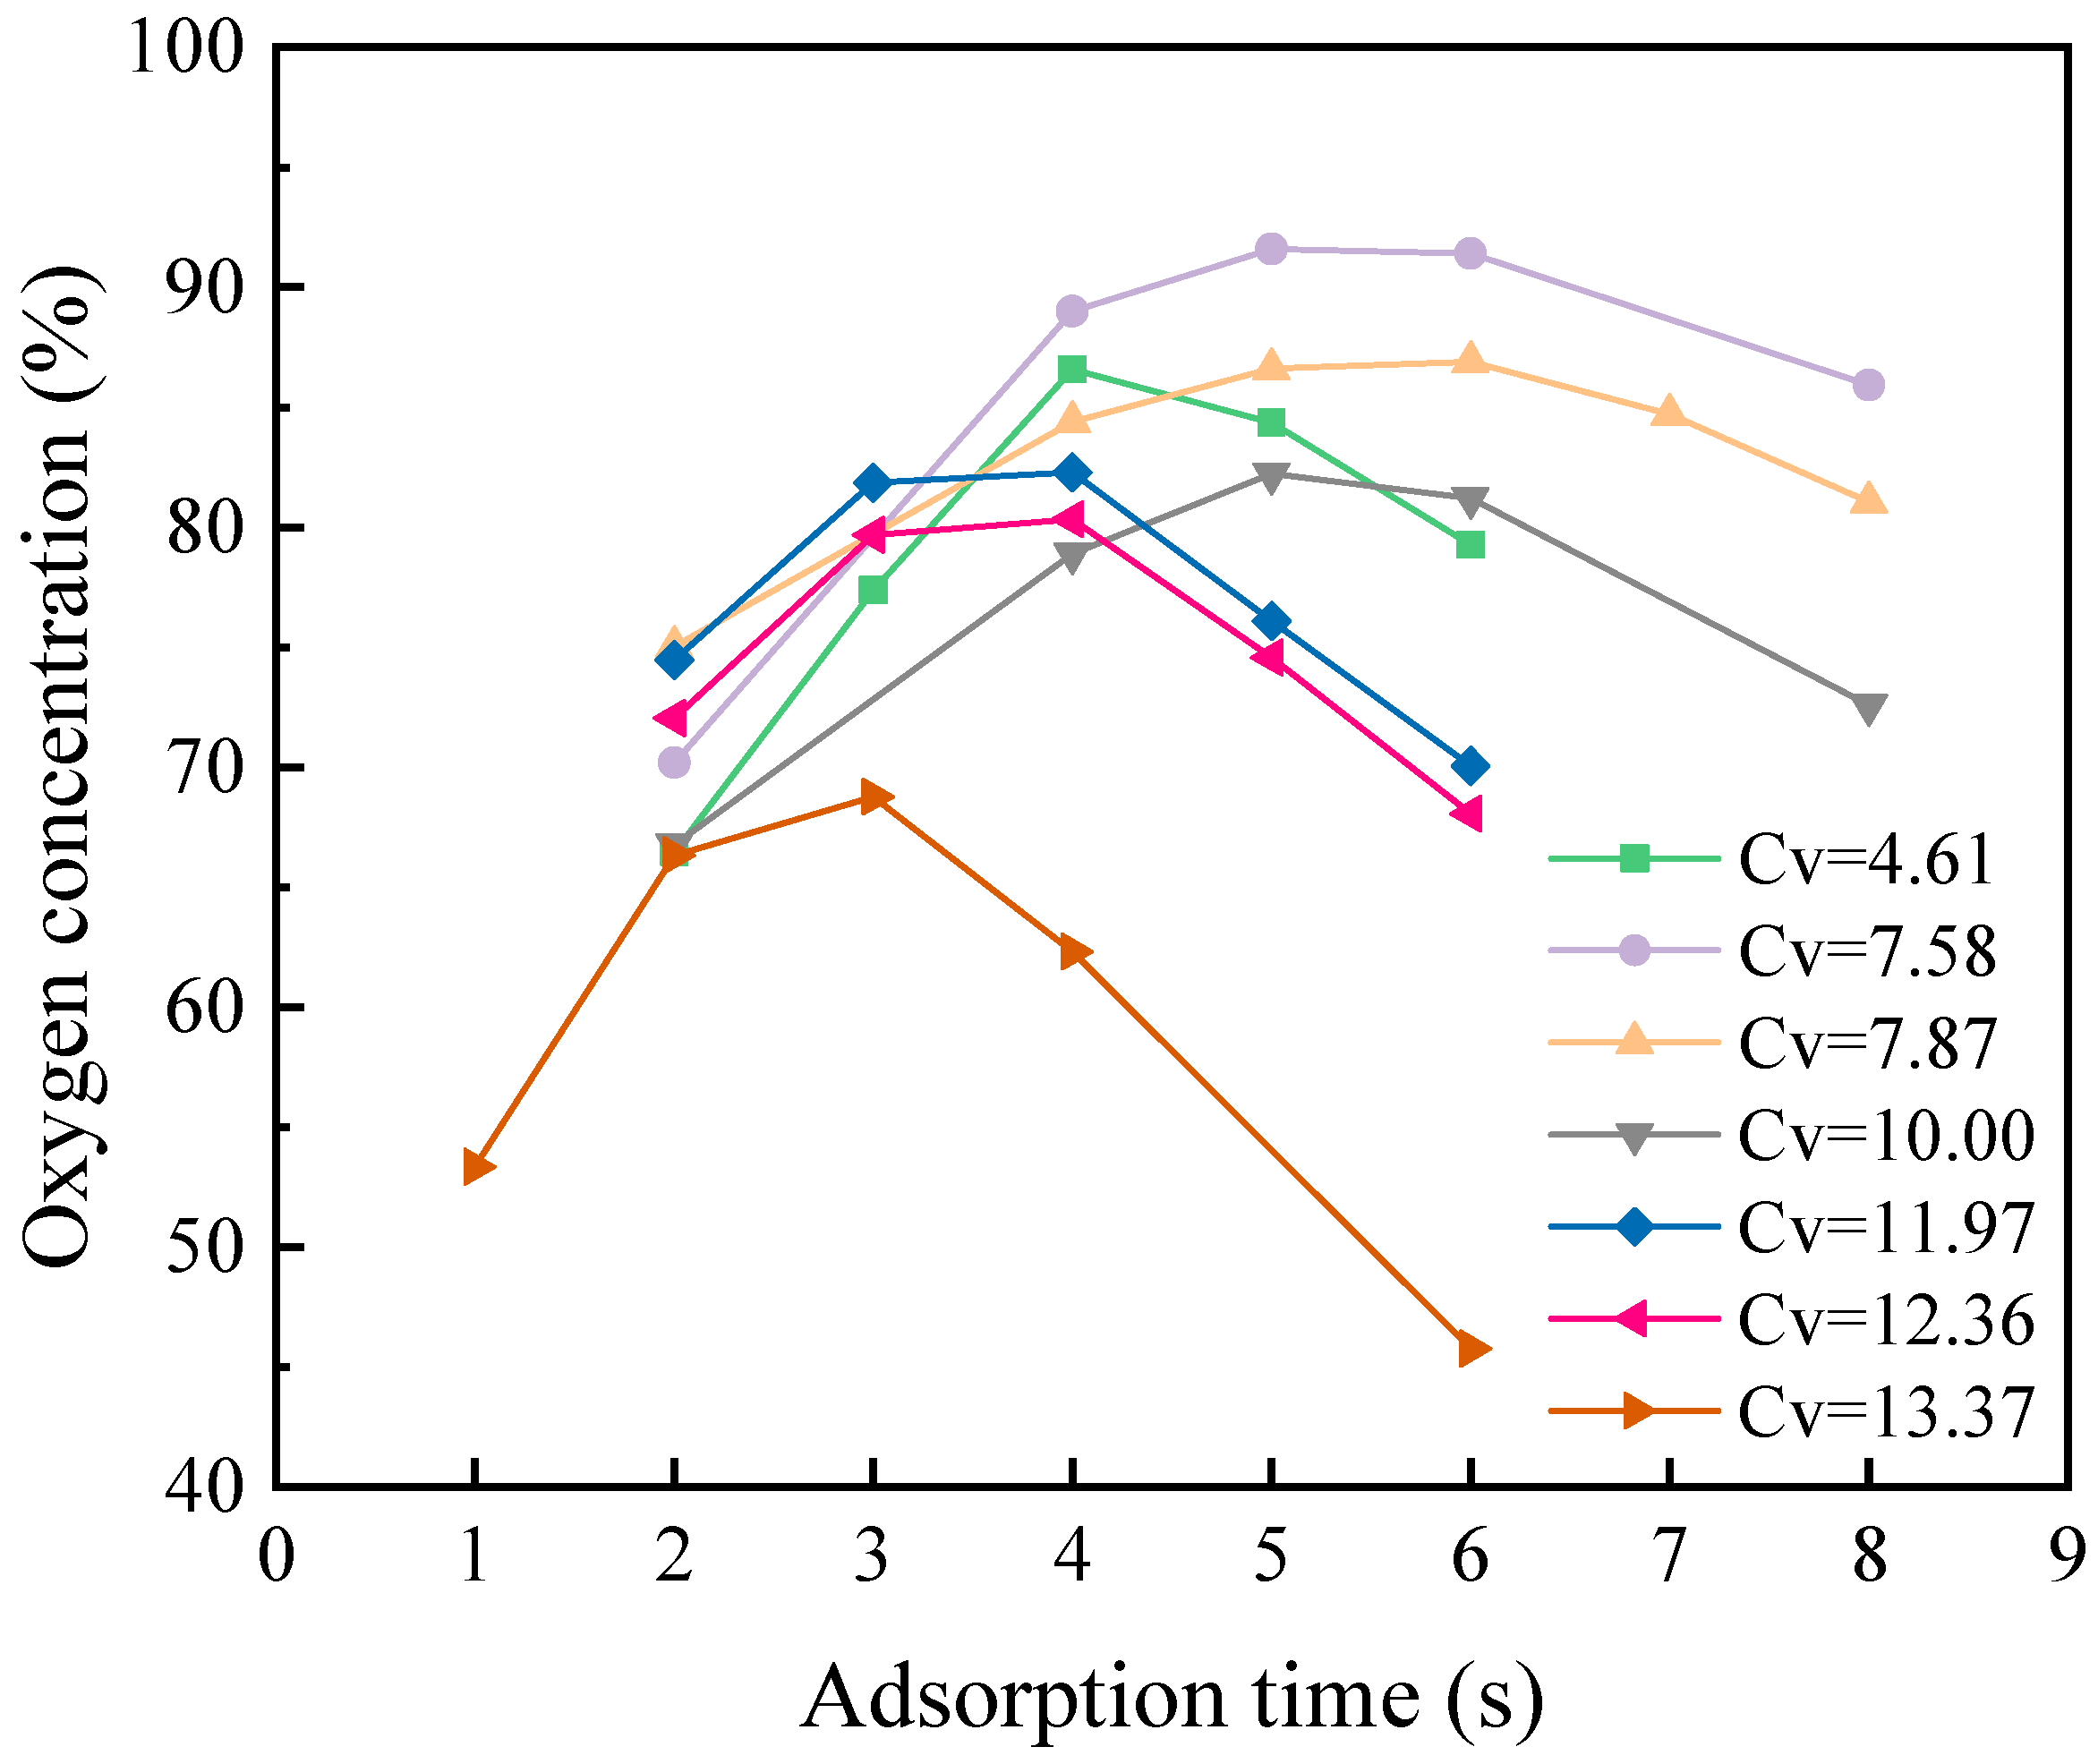
3.1. The Influence of Adsorption Time on Oxygen Production Performance

The adsorption time plays a crucial role in the PSA oxygen production process. Insufficient adsorption time results in a small air feed amount and an unsaturated adsorption bed, leading to molecular sieve wastage. Conversely, excessive adsorption time exceeding the bed’s capacity causes supersaturation of the molecular sieve adsorption, resulting in breakthrough of the mass transfer zone and decreased oxygen concentration in the product gas. Hence, there exists an optimal adsorption duration leading to the peak oxygen concentration. In this experimental investigation, the pressure equalization time was 0.7 s, the Cv value of the oxygen generation throttles was 7.58, a simultaneous top and bottom pressure equalization method was employed, and the product gas flow rate was maintained at 2.5 L/min. We examined the impact of adsorption time on both oxygen concentration and recovery, with the results presented in Figure 3.
Based on the data presented in Figure 3, it is observed that as the adsorption time is prolonged from 2 s to 8 s, there is an increase in oxygen concentration from 73.29% to 93.48%, followed by a decrease to 91.19%, reaching its peak at 5 s. Correspondingly, the oxygen recovery rate also shows an increasing trend with the extension of adsorption time, rising from 28.81% to 45.54%. Within the range of adsorption time of 2–5 s, it is noted that the amount of air introduced into the adsorption bed during a single cycle does not reach the saturation adsorption capacity of the molecular sieve. As the duration of adsorption increases, there is a continuous rise in pressure leading to an expansion in the upper limit of the molecular sieve’s adsorption capacity. Consequentially, both oxygen concentration and recovery rate exhibit an upward trajectory. However, when exceeding beyond 5 s for adsorption time, breakthrough of the mass transfer front within the bed results in some N2 entering into product gas, causing a decline in oxygen concentration. Furthermore, nearing the maximum limit for piston air compressor pressure leads to a reduction in intake volume—under these circumstances, the calculated recovery rate increases from 42.00% to 45.54%.

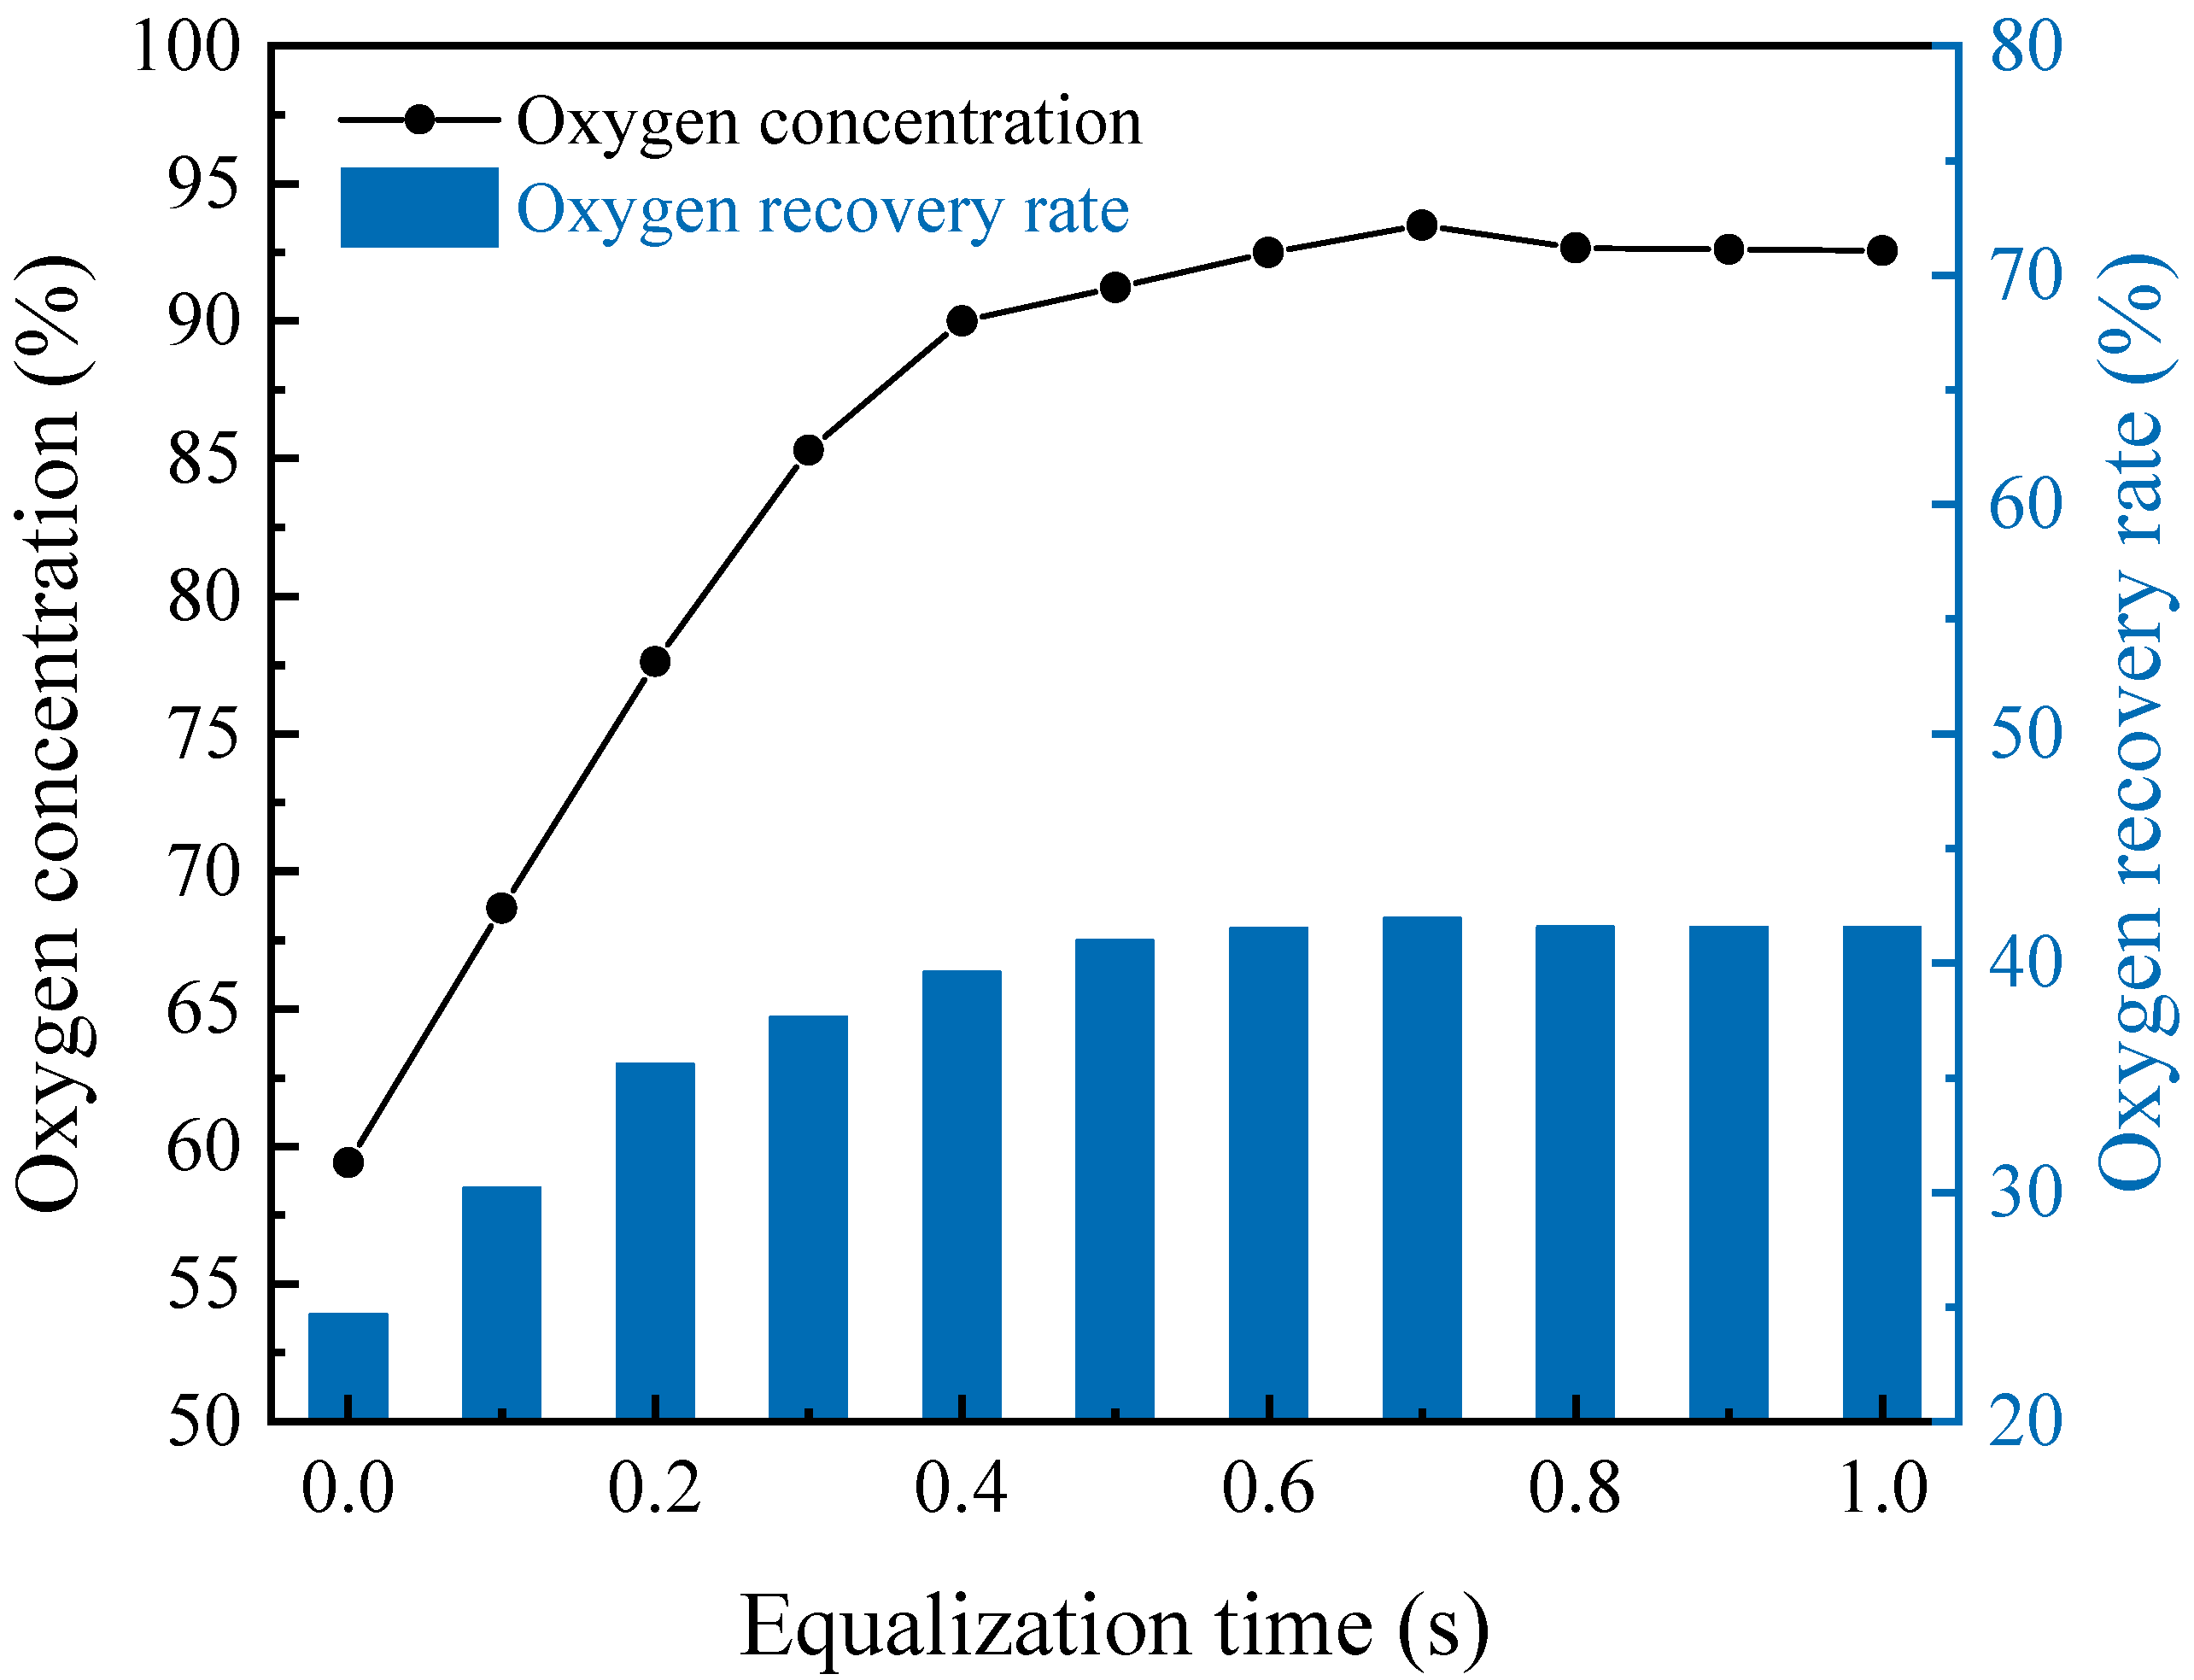
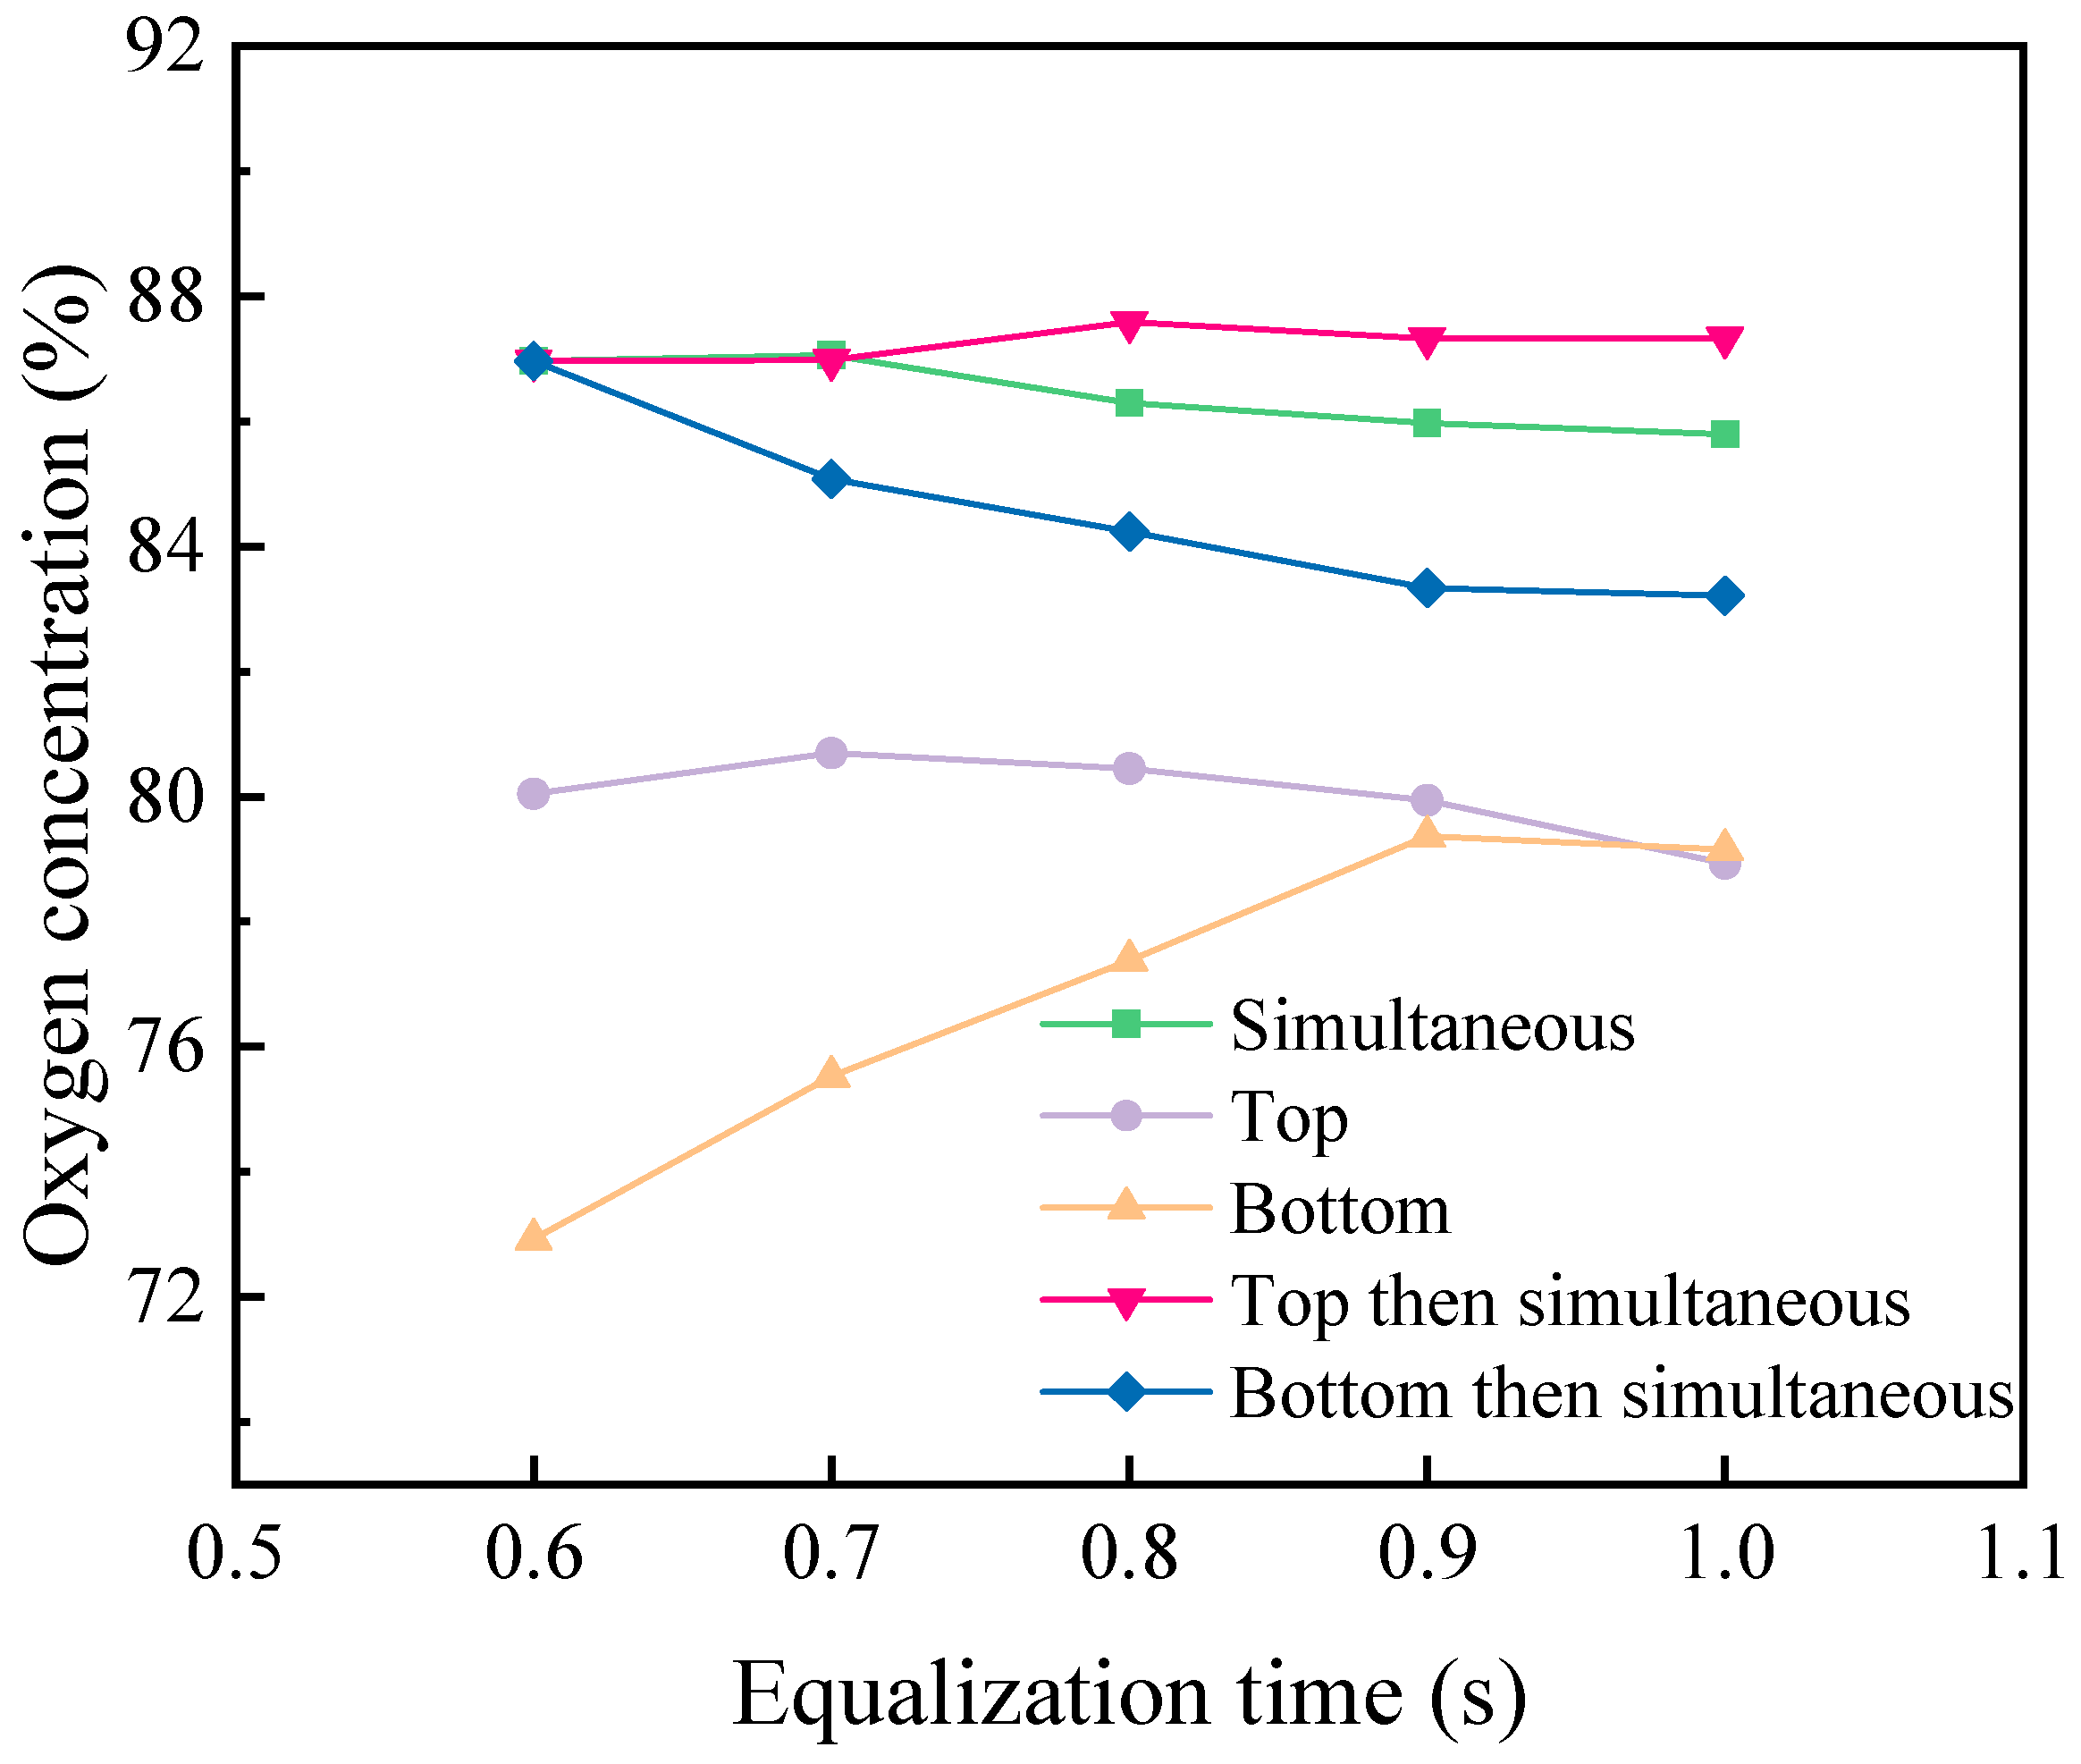
3.2. The Influence of Pressure Equalization Time and the Pressure Equalization Method on Oxygen Production Performance

Pressure equalization refers to the process in the PSA cycle where one adsorption bed completes pressurization and oxygen production while the other adsorption bed completes desorption cleaning. At this point, the pressure inside the adsorption bed that has completed pressurization reaches its peak, while the pressure inside the other adsorption bed is close to atmospheric pressure. The two adsorption towers are then connected, and the high-pressure gas in the already completed adsorption bed is used to balance the pressure of the tower that is about to undergo pressurization, recovering gas from within it. This allows for faster attainment of the corresponding adsorption pressure in Adsorption Tower B for oxygen production and saves on compressor output. Studies have shown that an oxygen production process with a pressure equalization step is more beneficial for molecular sieve nitrogen adsorption and increasing oxygen concentration compared to a PSA oxygen production process without a pressure equalization step [23]. In this study, at an adsorption time of 5 s, an oxygen production throttling valve Cv value of 7.58, the simultaneous top and bottom valve pressure equalization method, and a product gas flow rate of 2.5 L/min were explored for their effects on oxygen concentration and recovery rate. The experimental results are shown in Figure 4.
As depicted in Figure 4, the oxygen concentration and recovery rate initially increased and then decreased with the duration of pressure equalization. Upon extending the pressure equalization time from 0.4 s to 1 s, the oxygen concentration rose from 90.01% to 93.48%, subsequently declining to 92.57%, while the oxygen recovery rate increased from 39.6% to 41.96% before decreasing to 41.55%. A pressure equalization time of 0.7 s resulted in the highest levels of both oxygen concentration and recovery rate. The process with pressure equalization exhibited a significantly higher oxygen concentration and recovery rate compared to that without pressure equalization, indicating that an optimal pressure equalization time is crucial for maximizing performance efficiency.
This phenomenon can be attributed to the insufficient compression of oxygen-rich gas at the top of the high-pressure adsorption tower and unadsorbed air at the bottom into the low-pressure adsorption tower due to the excessively short duration of pressure equalization. Upon completion of adsorption, the total air intake into the tower is reduced, leading to a decrease in pressure within the adsorption bed and subsequently impacting the adsorption capacity of the molecular sieve. This in turn affects the concentration of oxygen and the recovery rate. During desorption, both oxygen-rich gas and feedstock gas from the high-pressure bed are released into the atmosphere, resulting in a reduction in the oxygen recovery rate. Prolonged pressure equalization time leads to the gradual desorption of N2 from the high-pressure adsorption bed into the low-pressure adsorption bed, thereby diminishing the overall available adsorption capacity under equalized pressure in subsequent cycles and consequently reducing both oxygen recovery and concentration.
Using different pressure equalization methods can improve oxygen production performance and reduce energy consumption. In this study, when the adsorption time is 5 s, the pressure equalization time is 0.7 s, the throttle Cv value is 7.58, and the product gas flow rate is 3 L/min, the influence of the top pressure equalization process, the bottom pressure equalization process, the top and bottom simultaneous pressure equalization process, and the top and bottom asynchronous pressure equalization process on the oxygen concentration is investigated. The experimental results are shown in Figure 5.
The oxygen concentration varies among different pressure equalization modes, with top and simultaneous pressure equalization yielding higher levels compared to bottom and then simultaneous pressure equalization. This difference may be attributed to the varying gas components provided by each pressure equalization method. Specifically, the use of only bottom pressure equalization results in a high nitrogen content in the gas, which can impact the adsorption bed’s available adsorption capacity. By employing the top pressure equalization method, a portion of the pressure equalization gas is derived from the high concentration of oxygen at the upper section of the bed, thereby enhancing the adsorption capacity during subsequent cycles. However, if only top pressure balancing is conducted, excessive duration for upper pressure balancing may result in the desorption of nitrogen from the high-pressure adsorption bed into the low-pressure adsorption bed, consequently impacting the working adsorption capacity and leading to a reduction in oxygen concentration. When employing the top and bottom pressure balancing method, the pressure equalization process can be expedited, allowing for the high concentration of oxygen at the top of the bed to be used fully. By initially equalizing pressure at the top and subsequently doing so simultaneously, optimal utilization of oxygen-rich gas at the top is achieved while reducing the time required for bottom pressure equalization, thereby preventing the excessive desorption of nitrogen into the low-pressure adsorption bed. Consequently, this approach enables the attainment of maximum oxygen concentration.

3.3. The Influence of Product Gas Flow Rate on Oxygen Production Performance

The product gas flow rate is also one of the important factors affecting the oxygen production performance. In this section, the effects of product gas flow on oxygen concentration and oxygen recovery were investigated under the process parameters of an adsorption time of 5 s, a pressure equalization time of 0.7 s, a Cv value of oxygen producing throttles of 7.58, and pressure equalization at the top and bottom simultaneously. The experimental results are shown in Figure 6.
As can be seen from Figure 6, oxygen concentration increased from 93.65% to 94.21% and then decreased to 79.38% with the increase in the oxygen flow rate. The increase in oxygen concentration may be due to the slow flow rate of air flow in the adsorption tower at a low product oxygen flow rate, the phenomenon of high concentration oxygen accumulation at the top of the tower, which failed to discharge into the oxygen storage tank in time, and the high concentration oxygen reversely returned to the adsorption mass transfer zone. As a result, the partial pressure of oxygen in the upper part of the mass transfer zone increases [24], the adsorption amount of oxygen molecules in the adsorbent is large, and the adsorption site is competitive with nitrogen molecules, which reduces the adsorption amount of nitrogen, thereby causing nitrogen to penetrate the adsorption bed and reduce the oxygen concentration of the product. When the oxygen flow rate of the product is increased, this situation is alleviated, and the oxygen concentration slowly rises. When the oxygen flow rate of the product is too high, the pressure at the top of the adsorption bed drops, the adsorption amount of nitrogen by the adsorbent decreases, and the flow rate of raw gas in the adsorption bed is too fast, resulting in nitrogen penetration. If the oxygen flow rate of the product continues to increase, the oxygen concentration of the product will decrease rapidly. Because the separation performance of argon and oxygen in the air is very close, the adsorbent cannot separate oxygen and argon, so the oxygen concentration of the product gas is not more than 95%. As the product gas flow increases, more oxygen is utilized, increasing the oxygen recovery rate. With the further increase in the product gas flow rate, the utilization rate of oxygen molecular sieve in the adsorption bed gradually approaches saturation, and the growth slope of oxygen recovery slows down.

3.4. The Influence of Oxygen Production Throttling Sub Flow Coefficient on Oxygen Production Performance

In order to find out the flow coefficient (Cv value of oxygen throttles) most suitable for the oxygen-producing device, the influence rule of the inner diameter of oxygen-producing throttles on the oxygen-producing performance of the PSA oxygen-producing device under different adsorption times was investigated. The adsorption time was set as 5 s, the pressure equalization time as 0.7 s, the product gas flow rate as 3 L/min, and the pressure equalization method as top and bottom simultaneously. The influence of the oxygen generation throttle Cv value on oxygen concentration was explored. The experimental results are shown in Figure 7.
As can be seen from Figure 7, the optimal adsorption time of the device first increases and then decreases with the increase in the Cv value of the oxygen-producing throttles. When the Cv value of the oxygen-producing throttles of the oxygen-producing device is 7.58, the highest oxygen concentration of 87.31% is obtained. When the Cv value of the oxygen-producing throttles is lower than 7.58, some nitrogen remains in the adsorbent due to less than the ideal value of back-blown oxygen, which affects the working adsorption capacity of the next cycle and makes the oxygen concentration of the product low. When the Cv value of the oxygen-producing throttles is higher than 7.58, the oxygen used for back-blowing exceeds the ideal value, resulting in waste of product gas, and the maximum pressure of the adsorption bed is reduced, resulting in a decrease in oxygen concentration.

3.5. Optimization of Process Parameters Based on Response Surface Methodology

3.5.1. Model Establishment and Analysis

The multi-factor experimental design scheme and experimental results are shown in Table 5. The regression models for oxygen concentration and recovery rate are fitted using quadratic polynomials.
Perform multiple regression analysis on the response surface test results and establish a multiple quadratic equation as follows:
R 1 = 92.55 + 0.96 A + 0.31 B 5.07 C + 0.23 D 0.59 A B + 0.69 A C 1.7 A D + 0.32 B C + 0.17 B D + 0.82 C D 112 A 2 1.44 B 2 1.81 C 2 5.74 D 2
R 2 = 40.72 + 2.22 A + 0.61 B + 5.63 C 1.67 D 0.41 A B + 0.61 A C 1.16 A D + 0.23 B C + 0.042 B D + 0.11 C D + 0.095 A 2 0.24 B 2 0.99 C 2 1.77 D 2
In the formula, R1 and R2 are the response values of oxygen concentration and recovery rate: A, B, C, and D represent the encoding values of the adsorption time, pressure equalization time, oxygen flow rate, and throttle inner diameter, respectively.
The analysis of variance results of the regression model with oxygen concentration and oxygen recovery rate as response values are shown in Table 6 and Table 7.
The F value of the oxygen concentration model is 20.9, with a probability of p < 0.001, indicating that the model significantly impacts the response value R1 and has high reliability. Overall, the quadratic regression equation model is significant, with a model mismatch term of p = 0.3649, which is not significant. The regression model fits well with the measured values and can be used to predict the oxygen recovery rate. The order of the degree of influence of four factors on the oxygen concentration of the onboard oxygen generation device under this combination is: flow rate (C) > adsorption time (A) > equalization time (B) > throttle inner diameter (D). The F of the oxygen recovery rate model is 62.84, with a probability of p < 0.001, indicating that the model has a significant impact on the response value R2 and has high reliability. Overall, the quadratic regression equation model is significant, with a model mismatch term of p = 0.1828, indicating insignificance. The regression model fits well with the measured values and can be used to predict the oxygen recovery rate. The order of the degree of influence of four factors on the oxygen recovery rate of the onboard oxygen generation device under this combination is: flow rate (C) > adsorption time (A) > throttle inner diameter (D) > equalization time (B).
Figure 8 shows the correspondence between the actual and predicted oxygen concentration values and oxygen recovery rate. The figure shows that each point of the expected value is distributed on the straight line, or near both sides. This indicates that the experimental and predicted values of oxygen concentration and recovery rate are consistent, further increasing the credibility of the response surface model.

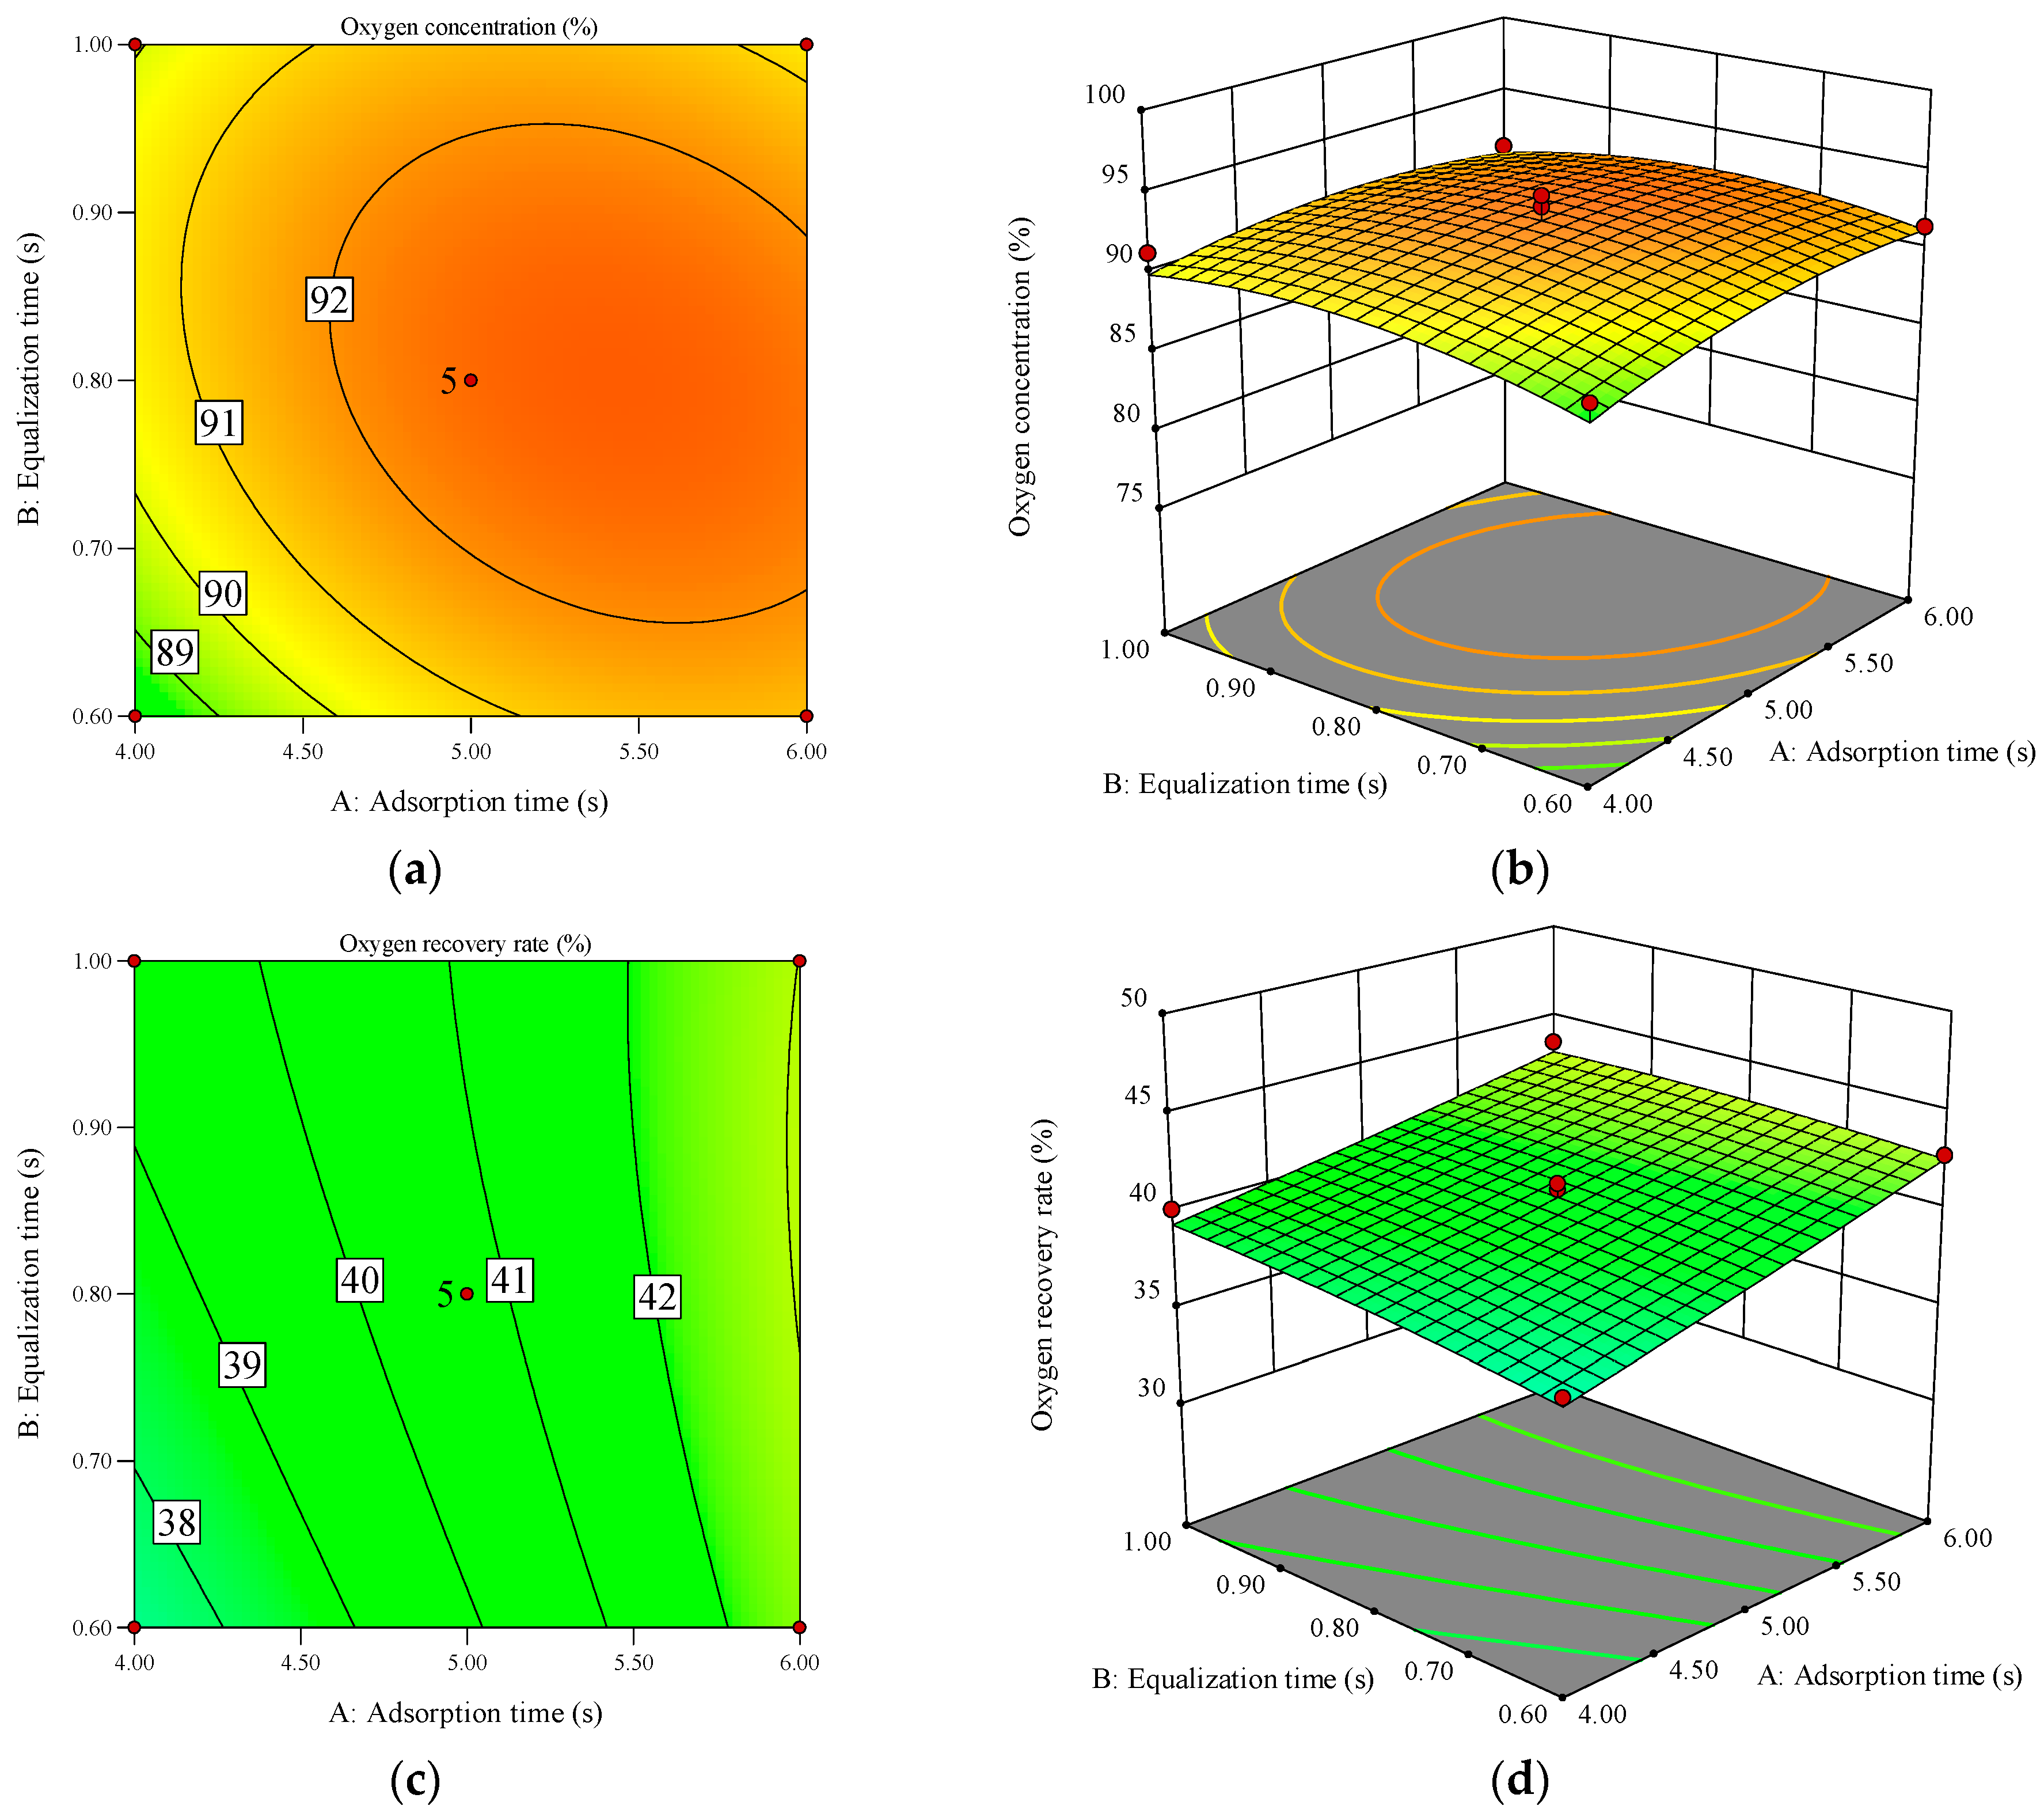
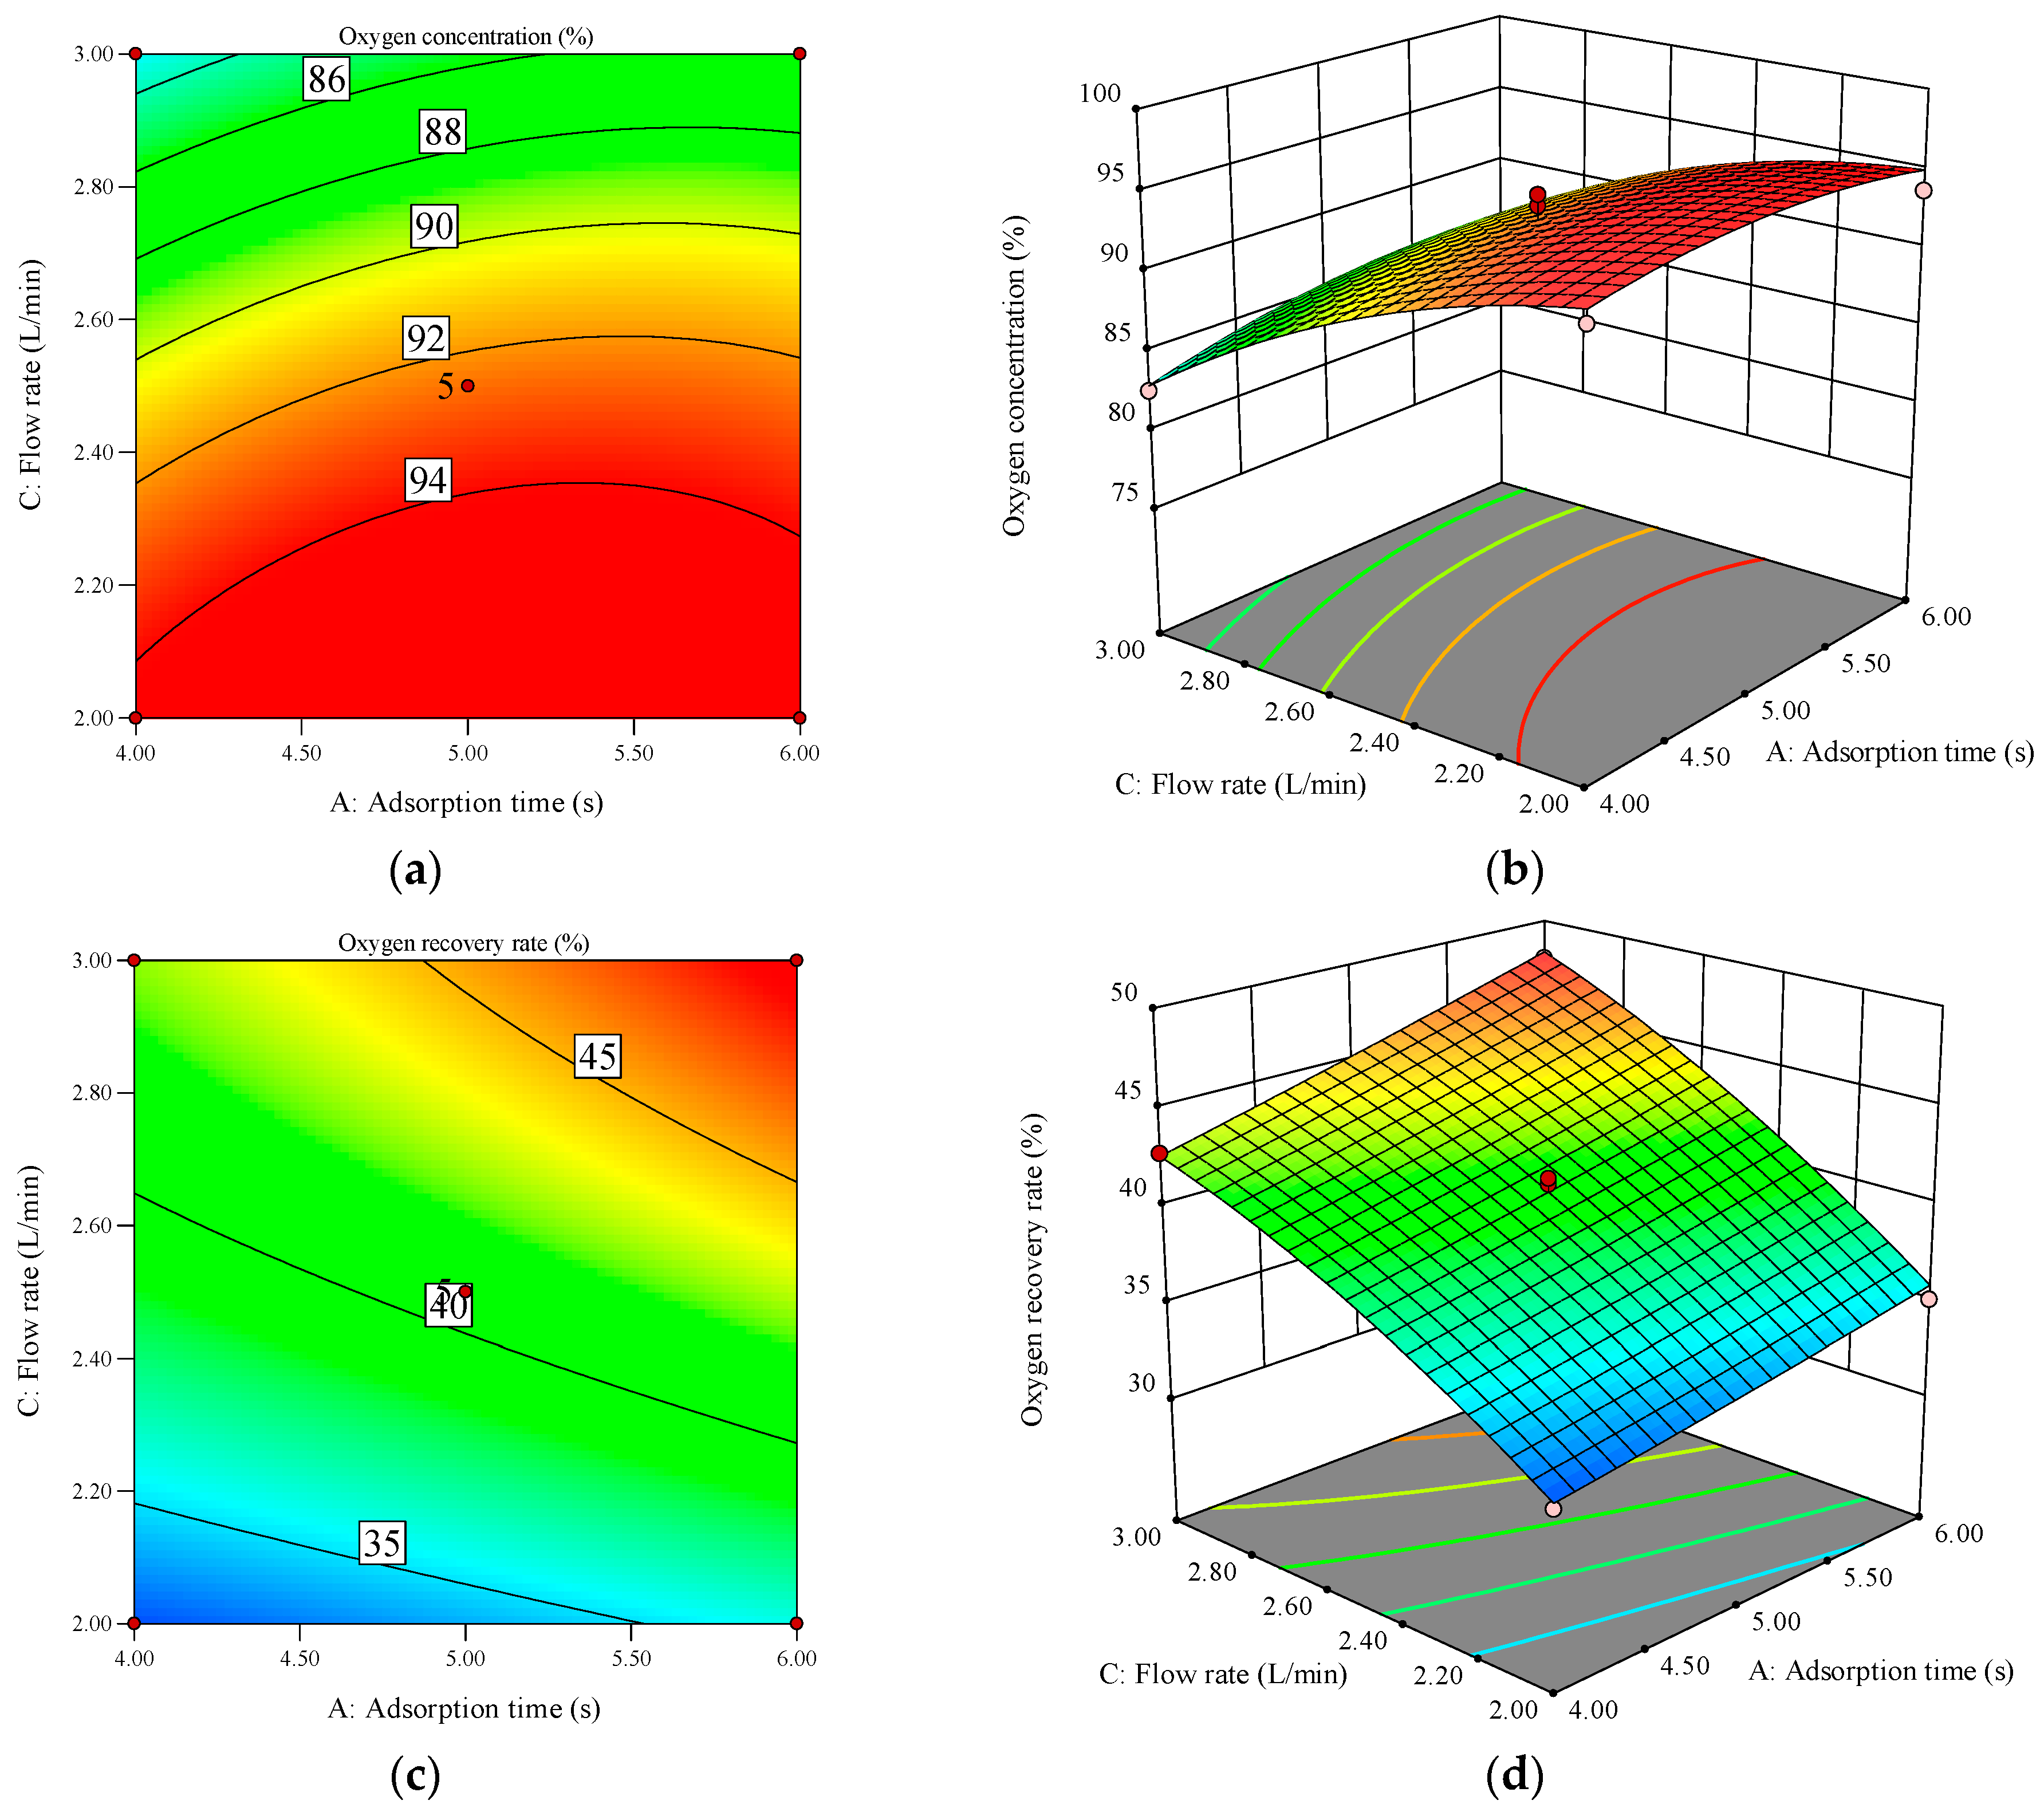
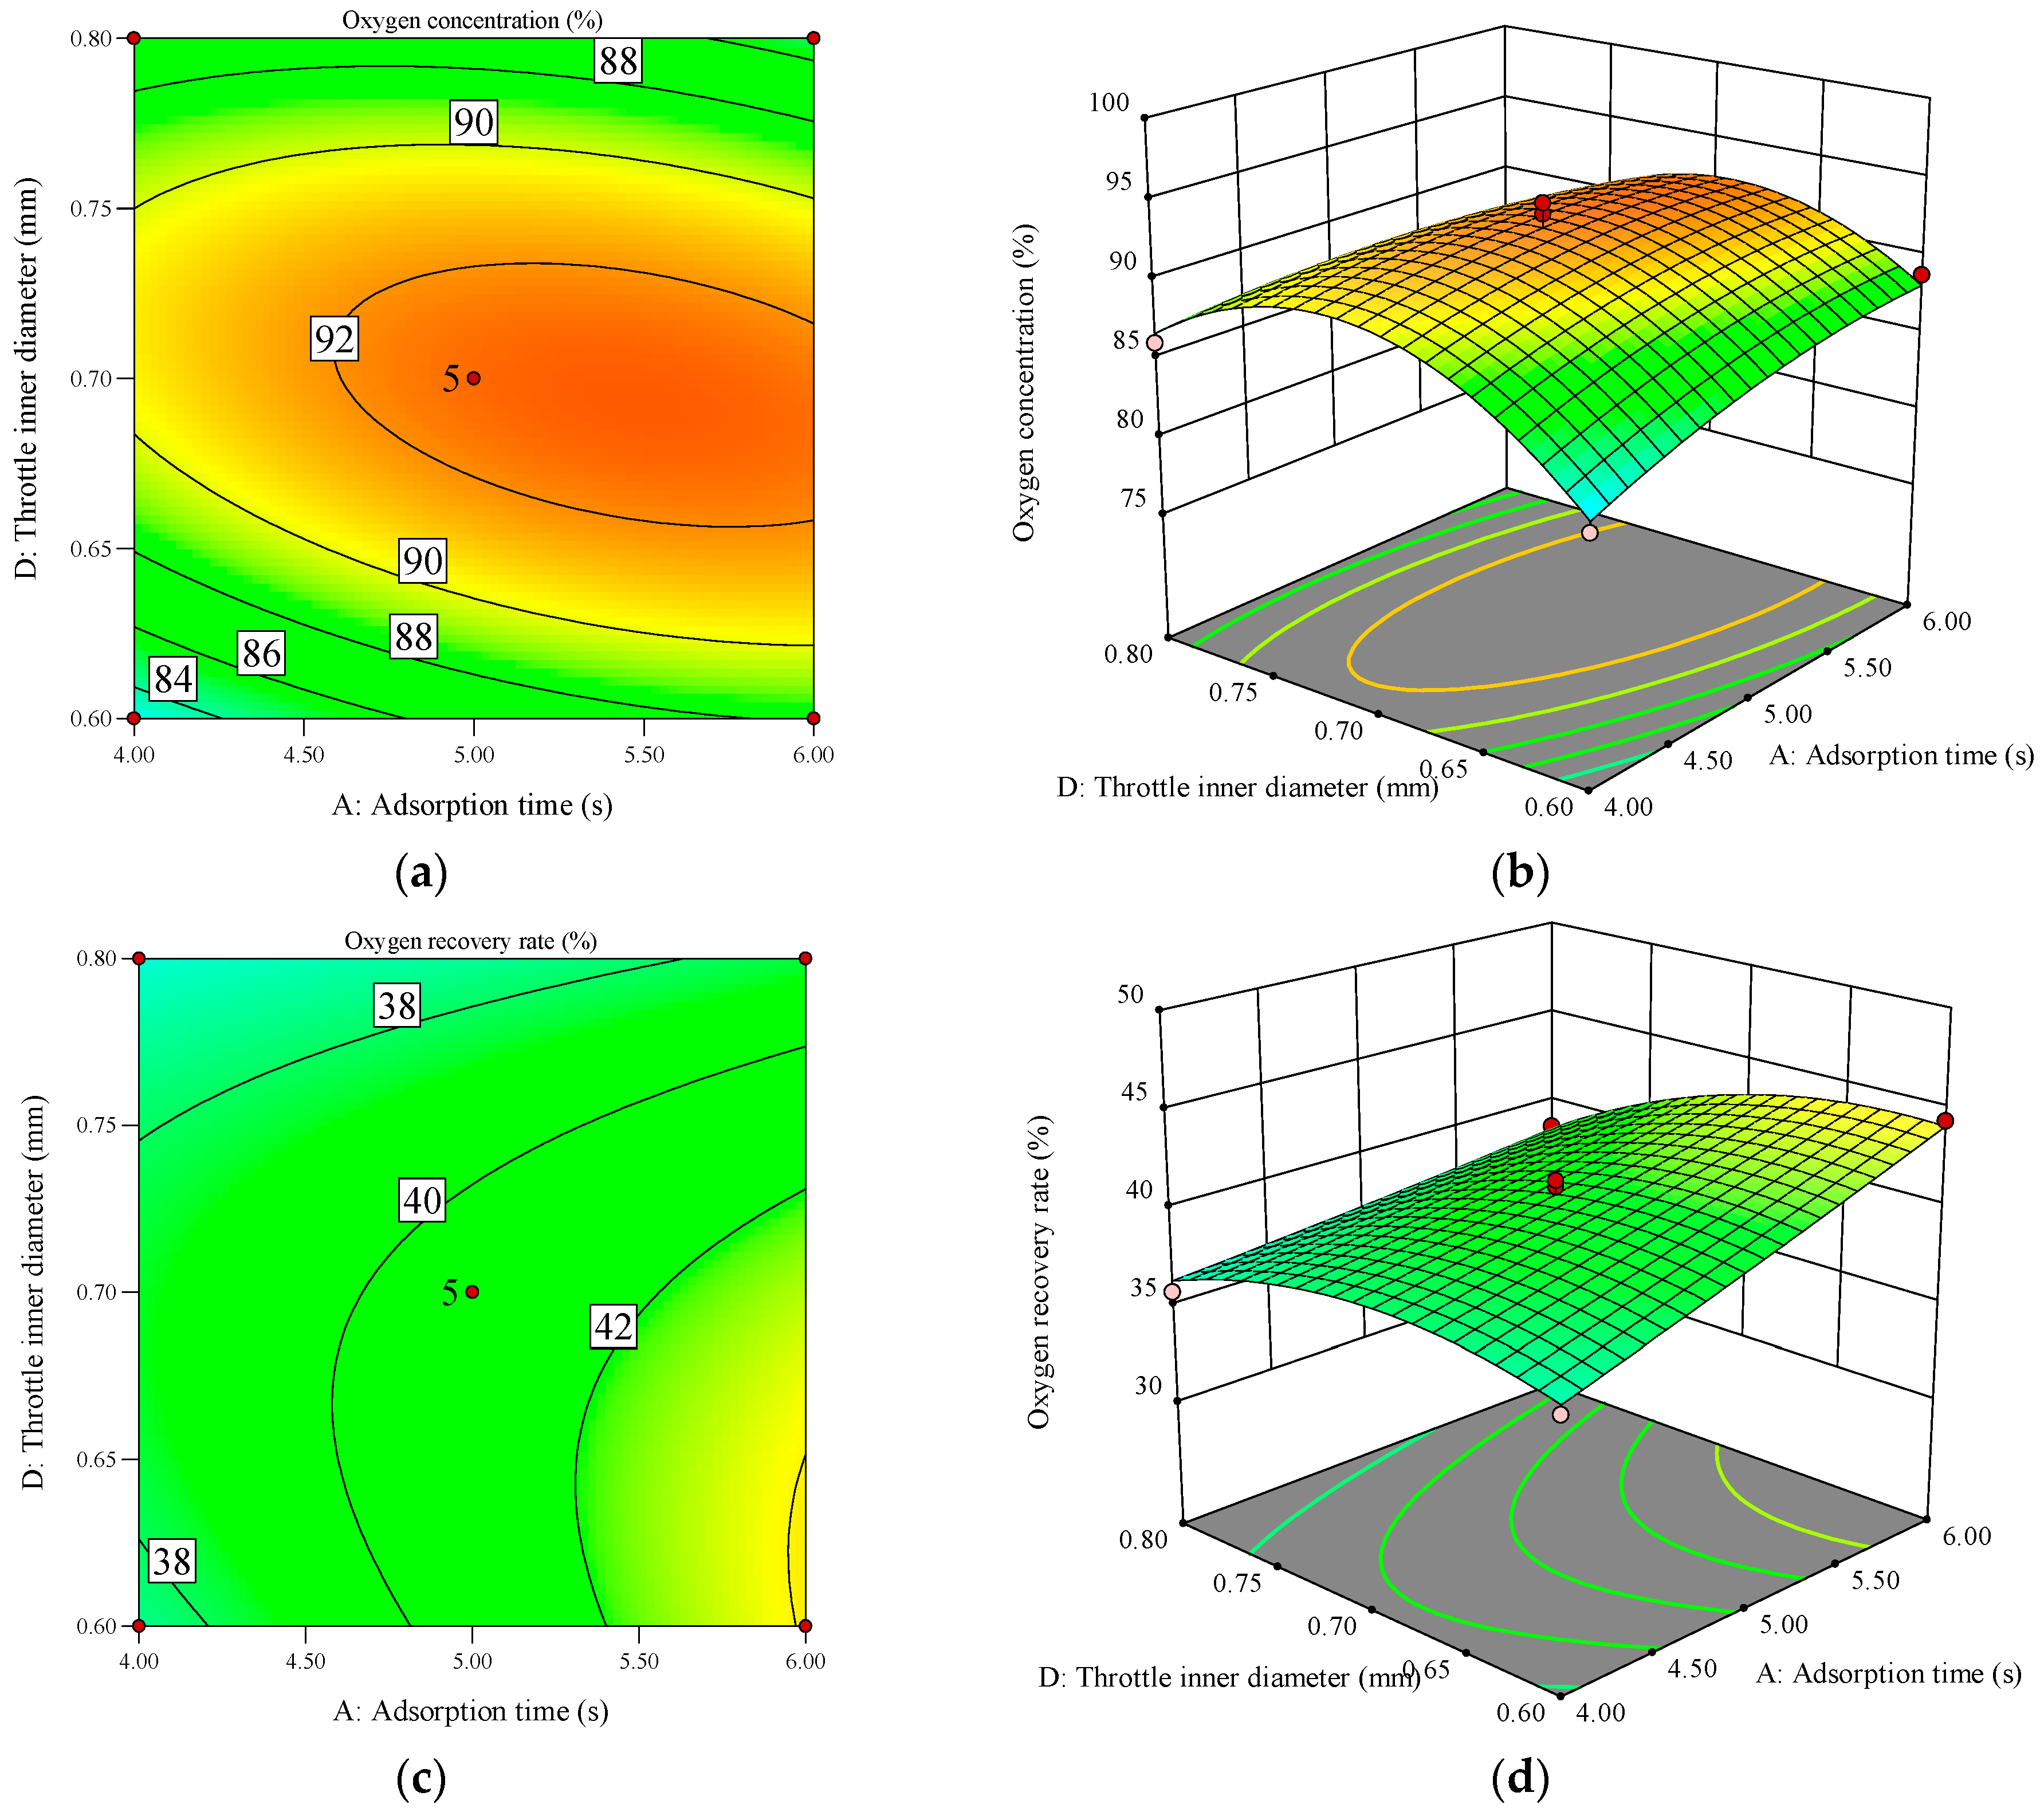
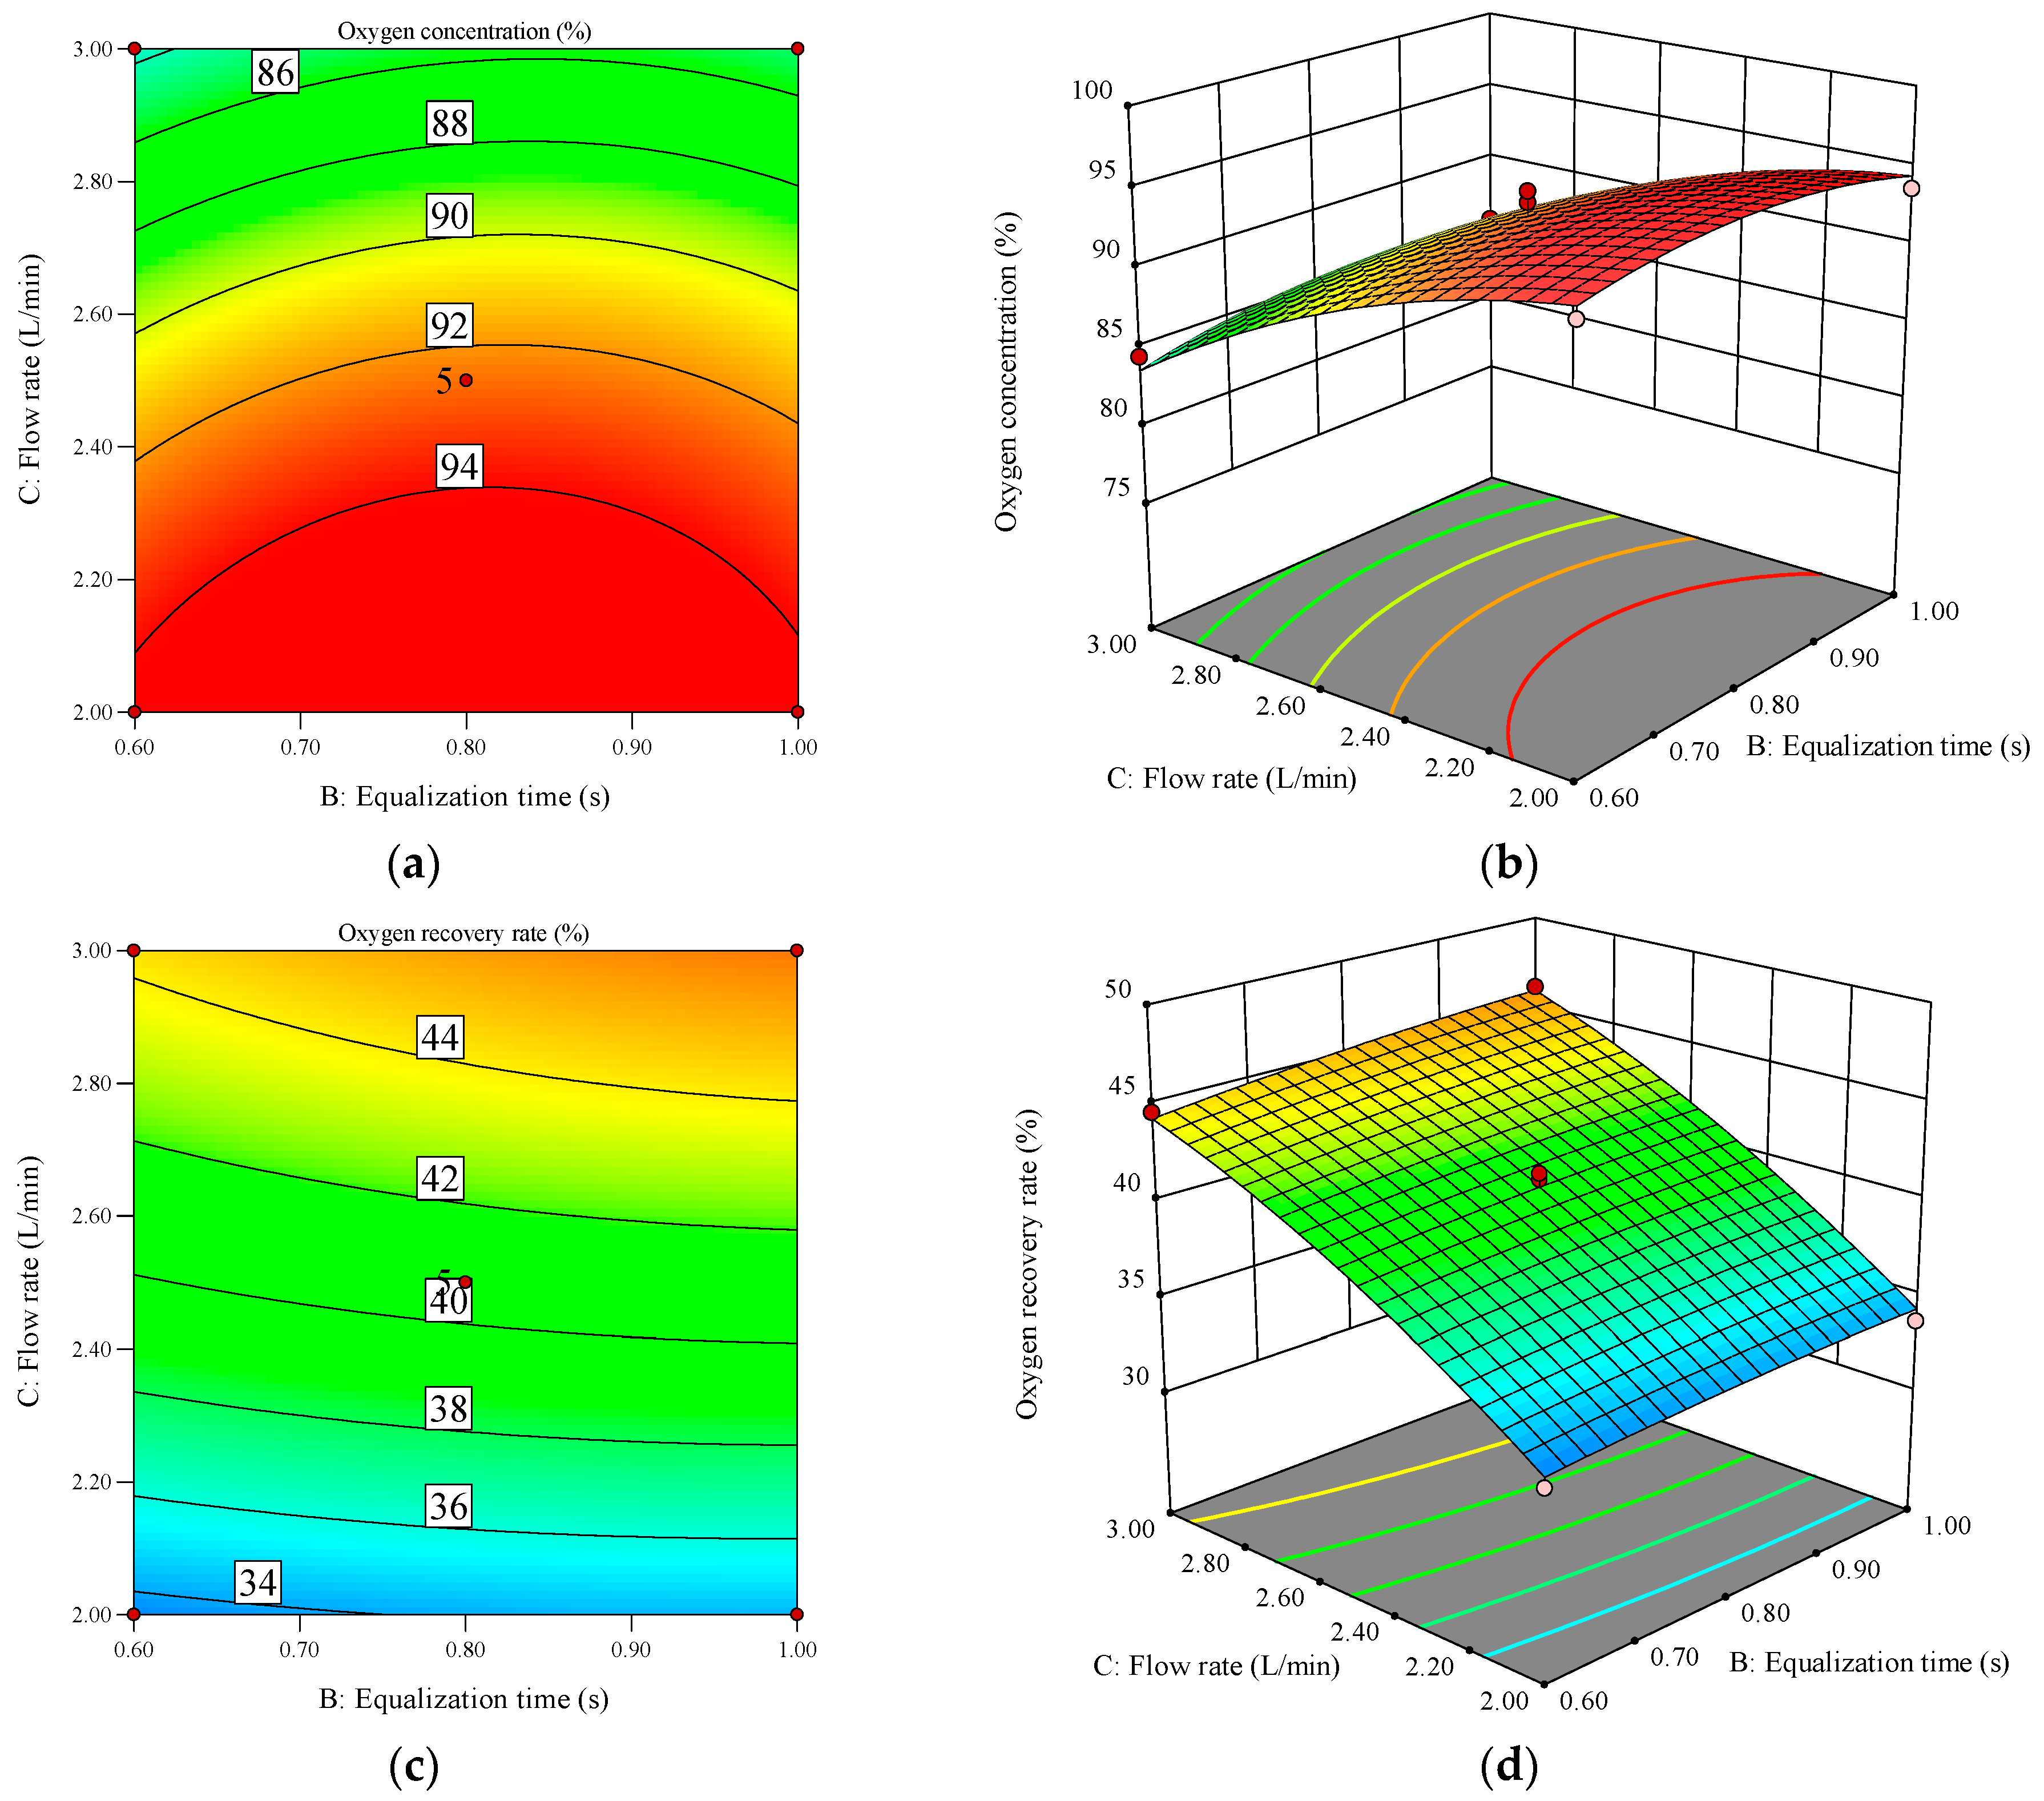
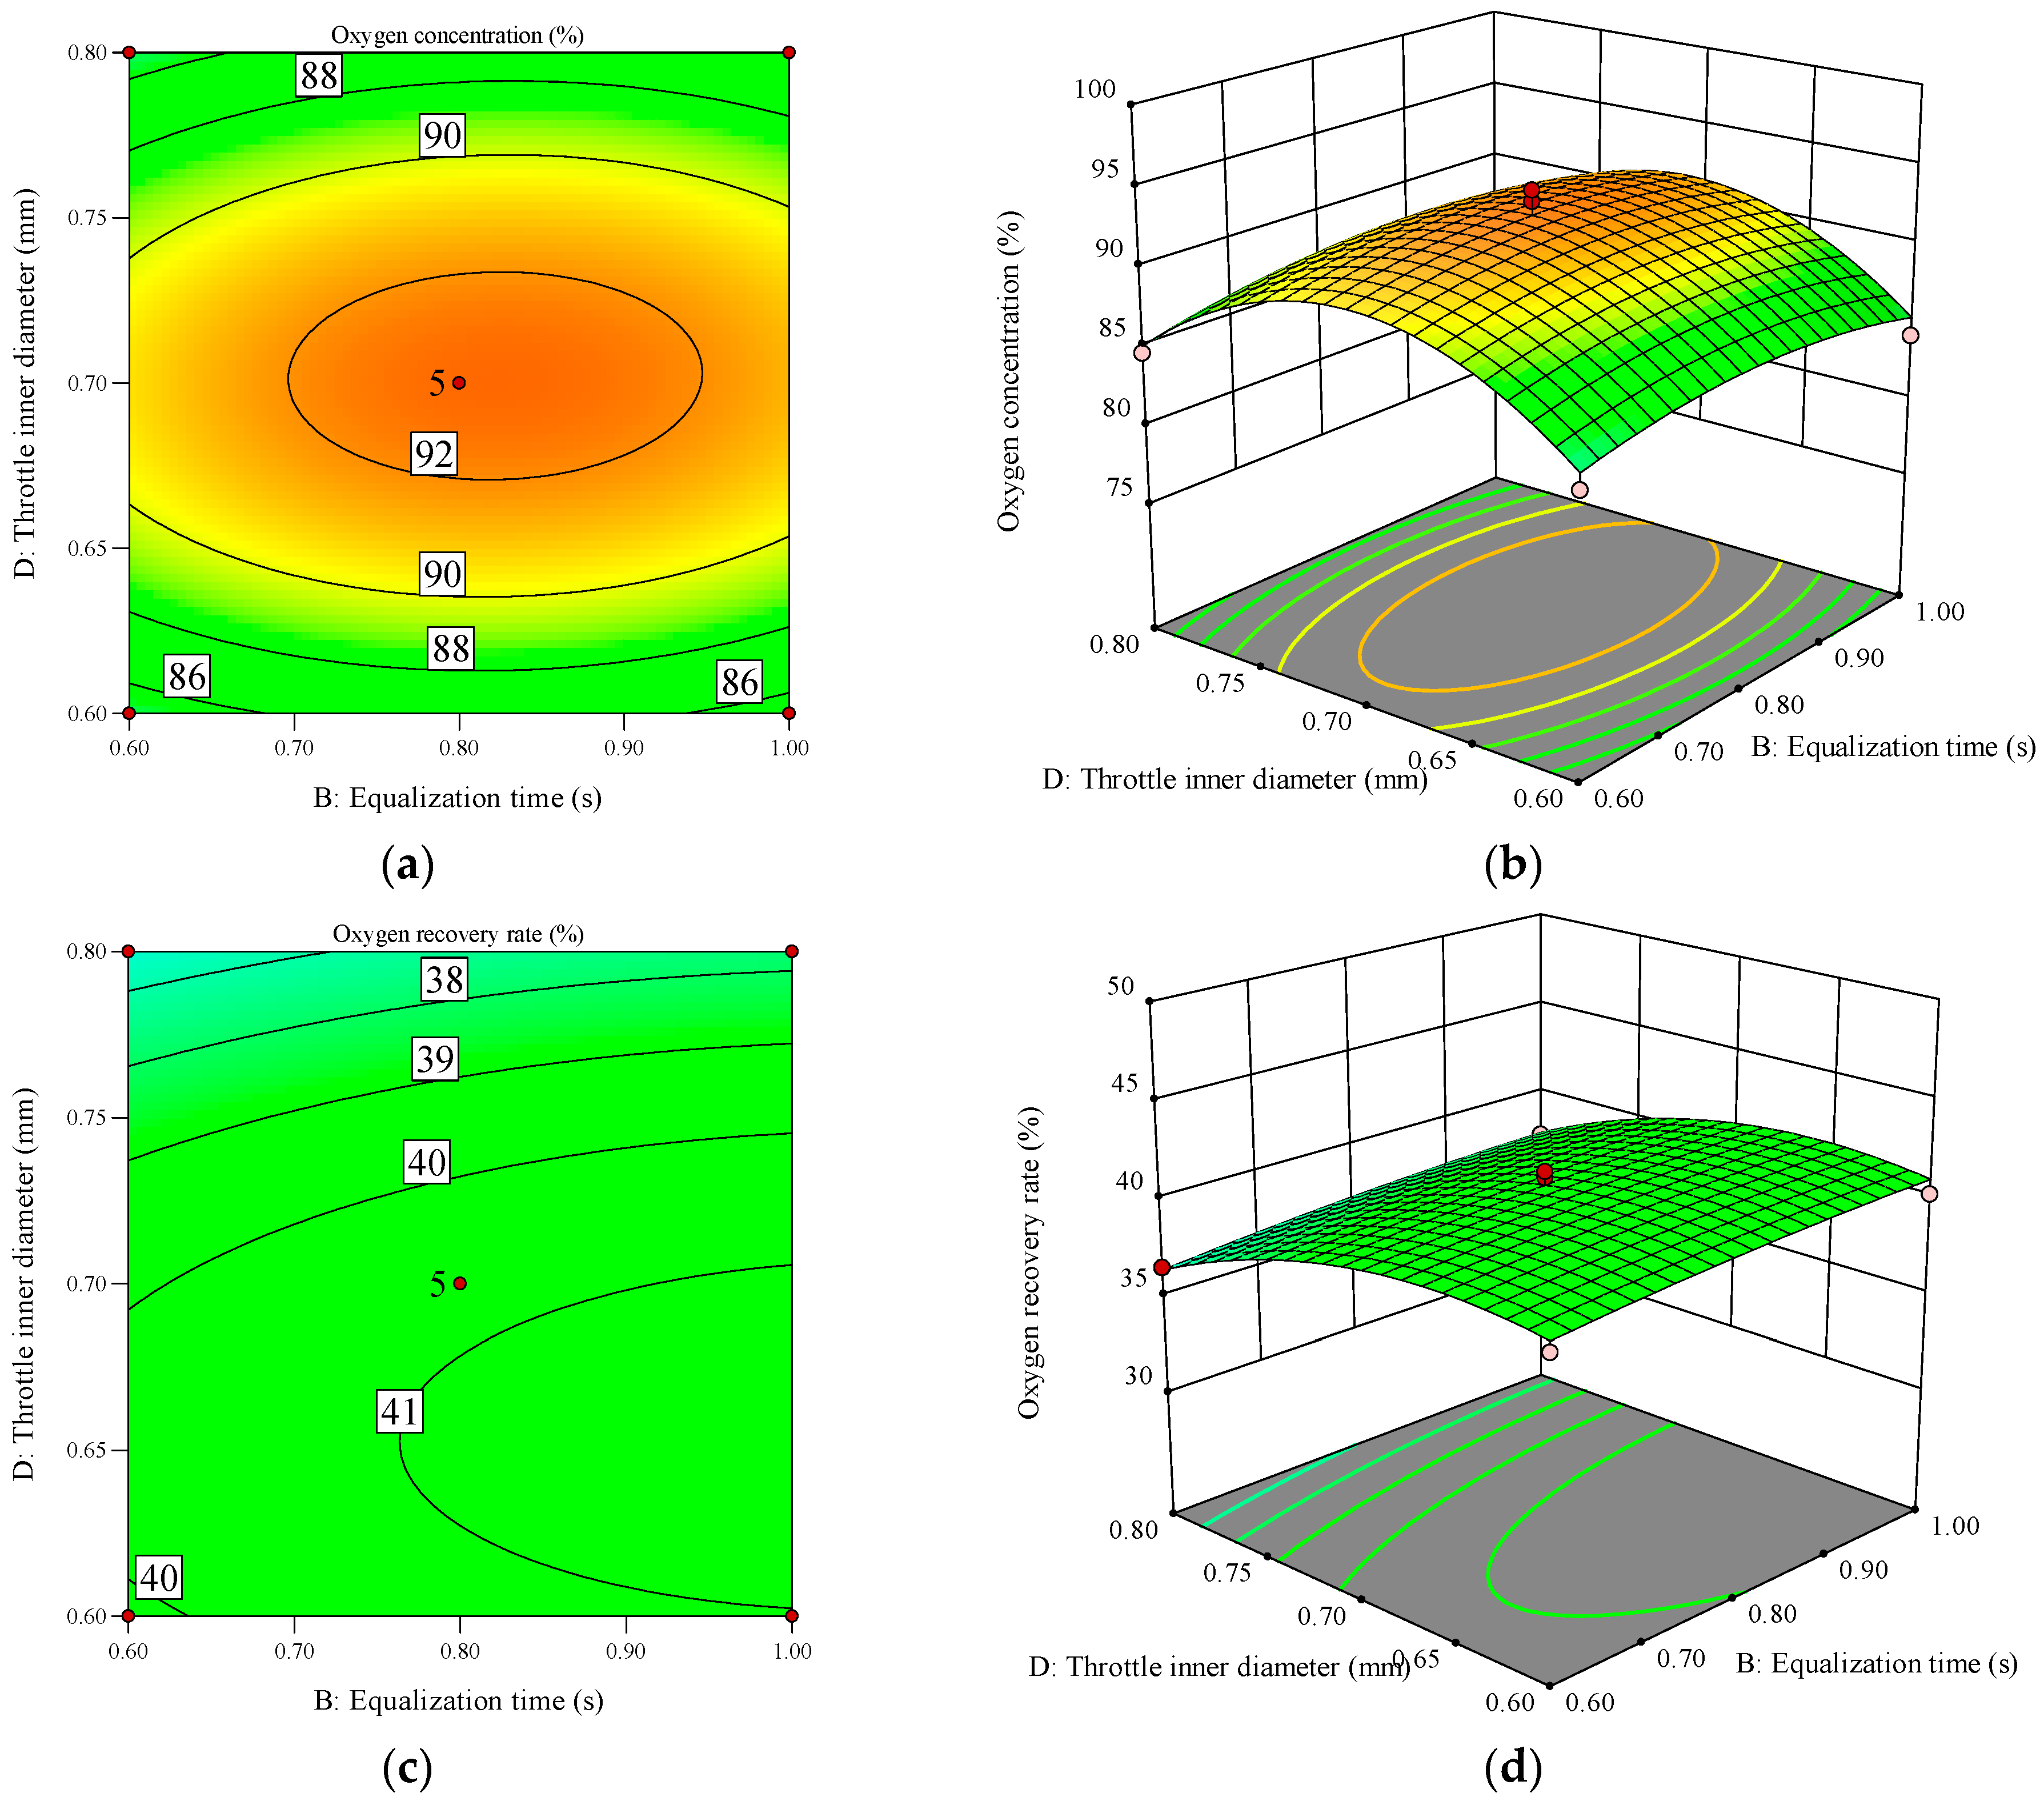
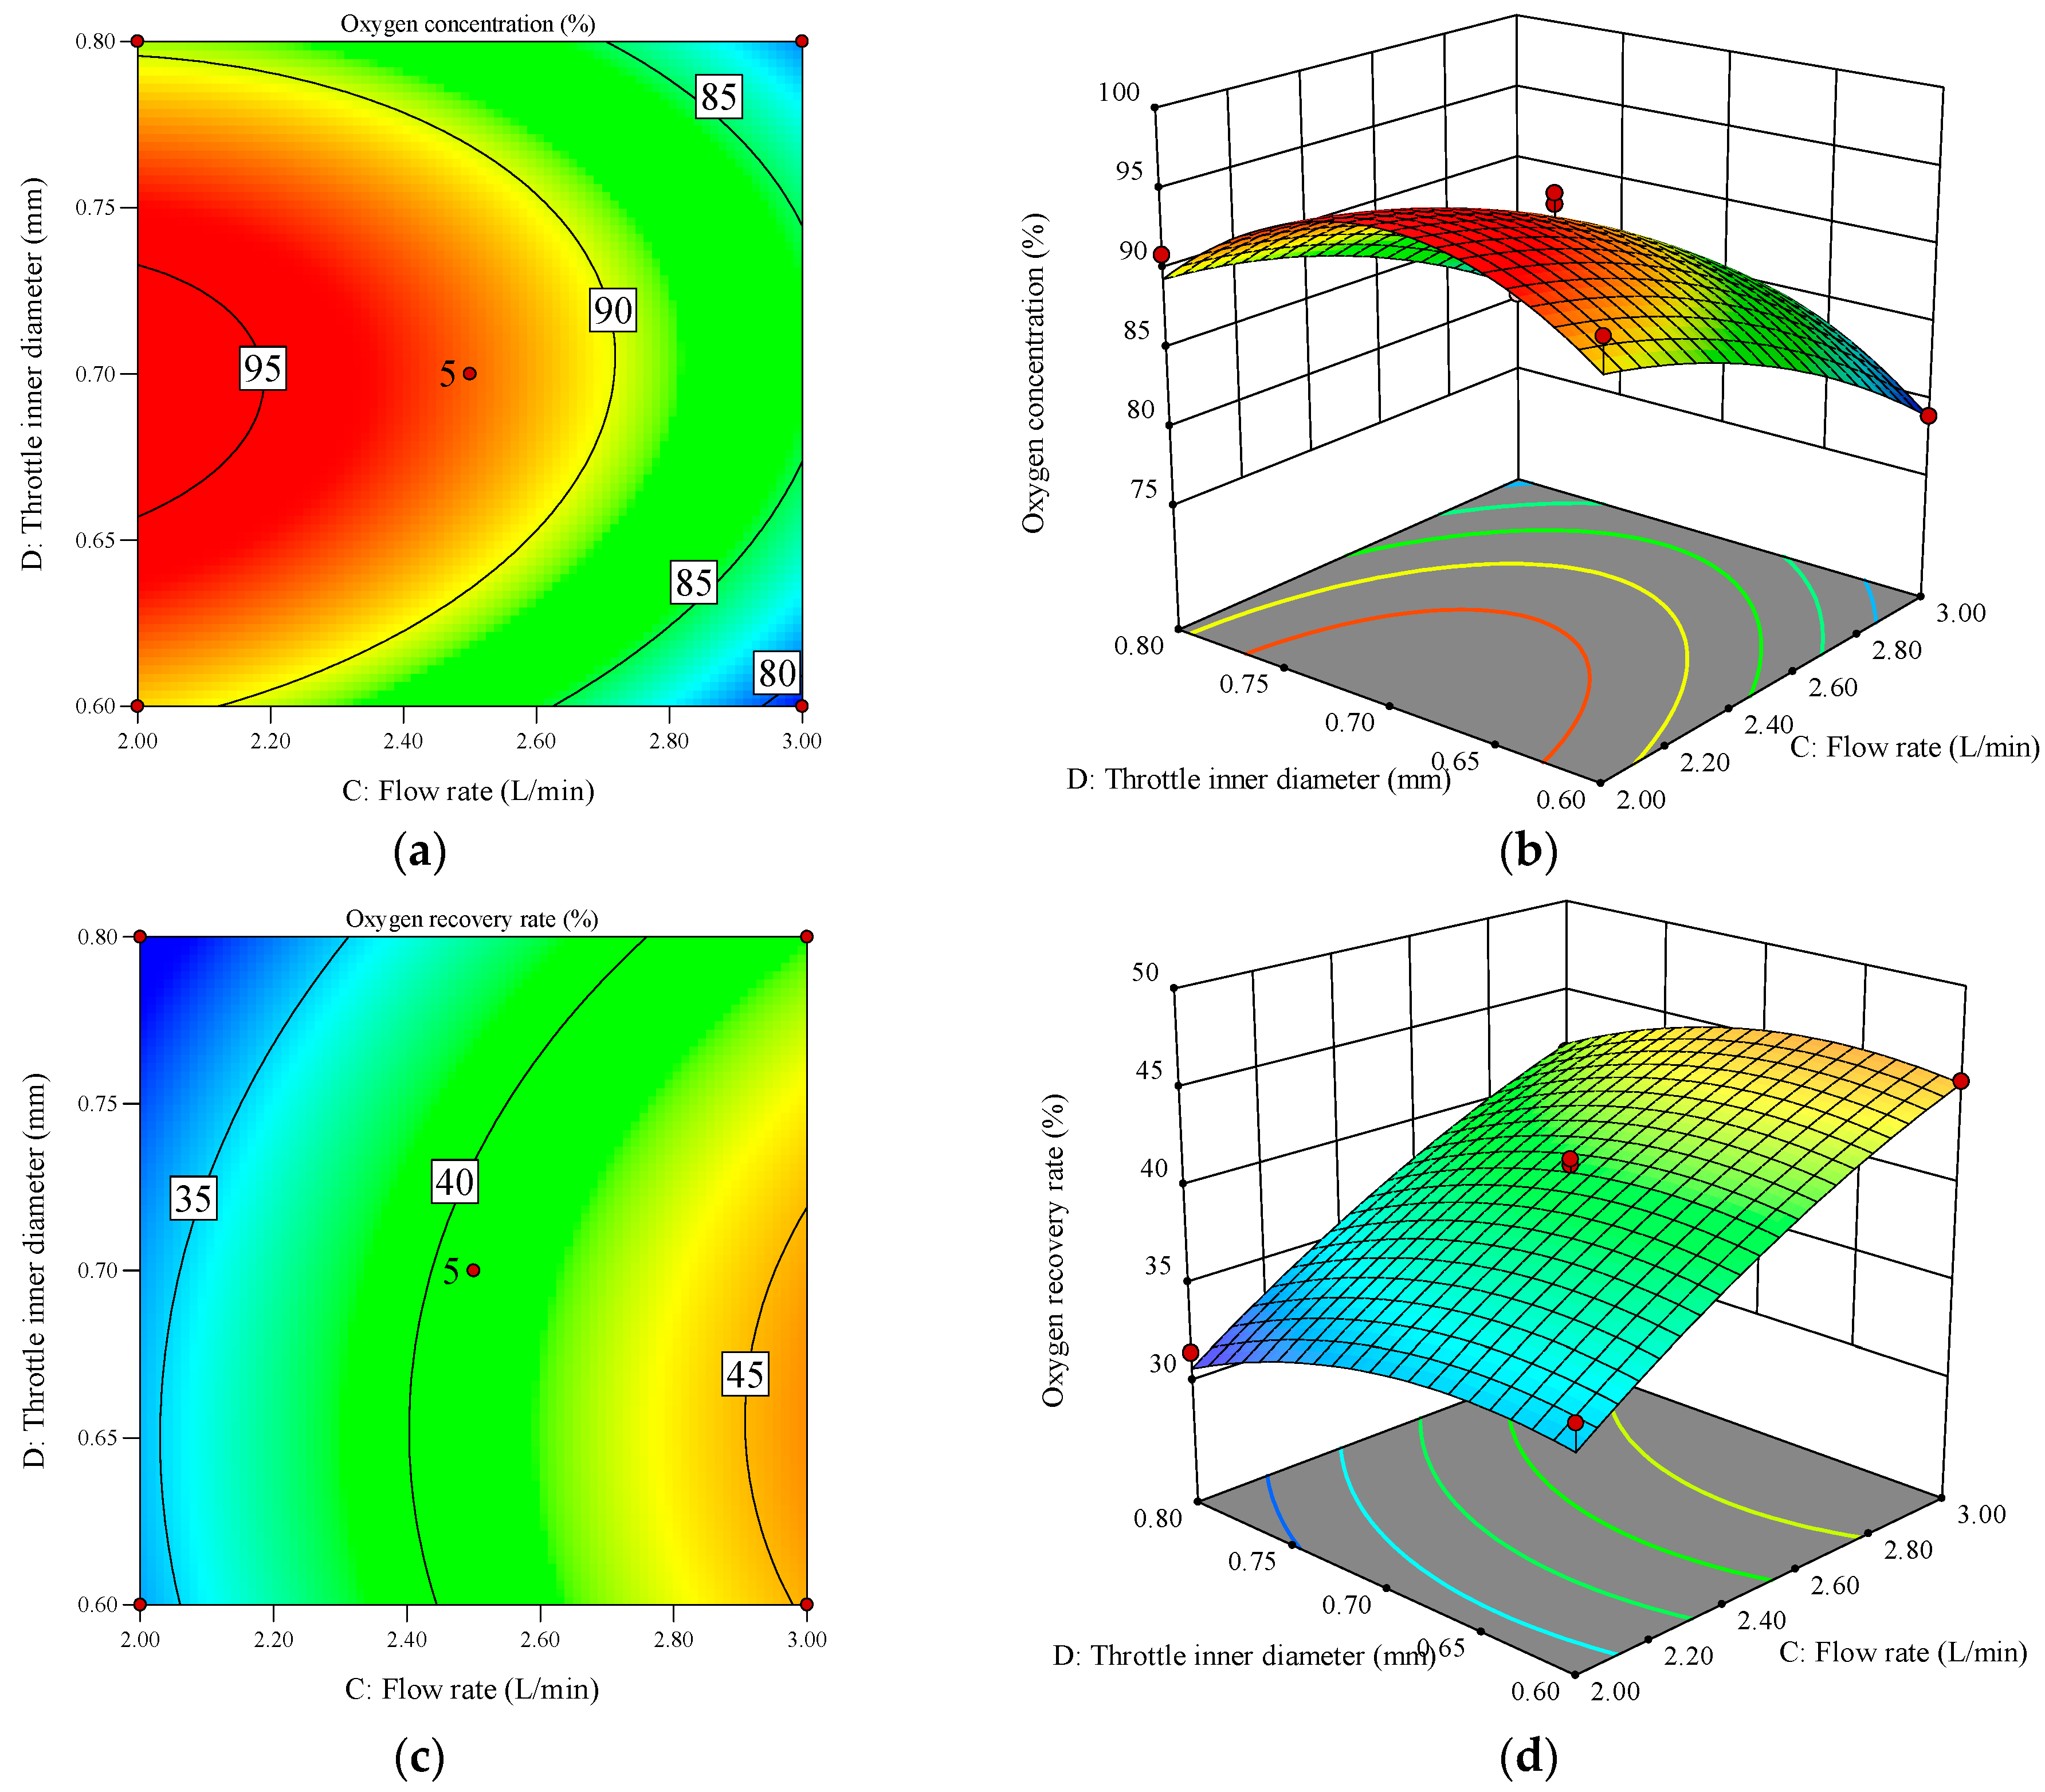
3.5.2. Response Surface and Contour Analysis of Oxygen Production Factors

Figure 9 shows the changes in oxygen concentration and recovery rate under the interaction of adsorption time and pressure equalization time. The research results indicate that, under a specific pressure equalization time, the oxygen concentration will experience a trend of first increasing and then decreasing due to the delay of adsorption time. In contrast, the oxygen recovery rate will continue to rise. On the other hand, while the adsorption time remains constant, the oxygen concentration will also show a trend of first increasing and then decreasing with the increase in equalization time, while the change in oxygen recovery rate is relatively gentle. The interaction effect between adsorption time and equalization time is insignificant for oxygen concentration and recovery rate. Furthermore, based on the analysis of the variance of the regression model mentioned earlier, the p-value of oxygen concentration AB is 0.4067, which is usually considered statistically insignificant. The p-value of the oxygen recovery rate AB is 0.3035, which is within the negligible range. This further validates the above conclusion.
Figure 10 shows the changes in oxygen concentration and recovery rate under the interaction of adsorption time and flow rate. The contour plot and response surface plot make the experimental results more intuitive. The research results show that under certain flow conditions, with the extension of adsorption time, the oxygen concentration undergoes a trend of first increasing and then decreasing, while the change in oxygen recovery rate is relatively small. At the same time, within a specific adsorption time range, the oxygen concentration decreases as the flow rate increases while the oxygen recovery rate continues to increase. It is worth noting that in the figure, the contour density in terms of flow rate is higher than that of adsorption time, indicating that the influence of flow rate on oxygen concentration and recovery rate is relatively greater. Compared to adsorption time, the flow rate has a more significant impact on oxygen concentration and recovery rate. However, the interaction effect between adsorption time and flow rate is insignificant for oxygen concentration and the recovery rate. Furthermore, based on the results of the regression model analysis of variance mentioned earlier, the p-value of oxygen concentration AC is 0.3349, which is usually considered statistically insignificant. The p-value of oxygen recovery rate AC is 0.1314, also within the negligible range. This further validates the above conclusion.
Figure 11 shows the changes in oxygen concentration and recovery rate under the interaction of adsorption time and throttle inner diameter. The research results indicate that within a certain range of throttle inner diameter, with the increase in adsorption time, when the throttle inner diameter is small, the oxygen concentration continues to increase, while when the throttle inner diameter is large, the oxygen concentration shows a trend of first increasing and then decreasing. At the same time, the oxygen recovery rate continues to increase. On the other hand, under certain adsorption time conditions, as the pore size of the throttling sub increases, the oxygen concentration shows a trend of first increasing and then decreasing, while the oxygen recovery rate continues to decrease. These results indicate that the interaction between adsorption time and throttle inner diameter has a significant impact on oxygen concentration, while the impact on the oxygen recovery rate is more significant. Furthermore, based on the analysis of variance of the regression model mentioned earlier, the p-value of oxygen concentration AD is 0.0274, which is usually considered statistically significant. The p-value of the oxygen recovery rate AD is 0.0086, which is within a highly significant range. This further validates the above conclusion.
Figure 12 shows the changes in oxygen concentration and recovery rate under the interaction of pressure equalization time and flow rate. The research results indicate that under certain flow conditions, the oxygen concentration undergoes a trend of first increasing and then decreasing with the extension of pressure equalization time. In contrast, the oxygen recovery rate changes relatively little with the extension of pressure equalization time. On the other hand, when the flow rate remains constant, the oxygen concentration will continue to decrease with the increase in the flow rate. In contrast, the oxygen recovery rate will continue to increase with the flow rate increase. These results indicate that the interaction between pressure equalization time and flow rate does not significantly impact oxygen concentration and recovery rate. Furthermore, based on the analysis of variance results of the regression model mentioned earlier, the p-value of oxygen concentration BC is 0.6549, usually considered insignificant in statistics. The p-value of the oxygen recovery rate BC is 0.5623, which is also within the insignificant range. This further validates the above conclusion. This discovery provides important clues for in-depth exploration of the interaction between process parameters in the adsorption process and their impact on system performance, which helps to optimize operating conditions further and improve production efficiency.
Figure 13 shows the changes in oxygen concentration and recovery rate under the interaction of pressure equalization time and throttle inner diameter. The contour plot and response surface plot make the experimental results more intuitive. The research results show that within a certain range of the throttle inner diameter, with the extension of pressure equalization time, the oxygen concentration shows a trend of first increasing and then decreasing. At the same time, the oxygen recovery rate continues to increase. Under a specific pressure equalization time, as the orifice size of the throttle increases, the oxygen concentration shows a trend of increasing and then decreasing, while the oxygen recovery rate first increases and then decreases. This indicates that the interaction between pressure equalization time and throttle inner diameter is insignificant for oxygen concentration and recovery rate. Furthermore, based on the results of the regression model analysis of variance mentioned earlier, the p-value of oxygen concentration BD is 0.8116, which is usually considered statistically insignificant. The p-value of the oxygen recovery rate BD is 0.9131, which is within the negligible range. This further validates the above conclusion.
Figure 14 shows the changes in oxygen concentration and recovery rate under the interaction of flow rate and throttle inner diameter. The contour plot and response surface plot make the experimental results more intuitive. The research results show that within a certain range of the throttle inner diameter, the oxygen concentration shows a continuous downward trend as the flow rate increases. In contrast, the oxygen recovery rate continues to increase. On the other hand, under certain flow conditions, as the orifice size of the throttle increases, the oxygen concentration first increases and then decreases. In contrast, the oxygen recovery rate shows a continuous downward trend. These results indicate that the interaction between flow rate and throttle inner diameter has little effect on oxygen concentration and recovery rate. Furthermore, based on the results of the regression model analysis of variance mentioned earlier, the p-value of oxygen concentration CD is 0.2556, which is usually considered statistically insignificant. The p-value of the oxygen recovery rate CD is 0.7819, also within the insignificant range. This further validates the above conclusion.

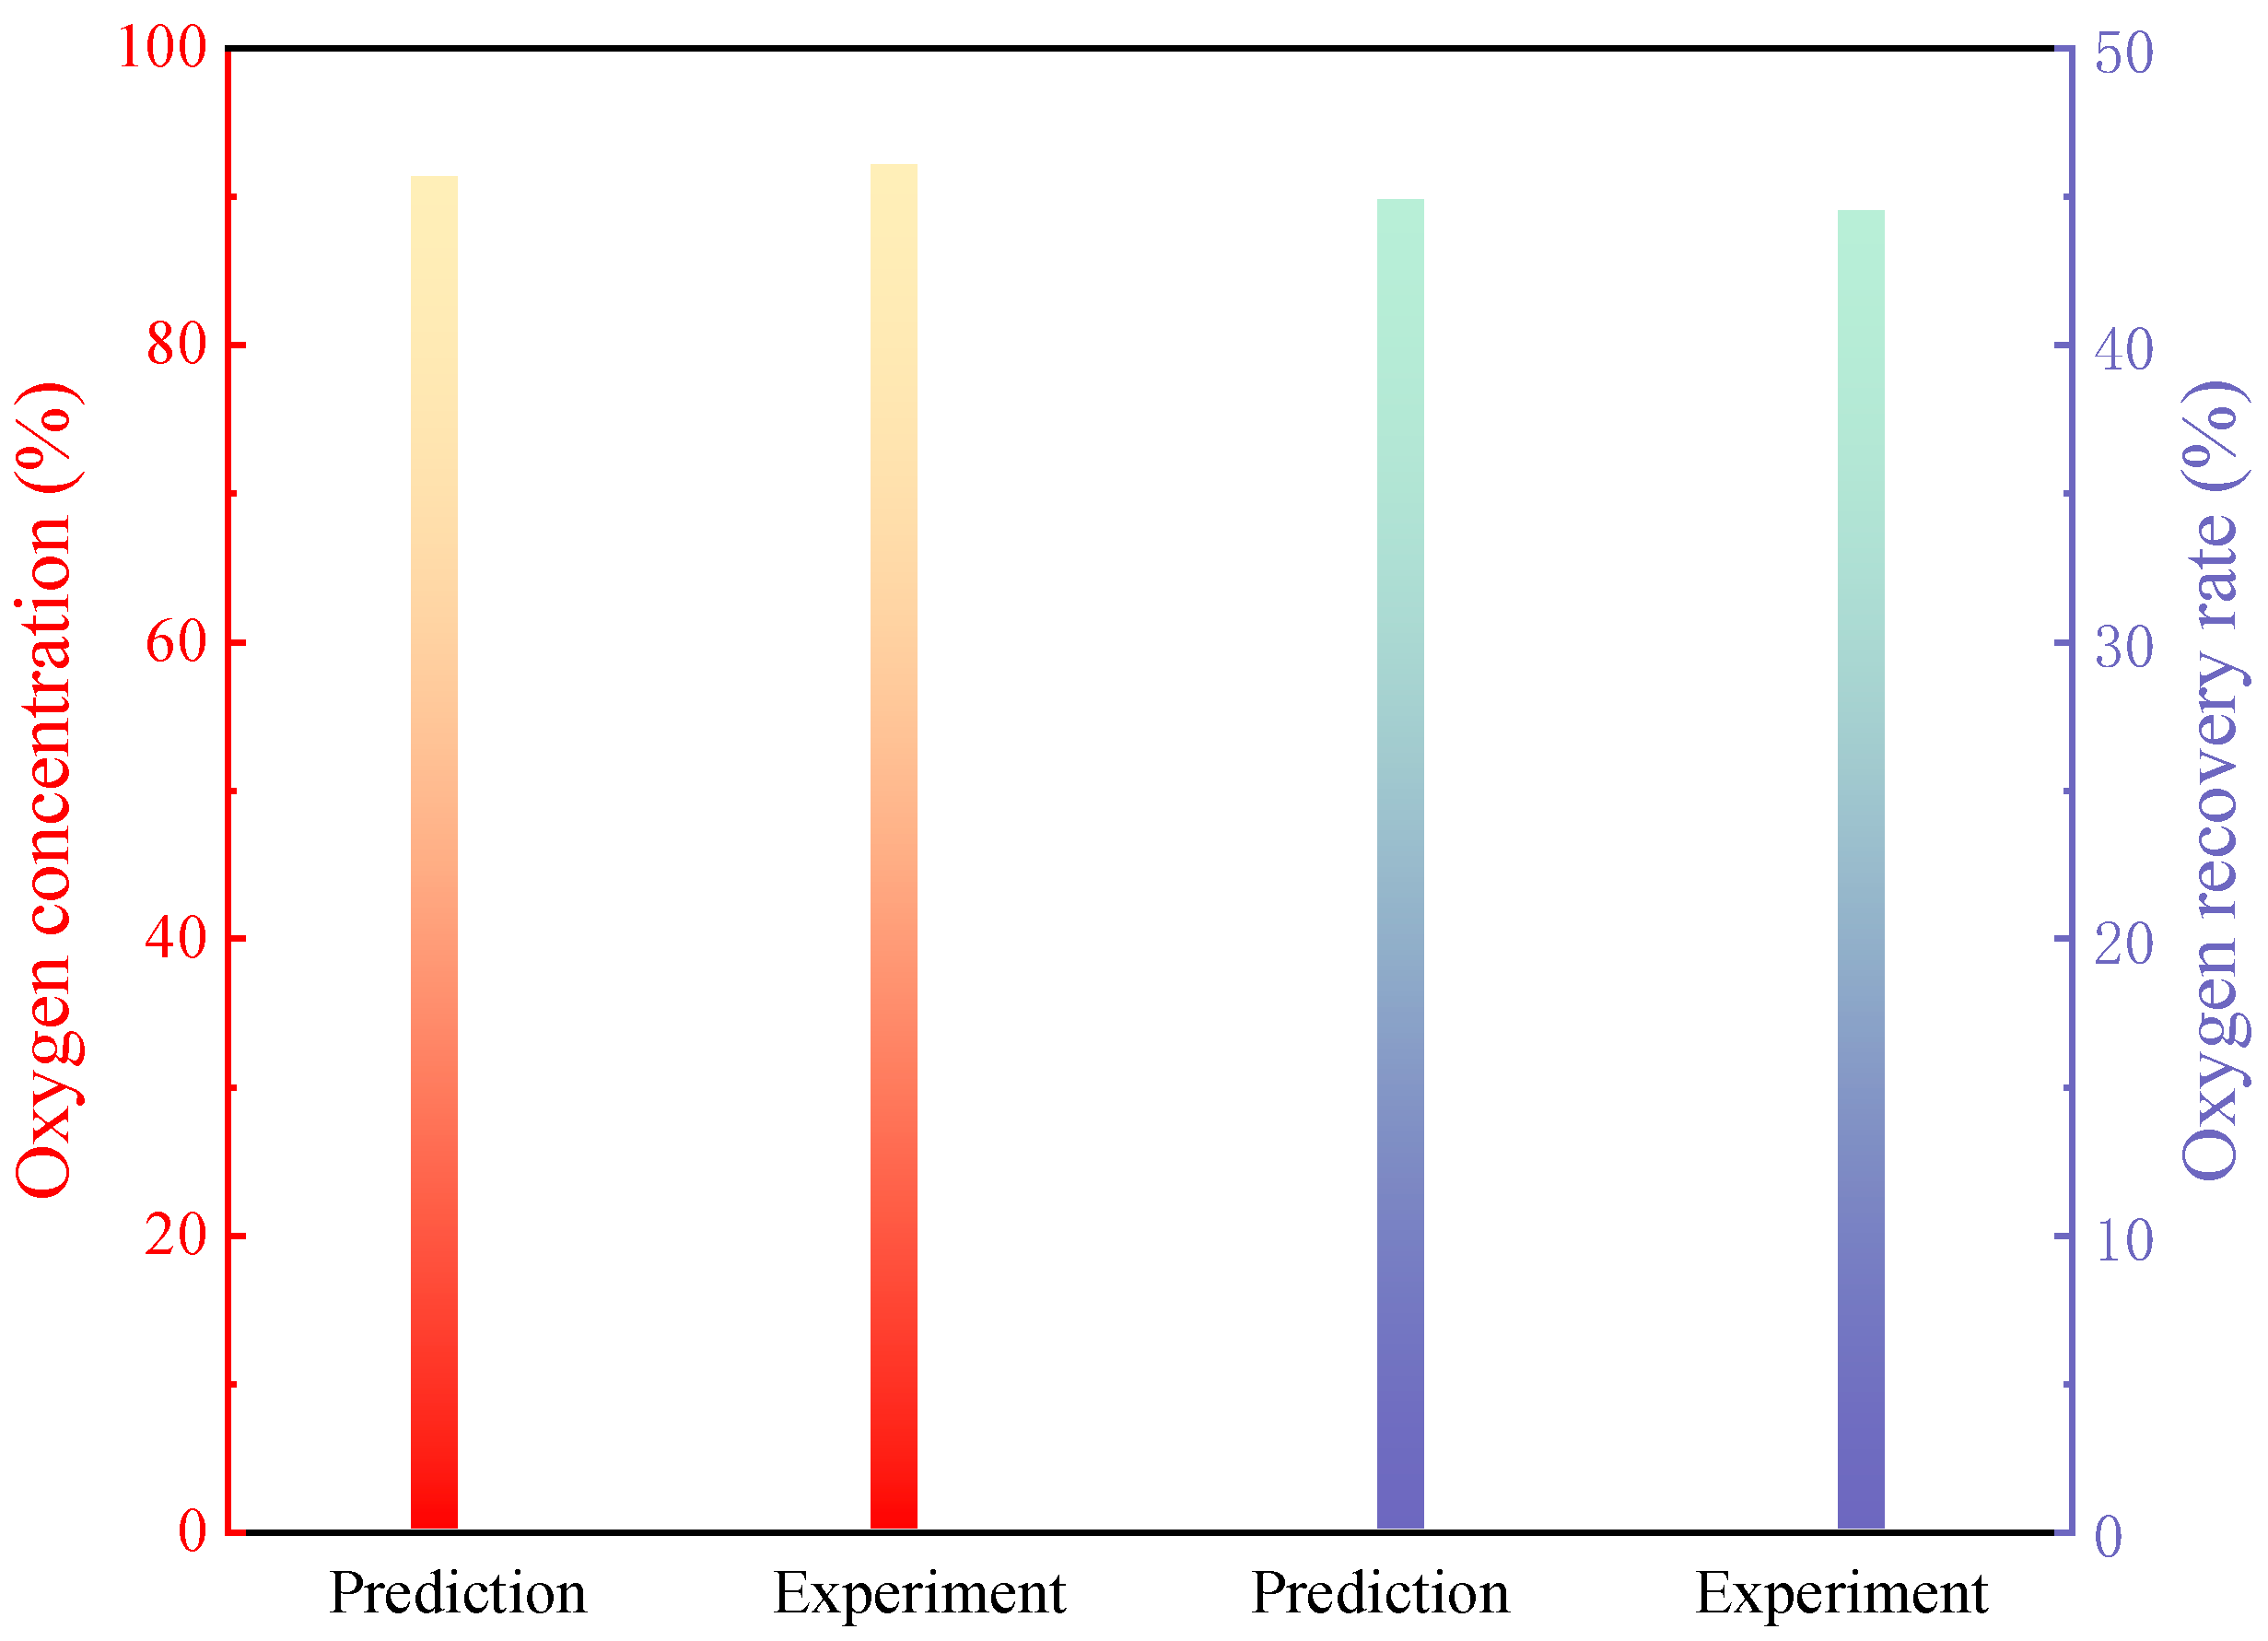
3.5.3. Optimization of Operating Conditions

Using the numerical optimization function in Design Expert, v8.0.6 software, four conditions were optimized: adsorption time, pressure equalization time, flow rate, and throttle inner diameter. The maximum oxygen concentration and recovery rate were used as the optimization conditions.
As shown in Table 8, the optimal conditions were obtained as follows: an adsorption time of 6 s, a pressure equalization time of 0.8 s, a flow rate of 2.6 L/min, a throttle inner diameter of 0.67 mm, an oxygen concentration of 91.36%, and an oxygen recovery rate of 44.89%. Using optimized conditions for validation, the experimental results are as follows: The oxygen concentration is 92.11%, and the oxygen recovery rate is 44.51%. As shown in Figure 15, the error between the predicted results of oxygen concentration and experimental results is about 0.82%, and the error between the predicted results of oxygen recovery and experimental results is about 0.85%, both of which are less than 1%. Compared with the interactive impact analysis results of PSA process parameters based on the response surface method by Chen et al. [21], the deviation between the experimental value and the predicted value obtained in this study is also less than 1%. From this, it can be seen that the established model can predict the oxygen concentration and recovery rate well and obtain the optimal conditions within the experimental range.

4. Conclusions

This article studies the effects of process parameters such as the adsorption time, the pressure equalization time, the product gas flow rate, and the oxygen production throttling Cv value on the performance of a vehicle-mounted PSA oxygen production device and obtains the optimal process conditions for this device. Subsequently, the response surface methodology is used to analyze the effects of different process parameters on oxygen concentration and recovery rate, and the following conclusions are drawn:
(1)
Through the optimization of single-factor processes, the onboard PSA oxygen production device can produce oxygen at a rate of 2.5 L/min with an oxygen concentration of 93.48%. At this point, the optimal process parameters for the system are: an adsorption time of 5 s, an equalization time of 0.7 s, and a Cv value of 7.58 for the oxygen-producing throttle.
(2)
The influence of five different equalization methods on the efficiency of oxygen production through pressure swing adsorption was investigated. The efficiency of oxygen production adheres to the following order: initial upper equalization followed by simultaneous equalization > simultaneous upper and lower equalization > initial lower equalization followed by simultaneous equalization > upper equalization > lower equalization.
(3)
Utilizing the response surface methodology, the oxygen production process was optimized. In the course of the experimental study, the influence of four factors on oxygen concentration was found to be in the following order: oxygen production flow rate > adsorption time > equalization time > throttle orifice diameter. Similarly, their impact on the oxygen recovery rate was: oxygen production flow rate > adsorption time > throttle orifice diameter > equalization time. Following optimization under the constraints of maximum oxygen concentration and recovery rate, the oxygen production flow rate reached 2.6 L/min, with an oxygen concentration of 92.11% and an oxygen recovery rate of 44.51%.

Author Contributions

Y.L. (Ye Li): Writing—original draft, Writing—review and editing, Methodology, Data curation Investigation; L.Z.: Writing—original draft, Methodology, Data curation; S.L.: Conceptualization, Data curation, Writing—review and editing, Investigation; J.B.: Methodology, Data curation, Formal analysis; H.Z.: Supervision, Resources; Y.L. (Yingshu Liu): Supervision, Validation; Q.Z.: Writing—review and editing, Investigation; N.S.: Writing—review and editing, Validation; Z.L.: Investigation, Resources; S.W.: Investigation, Resources; X.Y.: Validation, Writing—review and editing, Funding acquisition. All authors have read and agreed to the published version of the manuscript.

Funding

This research was funded by National Key R&D Program of China, No. 2022YFC3005803, and Tibet Autonomous Region Science and Technology Plan project, No. XZ202401YD0004.

Data Availability Statement

Data is contained within the article.

Conflicts of Interest

Author Shuguang Li was employed by the company China Railway 20th Bureau Group Co., Ltd. The remaining authors declare that the research was conducted in the absence of any commercial or financial relationships that could be construed as a potential conflict of interest.

References

  1. Cudaback, D.D. 4-KM Altitude Effects on Performance and Health. Publ. Astron. Soc. Pac. 1984, 96, 580. [Google Scholar] [CrossRef]
  2. West, J.B. Career perspective: John B West. Extrem. Physiol. Med. 2012, 1, 11. [Google Scholar] [CrossRef] [PubMed]
  3. Buguet, A. Sleep under extreme environments: Effects of heat and cold exposure, altitude, hyperbaric pressure and microgravity in space. J. Neurol. Sci. 2007, 262, 145–152. [Google Scholar] [CrossRef] [PubMed]
  4. Kramer, A.F.; Coyne, J.T.; Strayer, D.L. Cognitive function at high altitude. Hum. Factors 1993, 35, 329–344. [Google Scholar] [CrossRef] [PubMed]
  5. Pagani, M.; Ravagnan, G.; Salmaso, D. Effect of Acclimatisation to Altitude on Learning. Cortex 1998, 34, 243–251. [Google Scholar] [CrossRef] [PubMed]
  6. West, J.B. Commuting to high altitude: Value of oxygen enrichment of room air. High Alt. Med. Biol. 2002, 3, 223–235. [Google Scholar] [CrossRef]
  7. Windsor, J.S.; Rodway, G.W. Supplemental oxygen and sleep at altitude. High Alt. Med. Biol. 2006, 7, 307–311. [Google Scholar] [CrossRef]
  8. Barash, I.A.; Beatty, C.; Powell, F.L.; Prisk, G.K.; West, J.B. Nocturnal oxygen enrichment of room air at 3800 meter altitude improves sleep architecture. High Alt. Med. Biol. 2001, 2, 525–533. [Google Scholar] [CrossRef]
  9. West, J.B. Oxygen enrichment of room air to relieve the hypoxia of high altitude. Respir. Physiol. 1995, 99, 225–232. [Google Scholar] [CrossRef]
  10. Ruthven, D.M.; Farooq, S. Air separation by pressure swing adsorption. Gas Sep. Purif. 1990, 4, 141–148. [Google Scholar] [CrossRef]
  11. Rumbo Morales, J.Y.; Ortiz-Torres, G.; García, R.O.D.; Cantero, C.A.T.; Rodriguez, M.C.; Sarmiento-Bustos, E.; Oceguera-Contreras, E.; Hernández, A.A.F.; Cerda, J.C.R.; Molina, Y.A.; et al. Review of the Pressure Swing Adsorption Process for the Production of Biofuels and Medical Oxygen: Separation and Purification Technology. Adsorpt. Sci. Technol. 2022, 2022, 3030519. [Google Scholar] [CrossRef]
  12. Chin, C.; Kamin, Z.; Bahrun, M.H.V.; Bono, A. The production of industrial-grade oxygen from air by pressure swing adsorption. Int. J. Chem. Eng. 2023, 2023, 2308227. [Google Scholar] [CrossRef]
  13. Niu, H.; Tian, L.; He, Y.; Ding, J. High altitude oxygen production and implementation of special vehicle. In Proceedings of the Man-Machine-Environment System Engineering: Proceedings of the 18th International Conference on MMESE 18, Nanjing, China, 20–22 October 2018; Springer: Berlin/Heidelberg, Germany, 2019. [Google Scholar]
  14. Song, L.; Zhao, Y.; Yan, L.; WU, Q.; MA, L. Development of vehicle-mounted medical PSA oxygen generation system for driver on plateau. Chin. Med. Equip. J. 2007, 28, 18–21. [Google Scholar]
  15. Ze-Dong, Y.; Shuai, S.; Guang-Hao, S.; Juan, L.; Kang-Ning, X.; Jing, D.; Er-Ping, L. Evaluation on application effect of onboard membrane separation oxygen generator at high altitude. Chin. Med. Equip. J. 2016, 37, 13–15. [Google Scholar]
  16. Bahgat, E.A.; Hafez, H.M.; El-Sayed, H.M.; Kabil, N.A.S. Development of a solvent-free micellar HPLC method for determination of five antidiabetic drugs using response surface methodology. Microchem. J. 2022, 179, 107446. [Google Scholar] [CrossRef]
  17. Li, J.; Jasim, D.J.; Kadir, D.H.; Maleki, H.; Esfahani, N.N.; Shamsborhan, M.; Toghraie, D. Multi-objective optimization of a laterally perforated-finned heat sink with computational fluid dynamics method and statistical modeling using response surface methodology. Eng. Appl. Artif. Intell. 2024, 130, 107674. [Google Scholar] [CrossRef]
  18. Shahidi, S.A. Effect of solvent type on ultrasound-assisted extraction of antioxidant compounds from Ficaria kochii: Optimization by response surface methodology. Food Chem. Toxicol. 2022, 163, 112981. [Google Scholar] [CrossRef]
  19. Anamu, U.S.; Olorundaisi, E.; Ayodele, O.O.; Babalola, B.J.; Odetola, P.I.; Ogunmefun, A.; Ukoba, K.; Jen, T.C.; Olubambi, P.A. Process Optimization of Spark Plasma Sintered Parameters for Ti-Al-Cr-Nb-Ni-Cu-Co High Entropy Alloy by Response Surface Methodology. Mater. Sci. Forum 2024, 1116, 85–94. [Google Scholar] [CrossRef]
  20. Lu, A.-H.; Deng, C.; Zhu, M.-F.; Deng, Y.; Shi, M.-S.; Ma, J.; Gao, W.-Y. Analyzing the PSA process of oxygen generation in plateau environment using response surface method. Appl. Chem. Ind. 2018, 47, 1175–1178. [Google Scholar]
  21. Chen, W.-H.; Chen, W.-H.; Chein, R.-Y.; Hoang, A.T.; Manatura, K.; Naqvi, S.R. Optimization of hydrogen purification via vacuum pressure swing adsorption. Energy Convers. Manag. X 2023, 20, 100459. [Google Scholar] [CrossRef]
  22. Zhang, N.; Benard, P.; Chahine, R.; Yang, T.; Xiao, J. Optimization of pressure swing adsorption for hydrogen purification based on Box-Behnken design method. Int. J. Hydrogen Energy 2021, 46, 5403–5417. [Google Scholar] [CrossRef]
  23. Zhu, X.; Sun, Y.; Liu, Y.; Sun, X.; Shi, J. Experimental performance analysis of vacuum pressure swing adsorption air separation process under plateau special conditions. Sep. Sci. Technol. 2022, 57, 2885–2893. [Google Scholar] [CrossRef]
  24. Zhang, Q.; Liu, Y.; Li, Z.; Xiao, P.; Liu, W.; Yang, X.; Fu, Y.; Zhao, C.; Yang, R.T.; Webley, P.A. Experimental study on oxygen concentrator with wide product flow rate range: Individual parametric effect and process improvement strategy. Sep. Purif. Technol. 2021, 274, 118918. [Google Scholar] [CrossRef]
Figure 1. PSA oxygen production device flowchart. 1—Air compressor; 2—2-position 5-way valve; 3—Adsorption bed A; 4—Adsorption bed B; 5—Upper pressure equalizing valve; 6—Throttler; 7—One-way valve; 8—Oxygen storage tank; 9—Pressure-regulating valve; 10—Mass flowmeter; 11—Oxygen meter.
Separations 11 00267 g001
Figure 2. Process flow diagram of PSA oxygen production unit.
Separations 11 00267 g002
Figure 3. The influence of adsorption time on oxygen production performance.
Separations 11 00267 g003
Figure 4. The influence of pressure equalization time on oxygen production performance.
Separations 11 00267 g004
Figure 5. The influence of the pressure equalization method on oxygen concentration.
Separations 11 00267 g005
Figure 6. The influence of the product gas flow rate on oxygen production performance.
Separations 11 00267 g006
Figure 7. The influence of Cv value of oxygen production throttling sub on oxygen production performance.
Separations 11 00267 g007
Figure 8. Distribution chart of actual and predicted values ((a): oxygen concentration; (b): oxygen recovery rate).
Separations 11 00267 g008
Figure 9. Contour and response surface under adsorption time and pressure equalization time ((a): oxygen concentration contour; (b): oxygen concentration response surface; (c): oxygen recovery contour; (d): oxygen recovery response surface).
Separations 11 00267 g009
Figure 10. Contour and response surface under the interaction of adsorption time and flow rate ((a): oxygen concentration contour; (b): oxygen concentration response surface; (c): oxygen recovery contour; (d): oxygen recovery response surface).
Separations 11 00267 g010
Figure 11. Contour and response surface under the interaction of adsorption time and throttle inner diameter ((a): oxygen concentration contour; (b): oxygen concentration response surface; (c): oxygen recovery contour; (d): oxygen recovery response surface).
Separations 11 00267 g011
Figure 12. Contour and response surface under the interaction of pressure equalization time and flow rate ((a): oxygen concentration contour; (b): oxygen concentration response surface; (c): oxygen recovery contour; (d): oxygen recovery response surface).
Separations 11 00267 g012
Figure 13. Contour and response surface under the interaction of pressure equalization time and throttle inner diameter ((a): oxygen concentration contour; (b): oxygen concentration response surface; (c): oxygen recovery contour; (d): oxygen recovery response surface).
Separations 11 00267 g013
Figure 14. Contour and response surface under the interaction of flow rate and throttle inner diameter ((a): oxygen concentration contour; (b): oxygen concentration response surface; (c): oxygen recovery contour; (d): oxygen recovery response surface).
Separations 11 00267 g014
Figure 15. Oxygen concentration and oxygen recovery under optimal process parameters: comparison of predicted and experimental results.
Separations 11 00267 g015
Table 1. Molecular sieve JLOX-101A specification parameter.
PropertyUnitJLOX-101A
Diametermm0.4~0.8
Table 2. Technical parameters of experimental equipment.
DeviceModelParametersSupplier
Air compressorZGK160P2-30160 W, 30 L/min, 20 PSISINC Medical Device Co., Ltd., Suqian, China
Upper pressure equalizing valveT153UD-FGDC12V, N.C.Taizhou Ours Top Pneumatic Technology Co., Ltd., Taizhou, China
2-position 5-way valveSNT-06 1LDC12V, 0.02~0.2 MPaNingbo Sinot Pneumatic Machinery Co., Ltd., Ningbo, China
Oxygen storage tank/inner diameter: 52 mm, height: 100 mm/
Throttler/0.6, 0.7, 0.8 mm/
Mass flowmeterAST10-DL0~5 L/min, ±1.0%F.S, 0.01~0.5 MPaAsert Instruments (Beijing) Co., Ltd., Beijing, China
Oxygen concentration analyzerBEE-510010~99.99%Vol, ≤±1%F.S, Xi’an Bien Electronic Technology Co., Ltd., Xi’an, China
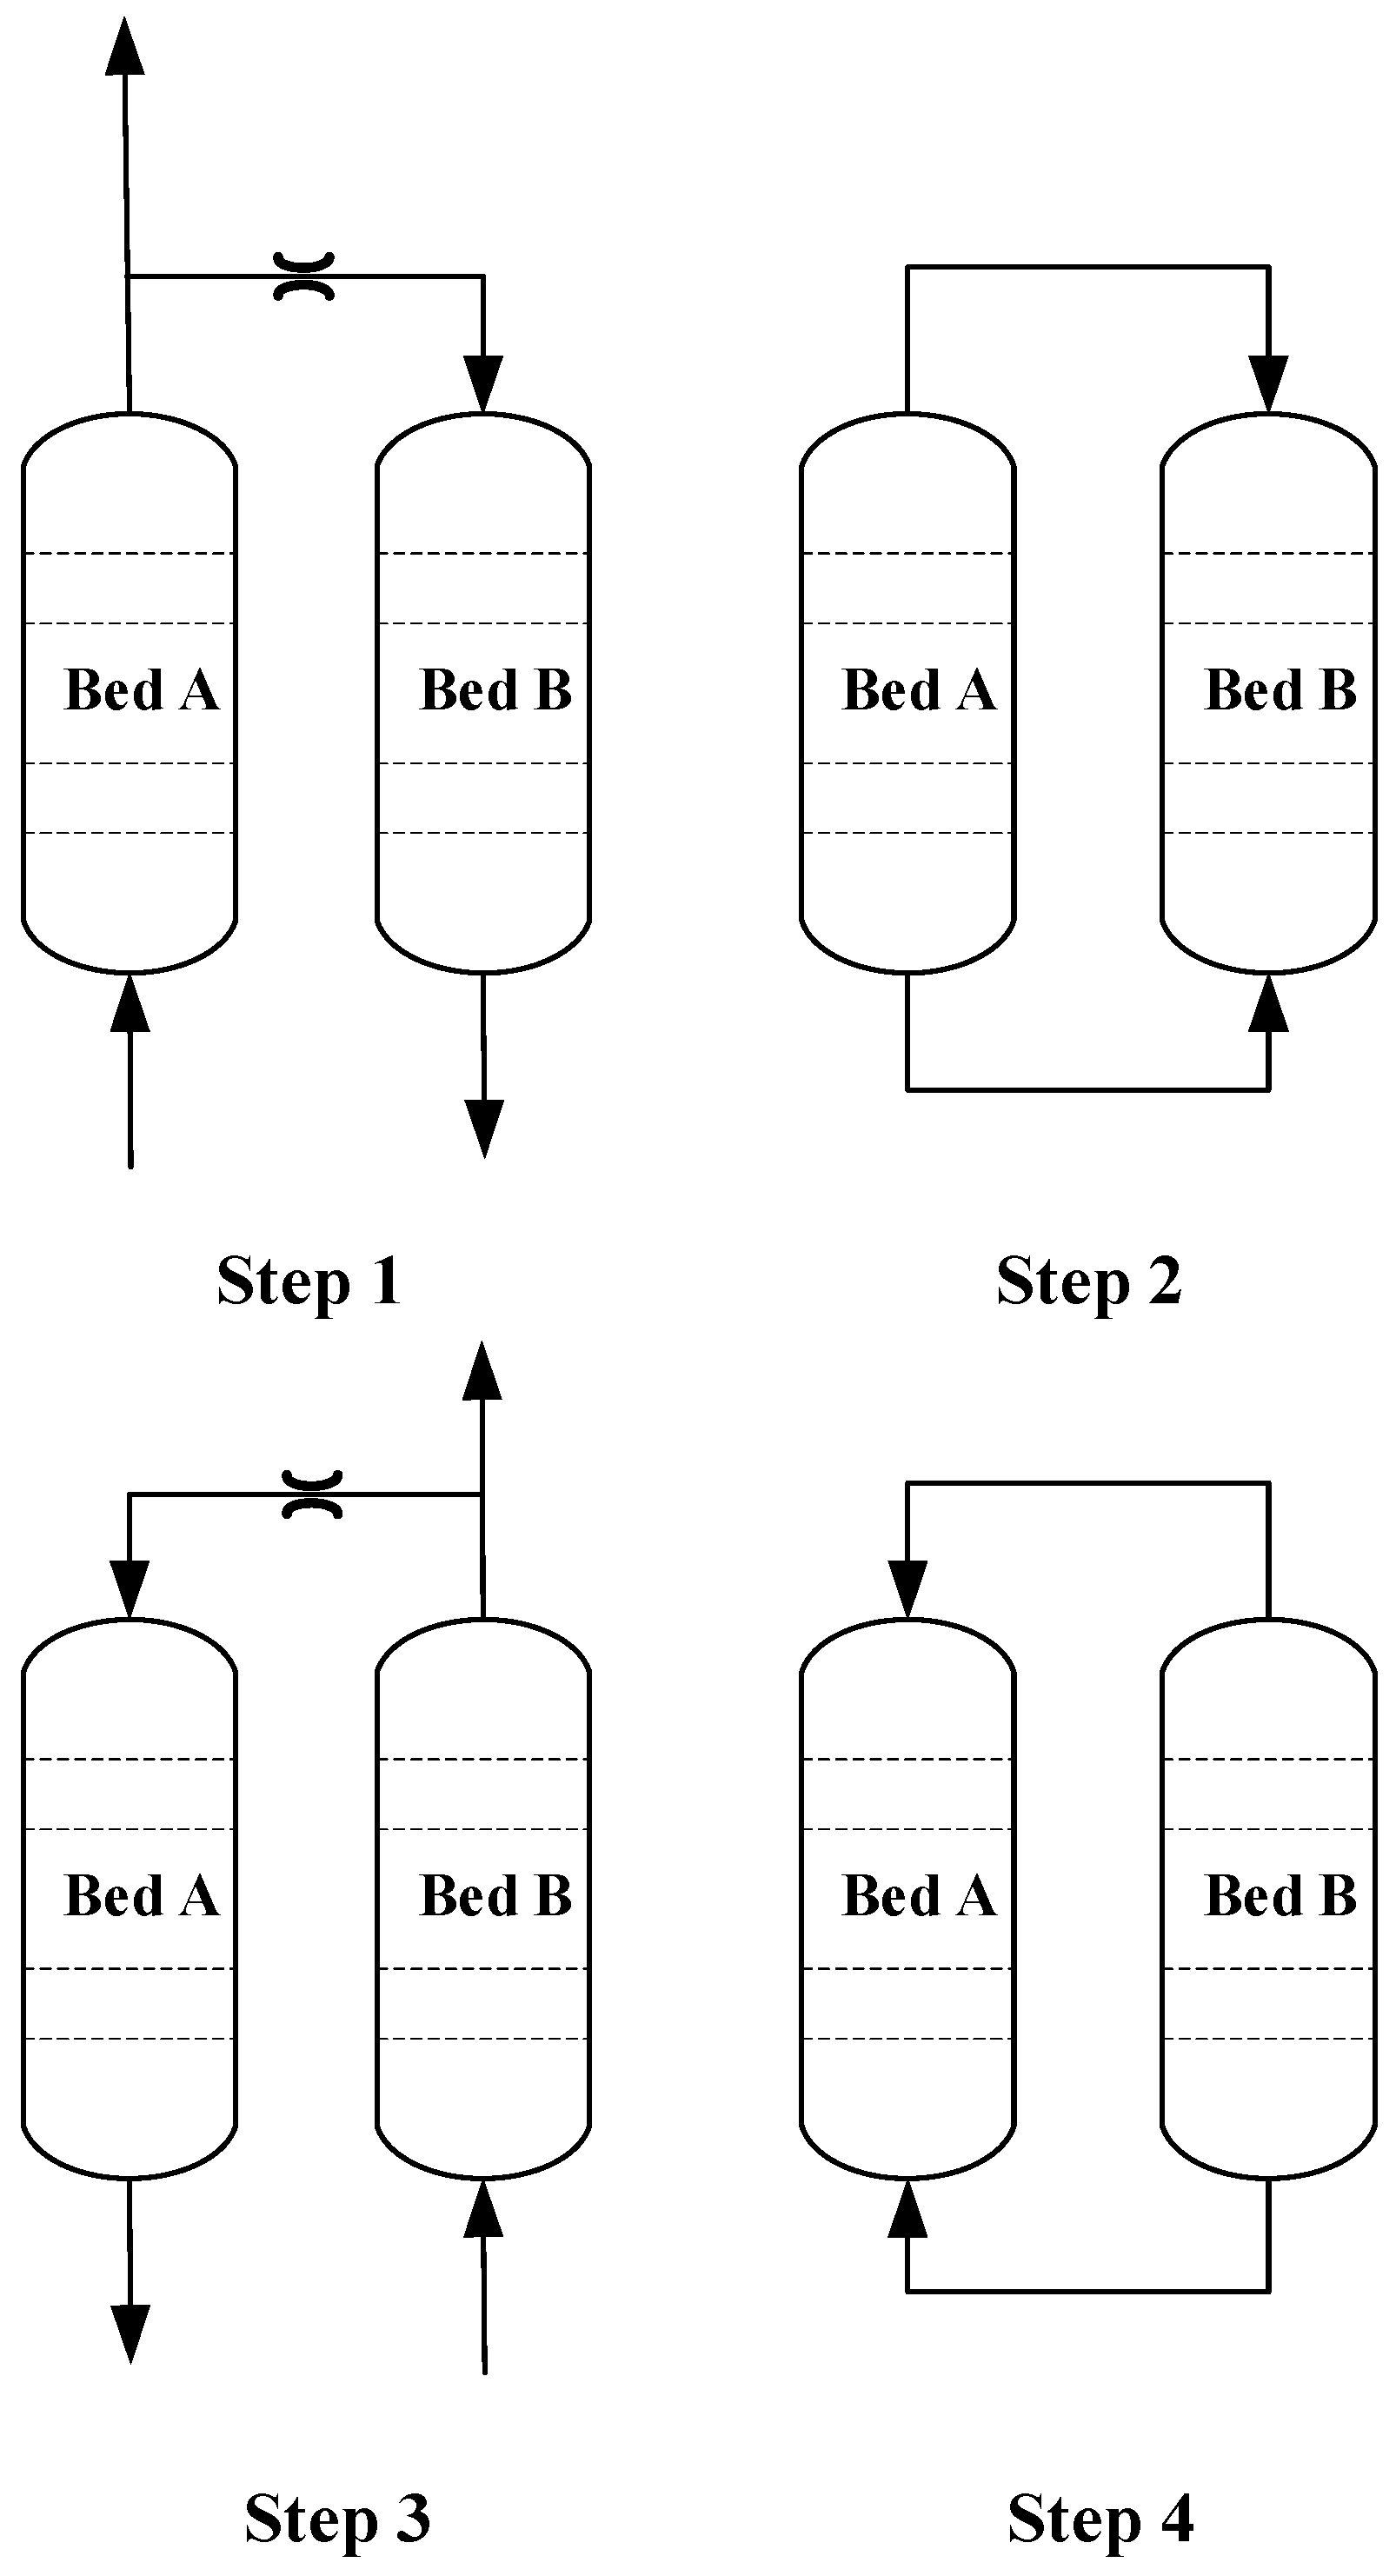
Table 3. PSA cycle sequence of steps for each bed.
Adsorption BedStep 1Step 2Step 3Step 4
Bed APressurization and adsorptionEquilibrium pressureDesorption and purge Equilibrium pressure
Bed BDesorption and purge Equilibrium pressure Pressurization and adsorption Equilibrium pressure
Table 4. The various response factors and levels in the response surface.
FactorLevel
−101
Adsorption time (s)456
Equalization time (s)0.60.81
Oxygen flow rate (L/min)22.53
Throttle inner diameter(mm)0.60.70.8
Table 5. Multi factor experimental design scheme and experimental results.
Experiment NumberABCDOxygen Concentration (%)Oxygen
1−1−10089.2237.7593
21−10091.43542.781
3−110091.2740.1605
4110091.12543.5554
500−1−192.835.4848
6001−178.9345.2718
700−119131.4098
8001180.441.6267
9−100−182.1236.8662
10100−188.844.3572
11−100186.0535.7354
12100185.9438.5812
130−1−1093.6332.9592
1401−1093.5733.6052
150−11084.4744.6021
16011085.6746.1519
17−10−1093.632.3073
1810−1093.6635.0577
19−101082.5742.7502
20101085.38547.9404
210−10−18439.3023
22010−184.0940.1929
230−10184.6836.5355
24010185.4437.5952
2500009240.4818
26000093.4141.1022
27000091.2240.1385
2800009240.4818
29000094.1141.4102
Table 6. Analysis of variance results of oxygen concentration regression model.
Source of VarianceSquare Sum SSDegree of Freedom dfMean Squared SMF ValuepSignificance
model556.731439.7720.90<0.0001**
A-Adsorption time11.05111.055.810.0303*
B-Equalization time1.1611.160.610.4480
C-Flow308.411308.41162.09<0.0001**
D-Throttle inner diameter0.6410.640.340.5713
AB1.3911.390.730.4067
AC1.9011.901.000.3349
AD11.53111.536.060.0274*
BC0.4010.400.210.6549
BD0.1110.110.0590.8116
CD2.6712.671.400.2556
A28.1518.154.280.0574
B213.51113.517.100.0185*
C221.19121.1911.140.0049**
D2213.471213.47112.20<0.0001**
residual26.64141.90
Misfit term21.09102.111.520.3649
pure error5.5541.39
Pure difference sum583.3628
Attention: p > 0.05 indicates that the model or factor is not significant: * means 0.01 < p < 0.05 indicates that the model or factor is significant ** means p < 0.01 indicates that the model or factor is extremely significant.
Table 7. Analysis of variance results of oxygen recovery rate regression model.
Source of VarianceSquare Sum SSDegree of Freedom dfMean Squared SMF ValuepSignificance
model510.71436.4362.84<0.0001**
A-Adsorption time59.38159.38102.42<0.0001**
B-Equalization time4.4714.477.710.0149*
C-Flow379.901379.90655.28<0.0001**
D-Throttle inner diameter33.30133.3057.45<0.0001**
AB0.6610.661.140.3035
AC1.4911.492.570.1314
AD5.3915.399.300.0086**
BC0.2010.200.350.5623
BD7.155 × 10−317.155 × 10−30.0120.9131
CD0.04610.0460.0800.7819
A20.05910.0590.100.7542
B20.3610.360.620.4432
C26.3616.3610.970.0051**
D220.23120.2334.90<0.0001**
residual8.12140.58
Misfit term7.04100.702.620.1828
pure error1.0740.27
Attention: p > 0.05 indicates that the model or factor is not significant: * means 0.01 < p < 0.05 indicates that the model or factor is significant ** means p < 0.01 indicates that the model or factor is extremely significant.
Table 8. Optimal process parameter results obtained by means of prediction.
ParametersAdsorption Time (s)Pressure Equalization Time (s)Flow Rate (L/min)Throttle Inner Diameter (mm)
Values60.82.60.67
Disclaimer/Publisher’s Note: The statements, opinions and data contained in all publications are solely those of the individual author(s) and contributor(s) and not of MDPI and/or the editor(s). MDPI and/or the editor(s) disclaim responsibility for any injury to people or property resulting from any ideas, methods, instructions or products referred to in the content.

