Article

The Optimization of the Osborne Extraction Method for the Fractionation and Characterization of Oat Proteins

by
Sorel Tchewonpi Sagu
1,
Lara Talea Wiedemann
2,
Kapil Nichani
2,
Andrea Henze
1 and
Harshadrai M. Rawel
2,*
1
Institute of Agricultural and Nutritional Sciences, Martin Luther University Halle-Wittenberg, Von-Danckelmann-Platz 2, 06120 Halle (Saale), Germany
2
Institute of Nutritional Science, University of Potsdam, Arthur-Scheunert-Allee 114-116, 14558 Potsdam, Germany
*
Author to whom correspondence should be addressed.
Separations 2024, 11(9), 271; https://doi.org/10.3390/separations11090271 (registering DOI)
Submission received: 7 August 2024 / Revised: 12 September 2024 / Accepted: 14 September 2024 / Published: 17 September 2024

Abstract

:
The growing number of wheat-related allergies worldwide has resulted in a new trend towards gluten-free alternatives. In this context, alternative cereals such as sorghum and oats are attracting new interest. Given the limited data available, the question of whether these cereals are completely safe and gluten-free for allergy sufferers remains open. One of the key steps in protein research is their efficient extraction. In this work, the Osborne sequential extraction method was developed and optimized using the response surface methodology in order to fractionate oat proteins. An optimized desirability of 0.986 was achieved with an extraction time of 4.7 min, a speed of 6, and a sample/solvent ratio of 5. The corresponding optimized responses were 8.7, 4.0, and 5.1% for the extraction yields of the avenin, avenalin, and albumin/globulin fractions, respectively. Further characterization of the extracts was carried out on 24 homogeneous and commercial oat samples via LC-MS/MS, targeting six potentially allergenic proteins. The avenin-E protein featured prominently, with relative contents of 60.7, 32.2, 58.0, and 59.8% in the total extract, avenin, avenalin, and albumin/globulin fractions, respectively, while the Avenin-3, ATI-2, avenin, SSG2, and SSG1 proteins in the total extract showed levels of 16.4, 9.3, 6.6, 4.8, and 2.2%, respectively. The preliminary results of an ELISA performed on the different fractions revealed low levels of gluten (from 1.24 ± 0.14 to 3.61 ± 0.16 mg/kg), which were well below the threshold limit of 20 mg/kg. These results support the hypothesis that oats can be a safe food for people suffering from cereal-related allergies. These results open the door to further studies into the comprehensive characterization of oat proteins.

1. Introduction

Celiac disease (CD) has shown a significant rise in recent decades with an incidence of around 7.5% in recent years [1,2]. According to reporting sources, this increase in prevalence can be attributed to a confluence of factors, including a rising detection rate resulting from improved and refined diagnostic criteria and changes in dietary habits as a consequence of the globalization of food supply or the increased consumption of processed foods. Untreated, it leads to intestinal damage, the malabsorption of essential nutrients, and severe associated symptoms [1,3]. The only therapy currently available involves the strict elimination of all sources of gluten, even in trace amounts [4]. Gluten-free diet adherence is often accompanied by restricted options and nutritional limitations, potentially compromising the health and quality of life of affected individuals [5,6,7]. New interest has therefore focused on some so-called gluten-free cereals, including oats, which offer such promise for people suffering from celiac disease. Compared to other cereals, oats are regarded as nutritionally beneficial, because of their high amount of dietary fiber and water-soluble beta glucans and a positive ratio between saturated and unsaturated fatty acids, as well as their essential amino acids, antioxidants, vitamins, and minerals [8,9,10]. The traditional use of oats is primarily as flakes, bran, or rolled oats and they are also the ingredient in porridge, bread, and breakfast cereals [11]. Containing 2–7% of mixed linked β-D-glucan, oat is often also considered therapeutically useful, as an adequate daily intake of β-glucan is associated with a reduced risk of heart and coronary disease [12,13]. Nevertheless, even if non-contaminated oats are generally considered and recommended as part of a general gluten-free diet, their suitability and safety remain an open question. Significant cases have been reported where the inclusion of oats triggered immune reactions [14]. This suggests the need for further investigation into the allergenic potential of oats and, in particular, the immunoreactive potential of oat proteins in the context of celiac disease. Previous immunological studies explored the immunogenicity of various oat samples, offering a first classification of oat proteins according to their reactivity [15]. In addition, specific oat peptides with potential immunogenic properties have been identified [16].
Oat grains feature a relatively high protein content, ranging from 15 to 20% compared with other cereals such as wheat (10–13%), rice (7.5%), rye (10%), and barley (10%) [9]. Based on their solubility, cereal proteins can generally be classified into four main groups: water-soluble albumins, salt-soluble globulins, alcohol-soluble prolamins, and insoluble glutelins [17]. While most plant species accumulate prolamins as the main class of seed storage proteins, oats are exceptional in that they mainly accumulate globulins, which account for up to 50–80% of the total protein [18,19]. Both prolamins and glutelins are characterized by a high content of glutamine and proline residues in their primary sequences. They, consequently, exhibit incomplete enzymatic degradation, generating long-chain peptides. The most studied prolamines are wheat gliadins, and homologous proteins are found in barley (hordeins), rye (secalins), and oats (avenins). Gliadins can be divided into four main groups including α- (25–35 kDa), β- (30–35 kDa), and γ- (35–40 kDa) gliadins, as well as ω-gliadins (55–75 kDa). In oat, globulins are mainly present in the form of 12S globulin, which forms a quaternary structure composed of A subunits (approx. 32 kDa) and B subunits (approx. 22 kDa) linked by disulfide bonds [9]. Oat prolamins, known as avenins, account for only 4–18% of all the proteins in oat [18,20]. Avenins show a structural homology with the sulfur-rich α- and γ-gliadins of wheat, the B-hordeins of barley, and the γ-secalins of rye and contain relatively few proline and glutamine residues. Oat glutenins, also known as avenalins, account for less than 10% of the total oat protein [18]. They consist of polypeptides ranging from 10 to 90 kDa and can be subclassified into low-molecular-weight (LMW) and high-molecular-weight (HMW) subunits. Albumins are found in oats only in low quantities (1–12%), with a molecular weight of around 19–21 kDa. They consist mainly of the enzymes involved in the overall improvement of protein quality and plant defense mechanisms [9]. All the same, the composition of oat storage proteins can vary considerably between different oat varieties and origins.
Extraction is a key step for efficient protein characterization and generally requires different techniques depending on the type of protein to be extracted, in order to maximize the yields. Moreover, some analysis approaches require pure proteins, which necessitates additional effort to set up suitable purification processes to isolate the target proteins from the extracts. Particularly when working with cereal proteins, there is a need to check the distribution of the different extracted proteins while applying the traditional Osborne fractionation or the adapted versions using different solvent systems [21]. Osborne fractionation is a solubility-based classification generally used for cereal proteins that applies different solvents for the sequential extraction of albumins/globulins, gliadins, and glutenins [22]. The corresponding solvents are dilute salt/buffer solutions, aqueous alcohols, and solvents integrating reducing and disaggregating conditions [22,23].
Given the growing interest in investigating the allergenic potential of food proteins and taking into account the current state of the available literature on oat proteins, this present study was undertaken with the aim of establishing an initial protocol for the fractionation of oat proteins to later address their allergenic potential. The novelty was to perform the Osborne fractional extraction of oat proteins using a Bead Ruptor and applying for the first time the design of experiment (DoE) methodology combined with response surface methodology (RSM) to optimize the procedure. For this purpose, a strategy based on solubility, in order to isolate the avenin, avenalin and albumin/globulin fractions from 24 different oat samples, was implemented. The extraction yields were optimized using the response surface methodology and Box–Behnken design. A targeted mass spectrometry method was established to further characterize the reported potential allergenic proteins and an ELISA kit was used to check the gluten content in the extracted samples.

2. Materials and Methods

2.1. Materials

2.1.1. Biological Material

Four commercially available oat grains obtained from a local supermarket (Potsdam, Germany) and twenty homogeneous oat cultivars from different years of cultivation and different regions purchased from the Leibniz Institute for Plant Genetics and Crop Research (Gatersleben, Germany) were used for the investigations. Furthermore, wheat flour type 405 (Scheller Mühle GmbH, 85276 Pfaffenhofen-Reisgang, Germany) and whole-grain rice flour (Bauck GmbH, 29571 Rosche, Germany) were processed as the positive and negative controls for the enzyme-linked immunosorbent assay. Tables S1–S3 (Supplementary Data) provide detailed information on all the samples selected for this work.

2.1.2. Chemicals

The bovine serum albumin (BSA) used as the standard for the protein determination, α-Amylase Type XII-A from Bacillus licheniformis (40 mg of protein/mL; 557 U/mg), acetic acid, acetonitrile (LC-MS Grade), ammonium carbonate, Folin & Ciocalteu’s phenol reagent, formic acid (≥95%), iodacetamide, and potassium sodium tartrate were supplied by Sigma-Aldrich Chemie GmbH, Steinheim, Germany. The proteomics-grade trypsin, 1-propanol, ethanol, methanol, sodium bicarbonate, and urea were obtained from Merck KGaA, Darmstadt, Germany. The beta-lactoglobulin and acetone were obtained from VWR International GmbH (Darmstadt, Germany). The ammonium acetate, ammonium bicarbonate, 1,4-dithiothreitol (DTT), ultra-pure sodium dodecyl sulfate (SDS), sodium hydroxide, sodium iodide, trichloromethane, chloroform, TRIS hydrochloride, tris-(2-carboxyethyl)-phosphin hydrochloride (TCEP), and tris(hydroxymethyl) aminomethan (>99.9%) were purchased from Carl Roth GmbH + Co. KG (Karlsruhe, Germany).

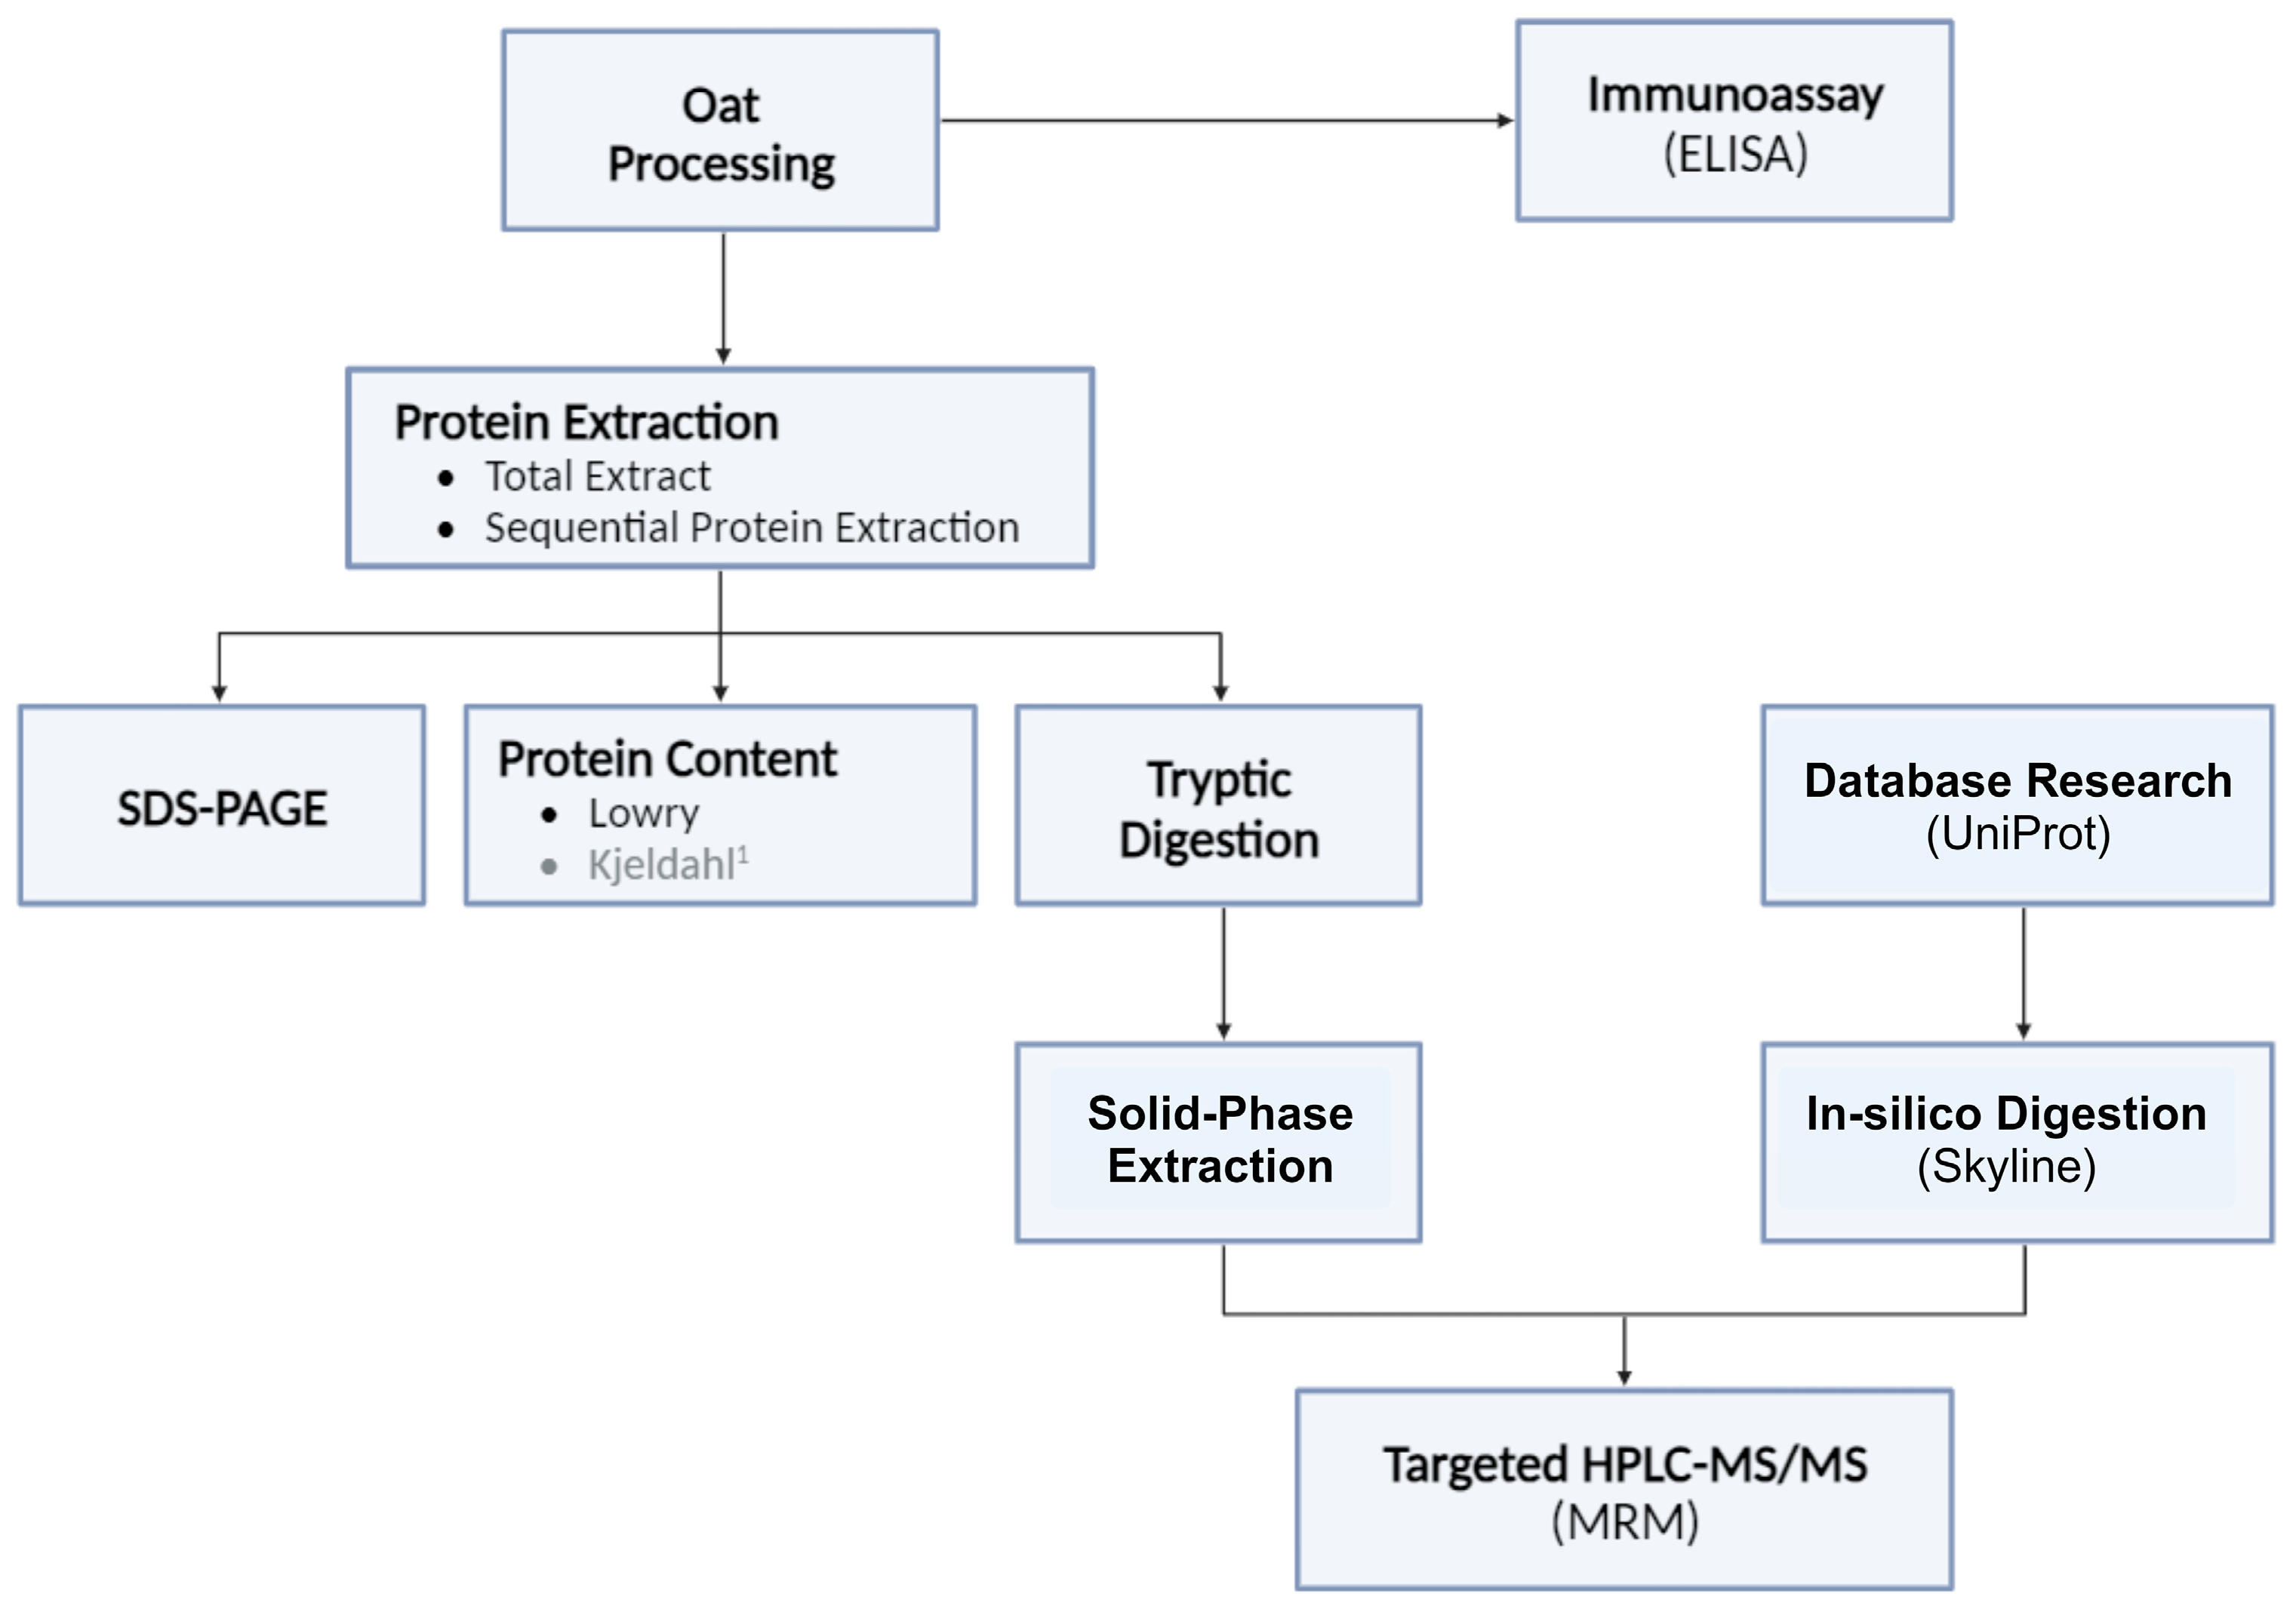
2.2. Sample Processing and Protein Extraction

All the oat samples used in this work were first dried for approximately 20 h using a Harvest Right freeze dryer, model HRFD-PMed-AQ-EU (Harvest Right, North Salt Lake City, UT, USA), in order to reduce the water content and to homogenize them. To avoid any undesirable rehydration, the dried samples were immediately ground mechanically and tightly sealed, resulting in the oat flours coded as S01 to S24. Figure 1 shows the workflow applied for the investigations.

2.2.1. Osborne Extraction

The Osborne method as described by DuPont et al. [23] with some modifications was used to achieve the extraction of the oat protein fractions of avenin, avenalin, and albumin/globulin. Figure S1 (see Supplementary Data) provides a schematic representation of the final optimized extraction procedure. Briefly, 10 mg of the samples were mixed with 1 mL of a solution containing 0.3 M of sodium iodide (NaI) and 7.5% 1-propanol, as well as two steel beads. The extraction was performed using the Bead Ruptor 12AS (Biolabproducts GmbH, Bebensee, Germany). After centrifugation at 4500× g and 4 °C for 10 min, the resulting supernatants were collected, and the extraction process was repeated under the same conditions. Both the supernatants were pooled, then mixed with 8 mL of ice-cold 0.1 M ammonium acetate in 100% methanol and stored at −20 °C overnight. After centrifugation at 4500× g and 4 °C for 10 min, the resulting precipitate consisted of the avenalin fraction, while the supernatant containing the albumin/globulin fraction was collected and subjected to a second precipitation using cold acetone. The mixture was stored at −20 °C for 1 h, then centrifuged at 4500× g and 4 °C for 10 min.
In the meantime, the pellets obtained from the first extraction step were further processed to isolate the avenalin fraction. To this end, the pellets were first washed with 0.5 mL of acetone and dried under a fume hood. The extraction was carried out as previously described using the Bead Ruptor with 0.4 mL of the extraction buffer consisting of 2% SDS, 25 mM of DTT, and 25 mM of Tris (at a pH of 8). After centrifugation, the supernatants were collected, and the protein precipitation was achieved by adding 3.2 mL of ice-cold 0.1 M ammonium acetate in 100% methanol.
All the obtained fractions were redissolved in 0.5 mL of 200 mM ammonium bicarbonate containing 8 M of urea. After the vortexing and ultrasonic treatment, the samples were stored overnight at −20 °C to facilitate complete dissolution. The samples were then centrifuged at 4000× g and 4 °C for 5 min, and the resulting supernatants constituting the final fractions were stored at −20 °C for the subsequent analysis.

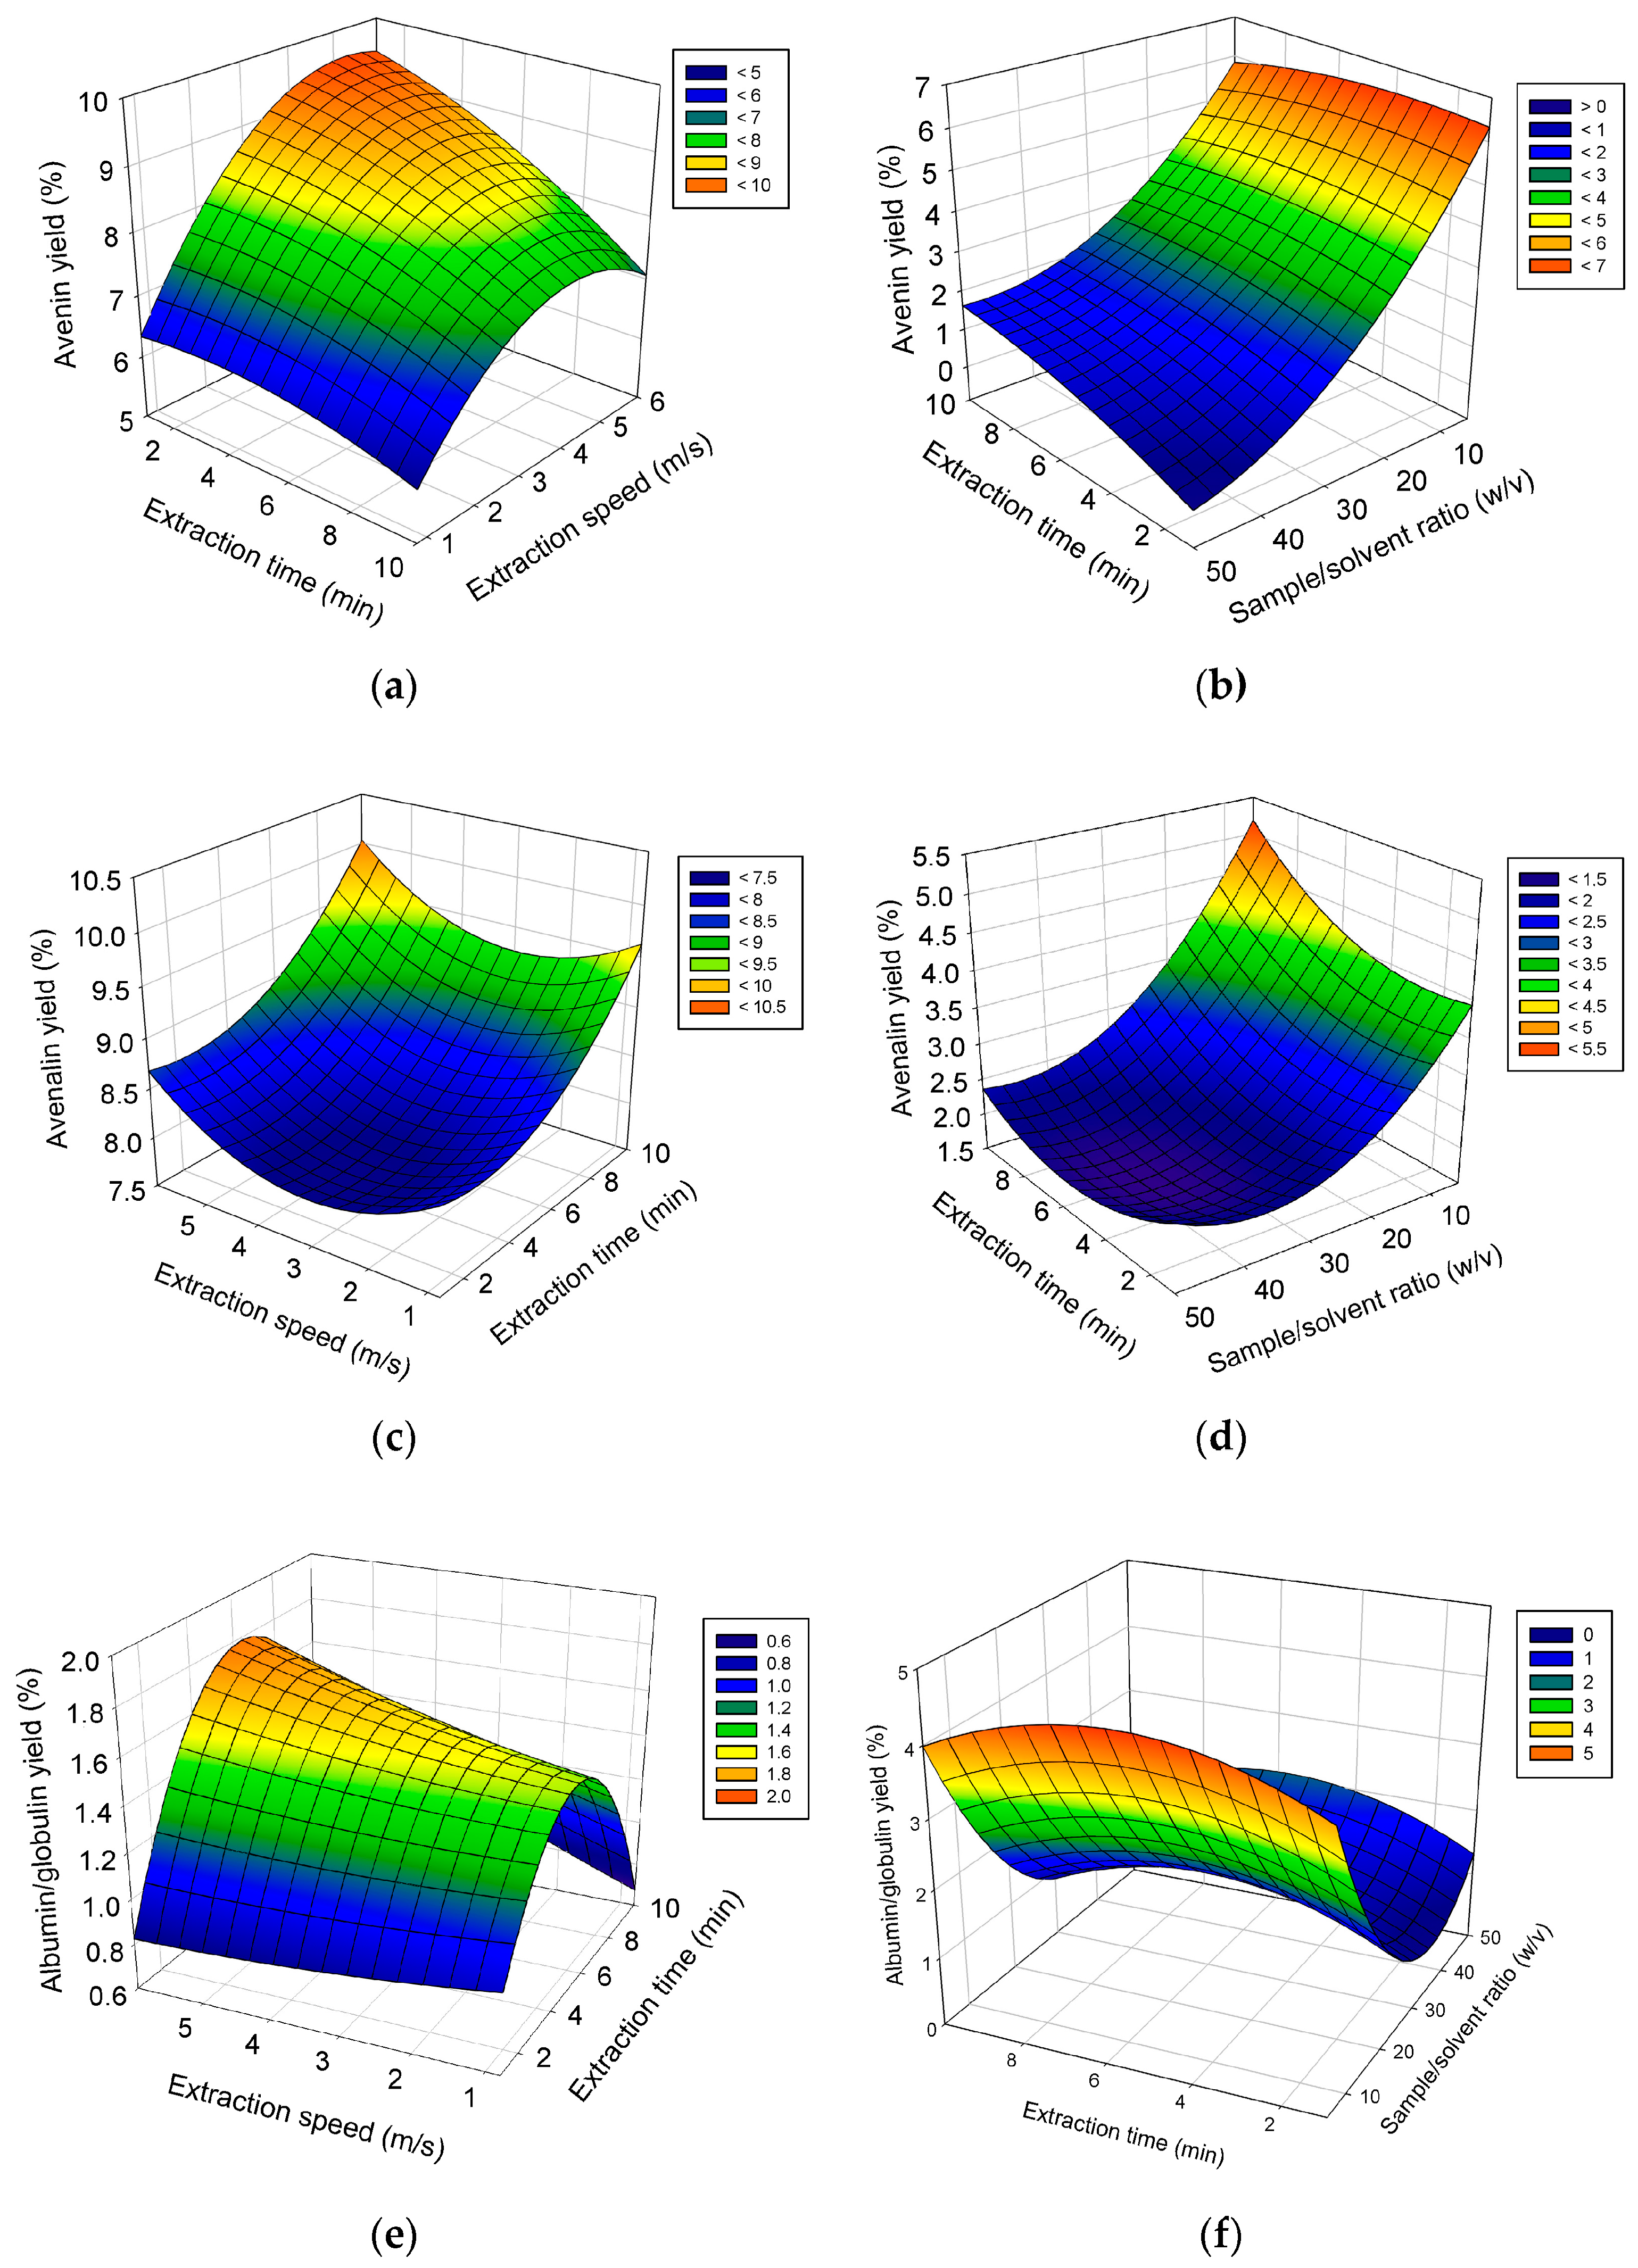
2.2.2. Extraction Optimization

In order to maximize the extraction efficiency, the process was refined and optimized using the design of experiment (DOE) and response surface methodologies [24,25]. For this purpose, based on the results from a screening study previously carried out, three parameters were identified as having the most significant effects on the extraction process and were selected for optimization: the extraction time, extraction speed, and sample/solvent ratio. The ranges of variation of the selected parameters defining the experimental domain were as follows: extraction time, 1 to 10 min; extraction speed, 0.8 to 6 m/s; and sample/solvent ratio, 5 to 50 (w/v). A Box–Behnken design was used and a complete series of 15 experiments was generated, including three replicates at the center of the experimental domain (Table S4). The investigations were performed in a randomized order and the dataset obtained was subjected to response surface methodology using the extraction yield of the avenin and avenalin fractions as the responses.

2.2.3. Total Protein Extraction

The total protein extraction was performed by mixing 10 mg of the samples with 1 mL of the extraction buffer (100 mM of ammonium bicarbonate containing 4 m of urea). After incubation under shaking conditions for one hour at room temperature, the samples were centrifuged (at 7000× g and 4 °C for 10 min), and the supernatants containing the extracted proteins were collected and stored at −20 °C for further analysis. The total extraction was carried out in order to compare the protein composition with the different fractions obtained from the Osborne extraction.

2.3. Analysis

2.3.1. Nitrogen Content

The nitrogen content was determined according to the Kjeldahl method [26] in order to quantify the raw proteins in the oat samples. A factor of 6.25 was applied to convert the nitrogen content into the raw protein content.

2.3.2. Protein Concentration

The protein concentration of the oat extracts obtained by different extraction procedures was determined by the method of Lowry et al. [27].

2.3.3. Electrophoresis

Sodium dodecyl sulfate–polyacrylamide gel electrophoresis (SDS-PAGE) was applied to elucidate the composition of the extracted proteins. The SDS-PAGE in this work was performed under reducing and denaturating conditions. Briefly, the total extracts, as well as the sequential extracts, were first mixed with the NuPAGE® LDS Sample Buffer (Thermo Fisher Scientific, Carlsbad, CA, USA) in a ratio of 1:1 (v/v), and the mixtures were heated for 5 min at 95 °C for the denaturation. After cooling down to room temperature, 5 to 20 µL of the mixtures and 5 µL of a broad range protein standard (PageRuler™ Plus Prestained Protein Ladder; 10–250 kDa) were loaded into the gels (precast NuPAGE 10% Bis-Tris gel, Thermo Fisher Scientific, Carlsbad, CA, USA). The separation was carried out at a constant current (30 mA per gel) for approximately 90 min, before the gels were stained overnight with Coomassie brilliant blue R-250 solution and destained for three to four hours in 10% acetic acid. Finally, the gels were scanned (Bio-5000 Plus VIS Gel Scanner, SERVA Electrophoresis GmbH, Heidelberg, Germany) and analyzed using Image Lab software version 6.1 (Bio-Rad Laboratories GmbH, Feldkirchen, Germany).

2.3.4. Mass Spectrometric Analysis

A targeted mass spectrometric approach was used to further characterize and quantify some potentially allergenic oat proteins using the multiple reaction monitoring (MRM) method [28,29,30].
  • Sample preparation
To yield peptides for the analysis, 0.4 mL of extracted proteins (approx. 50 to 250 µg of proteins) were first reduced at 50 °C for 20 min with 0.25 M tris(2-carboxyethyl)phosphine (TCEP), followed by alkylation with 0.25 M iodoacetamide (IAA) for a further 20 min at 50 °C in the dark. In total, 135 µL of the digestion buffer (100 mM ammonium bicarbonate) was added, together with 20 µL of 4 mg/mL proteomic-grade trypsin. The digestion was completed overnight at 37 °C, and the reaction was stopped by adding 15 µL of 40% formic acid (FA). A solid-phase extraction was then applied as the desalting and cleaning step. For this purpose, 300 mg of C18 CHROMABOND® Sorbent (Macherey-Nagel GmbH & Co. KG, Düren, Germany) were initially activated with 6 mL of 50% acetonitrile (ACN) containing 0.1% FA. After conditioning with 6 mL of bi-distilled water, the digested samples were applied onto the columns and washed with 6 mL of bi-distilled water. The peptides were eluted with 2 mL of 100% ACN containing 0.1% FA, and the volumes were adjusted to 5 mL by adding 0.1% FA through the columns. The samples were finally transferred into the vials for the analysis.
  • Method development
Seven potentially allergenic oat proteins were selected for the targeted analysis, including three avenin proteins, two seed storage globulin proteins, and two amylase/trypsin inhibitors. The sequences of avenin (ID: P27919), avenin-3 (ID: P80356), avenin-E (ID: Q09114), 12S seed storage globulin 1 (ID: P12615), 12S seed storage globulin 2 (ID: P812), Avena alpha amylase trypsin inhibitor (ID: A0A1B2LQA9), and Avena alpha amylase trypsin inhibitor (ID: A0A1B2LQD8) were downloaded from the online database UniProt Knowledgebase as FASTA files and imported into the Skyline software (version 24.1). The in silico digestion was then performed by selecting trypsin as an enzyme, zero (0) as the maximum number of missed cleavages, and carbamidomethylation of the cysteine residues as the fixed chemical modification. The peptides with 4 to 25 amino acids were selected for the analysis, excluding those containing the signal sequence. In addition, the precursors with m/z ratios of 300 to 900 with charge two (+2), as well as y and b ion types with charge one (+1), were selected. A list of peptides was generated and an additional sorting was performed manually by applying the entire oat proteome, in order to keep only specific peptides for the final analysis. For each investigated protein, the peptide with a strong and consistent response was used as the biomarker for quantification purposes, while one or two additional peptides were included during the analysis as qualifiers. The subsequent method development consisted of optimizing the instrument parameters such as collision energy. Table S5 (Supplementary Data) provides information about the analyzed proteins and their corresponding biomarkers, as well as the optimized analytical parameters.
The analysis was conducted on an Agilent triple quadrupole LC/MS (Agilent Technologies, Santa Clara, CA, USA) consisting of an autosampler, binary pump, and multi-column thermostat and operating with a quadrupole QQQ detector (G6470A). The separation was performed in gradient mode using a reverse-phase Kinetex® C8 column (Phenomenex, Torrance, CA, USA) with a flow rate of 0.5 mL/min using 0.1% formic acid as eluent A and 100% acetonitrile as eluent B. The elution program was established as follows: 95% of eluent A and 5% of eluent B from the start of the separation; then, at 12 min, 50% of eluents A and B; at 13 min, 5% of eluent A and 95% of eluent B; and then, at 17 min, the system was returned to the initial condition, maintaining a ratio of 95% of eluent A and 5% of eluent B. For each analysis, 20 μL of the previously prepared digested extracts were injected into the system.

2.3.5. Enzyme-Linked Immunosorbent Assay

The RIDASCREEN® Total Gluten kit (R-Biopharm AG, Darmstadt, Germany) was employed to further characterize the oat samples for their allergenic potential. The kit contains four different monoclonal antibodies, including the R5 antibody, which is essential for identifying the sequences potentially active for CD, and also enables the quantitative determination of the intact gluten proteins from a range of cereals, including oats. In total, 50 mg of oat samples were mixed with 0.5 mL of a specific RIDASCREEN® cocktail and 1.5 mL of 80% ethanol. The mixture was incubated for 40 min at 50 °C in a water bath, then transferred to a shaker for one hour, and finally centrifuged at 2500× g for 10 min. The supernatants were collected and diluted 1:25 (v/v) with the kit buffer. A total of 100 µL of the supplied standards and samples were then mixed in duplicate on 96-well plates and incubated for 20 min at room temperature. The wells were emptied and washed three times with 250 µL of the washing buffer supplied with the kit, and 100 µL of conjugate (a peroxidase-linked antibody) was added to the wells. After a 20 min incubation at room temperature, the wells were again emptied and washed. In total, 100 µL of the substrate/chromogen were added and incubated for 10 min at room temperature in the dark, and the reaction was stopped by adding 100 µL of the stopping solution. The mixtures were gently stirred, and the absorbance was measured within 10 min at 450 nm. The results were expressed as mg of gluten per kilogram of sample. The kit manufacturer reported the limit of detection (LOD) and limit of quantification (LOQ) to be 4 and 5 mg of gluten/kg, respectively.

2.4. Data Processing and Statistical Analysis

All the analyses were performed in triplicate and the results expressed as the mean ± standard deviation. STATGRAPHICS Plus version 5.0 software (Statgraphics Technologies, Inc., The Plains, VA, USA) was initially used to prepare the Box–Behnken design for the optimization of the sequential protein fractionation, as well as to perform the comprehensive data analysis. SigmaPlot software, version 11 (Systat Software Inc., Palo Alto, CA, USA), was used for the visualization and to prepare the response surface plots. A second-order polynomial mathematical model was generated to describe the interaction effects between the three key parameters of the extraction procedure, which were validated using the R-squared value, as well as the accuracy factor and the bias factor (Equations (1) and (2), respectively) [24].
A c c u r a c y   F a c t o r A F = 10 l o g Y i , e s t Y i , e x p N
B i a s   F a c t o r B F = 10 l o g Y i , e s t Y i , e x p N
where Y i , e s t is the estimated response calculated from the mathematical model; Y i , e x p the experimental response values; and N, the number of experiments representing the experimental design.
In addition, a one-way ANOVA followed by an unpaired t-test were used to evaluate the data from the mass spectrometry measurements and immunoassays using GraphPad Prism 8.0.1 (GraphPad Software, Boston, MA, USA).

3. Results and Discussion

3.1. Optimal Conditions for the Sequential Fractionation

In order to efficiently analyze the different oat protein fractions, the Osborne fractionation process was first optimized. The response surface methodology with a Box–Behnken design was used for this purpose, investigating the effects of the extraction time, extraction speed, and sample/solvent ratio. The experimental results are presented in Table 1. It can be observed that the extracted protein ranged from 0.308 to 1.265 mg/mL for the avenin fraction, from 0.407 to 2.789 mg/mL for the avenalin fraction, and from 0.024 to 1.195 mg/mL for the A/G fraction. Similarly, the best extraction yields of 4.9% (experiment 6), 5.8% (experiment 10), and up to 9.7% (experiment 5) were achieved for the avenalin, albumin/globulin, and avenin fractions, respectively.
The second-order polynomial models with an interaction between the factors, describing the effect of individual factors on the extraction yields of the avenin, avenalin, and albumin/globulin fractions, are presented in Equations (3)–(5). The positive values of the coefficients for the extraction time and extraction speed show that these two parameters positively affected the extraction of the avenin and albumin/globulin fractions, while all three factors contributed negatively to the extraction of the avenalin fraction.
A v e n i n   y i e l d % = 6.2 + 0.09 X 1 + 1.79 X 2 0.268 X 3 0.013 X 1 2 0.04 X 1 X 2 + 0.005 X 1 X 3 0.16 X 2 2 0.01 X 2 X 3 + 0.002 X 3 2
A v e n a l i n   y i e l d % = 5.04 0.11 X 1 0.58 X 2 0.13 X 3 + 0.023 X 1 2 0.002 X 1 X 2 + 0.003 X 1 X 3 0.08 X 2 2 0.001 X 2 X 3 + 0.002 X 3 2
A l b u m i n / g l o b u l i n   y i e l d % = 4.3 + 0.31 X 1 + 0.11 X 2 0.23 X 3 0.03 X 1 2 + 0.02 X 1 X 2 + 0.0002 X 1 X 3 + 0.004 X 2 2 0.006 X 2 X 3 + 0.003 X 3 2
An analysis of variance (ANOVA) was performed to validate the models, and the summarized results with the F-values and p-values are presented in Tables S6–S8 (Supplementary Data). R-squared values of 96.4, 93.1, and 94.4% and adjusted R-squared values (for a degree of freedom of 1) of 89.7, 80.8, and 84.4%, as well as accuracy factors of 1.05, 1.01, and 1.03 and bias factors of 1.00, 1.00, and 1.01, were obtained for the avenin, avenalin, and albumin/globulin fraction models, respectively. These statistical metrics show that overall the models generated describe more than 90% of the effects of the three investigated independent variables on the extracted protein yields. These models were further processed to generate the response surfaces illustrated in Figure 2.
It can be observed that, when extracting the avenin fraction, the extraction yields remained relatively constant as the extraction times increased. On the other hand, the protein extraction performance increased with the extraction speed, up to a speed of around 4 m/s (Figure 2a). The same observation applies to the sample/solvent ratio. For example, Figure 2b shows that for an extraction time of 10 min and an extraction speed of 4 m/s, a gradual and significant improvement in extraction yields from 1.6% to 6.9% was recorded as the sample/solvent ratio decreased from 50 to 5 (p = 0.0001). The extraction of avenalin and albumin/globulin fractions yielded similar results, with an increase observed when the sample/solvent ratio was reduced from 50 to 5. In fact, Figure 2d,f show a significant increase in avenalin (p = 0.0016) and albumin/globulin (p = 0.0012) proteins with a reduction in the sample/solvent ratio, while the extraction time and speed did not significantly affect the extraction process. Furthermore, the statistical analysis indicated p-values less than 0.05 for the quadratic factor of the sample/solvent ratio when extracting each of the three fractions of avenin, avenalin, and albumin/globulin, indicating that they are significantly different from zero at the 95% confidence level. In fact, it can be argued that the protein solubility in the solution is not only dependent on the type of buffer or the composition of the medium but can also be strongly correlated with the volumes/quantities of the buffer involved. Too small volumes of solvent would lead to rapid saturation, reducing the protein extractability, while very large volumes of solvent would result in too much dilution and a low concentration of extracted proteins. These results demonstrate that the sample/solvent ratio is the critical parameter to be monitored during the extraction process and therefore needs to be optimized.
To this end, a numerical optimization was carried out. The procedure consisted of determining the combination of the experimental factors that simultaneously optimized the extraction of the avenin, avenalin, and albumin/globulin fractions. The objectives of each response were defined as maximizing the desirability function by maximizing the extraction yields of the three different protein fractions. An impact of 5 was assigned to the yield of the avenin fraction, since, in the fractionation process, avenin represented the first extracted fraction. The other two fractions avenalin and albumin/globulin received an impact of 3. Within the ranges of the experiment design, an optimized desirability of 0.986 was achieved with the combination of an extraction time of 4.7 min, an extraction speed of 6, and a sample/solvent ratio of 5. The corresponding optimized responses were 8.7, 4.0, and 5.1% for the extraction yields of the avenin, avenalin, and albumin/globulin fractions, respectively.
The numerically optimized parameters were then tested in triplicate using the commercial oat samples, and the results showed relative differences of less than 5% between the experimental yields obtained for the avenin, avenalin, and albumin/globulin fractions and those obtained from the numerical optimization. The optimized extraction parameters were thus successfully validated, and the optimized process was applied to further extracting and investigating the proteins from different homogenous and commercial oat samples.

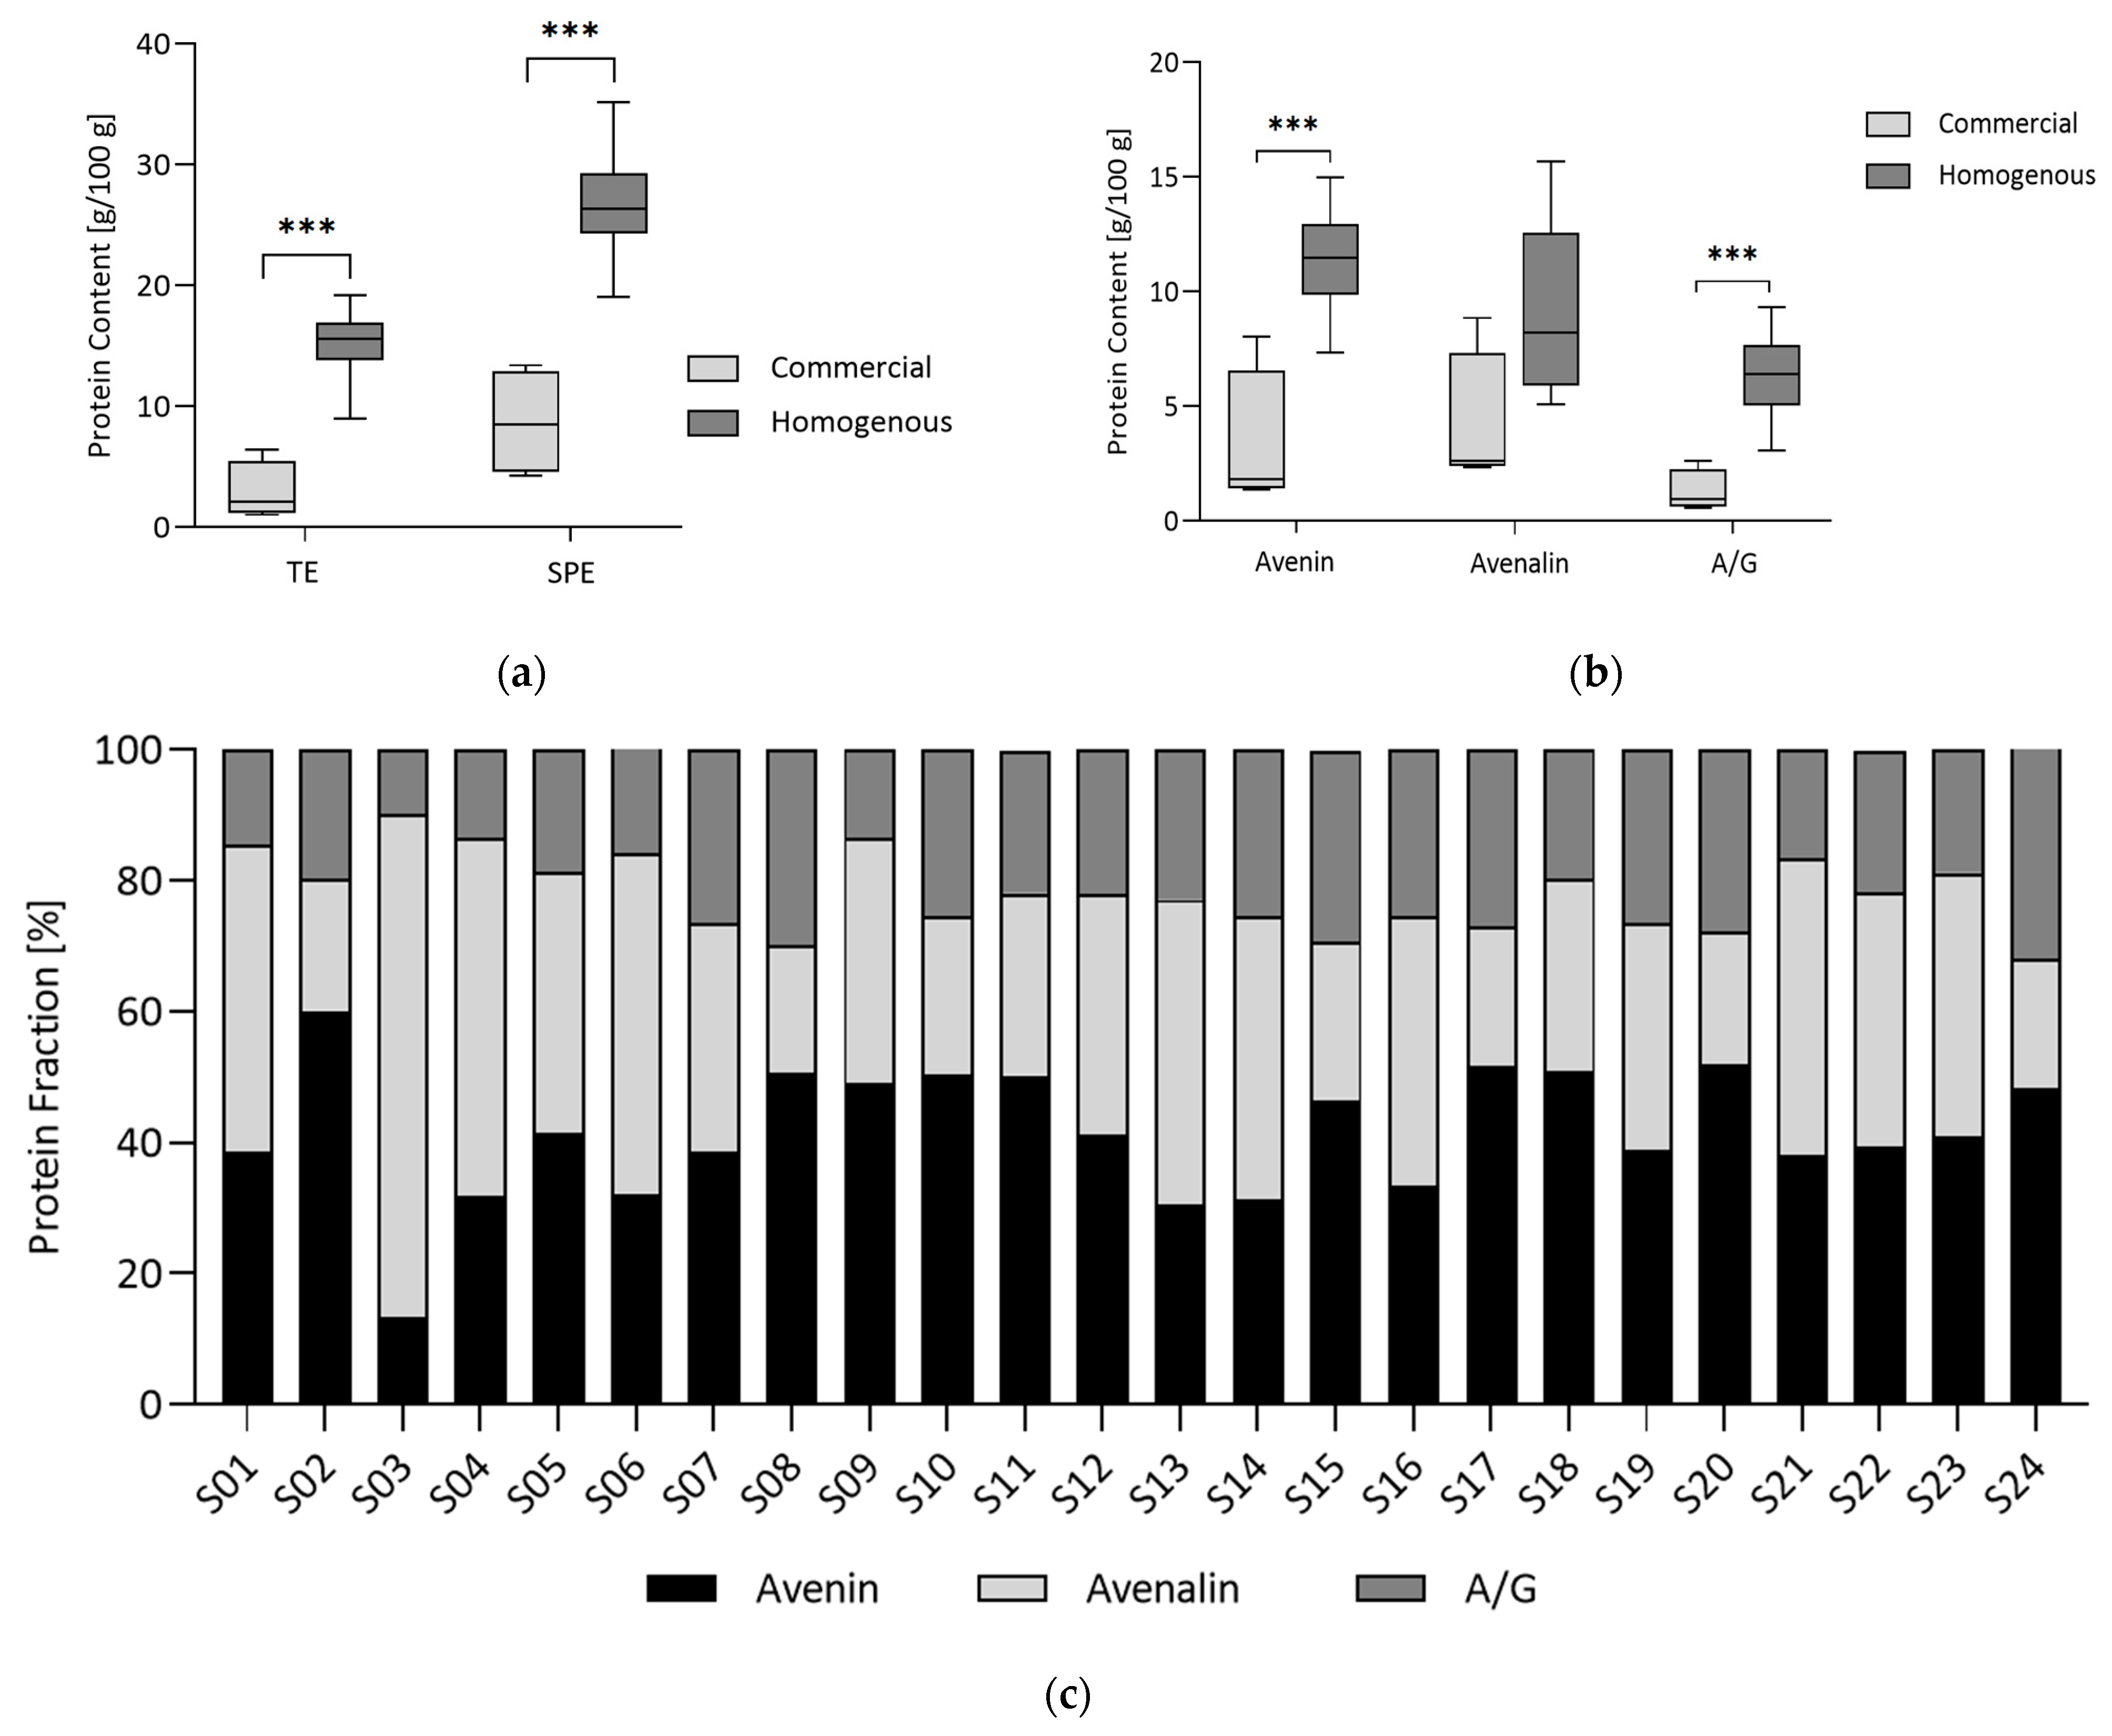
3.2. Relative Content of Avenin, Avenalin, and Albumin/Globumin Fractions in Commercial and Homogenous Samples

The optimized fractionation process was applied to extract the three Osborne protein fractions from 24 different types of oat samples including four commercially available oat grains (samples S01 to S04) and 20 homogenous oat samples obtained from the Leibniz Institute for Plant Genetics and Crop Research in Gatersleben, Germany (samples S05 to S24). Additionally, a total protein extraction was carried out using the classical method, employing an ammonium bicarbonate buffer containing urea (Ambi/urea). The protein content of the extracts was assessed using the method of Lowry et al. [27], and the results are shown in Table 2. It can be seen that the total protein contents achieved with the Ambi/urea extraction and those of the sequential extraction showed significant differences. Overall, the optimized sequential protein extraction resulted in a significantly higher protein content (p < 0.0001). With sample S03, for example, a relative protein content of 1.54 ± 0.35 g/100 g was obtained in the avenin fraction, which alone was already equivalent to the total amount of protein extracted with Ambi/urea in this sample. A sequential extraction producing higher extraction yields than the conventional Ambi/urea extraction can be explained in part by the fact that with the sequential extraction three different extraction buffers with different properties were used to specifically extract each of the three fractions, resulting in better solubility and therefore extraction yields for each of the protein fractions.
Table 2 also shows that, comparing the three fractions, the albumin/globulin fraction yielded a lower level of proteins extracted in almost all the samples, ranging from 0.57 ± 0.01 (S04) to 9.30 ± 0.06 g/100 g (S19). The content of the avenin fractions was significantly higher, with values ranging from 8.05 (S02) to 14.96 ± 0.92 g/100 g (S20), except samples S01, S03, and S04, where lower contents (2.11 ± 0.28, 1.54 ± 0.35, and 1.36 ± 0.17 g/100 g, respectively) were recorded. Finally, the protein levels in the avenalin fractions were rather more heterogeneous. A first group of samples showed low protein contents, ranging from 2 to 5 g/100 g (samples S01, S02, S04, S08, S10, S15, S17, S20, and S24); then, a second group of samples, with average protein levels ranging from 6 to 9 g/100 g (samples S03, S05, S09, S11, S12, and S18); and, finally, the last group, exhibiting protein concentration levels above 10 mg, with a high peak of 15.68 ± 0.69 g/100 g (S06). The values obtained are in the range of those mentioned in the literature [31,32].
The raw protein content was determined from two selected samples following the Kjeldahl method, and the results showed raw protein contents of 9.91 ± 0.18 and 10.12 ± 0.02 g/100 g (for samples S01 and S02, respectively). The results for the Kjeldahl protein determination tended to reflect those observed in the literature [13,18,33]. When comparing these values with the extracted protein, it emerges that the optimized fractionation procedure provided a protein recovery of 90% or more, while the conventional extraction method using the Ambi/urea buffer yielded recoveries of only 27.2 and 63.4% for samples S01 and S02, respectively.
In order to further compare the protein content and composition of the samples, the averages were taken between the commercial and homogenous oat samples, and the results are shown in Figure 3. While the total extraction of the commercial samples observed an average of 2.93 g/100 g of total protein, the sequential extraction showed an average of about 8.65 g/100 g (Figure 3a). Similarly, a higher protein content was found in the homogenous samples compared to the commercial samples, with values of 26.87 g/100 g and 15.3 g/100 g, respectively. The trend was the same when comparing the individual fractions. The homogeneous oat samples showed a much higher content of each of the avenin, avenalin, and albumin/globulin fractions, compared with the commercial samples (Figure 3b).
Figure 3c shows the relative distribution of the three extracted fractions—avenin, avenalin, and albumin/globulin—in the 24 samples analyzed. It clearly emerges that the three protein fractions were differently represented among the different oat varieties. Overall, the avenin fraction represented around 42% of the proteins contained, while the avenalin and albumin/globulin fractions averaged around 37 and 22% of the total proteins, respectively. In most samples, the avenin and avenalin fractions predominated, together representing around 80% of the total proteins. Sample S03 showed relatively high levels of avenalin (8.83 g/100 g), which alone accounted for over 77% of the total protein. Although the individual composition of the fractions showed considerable variation, there was no clear trend whereby the different distribution patterns could be explained on the basis of sample type, crop year, or origin. Nonetheless, it was striking that the commercial samples showed a particularly high avenalin content. Several references mention the albumin/globulin fraction as the most important protein fraction in oats, with the avenin and avenalin fractions representing around 20 and 10%, respectively [18,19]. Capouchová et al. [20], on the other hand, found albumin/globulin, avenin, and avenalin contents of 41, 38, and 15%, respectively. However, for the consumer, these characteristics are of limited practical relevance, as oats and oat-based products, similar to other cereals, are generally blends of different oat varieties from different years of production and very often from different origins. In this respect, the protein composition of a specific brand of marketed oats can widely fluctuate from one production to another. This could then directly affect the immunogenic/allergenic potential of oat-based products, leading to random consumer exposure, even when loyal to a specific brand. In fact, it is well known that environmental and climatic conditions can have a major impact on agricultural and therefore cereal production. As a result, the nutrient composition of a given oat producer can fluctuate from one production year to the next, directly impacting protein levels and therefore the potential allergenic proteins [34,35]. On the other hand, the type of process used for oat-based product manufacturing (thermal processing as baking or roasting, for example) could also have a direct impact on the quality or quantity of the proteins found in the final products [36,37].

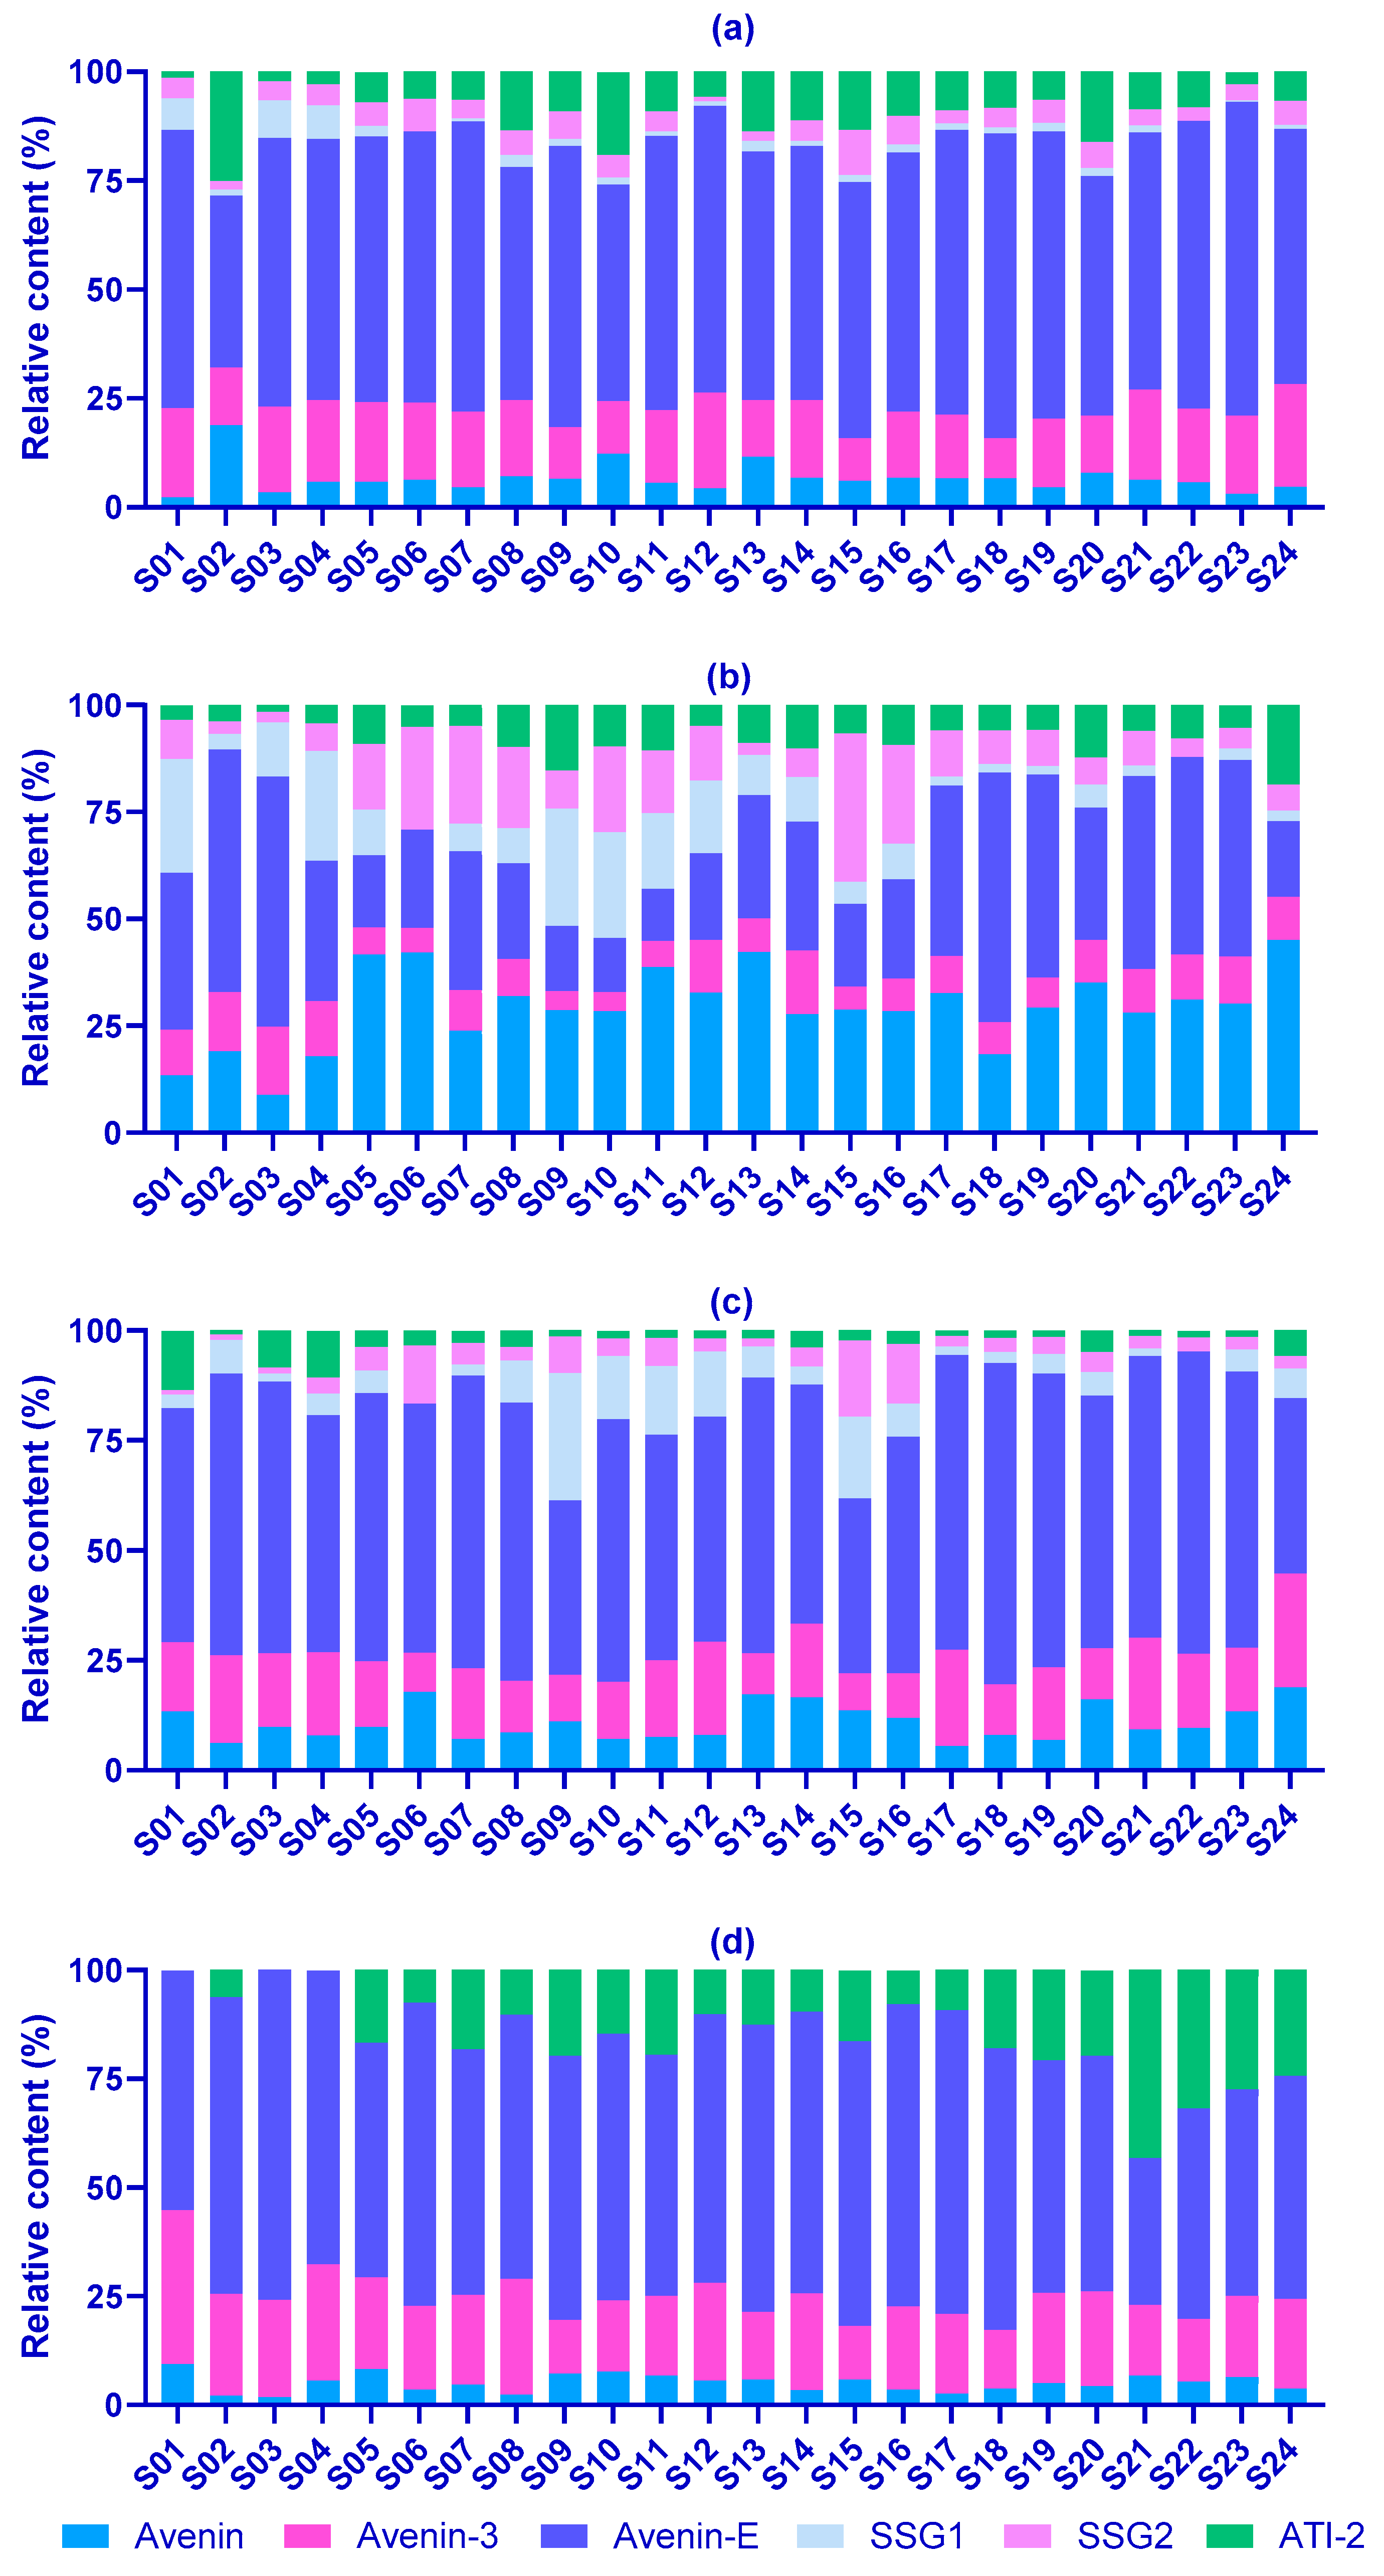
3.3. Characterization of the Extracted Proteins
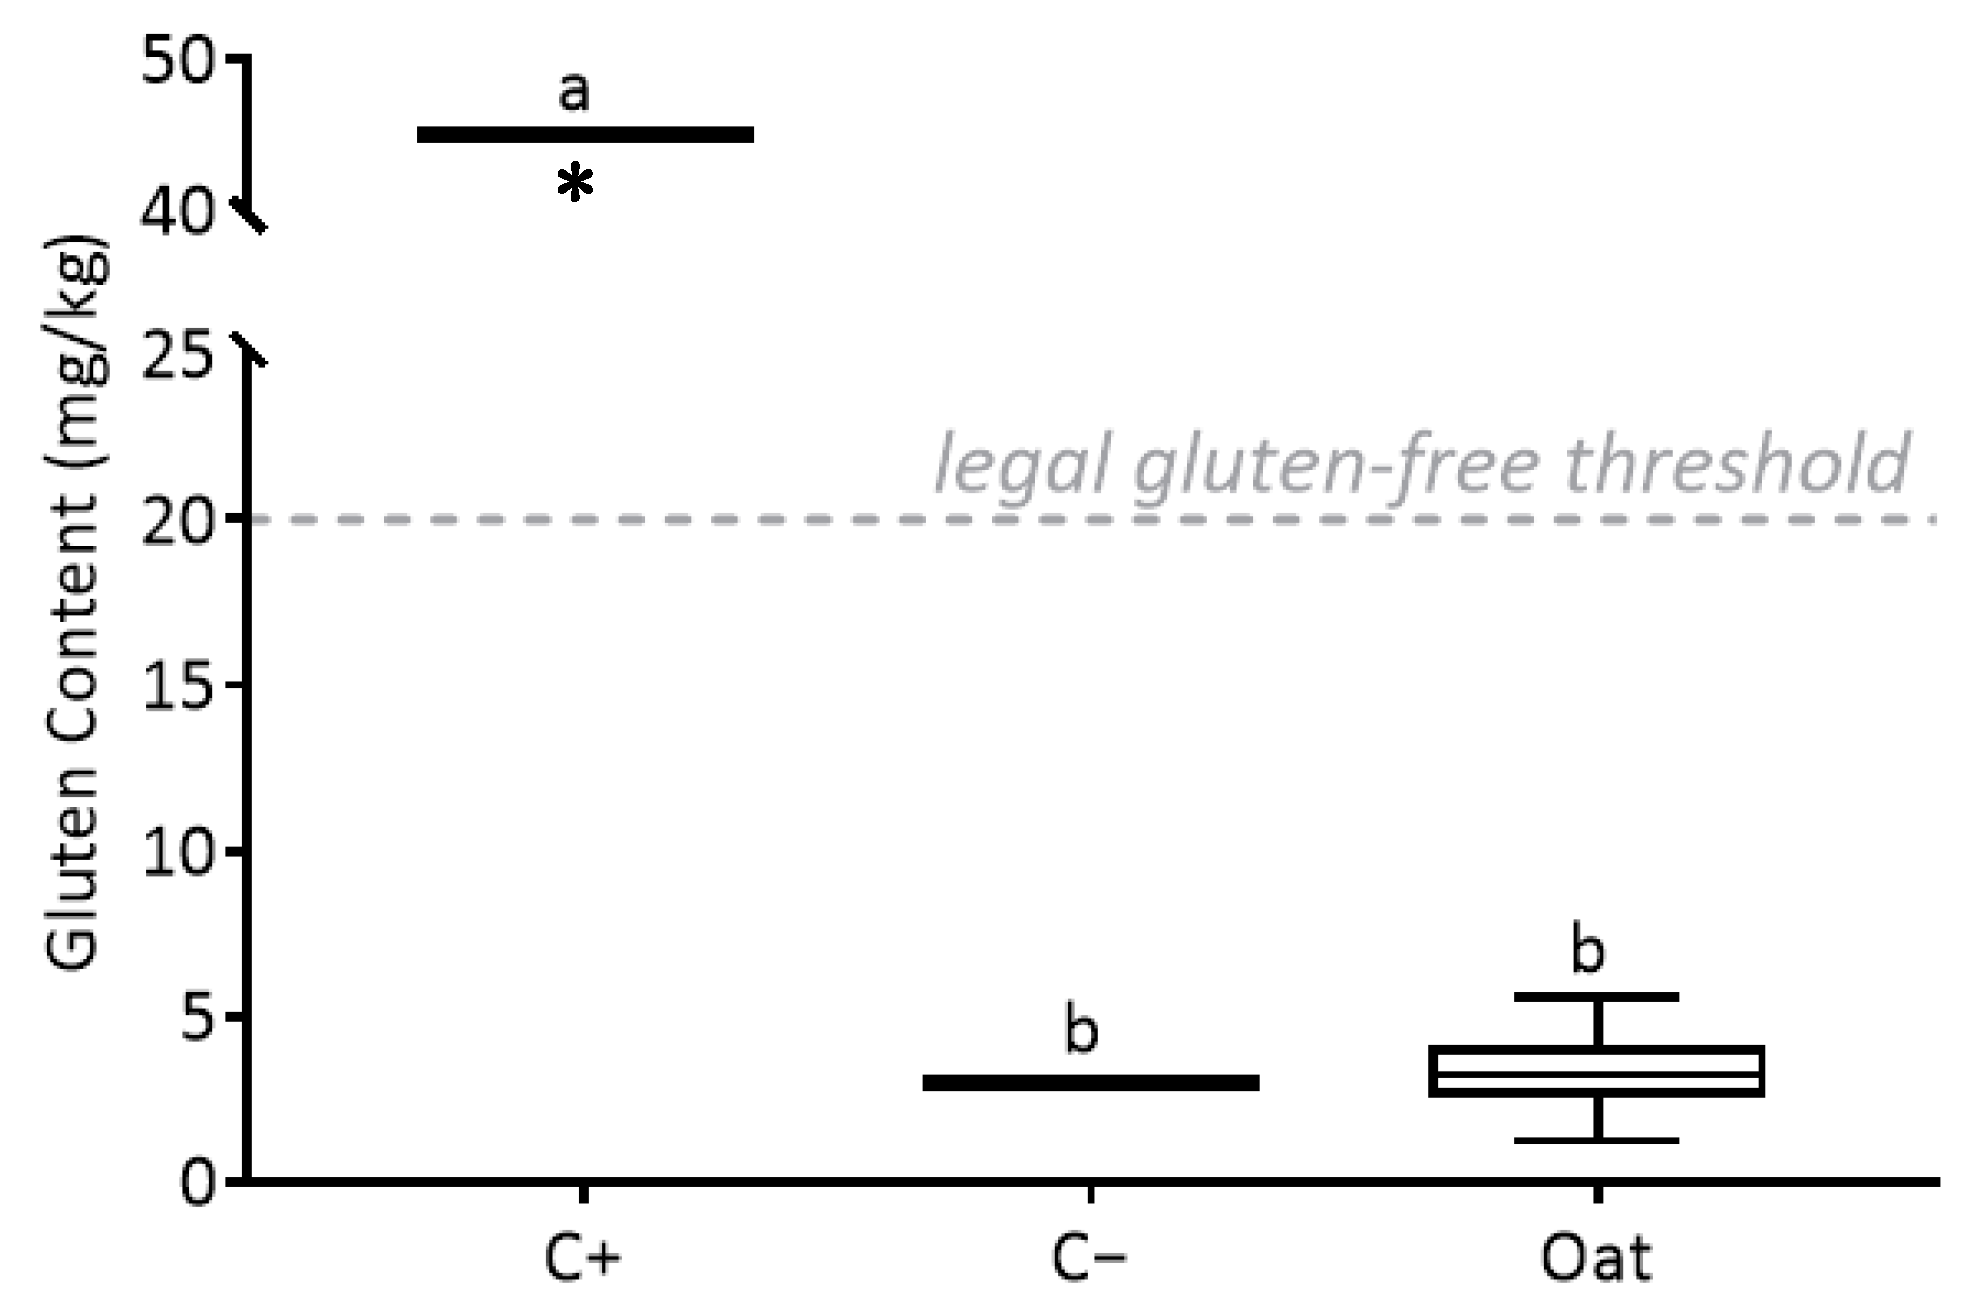
The extracts were subjected to a SDS-PAGE analysis performed under reducing conditions, as well as targeted mass spectrometry, to characterize the protein composition further. The avenin, avenalin, and albumin/globulin fractions of the four selected oat varieties (S06, S07, S13, and S14) were analyzed by the SDS-PAGE, and their protein profiles were compared with those of the total extracts from the Ambi/urea method. The results showed that all the fractions and total extracts contained a wide range of proteins with molecular weights ranging from 15 to 130 kDa (Figure S2, Supplementary Data). The ethanol-soluble avenin proteins exhibited two distinct bands with a high intensity at 55 and 130 kDa, characteristic of 12S globulin heterodimers. Other bands at the 35 and 130 kDa levels were also present. A 35 kDa protein could correspond to the A subunit of 12S globulin, while the 130 kDa protein could correspond to globulins cross-linked via disulfide bridges, like the 7S globulin with individual weights of 55 to 65 kDa [9]. The avenalin fractions showed the same distribution in all the cultivars analyzed, with two intense bands at 20 and 35 kDa and several other less intense bands with higher molecular weights. The albumin/globulin fractions, soluble in a buffered saline solution, mainly displayed small proteins with molecular weights between 13 and 35 kDa (Figure S2). The protein bands appearing at 15 and 21 kDa could correspond to 3S polypeptides, while the protein bands between 13 and 15 kDa could also indicate the presence of amylase trypsin inhibitors (ATIs), which, according to the literature, are found in the albumin/globulin fraction [9,38]. In addition, a mixture of equal parts of the three sequentially extracted fractions was analyzed, and this showed proteins covering the whole spectrum of the molecular range, comparable to the ammonium bicarbonate/urea extracts.
Targeted mass spectrometry was further applied to characterize the extracted proteins. To this end, multiple reaction monitoring (MRM) was developed to investigate six potentially allergenic oat proteins, including avenin (UniProt accession number: P27919), avenin-3 (UniProt accession number: P80356), avenin-E (UniProt accession number: Q09114), 12S seed storage globulin 1 (UniProt accession number: P12615), 12S seed storage globulin 2 (UniProt accession number: P14812), and avena alpha amylase trypsin inhibitor 2 (UniProt accession number: A0A1B2LQC9). A specific peptide producing a high and stable signal was identified for each of the analyzed proteins and used as a biomarker (quantifier) to perform a relative quantification between the samples. Table S4 (Supplementary Data) lists the different peptides selected as the quantifiers together with the corresponding optimized parameters used for their analysis. The relative composition of the 24 oat samples in term of the six proteins investigated for the total extracts, as well as the extracts from the fractionation, are presented in Figure 4.
The Avenin-E protein was found to be predominant in all the Ambi/urea extracted samples. The responses ranged from 39.5% (sample S02) to 72.0% (sample S23) when compared with the other five proteins. Avenin-3 represented 9.3 to 23.6%, while ATI-2 had high levels of 25.1, 19, and 16.1% in samples S02, S10, and S20, respectively. Avenin, SSG1, and SSG2 were the least represented proteins in all the crude extracts, accounting for 6.6, 2.3, and 4.8%, respectively (Figure 4a). This trend was similar in the avenalin and albumin/globulin fractions. Here too, Avenin-E was predominantly present in all the samples, with averages of 58.1% and 59.8% in the avenalin and albumin/globulin fractions, respectively. Avenin-3 ranged from 8.9 to 25.9% in the avenalin fractions and from 12.3 to 35.7% in the albumin/globulin fractions (Figure 4d). With the exception of samples S01, S03, and S04, while high levels of ATI-2 were recorded in the albumin/globulin fraction, culminating in a high value of 43.3% (sample S21), these levels were found to be very low in the avenalin fractions, with an average of 3.5% in all the samples (Figure 4c).
The avenin fractions showed a much more heterogeneous distribution. The results revealed that, while Avenin-E was the predominant protein in samples S01, S02, S03, S17, S18, S19, S21, S22, and S23, the protein avenin was the most abundant in samples S05, S06, S08, S11, S13, S20, and S24 (Figure 4b). Furthermore, the avenin fractions exhibited the highest levels of SGG1 (9.7%) and SGG2 (11.8%) compared with the avenalin and albumin/globulin fractions. Altogether, no clear trend could be observed regarding the probable homogeneous distribution of the six analyzed proteins in the different samples, irrespective of the extraction method used. This is even more striking when looking directly at the results in relation to the quantities of proteins extracted. It is well known that prolamins, identified as avenins in oats, are highly soluble in aqueous alcohol solutions, although there are more water-soluble proteins [9]. However, the proportion of the different fractions was disputed when the fractionation was carried out. The globulin (a saltwater-soluble fraction) proportions, for example, were found to fluctuate considerably, from 40% to 80% [39].
Considering only the six selected proteins, it can be seen that some samples yielded higher levels of the total protein than others. For example, as shown in Tables S9–S12, with the Ambi/urea extraction, samples S02 (111581 PA/µg protein), S03 (176791 PA/µg protein), S04 (96850 PA/µg protein), and S24 (93224 PA/µg protein) showed higher amounts of the six proteins combined, while samples S10, 13, 14, and S20 yielded a response almost ten times less with 18491, 25970, 29425, and 23715 PA/µg of protein, respectively. This shows that the protein levels can differ considerably according to the oat variety. Sunilkumar et al. characterized high-protein oats by investigating the genetic segregation of the high protein character and found that the protein content in 12 individual seeds from several crosses varied significantly between individual seeds from the same line [31].

3.4. Gluten Content

The RIDASCREEN® Total Gluten test, designed specifically to quantify the gluten content in cereals including oats and oat-based products, was used to quantify the gluten content using wheat as a positive control (C+) and rice as a negative control (C−). It was found that the gluten concentrations of all the analyzed oat samples were below the legally mandated gluten-free threshold of 20 mg/kg, while the wheat sample used as the positive control exhibited a gluten content exceeding this threshold, even after dilutions. It can be observed from Figure 5 that the values of all 24 oat samples ranged from 1.24 ± 0.14 to 5.61 ± 0.16 mg/kg, and the rice sample used as the negative control yielded a concentration of 2.9 ± 0.07 mg/kg. Simulated in vitro gastrointestinal digestion was performed on selected samples in order to also assess the immunoreactive potential of the peptides resulting from the digestion of oat proteins under physiological conditions. For this, samples S01 and S21 were chosen as they were found to contain higher amounts of gluten and served as representatives for the commercial oat group and the homogeneous oat group, respectively. The investigations were performed using the RIDASCREEN® Gliadin competitive immunoassay. The kit is a competitive enzyme-linked immunosorbent assay designed for the analysis of fermented and hydrolyzed foods declared “gluten-free” and enables the quantification of the peptide fragments of wheat gliadins, rye secalin, and barley hordein. In the absence of a specific kit for the analysis of oat, this analysis was carried out on a preliminary basis. However, the results obtained did not allow the proper quantification of the immunoreactive potential of the peptides resulting from digestion. Prospectively, a more suitable approach will be developed to assess the allergenic potential of the peptides derived from simulated in vitro digestion.

4. Conclusions

This study aimed to optimize the extraction and fractionation of oat proteins according to the Osborne method using the response surface methodology and to subsequently characterize the extracts in the context of the potential allergenicity of oat proteins. The extraction yields for the avenin, avenalin, and albumin/globulin fractions were then successfully maximized by optimizing the extraction time, speed, and sample/solvent ratio. It should be noted that further maximization of the extraction yields cannot be discounted with a combination of different factor levels, leading to even superior yields, thus potentially improving the method. The optimized fractionation method achieved significantly higher protein extraction compared to the classical extraction method using Ambi/urea. The discrepancies between the commercial and homogenous samples highlight a methodological efficiency while also indicating probable protein loss. Subsequently, a highly sensitive targeted mass spectrometry approach, employing the MRM technique, was meticulously developed and employed to scrutinize six oat proteins earmarked for their potential allergenicity. The results obtained from the 24 samples analyzed highlighted potential variations in terms of protein composition, both qualitatively and quantitatively. In addition, the gluten content of the samples was evaluated, and the results showed that oats contain much less allergy-prone gluten protein than wheat. Overall, the development method carried out in this work provides the basis for further investigations of oat proteins and their allergenic potential.

Supplementary Materials

The following supporting information can be downloaded at https://www.mdpi.com/article/10.3390/separations11090271/s1, Figure S1: workflow of the sequential extraction of the oat proteins based on their solubility; Figure S2: SDS-PAGE of the total extract as well as the avenin, avenalin, and albumin/globulin fractions of the selected oat samples; Table S1: an overview of the analyzed commercial whole-grain oat and oat product samples; Table S2: an overview of the analyzed homogenous oat grain samples provided by the Leibniz Institute of Plant Genetics and Crop Plant Research, Gatersleben; Table S3: an overview of the analyzed commercial wheat flour and whole-grain rice flour; Table S4: the Box–Behnken design, presenting the experimental design with the coded and the real values; Table S5: the parameters of the applied MRM method for the analyzed oat proteins; Table S6: the analysis of variance for the yield of the avenin fraction; Table S7: the analysis of variance for the yield of the avenalin fraction; Table S8: the analysis of variance for the yield of the albumin/globulin fraction; Table S9: the relative protein content of the six targeted proteins in the total extract of the 24 investigated oat samples; Table S10: the relative protein content of the six targeted proteins in the avenin fraction of the 24 investigated oat samples; Table S11: the relative protein content of the six targeted proteins in the avenalin fraction of the 24 investigated oat samples; Table S12: the relative protein content of the six targeted proteins in the albumin/globulin fraction of the 24 investigated oat samples.

Author Contributions

Conceptualization, H.M.R., S.T.S. and A.H.; methodology, S.T.S., H.M.R. and L.T.W.; software, S.T.S. and L.T.W.; formal analysis, L.T.W. and S.T.S.; investigation, L.T.W. and S.T.S.; resources, A.H. and H.M.R.; data curation, S.T.S., L.T.W. and K.N.; writing—original draft preparation, S.T.S.; writing—review and editing, H.M.R., A.H., S.T.S., L.T.W. and K.N.; and supervision, A.H. and H.M.R. All authors have read and agreed to the published version of the manuscript.

Funding

This research received no external funding.

Data Availability Statement

The authors declare that the data supporting the results of this study are available in this article and in the Supplementary Materials. The corresponding author can on reasonable request produce the raw data.

Acknowledgments

The authors acknowledge the support of the Deutsche Forschungsgemeinschaft and Open Access Publishing Fund of the University of Potsdam.

Conflicts of Interest

The authors declare no conflicts of interest.

References

  1. Caio, G.; Volta, U.; Sapone, A.; Leffler, D.A.; De Giorgio, R.; Catassi, C.; Fasano, A. Celiac disease: A comprehensive current review. BMC Med. 2019, 17, 142. [Google Scholar]
  2. Lebwohl, B.; Rubio-Tapia, A. Epidemiology, presentation, and diagnosis of celiac disease. Gastroenterology 2021, 160, 63–75. [Google Scholar]
  3. Sagu, S.T.; Zimmermann, L.; Landgraber, E.; Homann, T.; Huschek, G.; Ozpinar, H.; Schweigert, F.J.; Rawel, H.M. Comprehensive characterization and relative quantification of alpha-amylase/trypsin inhibitors from wheat cultivars by targeted hplc-ms/ms. Foods 2020, 9, 1448. [Google Scholar] [PubMed]
  4. Al-Toma, A.; Volta, U.; Auricchio, R.; Castillejo, G.; Sanders, D.S.; Cellier, C.; Mulder, C.J.; Lundin, K.E.A. European society for the study of coeliac disease (esscd) guideline for coeliac disease and other gluten-related disorders. United Eur. Gastroenterol. J. 2019, 7, 583–613. [Google Scholar]
  5. Fry, L.; Madden, A.M.; Fallaize, R. An investigation into the nutritional composition and cost of gluten-free versus regular food products in the UK. J. Hum. Nutr. Diet. 2018, 31, 108–120. [Google Scholar] [PubMed]
  6. El Khoury, D.; Balfour-Ducharme, S.; Joye, I.J. A review on the gluten-free diet: Technological and nutritional challenges. Nutrients 2018, 10, 1410. [Google Scholar] [CrossRef] [PubMed]
  7. Miranda, J.; Lasa, A.; Bustamante, M.A.; Churruca, I.; Simon, E. Nutritional differences between a gluten-free diet and a diet containing equivalent products with gluten. Plant Foods Hum. Nutr. 2014, 69, 182–187. [Google Scholar]
  8. Gell, G.; Bugyi, Z.; Florides, C.G.; Birinyi, Z.; Reder, D.; Szego, Z.; Mucsi, E.; Schall, E.; Acs, K.; Lango, B.; et al. Investigation of protein and epitope characteristics of oats and its implications for celiac disease. Front. Nutr. 2021, 8, 702352. [Google Scholar]
  9. Kumar, L.; Sehrawat, R.; Kong, Y. Oat proteins: A perspective on functional properties. LWT 2021, 152, 112307. [Google Scholar]
  10. Smulders, M.J.M.; van de Wiel, C.C.M.; van den Broeck, H.C.; van der Meer, I.M.; Israel-Hoevelaken, T.P.M.; Timmer, R.D.; van Dinter, B.J.; Braun, S.; Gilissen, L. Oats in healthy gluten-free and regular diets: A perspective. Food Res. Int. 2018, 110, 3–10. [Google Scholar]
  11. Kaukovirta-Norja, A.; Lehtinen, P. Traditional and modern oat-based foods. In Technology of Functional Cereal Products; Woodhead Publishing: Cambridge, UK, 2008; pp. 215–232. [Google Scholar]
  12. Sontag-Strohm, T.; Lehtinen, P.; Kaukovirta-Norja, A. Oat products and their current status in the celiac diet. In Gluten-Free Cereal Products and Beverages; Academic Press: Cambridge, MA, USA, 2008; pp. 191–202. [Google Scholar]
  13. Spaen, J.; Silva, J.V.C. Oat proteins: Review of extraction methods and techno-functionality for liquid and semi-solid applications. LWT 2021, 147, 111478. [Google Scholar]
  14. Spector Cohen, I.; Day, A.S.; Shaoul, R. To be oats or not to be? An update on the ongoing debate on oats for patients with celiac disease. Front. Pediatr. 2019, 7, 384. [Google Scholar]
  15. Comino, I.; Real, A.; de Lorenzo, L.; Cornell, H.; Lopez-Casado, M.A.; Barro, F.; Lorite, P.; Torres, M.I.; Cebolla, A.; Sousa, C. Diversity in oat potential immunogenicity: Basis for the selection of oat varieties with no toxicity in coeliac disease. Gut 2011, 60, 915–922. [Google Scholar]
  16. Comino, I.; Bernardo, D.; Bancel, E.; de Lourdes Moreno, M.; Sanchez, B.; Barro, F.; Suligoj, T.; Ciclitira, P.J.; Cebolla, A.; Knight, S.C.; et al. Identification and molecular characterization of oat peptides implicated on coeliac immune response. Food Nutr. Res. 2016, 60, 30324. [Google Scholar]
  17. Osborne, T.B.; Harris, I.F. The chemistry of the protein-bodies of the wheat kernel. Part i.—The protein soluble in alcohol and its glutaminic acid content. Am. J. Physiol.-Leg. Content 1905, 13, 35–44. [Google Scholar]
  18. Boukid, F. Oat proteins as emerging ingredients for food formulation: Where we stand? Eur. Food Res. Technol. 2021, 247, 535–544. [Google Scholar]
  19. Shewry, P.R.; Halford, N.G. Cereal seed storage proteins: Structures, properties and role in grain utilization. J. Exp. Bot. 2002, 53, 947–958. [Google Scholar]
  20. Capouchová, I.; Petr, J.; Tlaskalová-Hogenová, H.; Michalík, I.; Faměra, O.; Urminská, D.; Tučková, L.; Knoblochová, H.; Borovská, D. Protein fractions of oats and possibilities of oat utilisation for patients with coeliac disease. Czech J. Food Sci. 2004, 22, 151–162. [Google Scholar]
  21. Das, R.S.; Zhu, X.L.; Hannon, S.; Mullins, E.; Alves, S.; Garcia-Vaquero, M.; Tiwari, B.K. Exploring osborne fractionation and laboratory/pilot scale technologies (conventional extraction, ultrasound-assisted extraction, high-pressure processing and hydrodynamic cavitation) for protein extraction from faba bean (Vicia faba L.). Innov. Food Sci. Emerg. Technol. 2023, 89, 103487. [Google Scholar]
  22. Schmid, M.; Wieser, H.; Koehler, P. Alkylation of free thiol groups during extraction: Effects on the osborne fractions of wheat flour. Cereal Chem. 2017, 94, 546–553. [Google Scholar]
  23. DuPont, F.M.; Chan, R.; Lopez, R.; Vensel, W.H. Sequential extraction and quantitative recovery of gliadins, glutenins, and other proteins from small samples of wheat flour. J. Agric. Food Chem. 2005, 53, 1575–1584. [Google Scholar] [PubMed]
  24. Sagu, S.T.; Nso, E.J.; Karmakar, S.; De, S. Optimisation of low temperature extraction of banana juice using commercial pectinase. Food Chem. 2014, 151, 182–190. [Google Scholar]
  25. Tchewonpi Sagu, S.; Huschek, G.; Bonick, J.; Homann, T.; Rawel, H.M. A new approach of extraction of alpha-amylase/trypsin inhibitors from wheat (Triticum aestivum L.), based on optimization using plackett-burman and box-behnken designs. Molecules 2019, 24, 3589. [Google Scholar] [PubMed]
  26. Kjeldahl, J. Neue methode zur bestimmung des stickstoffs in organischen körpern. Fresenius‘ Z. Für Anal. Chem. 1883, 22, 366–382. [Google Scholar]
  27. Lowry, O.; Rosebrough, N.; Farr, A.L.; Randall, R. Protein measurement with the folin phenol reagent. J. Biol. Chem. 1951, 193, 265–275. [Google Scholar] [PubMed]
  28. Sagu, S.T.; Rawel, H.M.; Rohn, S. Targeted bottom-up mass spectrometry approach for the relative quantification of post-translational modification of bovine kappa-casein during milk fermentation. Molecules 2022, 27, 5834. [Google Scholar]
  29. Sagu, S.T.; Huschek, G.; Homann, T.; Rawel, H.M. Effect of sample preparation on the detection and quantification of selected nuts allergenic proteins by lc-ms/ms. Molecules 2021, 26, 4698. [Google Scholar] [CrossRef]
  30. Sagu, S.T.; Landgraber, E.; Rackiewicz, M.; Huschek, G.; Rawel, H. Relative abundance of alpha-amylase/trypsin inhibitors in selected sorghum cultivars. Molecules 2020, 25, 5982. [Google Scholar] [CrossRef]
  31. Sunilkumar, B.A.; Leonova, S.; Öste, R.; Olsson, O. Identification and characterization of high protein oat lines from a mutagenized oat population. J. Cereal Sci. 2017, 75, 100–107. [Google Scholar]
  32. Guan, X.; Yao, H. Optimization of viscozyme l-assisted extraction of oat bran protein using response surface methodology. Food Chem. 2008, 106, 345–351. [Google Scholar]
  33. Senarathna, S.; Mel, R.; Malalgoda, M. Utilization of cereal-based protein ingredients in food applications. J. Cereal Sci. 2024, 116, 103867. [Google Scholar]
  34. Goncharov, A.A.; Safonov, T.A.; Malko, A.M.; Bocharov, G.A.; Goncharov, S.V. Climate change expected to increase yield of spring cereals and reduce yield of winter cereals in the western siberian grain belt. Field Crop. Res. 2023, 302, 109038. [Google Scholar]
  35. Xiang, X.; Solaymani, S. Change in cereal production caused by climate change in malaysia. Ecol. Inform. 2022, 70, 101741. [Google Scholar]
  36. Sagu, S.T.; Ulbrich, N.; Morche, J.R.; Nichani, K.; Ozpinar, H.; Schwarz, S.; Henze, A.; Rohn, S.; Rawel, H.M. Formation of cysteine adducts with chlorogenic acid in coffee beans. Foods 2024, 13, 1660. [Google Scholar] [CrossRef]
  37. Li, R.; Xiong, Y.L. Ultrasound-induced structural modification and thermal properties of oat protein. LWT 2021, 149, 111861. [Google Scholar]
  38. Geisslitz, S.; Islam, S.; Buck, L.; Grunwald-Gruber, C.; Sestili, F.; Camerlengo, F.; Masci, S.; D’Amico, S. Absolute and relative quantitation of amylase/trypsin-inhibitors by lc-ms/ms from wheat lines obtained by crispr-cas9 and rnai. Front. Plant Sci. 2022, 13, 974881. [Google Scholar]
  39. Klose, C.; Arendt, E.K. Proteins in oats; their synthesis and changes during germination: A review. Crit. Rev. Food Sci. Nutr. 2012, 52, 629–639. [Google Scholar]
Figure 1. Workflow employed to characterize the oat proteins and assess their potential allergenicity. ¹ The Kjeldahl method was performed for the selected oat samples.
Separations 11 00271 g001
Figure 2. Response surface plots showing the effect of the extraction time, extraction speed, and sample/solvent ratio on the extraction yield of the avenin fraction (a,b), avenalin fraction (c,d), and albumin/globulin fraction (e,f).
Separations 11 00271 g002
Figure 3. Protein content of four commercial and twenty homogenous oat samples in g per 100 g according to (a) the extraction protocols and (b) the different protein fractions; (c) shows the composition of the 24 analyzed oat samples in term of the avenin, avenalin, and albumin/globulin fractions. TE is the total extract from the ammonium bicarbonate buffer and SPE is the sum of the protein content obtained from the different fractions of the sequential protein extraction. *** Significant at p < 0.001.
Separations 11 00271 g003
Figure 4. Relative content in % of selected proteins in the different samples according to the extraction method: (a) ammonium bicarbonate/urea extraction, (b) avenin fraction, (c) avenalin fraction, and (d) albumin/globulin fraction.
Separations 11 00271 g004
Figure 5. Gluten content measured using the RIDASCREEN® Total Gluten assay in oat samples along with negative and positive controls. C+: positive control (wheat); C−: negative control (rice); and *: values above the legal gluten-free threshold. The different letters a and b express significant differences (p < 0.0001) according to a one-way ANOVA.
Separations 11 00271 g005
Table 1. Experimental responses for the optimization of the sequential extraction.
Exp.
No.
Coded ValuesReal ValuesProtein Concentration (mg/mL)Extraction Yield (%)
x1x2x3X1X2X3Avenin
Fraction
Avenalin FractionAlbumin/
Globulin
Fraction
Avenin FractionAvenalin FractionAlbumin/
Globulin
Fraction
1−1−1010.827.50.5961.4960.3822.02.21.3
21−10100.827.51.0601.6830.3043.42.41.0
3−1101627.50.9132.0310.1392.92.90.5
411010627.50.7422.1870.0242.43.20.1
5−10−113.450.5140.4070.0849.73.21.6
610−1103.450.4170.6200.2117.44.93.7
7−10113.4500.9672.3491.0641.51.81.6
8101103.4500.8392.7891.1951.32.21.8
90−1−15.50.850.3080.5570.2265.64.34.1
1001−15.5650.4880.5100.3258.73.85.8
110−115.50.8500.5992.7251.0760.92.21.7
120115.56500.9112.6001.1951.42.11.9
130005.53.427.51.2091.0060.5073.91.41.6
140005.53.427.51.2371.1450.4934.01.61.6
150005.53.427.51.2651.2850.4794.21.91.6
x1, x2, and x3 are the coded values, while X1, X2, and X3 are the real values of the extraction time, extraction speed, and sample/solvent ratio, respectively.
Table 2. Oat-extracted protein obtained from sequential fractionation and total extraction.
Sample Nr.Protein Content [g/100 g]
Sequential Protein ExtractionTotal Extraction
(Ambi/Urea Method)
AveninAvenalinA/G
S012.11 ± 0.28 a2.55 ± 0.12 a0.79 ± 0.13 a2.70 ± 0.16 a
S028.05 ± 0.03 b2.71 ± 0.18 a2.63 ± 0.07 b6.42 ± 0.48 b
S031.54 ± 0.35 a8.83 ± 0.00 b1.12 ± 0.03 a,b1.03 ± 0.73 a
S041.36 ± 0.17 a2.33 ± 0.09 a0.57 ± 0.01 a1.55 ± 0.07 a
S058.17 ± 0.17 b7.84 ± 0.21 b,c3.66 ± 0.00 b,c14.99 ± 0.39 c
S069.70 ± 0.25 b15.68 ± 0.69 d4.76 ± 0.06 c,d16.94 ± 0.39 d
S077.33 ± 0.62 b6.64 ± 0.28 c,d5.0 ± 0.136 c,e8.97 ± 0.43 e
S0813.09 ± 0.51 c5.10 ± 0.11 d,e7.73 ± 0.37 f13.12 ± 0.42 f
S0911.16 ± 1.23 d8.54 ± 0.25 b3.06 ± 0.13 b,c15.81 ± 1.61 c,d
S1012.37 ± 0.76 c,d5.89 ± 0.70 e,f6.28 ± 0.13 d,e,f,g15.23 ± 0.55 c,d
S1112.99 ± 1.27 c7.19 ± 0.00 b,d,f5.68 ± 0.24 d,e18.12 ± 1.12 d,g
S1210.97 ± 0.68 d9.81 ± 0.33 b,d,g5.91 ± 0.01 d,e17.29 ± 0.19 d
S138.97 ± 0.51 b,e13.67 ± 0.65 h,j6.75 ± 0.17 e,f15.81 ± 0.16 c,d
S148.59 ± 0.09 b,e11.90 ± 0.42 h,i6.96 ± 0.16 f18.28 ± 1.01 d,g
S1511.09 ± 0.36 d5.84 ± 1.03 d,e7.00 ± 0.08 f12.29 ± 0.23 f
S1610.34 ± 0.36 d,e12.70 ± 1.22 h,j7.83 ± 0.03 f15.31 ± 1.61 c,d
S1712.48 ± 0.29 c,d5.21 ± 0.42 d,e6.53 ± 0.16 d,f14.29 ±0.00 c,f
S1812.82 ± 0.64 c,d7.43 ± 0.06 b,d,f5.00 ± 0.15 c,d,g13.65 ± 0.24 c,f
S1913.70 ± 0.18 c12.16 ± 1.36 h,j9.30 ± 0.06 f19.16 ±0.60 g
S2014.96 ± 0.925.90 ± 0.10 d,e7.98 ± 0.12 f16.23 ± 1.30 c,d
S2110.98 ± 0.59 d13.12 ± 0.19 h,j4.79 ± 0.37 c,g16.89 ± 2.38 d
S2213.56 ± 0.06 c13.29 ± 0.30 h,j7.49 ± 0.35 f16.80 ± 0.04 d
S2311.79 ± 0.65 c,d11.55 ± 0.92 g,i,j,5.42 ± 0.04 c,g14.76 ± 0.44 c,f
S2412.40 ± 0.51 c,d5.08 ± 0.11 d,e8.24 ± 0.15 f11.99 ± 1.03 f
The data are expressed as the mean ± standard deviation, n = 3. A two-way ANOVA analysis was performed with multiple comparisons, and the different letters within the columns indicate significantly different values (p < 0.05).
Disclaimer/Publisher’s Note: The statements, opinions and data contained in all publications are solely those of the individual author(s) and contributor(s) and not of MDPI and/or the editor(s). MDPI and/or the editor(s) disclaim responsibility for any injury to people or property resulting from any ideas, methods, instructions or products referred to in the content.

