Abstract
Short-chain fatty acids (SCFAs) in feces are inextricably linked to intestinal homeostasis and can be used as potential markers for metabolic diseases. In this study, an efficient and simple method was developed for the purification of SCFAs without the need for derivatization of the samples. The SCFAs (acetic, propionic, isobutyric, butyric, isovaleric, valeric, and hexanoic acid) were extracted from a small amount (50 mg) of fecal and intestinal samples using acetone combined with solid phase extraction column (Bond Elut Plexa) enrichment. Quantitative analysis was performed using gas chromatography with a flame ionization detector. The developed method has shown very good limits of detection (LOD, 0.11–0.36 μM) and limits of quantification (LOQ, 0.38–1.21 μM) with excellent linearity (R2 ≥ 0.9998), good recovery (98.34–137.83%), and high reproducibility (RSD ≤ 1.30). The applicability of this method was also demonstrated by testing the fecal and cecum contents of different species from mammals (mice, pigs) to insects (honeybees). The technique is highly suitable for analyzing complex, small amounts of intestinal and fecal SCFAs.
1. Introduction
Short-chain fatty acids (SCFAs; consisting of 1–6 carbon atoms) are primarily produced by breaking undigested carbohydrates in the small intestine via colonic microorganisms [1]. The Bacteroidetes and Firmicutes found in the gut progressively degrade carbohydrates into monosaccharides, lactic acid, succinic acid, and ethanol via glycolysis and pentose phosphate pathways, before SCFAs are formed. SCFAs are now considered essential for assessing dietary patterns, the composition of the gut microbiota, and overall health and physiologic function [2]. Therefore, there is an urgent need to develop convenient, fast, and reliable methods for detecting SCFAs.
To date, there are several chromatographic methods utilized for the analysis of SCFAs such as high-performance liquid chromatography (HPLC)-ultraviolet detection (UV) [3], HPLC-electrochemical detection (ECD) [4], HPLC-mass spectrometry (MS) [5], capillary electrophoresis (CE) [6], and nuclear magnetic resonance (NMR) [7]. Furthermore, due to the high volatility of SCFAs, gas chromatography (GC)-flame ionization detection (FID) [8], GC-MS [1], and solid-phase microextraction (SPME), combined with GC-MS [9], are widely used. As feces are very complex biological material, specific care should be taken during the preparation and extraction of SCFAs before the instrumental analysis. Otherwise, excessive impurities can cause a system overload of the detection instrument and damage to the column [2].
Several target compounds can be enriched by solid-phase extractions (SPEs) using different fillers [10]. The adsorbent media were added as stationary phases in small polypropylene open syringe cartridges. Therefore, the sample solution passes through the stationary phase by gravity, at which point the analyte interacts strongly and reversibly with the stationary phase (van der Waals forces), and the target compounds are eventually collected by elution [11]. The most commonly used fillers in studies are reversed phase (C18, C8), normal phase (silica, alumina), ion exchange, ion exchange combined with reversed phase (polymer mixing modes), functionalized resins, molecularly imprinted polymers, and immunosorbents materials [12]. SPE is time-saving and environmentally friendly because it reduces sample pretreatment time and the use of harmful reagents [13]. Some of the current literature has reported using SPE to separate and purify SCFAs from feces [14,15]. Studies by McKay et al. [14] and Wang et al. [15] both derivatized samples before using SPE for further extraction of SCFAs. Therefore, this study aimed to develop and evaluate an SPE pretreatment method that does not require derivatization of samples, which can be used to extract SCFAs from intestinal and fecal content, combined with GC-FID quantification.
2. Materials and Methods
2.1. Samples and Reagents
The SCFAs standards, including acetic acid (≥99.5%), propionic acid (≥99.5%), isobutyric acid (99.5%), butyric acid (≥99%), isovaleric acid (≥99%), valeric acid (≥99%), and hexanoic acid (≥99%), were purchased from Sigma-Aldrich (St. Louis, MO, USA). Chromatography-grade acetone (≥99%), methanol (≥99%), and acetonitrile (≥99%) were purchased from Sigma-Aldrich (Beijing, China). The extraction column (Bond Elut Plexa, 30 mg, 1 mL, 12109301; Bond Elut-PPL, 50 mg, 1 mL, 12105002; Bond Elut HLB, 30 mg, 1 mL, 5610-2144) was purchased from Agilent (Agilent Technologies, Santa Clara, CA, USA).
This study has received animal ethics approvals from the Institute of Subtropical Agroecology, Chinese Academy of Sciences (IACUC#201302, healthy growing male pigs [Duroc × (Landrace × Yorkshire)]) for the use of pig cecum contents (PCC, 6) and pig feces (PF, 7), and from the Institute of Apicultural Research of the Chinese Academy of Agricultural Sciences (AECNO:20210115, healthy male mice ICR strains) for use of mouse cecum content (MCC, 7), mouse feces (MF, 8), and healthy honeybee (Apis mellifera) intestinal contents (HIC, 12 samples). High-temperature-dried and ground PF powder, and low-temperature-preserved PCC and PF, as well as MCC, MF, and HIC, have been previously described [16,17].
2.2. SCFAs’ Standard Preparation and GC Analysis
The stock standard of SCFAs was prepared by dissolving acetic, propionic, isobutyric, butyric, isovaleric, valeric, and hexanoic acids (60 µL, respectively) in acetone up to 10 mL (Table S1). Further dilutions of SCFA standard were also performed and their respective concentrations are represented in Table 1.

Table 1.
The concentrations of different gradient SCFA standards.
The analysis of samples was performed using a 7820A GC-FID (Agilent Technologies, Santa Clara, CA, USA). Briefly, 1 μL of the sample was injected into a DB-FFAP column (30 m, 0.25 mm × 0.25 μm, Agilent Technologies, Santa Clara, CA, USA). The N2 was used as the carrier gas (1 mL/min), the inlet temperature was 280 °C, and the detector temperature was 250 °C. The H2 and air flow rates were set at 40 mL/min and 300 mL/min, respectively. The initial temperature of the column was 50 °C and held for 1 min, then increased to 120 °C at 15 °C/min and held for 0 min, followed by ramping up to 200 °C at 6 °C/min and holding for 0 min for a total of 19 min. Finally, the after-running temperature was increased to 235 °C for 3 min. High purity water and acetone were used as cleaning solvents for the injection needle between injections.
Each level of SCFA standard solution was measured in triplicates. The retention time was determined for each SCFA standard, and an external linear calibration curve was developed and used for the quantification of SCFAs. The limit of detection (LOD) and limit of quantification (LOQ) were calculated based on signal/noise (S/N). LOD = 3S/N, LOQ = 10S/N.
2.3. Optimization of Extraction Method of SCFA from Samples
The SCFAs were extracted from pig fecal powder using acetone. Samples were centrifuged at 8000 r/min for 10 min, and the supernatant was discarded before drying the fecal matrix that was used for method optimization.
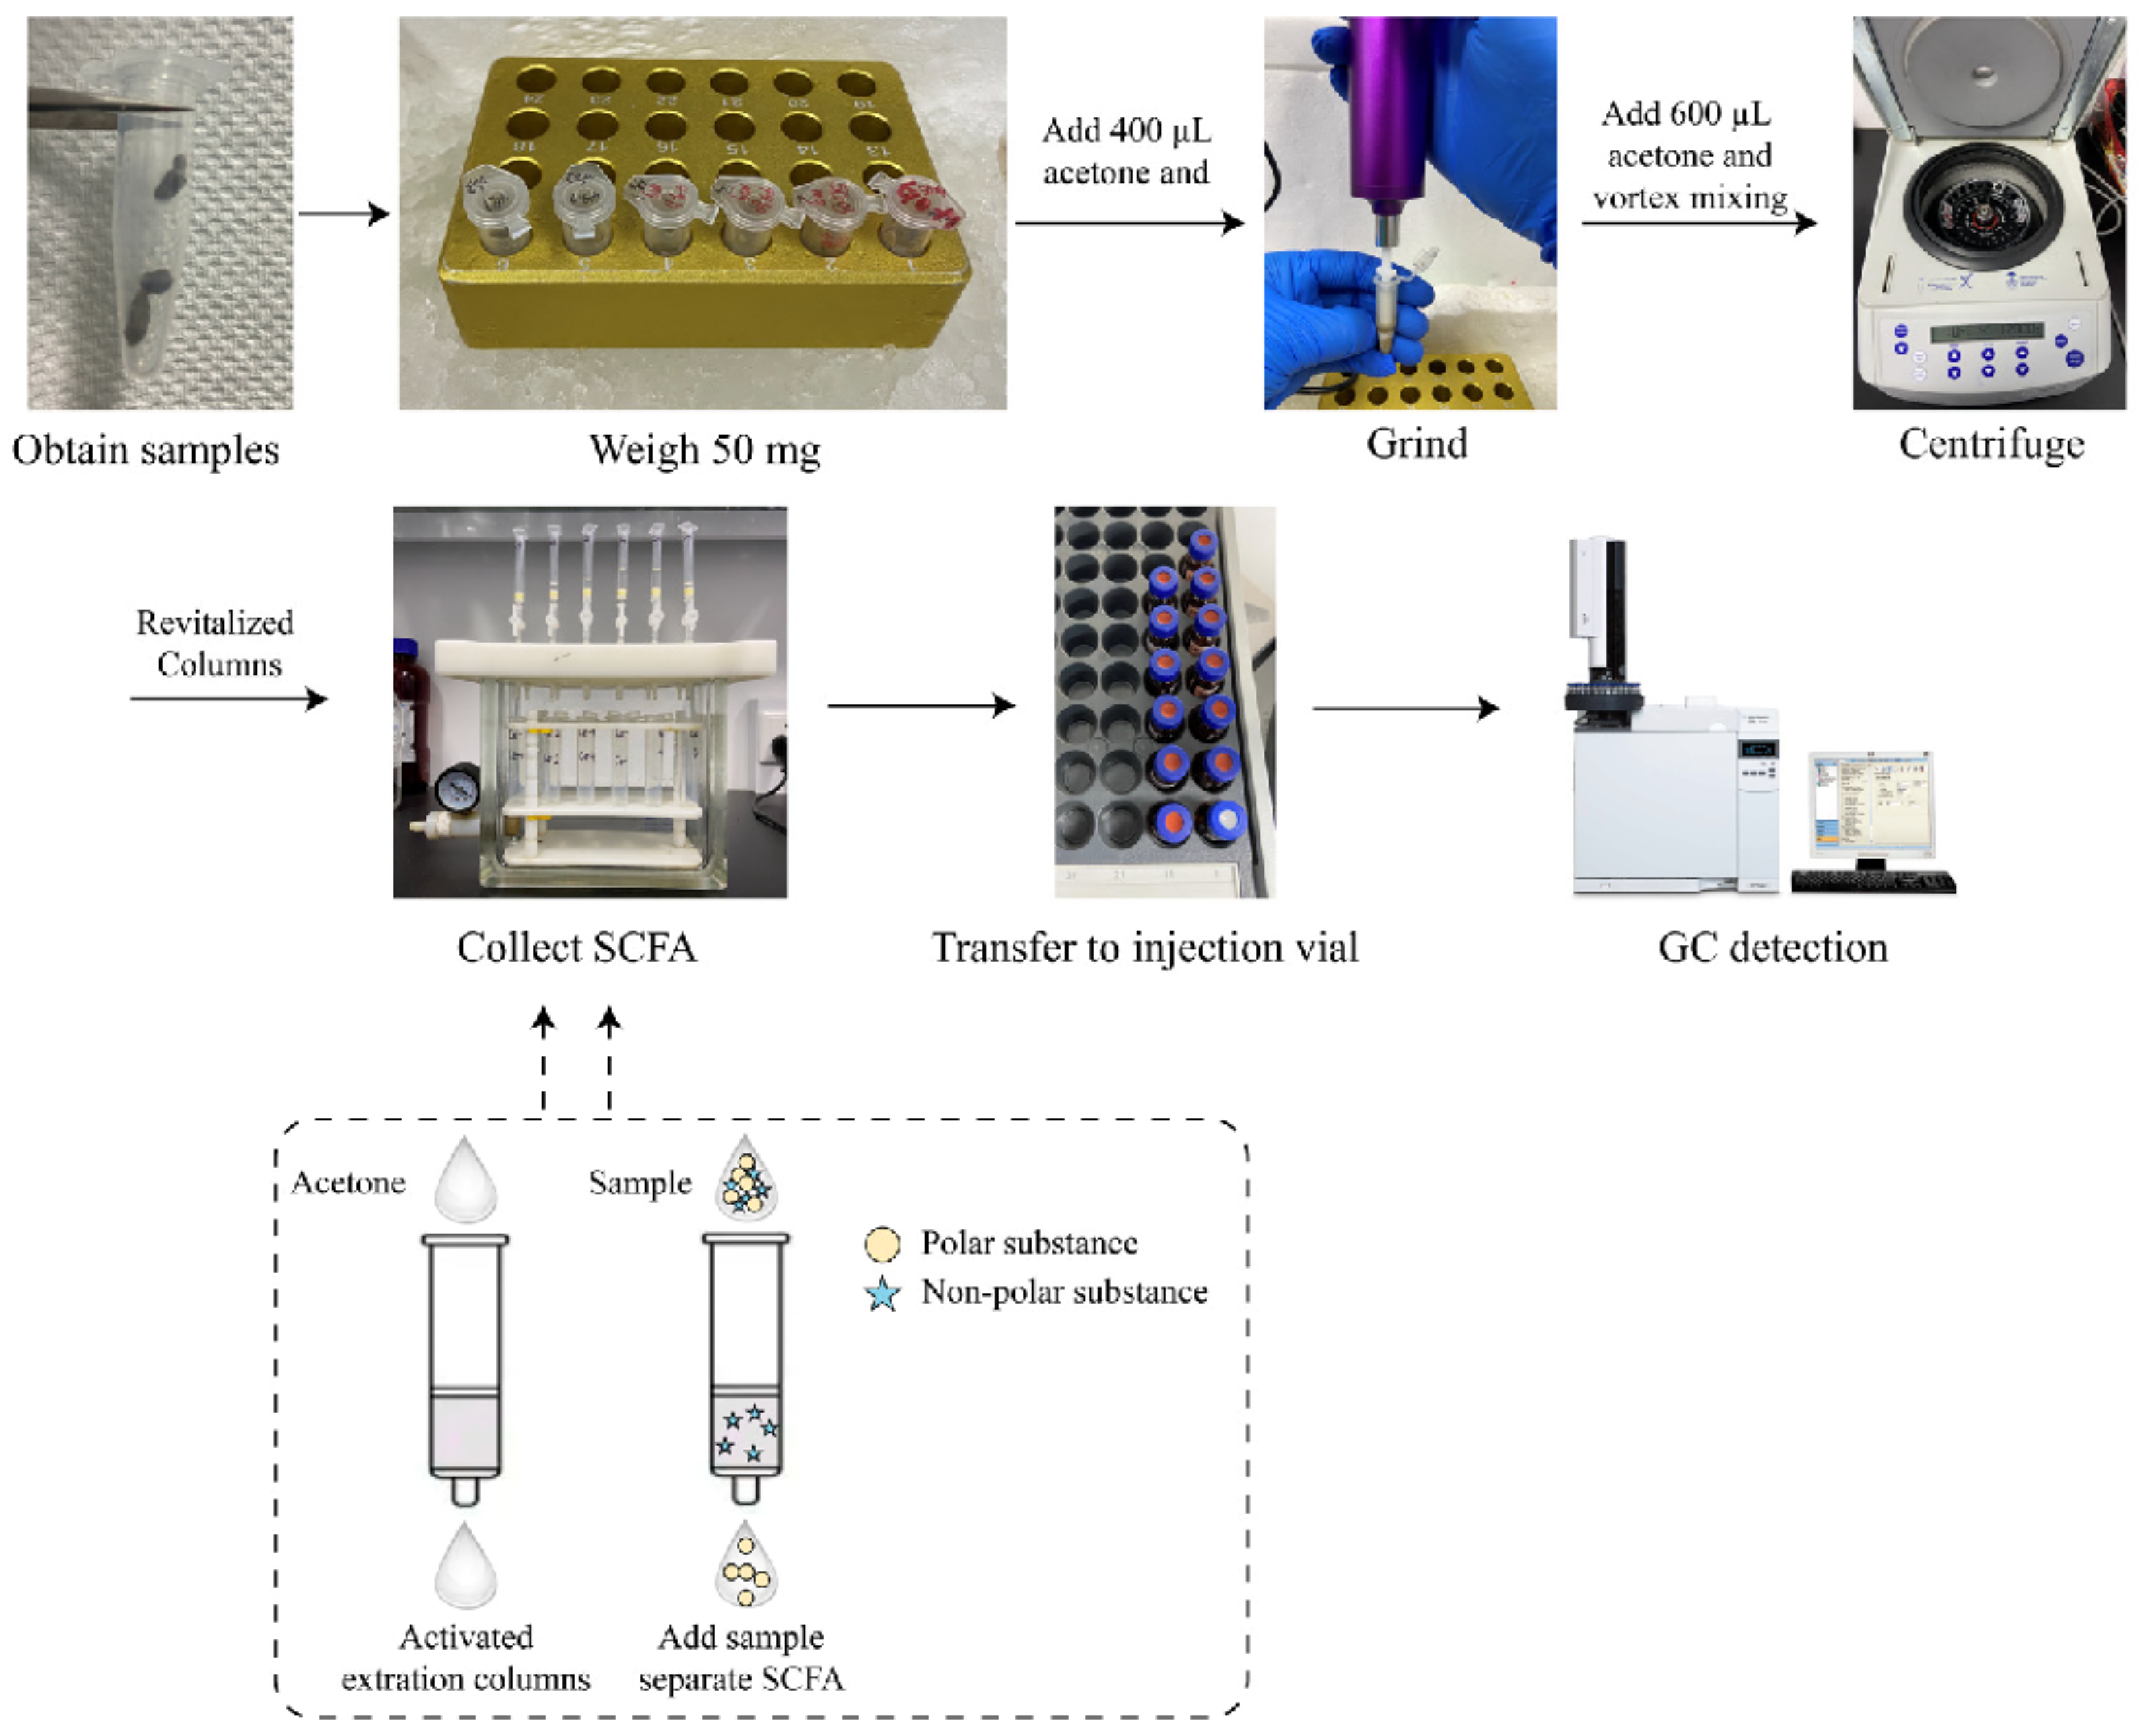
The fecal sample matrix (50 mg) was weighed out (Figure 1), followed by the addition of L1 SCFA standard (100 µL) and extraction solvent (300 µL; acetone or methanol or acetonitrile). The samples were ground using an electric hand-held tissue grinder (Tiangen Biochemical Technology Beijing Co., Ltd., Beijing, China). Another 600 µL of extraction solvent was added to the samples, followed by vigorous vortex mixing. The samples were centrifuged at 4 °C 10,000 r/min for 10 min.
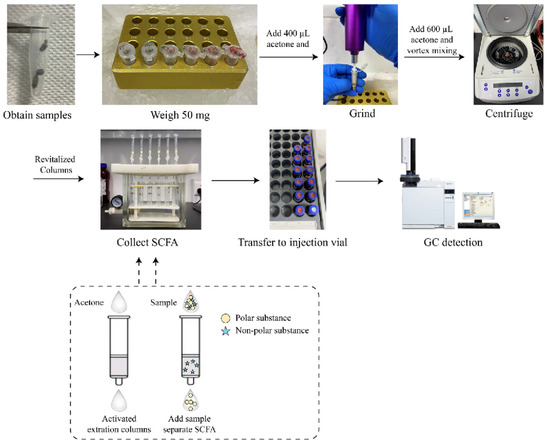
Figure 1.
Flow chart and theory of extracting SCFA from fecal samples.
The solid phase extraction (Bond Elut Plexa or Bond Elut-PP or Bond Elut HLB) for polar compounds was activated with 1 mL of extraction solvent. The solvent remaining in the column was blown dry before adding the supernatant and the flow-down extract containing SCFAs was collected. The detection and quantification of SCFAs were performed using the GC-FID. The extraction efficiencies were calculated for different solvents and solid-phase extraction using additive recovery.
Recovery, % = (A − B)/C × 100%
A, Actual concentration of sample matrix supplemented with SCFAs standards;
B, Concentration of sample matrix;
C, Theoretical concentration of sample matrix supplemented with SCFAs standards.
2.4. Recovery Assay and Reproducibility
Acetone was used as the extraction solvent and Bond Elut Plexa as the solid phase extraction. A selection of different concentrations of mixed standards were added to 50 mg of the sample matrix (Table 1) that were extracted and analyzed following the above-mentioned procedures. Repeatability, intra-day, and inter-day stability were measured using mixed standard L3. Precision was expressed as the relative standard deviation (RSD, %) of the L3 peak area.
2.5. SCFA Extraction from Fecal and Intestinal Content Samples
The sample containing fecal matrix (50 mg) and acetone (400 μL) was homogenized with an electric hand-held tissue grinder followed by the additional acetone (600 μL) and vortex (3 min). The samples were centrifuged at 4 °C 10,000 r/min for 10 min. At this point, the SPE column was activated with 1 mL of acetone, ensuring that all residual acetone was dried. The entire supernatant of the centrifuged sample was loaded on the SPE column and dropped by gravity into a clean 10 mL centrifuge tube. The collected extract was transferred to the injection vial and detected using GC-FID.
2.6. Statistical Analysis
All data are presented as mean ± standard deviation. Principal component analysis (PCA) was analyzed and graphed using SIMCA 14.1 (Multivariate Data Analysis Software, Sartorius AG, Göttingen, Germany. Bar graphs were plotted using GraphPad Prism 8.0 (GraphPad Software, San Diego, CA, USA). Statistical analysis was performed using SPSS 26 (Chicago, IL, USA). Differences between groups were analyzed by one-way ANOVA followed by Duncan’s post hoc test (p < 0.05).
3. Results and Discussion
3.1. Chromatography and Standard Curves
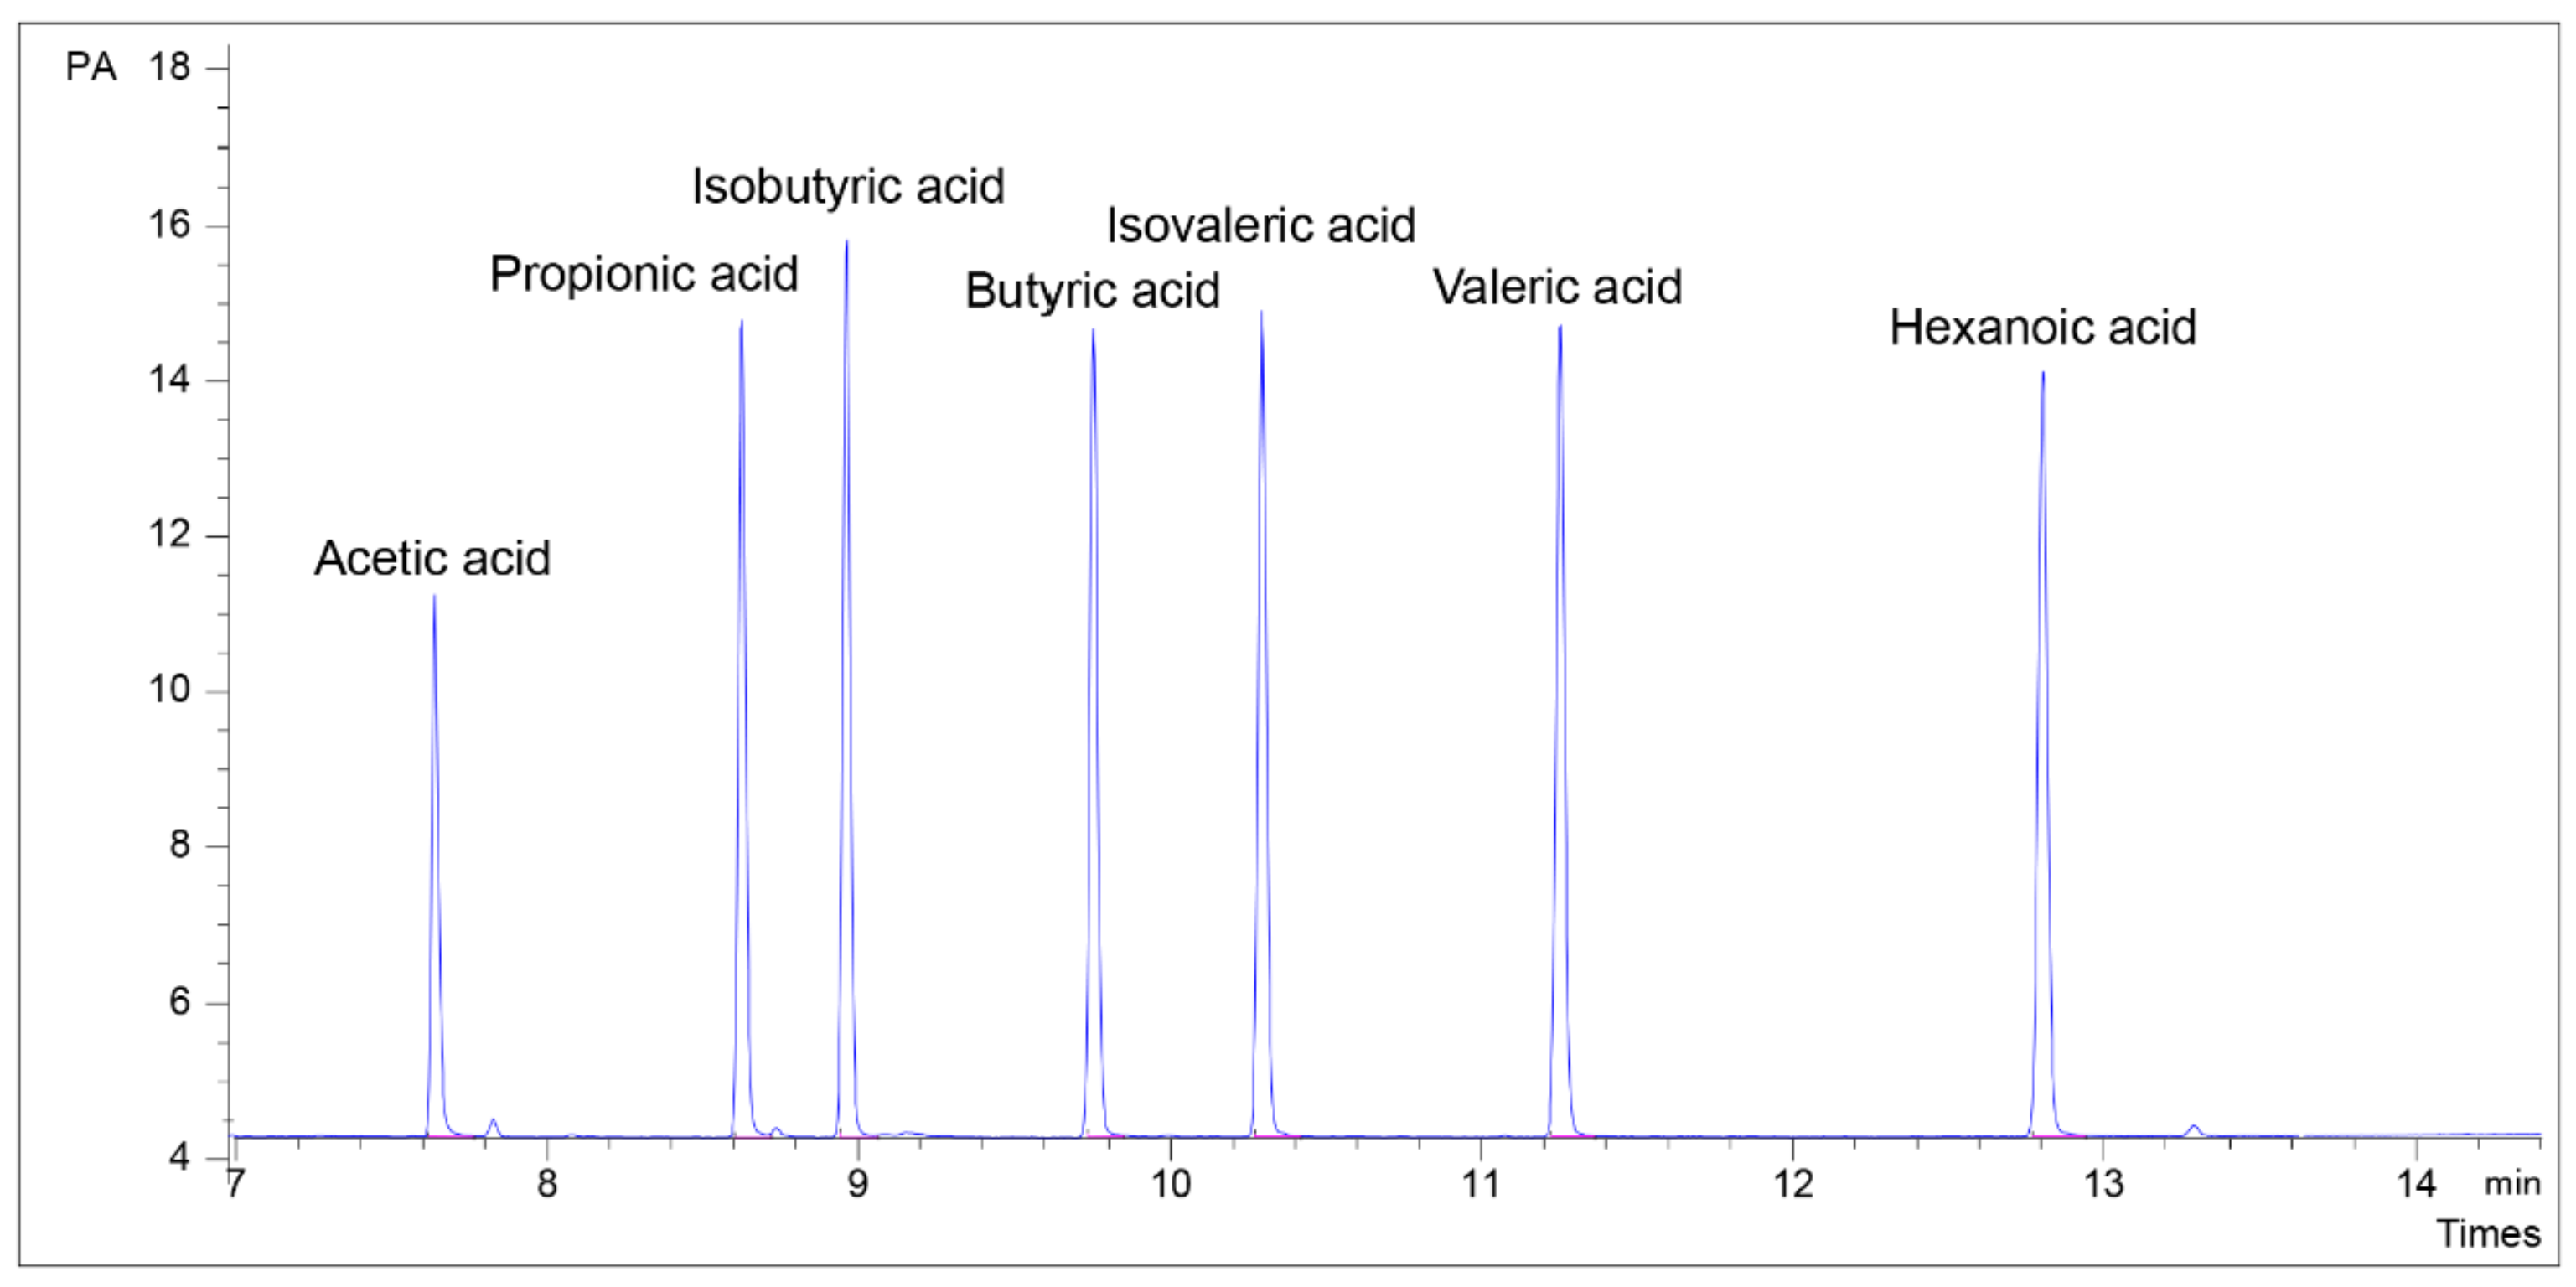
The identification of SCFA standards was based on the retention times (Figure 2) and showed good separation at 7–13 min. The chromatogram had narrow peak widths and sharp peak shapes. The linearity of the standard curve (Table S2) was very high (R2 > 0.9998), and this was reproducible for all standards used in fecal and intestinal content samples. For the different SCFA standards, our results show the LOD values ranged from 0.11 to 0.36 μM, and the LOQ values ranged from 0.38 to 1.21 μM (Table S2). Indeed, lower LOD values can be obtained using derivatization to extract SCFA, followed by GC-MS [1] and HPLC-MS [14] detection. However, this process is time consuming with the use of several harmful reagents. The previous study utilized an in vitro digestion model, and SCFA products were detected using SPME-GC-MS with the LOD values of 69–1210 μM (7–72 mg/mL) [18]. Another study used acidified water extraction combined with GC-FID and reported fecal SCFA with the LOD of 0.72–9.04 μM [19]. The LOD values obtained from acetone SCFA extraction in our study were lower than those reported in both methods. In a study by Scortichini et al. [8], the acidification of feces was performed using sulfuric acid followed by SCFA extraction with ether and analyzed using GC-FID, and the reported LOD values were in a range between 0.04 and 0.64 μM. These data were similar to our results, however, sulfuric acid and ether are both classified as bad biosafety and public health reagents [20].
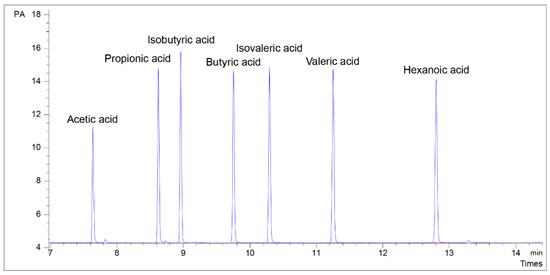
Figure 2.
Chromatogram of mixed standards at L3 concentration (representing the average physiological concentration of SCFAs in the fecal and intestinal samples). Acetic acid, 107.41 µM; Propionic acid, 80.32 µM; Isobutyric acid, 63.11 µM; Butyric acid 64.92 µM; Isovaleric acid, 53.56 µM; Valeric acid, 54.34 µM; Hexanoic acid, 45.89 µM.
3.2. Optimization of Extraction Conditions
The composition of feces is very complex as it contains food residues, some intestinal flora, and gut secretion fluids. The extraction and detection of high-temperature dried pig fecal powder using our method still showed a large amount of SCFAs in the chromatogram (Figure S1, curve a). Therefore, it is not possible to use high-temperature dried fecal powder as the sample matrix for SCFA standard addition and recovery experiments. We extracted SCFAs from the fecal powder using acetone after overnight storage. This was followed by centrifugation at 8000 r/min for 10 min, the supernatant was discarded, leaving the fecal precipitate to be dried at a high temperature, and used as the sample matrix. Apparently, the fecal powder treated with acetone did not show SCFA peaks in the chromatogram (Figure S1, curve b). Therefore, high-temperature drying combined with acetone extraction treatment of feces resulted in a matrix with a low background interference.
The SPE columns Bond Elut Plexa, Bond Elut-PPL, and Bond Elut HLB contain hydrophilic-lipophilic equilibrium porous polymeric adsorbent packing [12]. These three SPEs contribute to the retention of polar compounds in the sample and reduce matrix effects. The SPE packings have been successfully used to enrich and purify polar compounds, showing good reproducibility and recovery, for instance in the separation and purification of SCFAs in feces [14,15], the analysis of multi-residue pesticides in river water [21], and biomarkers in urine [22]. Table S3 shows the recoveries of fecal matrices containing SCFA standards extracted through the use of different organic reagents (acetone, methanol, and acetonitrile) and different SPE columns (A: Bond Elut Plexa; B: Bond Elut-PPL; C: Bond Elut HLB). Acetone extraction provided higher SCFAs recovery compared to methanol and acetonitrile. The recovery of SCFAs using SPE column Bond Elut Plexa was higher than Bond Elut-PPL and Bond Elut HLB (all p’s < 0.05). Extraction of SCFAs from fecal matrices with acetone and Bond Elut Plexa did not result in increased resistance on the inner wall of the injection needle, and the formation of black residue in the inlet liner was rare. The chromatogram has a smooth baseline with fewer impurities.
3.3. Recovery and Reproducibility
The recoveries of SCFA standards added to the fecal matrix at different concentrations ranged from 79.25% to 137.83% (Table S4). These findings were similar to the previous literature for ether (80.8–108.8%) [8], MTBE (76.2–107.6%) [23], butanol (63.2–97.4%) [24], and derivatization (81.27–128.42%) [1] pre-treatments, as well as for GC-MS, SPME-GC-MS (97.7–122.4%) [17], and HPLC-MS (85.4–99.7%) [25] assays. There was a variation in the recovery of the added acetic and propionic acids at different concentrations, and more stable results were observed for other SCFAs analyzed (Table S4). In particular, the additive recovery of SCFA at low concentrations was higher than at high concentrations. These results are also consistent with those reported in the previous literature, where high levels of additive recoveries are more likely to be obtained at lower concentrations [24]. The main SCFAs in biological manure are acetic, propionic, and butyric acids [26]. In our novel method, the recoveries of these three SCFAs at H4 and H5 addition concentrations were higher compared to isobutyric, isovaleric, valeric, and capric acids (Table S4). The repeatability corresponded to the RSDs (Table S5) of peak areas of 0.36–0.85, intra-day stability of 1.04–1.30, and inter-day stability of 0.88–1.23, which were comparable to the results obtained by others [1,27]. Furthermore, the stability of the seven SCFAs was better at different time intervals when samples were stored at −20 °C. Therefore, the method developed in this study showed good reliability for detecting SCFAs in feces and intestinal contents.
3.4. Quantitative Analysis of SCFA in Fecal and Intestinal Content Samples
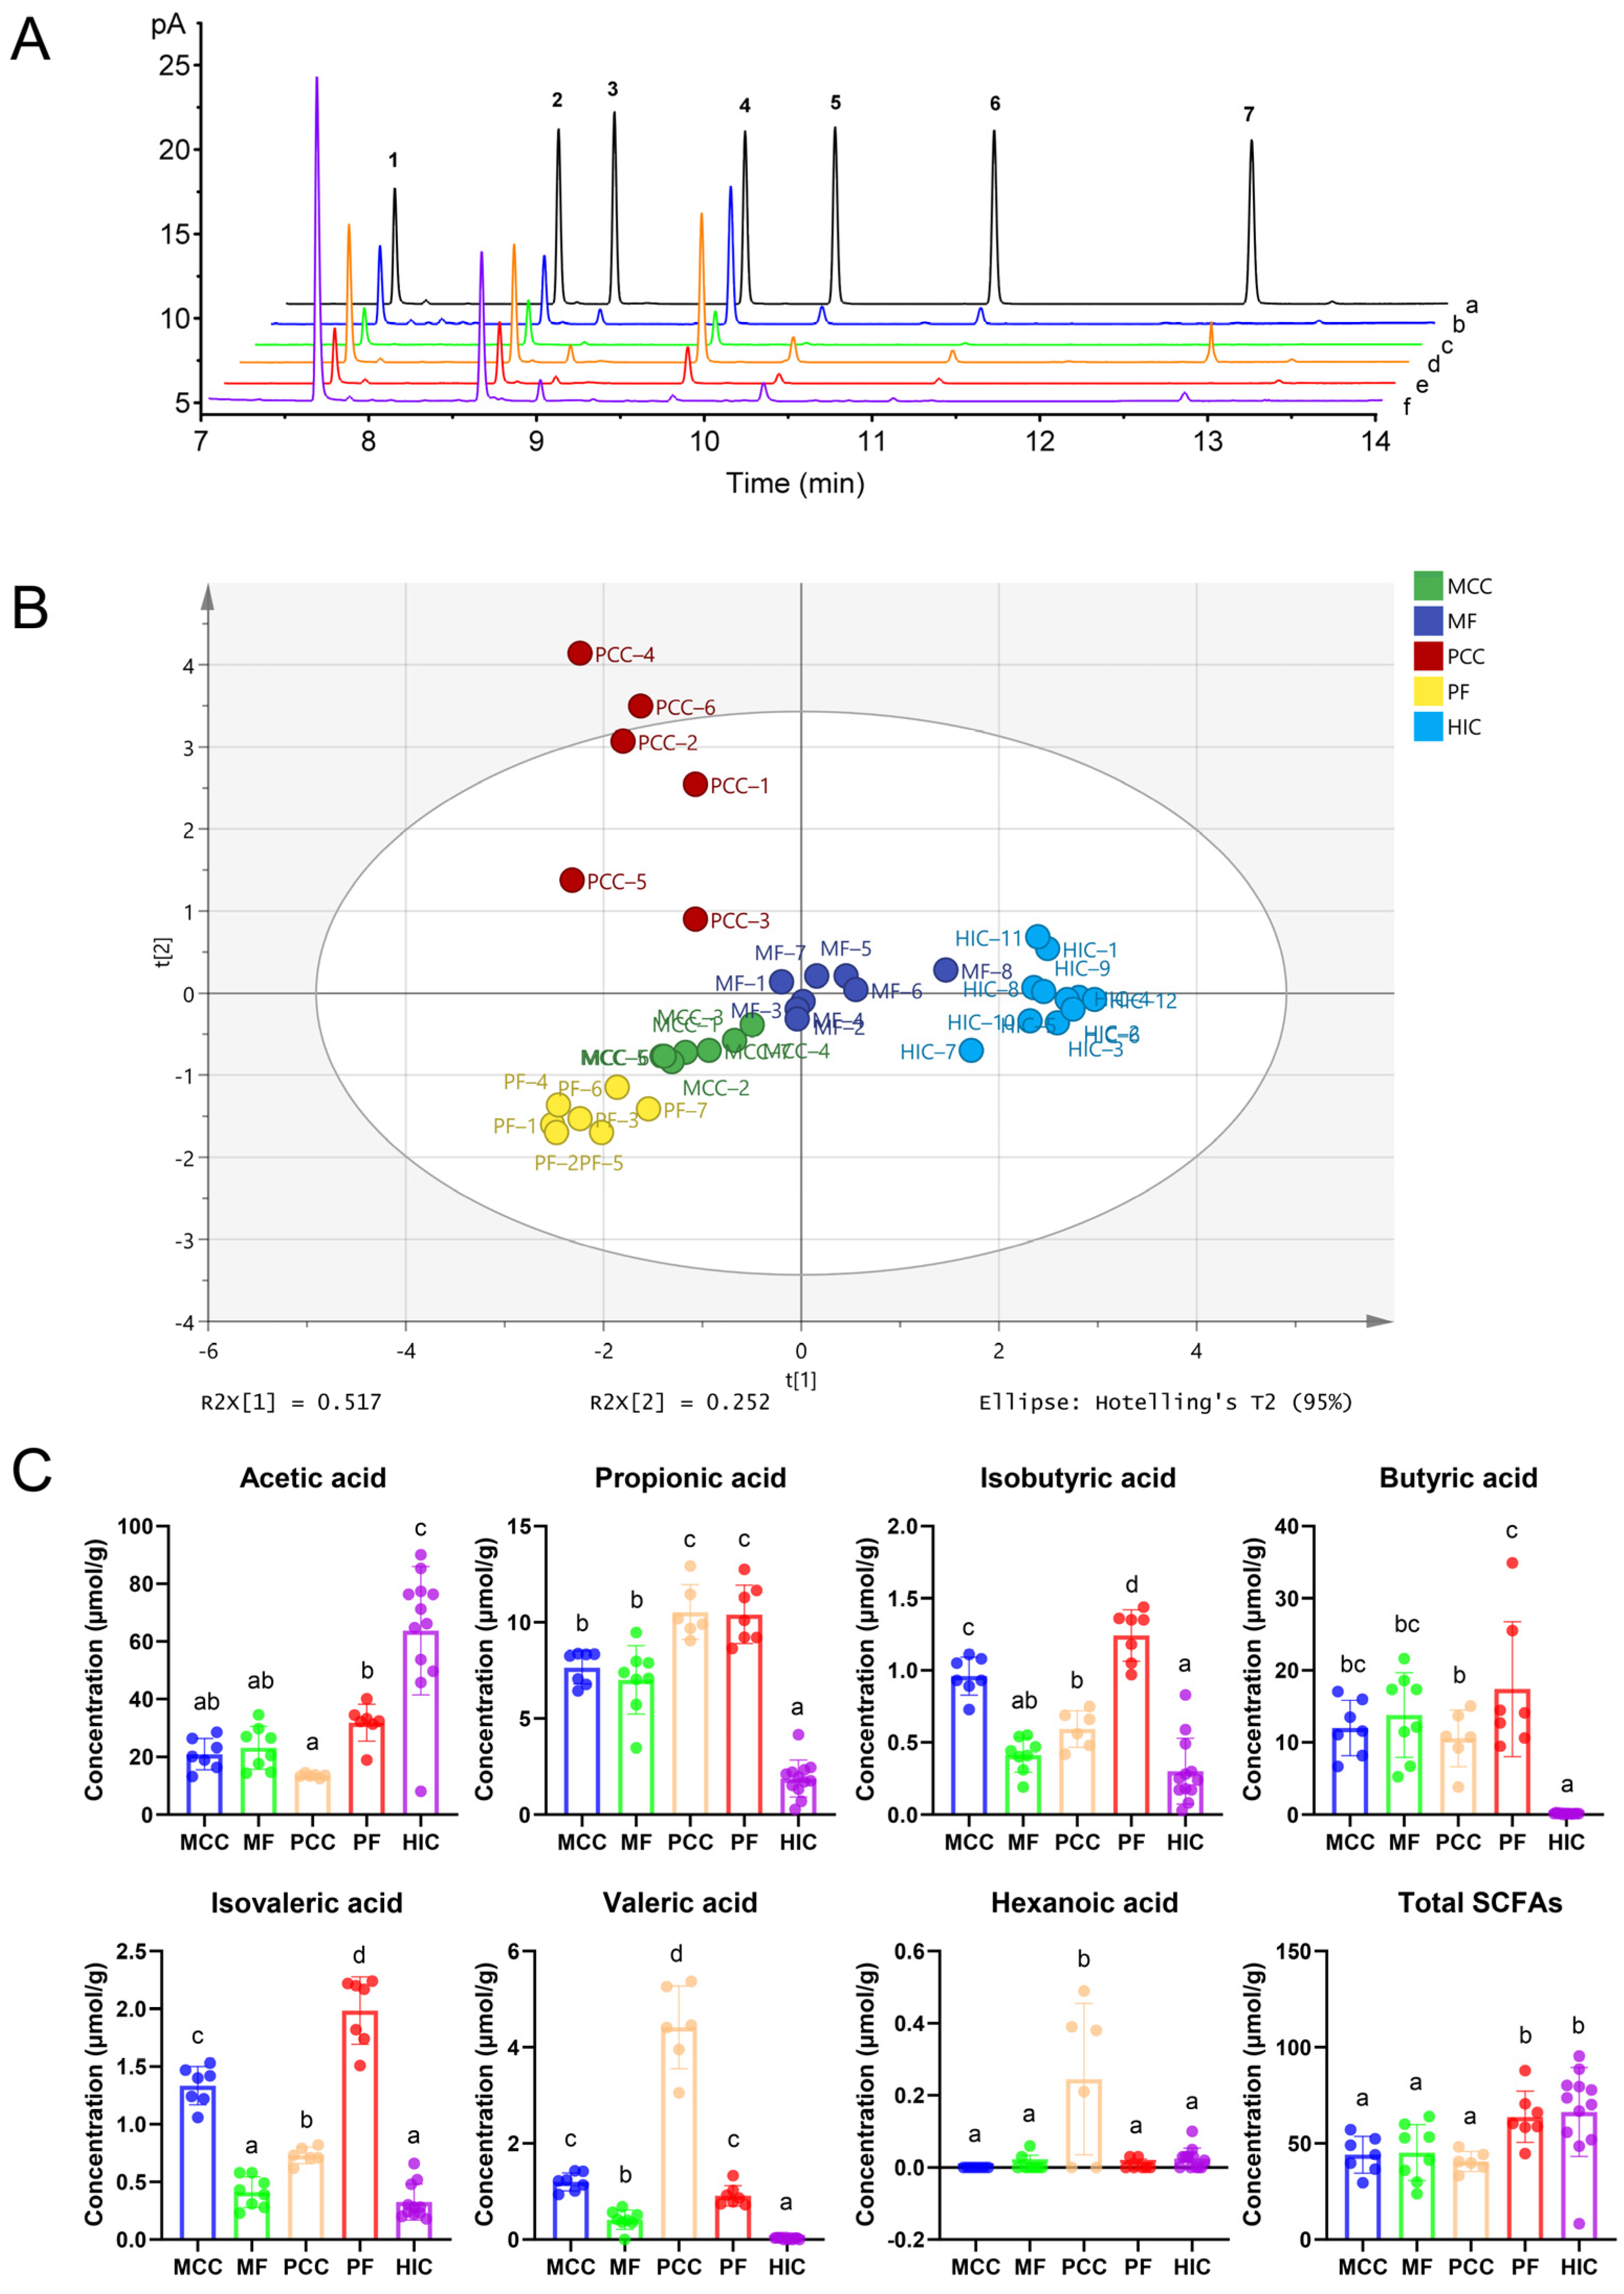
To test the applicability of the newly developed method, we selected the feces and cecum contents of mice and pigs, and the intestinal contents of bees. The GC-FID chromatogram representing the SCFA levels of the various species and sampling sites examined is depicted in Figure 3A and Table S6. Each species had different SCFA concentrations due to their diverse diets, types and amounts of intestinal flora, and social behaviors [28]. Typically, mouse and pig feces are hard and granular, while the contents of the cecum have a highwater component, which is also the case for the intestinal contents of bees. To avoid incomplete SCFA extraction, each sample had to be ground and homogenized [29]. All five samples exhibited significant peaks in acetic acid, propionic acid, and butyric acid (all p’s < 0.05), with low impurity interferences and smooth baselines. To keep the column clean and to minimize the interference between samples injected on the GC-FID system, a high-temperature post-run at 235 °C for 3 min was set.
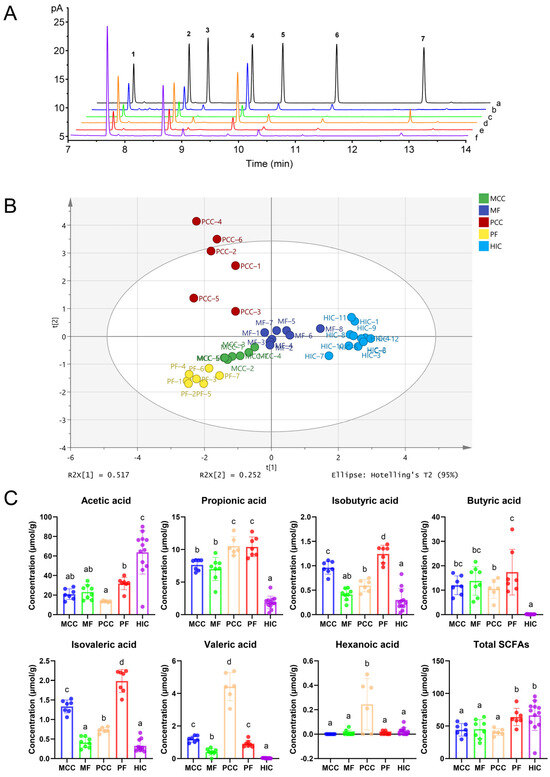
Figure 3.
(A) Gas chromatograms of standards and samples. (a) SCFA standards of L3 concentration; (b) SCFA extract from mouse cecum contents; (c) SCFA extract from mouse feces; (d) SCFA extract from pig cecum contents; (e) SCFA extract from pig feces; (f) SCFA extract from honeybees’ (Apis mellifera) intestinal contents. Numbers 1−7 represent acetic, propionic, isobutyric, butyric, isovaleric, valeric and hexanoic acid, respectively. (B) The PCA plots of the SCFA data in fecal and intestinal content samples from different sources. MCC, mouse cecum contents; MF, mouse feces; PCC, pig cecum contents; PF, pig feces; HIC, honeybee intestinal contents. (C) To compare the levels of acetic, propionic, isobutyric, butyric, isovaleric, valeric, and hexanoic acids in different samples. Statistical data are expressed as mean ± standard deviation. The results corresponding to bars with different letters were statistically significant (p < 0.05). On the contrary, the results corresponding to bars with the same letter were not statistically significant.
The PCA is an unsupervised multivariate dimensionality reduction statistical method [30], and each point (Figure 3B) represents a sample, while the position of the point reflects the level of SCFA in different samples. The obtained results indicate that the five biological samples had significant clustering and partitioning phenomena (p < 0.05). The percentage of the first principal component was 51.7% and the percentage of the second principal component was 25.2%. There was a small gap between SCFA levels in the feces and cecum contents of rats. However, there was a large difference between SCFA concentrations in the feces and cecum contents of pigs. Furthermore, the individual samples of rats, pigs, and bees, respectively, were collected from the same group that were fed the same diet and provided with the same living environment, and they produced similar concentrations of SCFA in the same parts of the body. However, different parts of the same species produced distinct concentrations of SCFA, inextricably linked to the type of intestinal flora and the metabolic capacity of the enterocytes [31].
The predominant gut bacteria in pigs, mice, and bees are Firmicutes, Proteobacteria, and Bacteroidetes at the phylum level [32,33,34]. The concentrations of SCFAs in mouse and pig samples assayed in this experiment were similar to results reported in the previous literature [35,36]. Few studies have reported SCFA detection and concentration in the intestines of honeybees [37]. The acetic acid was higher than any other SCFAs measured in both intestinal and fecal matrices, consistent with previously reported findings [29]. In particular, the level of acetic acid in the intestinal contents of honeybees was significantly higher than that in other species (Figure 3C). The diet of honeybees is distinctly different from that of mice and pigs. Honeybees use nectar and pollen as their primary source of carbohydrates and protein [34].
4. Conclusions
The findings of this study indicate that the main SCFAs, including acetic, propionic, isobutyric, butyric, isovaleric, valeric, and hexanoic acids were rapidly extracted from feces and intestinal contents at a low temperature using acetone as the extraction reagent combined with a SPE column (Bond Elut Plexa). The reported method has a convenient operation, relatively inexpensive reagents, good biosafety and public health, short pretreatment time, and low pollution to GC and column. Meanwhile, it has low LOD (0.11–0.36 μM) and LOQ (0.38–1.21 μM), excellent linearity of standards (R2 ≥ 0.9998), high recoveries (98.34–137.83%), and good reproducibility (RSD ≤ 1.30). These findings further support the suitability of the method for analyzing SCFAs in complex small amounts of feces and intestinal contents.
Supplementary Materials
The following supporting information can be downloaded at: https://www.mdpi.com/article/10.3390/separations11090270/s1. Table S1: The composition of SCFA stock standard solutions. Table S2: Analytical parameters for GC-FID analysis of SCFAs. Table S3: Additive recovery of SCFA from feces, extracted with different solvents and solid phase. Table S4: Recovery of different concentrations of SCFA standards was added. Table S5: Repeatability, intra-day, and inter-day stability of the method for the measurement of concentrations of SCFAs. Table S6: SCFA content of feces and cecum content of mice, pigs, and honeybees. Figure S1: SCFA gas chromatograms.
Author Contributions
Conceptualization, N.N.; methodology, X.Z. and T.C.; software, X.Z. and T.C.; validation, T.C.; formal analysis, X.Z.; investigation, X.Z., T.C., K.W. and X.X.; resources, N.N.; data curation, X.Z. and W.L.; writing—original draft preparation, X.Z.; writing—review and editing, X.Z., W.L., K.W. and X.X.; visualization, T.C.; supervision, K.W., X.X., N.N. and W.P.; project administration, N.N. and W.P.; funding acquisition, W.P. All authors have read and agreed to the published version of the manuscript.
Funding
This study was supported by the earmarked fund for the China Agriculture Research System-Bee (CARS-44-KXJ17), and the Science and Technology Innovation Project of the Chinese Academy of Agricultural Sciences (CAAS-ASTIP-2024-IAR).
Data Availability Statement
Data will be made available on request.
Conflicts of Interest
The authors declare no conflicts of interest.
References
- Zhang, S.M.; Wang, H.B.; Zhu, M.J. A sensitive GC/MS detection method for analyzing microbial metabolites short chain fatty acids in fecal and serum samples. Talanta 2019, 196, 249–254. [Google Scholar] [CrossRef] [PubMed]
- Primec, M.; Micetic-Turk, D.; Langerholc, T. Analysis of short-chain fatty acids in human feces: A scoping review. Anal. Biochem. 2017, 526, 9–21. [Google Scholar] [CrossRef] [PubMed]
- Arellano, M.; Jomard, P.; El Kaddouri, S.; Roques, C.; Nepveu, F.; Couderc, F. Routine analysis of short-chain fatty acids for anaerobic bacteria identification using capillary electrophoresis and indirect ultraviolet detection. J. Chromatogr. B 2000, 741, 89–100. [Google Scholar] [CrossRef] [PubMed]
- Kotani, A.; Miyaguchi, Y.; Kohama, M.; Ohtsuka, T.; Shiratori, T.; Kusu, F. Determination of Short-chain Fatty Acids in Rat and Human Feces by High-Performance Liquid Chromatography with Electrochemical Detection. Anal. Sci. 2009, 25, 1007–1011. [Google Scholar] [CrossRef]
- Vagaggini, C.; Brai, A.; Bonente, D.; Lombardi, J.; Poggialini, F.; Pasqualini, C.; Barone, V.; Nicoletti, C.; Bertelli, E.; Dreassi, E. Development and validation of derivatization-based LC-MS/MS method for quantification of short-chain fatty acids in human, rat, and mouse plasma. J. Pharm. Biomed. 2023, 235, 115599. [Google Scholar] [CrossRef]
- Garcia, A.; Olmo, B.; Lopez-Gonzalvez, A.; Cornejo, L.; Rupérez, F.J.; Barbas, C. Capillary electrophoresis for short chain organic acids in faeces Reference values in a Mediterranean elderly population. J. Pharm. Biomed. 2008, 46, 356–361. [Google Scholar] [CrossRef]
- Hauser, A.; Eisenmann, P.; Muhle-Goll, C.; Luy, B.; Dötsch, A.; Graf, D.; Tzvetkova, P. Efficient Extraction from Mice Feces for NMR Metabolomics Measurements with Special Emphasis on SCFAs. Metabolites 2019, 9, 55. [Google Scholar] [CrossRef] [PubMed]
- Scortichini, S.; Boarelli, M.C.; Silvi, S.; Fiorini, D. Development and validation of a GC-FID method for the analysis of short chain fatty acids in rat and human faeces and in fermentation fluids. J. Chromatogr. B 2020, 1143, 121972. [Google Scholar] [CrossRef]
- Zhao, R.S.; Chu, L.L.; Wang, Y.; Song, Y.; Liu, P.; Li, C.; Huang, J.J.; Kang, X.J. Application of packed-fiber solid-phase extraction coupled with GC-MS for the determination of short-chain fatty acids in children’s urine. Clin. Chim. Acta 2017, 468, 120–125. [Google Scholar] [CrossRef]
- Plotka-Wasylka, J.; Szczepanska, N.; de la Guardia, M.; Namiesnik, J. Modern trends in solid phase extraction: New sorbent media. Trac-Trend Anal. Chem. 2016, 77, 23–43. [Google Scholar] [CrossRef]
- Andrade-Eiroa, A.; Canle, M.; Leroy-Cancellieri, V.; Cerdà, V. Solid-phase extraction of organic compounds: A critical review (Part I). TrAC Trends Anal. Chem. 2016, 80, 641–654. [Google Scholar] [CrossRef]
- Buszewski, B.; Szultka, M. Past, Present, and Future of Solid Phase Extraction: A Review. Crit. Rev. Anal. Chem. 2012, 42, 198–213. [Google Scholar] [CrossRef]
- Andrade-Eiroa, A.; Canle, M.; Leroy-Cancellieri, V.; Cerdà, V. Solid-phase extraction of organic compounds: A critical review (Part II). TrAC Trends Anal. Chem. 2016, 80, 655–667. [Google Scholar] [CrossRef]
- McKay, M.J.; Castaneda, M.; Catania, S.; Charles, K.A.; Shanahan, E.; Clarke, S.J.; Engel, A.; Varelis, P.; Molloy, M.P. Quantification of short-chain fatty acids in human stool samples by LC-MS/MS following derivatization with aniline analogues. J. Chromatogr. B 2023, 1217, 123618. [Google Scholar] [CrossRef]
- Wang, H.Y.; Wang, C.; Guo, L.X.; Zheng, Y.F.; Hu, W.H.; Dong, T.T.X.; Wang, T.J.; Tsim, K.W.K. Simultaneous determination of short-chain fatty acids in human feces by HPLC with ultraviolet detection following chemical derivatization and solid-phase extraction segmental elution. J. Sep. Sci. 2019, 42, 2500–2509. [Google Scholar] [CrossRef]
- Li, R.; Tian, M.Z.; Feng, G.Y.; Hou, G.F.; Jiang, X.J.; Yang, G.; Xiang, Q.; Liu, X.J.; Long, C.M.; Huang, R.L.; et al. Determination and prediction of digestible energy, metabolizable energy, and standardized ileal digestibility of amino acids in barley for growing pig. Anim. Feed. Sci. Technol. 2023, 298, 115607. [Google Scholar] [CrossRef]
- Zheng, X.; Zhao, Y.Z.; Naumovski, N.; Zhao, W.; Yang, G.; Xue, X.F.; Wu, L.M.; Granato, D.; Peng, W.J.; Wang, K. Systems Biology Approaches for Understanding Metabolic Differences Using ‘Multi-Omics’ Profiling of Metabolites in Mice Fed with Honey and Mixed Sugars. Nutrients 2022, 14, 3445. [Google Scholar] [CrossRef]
- Douny, C.; Dufourny, S.; Brose, F.; Verachtert, P.; Rondia, P.; Lebrun, S.; Marzorati, M.; Everaert, N.; Delcenserie, V.; Scippo, M.L. Development of an analytical method to detect short-chain fatty acids by SPME-GC-MS in samples coming from an gastrointestinal model. J. Chromatogr. B 2019, 1124, 188–196. [Google Scholar] [CrossRef] [PubMed]
- Zhao, G.H.; Nyman, M.; Jönsson, J.Å. Rapid determination of short-chain fatty acids in colonic contents and faeces of humans and rats by acidified water-extraction and direct-injection gas chromatography. Biomed. Chromatogr. 2006, 20, 674–682. [Google Scholar] [CrossRef]
- García-Villalba, R.; Giménez-Bastida, J.A.; García-Conesa, M.T.; Tomás-Barberán, F.A.; Espín, J.C.; Larrosa, M. Alternative method for gas chromatography-mass spectrometry analysis of short-chain fatty acids in faecal samples. J. Sep. Sci. 2012, 35, 1906–1913. [Google Scholar] [CrossRef]
- Jordan, T.B.; Nichols, D.S.; Kerr, N.I. Selection of SPE cartridge for automated solid-phase extraction of pesticides from water followed by liquid chromatography-tandem mass spectrometry. Anal. Bioanal. Chem. 2009, 394, 2257–2266. [Google Scholar] [CrossRef] [PubMed]
- Klimowska, A.; Wynendaele, E.; Wielgomas, B. Quantification and stability assessment of urinary phenolic and acidic biomarkers of non-persistent chemicals using the SPE-GC/MS/MS method. Anal. Bioanal. Chem. 2023, 415, 2227–2238. [Google Scholar] [CrossRef]
- Lotti, C.; Rubert, J.; Fava, F.; Tuohy, K.; Mattivi, F.; Vrhovsek, U. Development of a fast and cost-effective gas chromatography-mass spectrometry method for the quantification of short-chain and medium-chain fatty acids in human biofluids. Anal. Bioanal. Chem. 2017, 409, 5555–5567. [Google Scholar] [CrossRef] [PubMed]
- Hsu, Y.L.; Chen, C.C.; Lin, Y.T.; Wu, W.K.; Chang, L.C.; Lai, C.H.; Wu, M.S.; Kuo, C.H. Evaluation and Optimization of Sample Handling Methods for Quantification of Short-Chain Fatty Acids in Human Fecal Samples by GC-MS. J. Proteome Res. 2019, 18, 1948–1957. [Google Scholar] [CrossRef] [PubMed]
- Nagatomo, R.; Kaneko, H.; Kamatsuki, S.; Ichimura-Shimizu, M.; Ishimaru, N.; Tsuneyama, K.; Inoue, K. Short-chain fatty acids profiling in biological samples from a mouse model of Sjögren’s syndrome based on derivatized LC-MS/MS assay. J. Chromatogr. B 2022, 1210, 123432. [Google Scholar] [CrossRef]
- Dalile, B.; Van Oudenhove, L.; Vervliet, B.; Verbeke, K. The role of short-chain fatty acids in microbiota-gut-brain communication. Nat. Rev. Gastroenterol. Hepatol. 2019, 16, 461–478. [Google Scholar] [CrossRef]
- Fristedt, R.; Ruppert, V.; Trower, T.; Cooney, J.; Landberg, R. Quantitation of circulating short-chain fatty acids in small volume blood samples from animals and humans. Talanta 2024, 272, 125743. [Google Scholar] [CrossRef] [PubMed]
- Sebastià, C.; Folch, J.M.; Ballester, M.; Estellé, J.; Passols, M.; Muñoz, M.; García-Casco, J.M.; Fernández, A.I.; Castelló, A.; Sánchez, A.; et al. Interrelation between gut microbiota, SCFA, and fatty acid composition in pigs. mSystems 2024, 9, e01049-23. [Google Scholar] [CrossRef]
- Han, X.; Guo, J.L.; You, Y.L.; Yin, M.W.; Ren, C.L.; Zhan, J.C.; Huang, W.D. A fast and accurate way to determine short chain fatty acids in mouse feces based on GC-MS. J. Chromatogr. B 2018, 1099, 73–82. [Google Scholar] [CrossRef]
- Zheng, X.; Al Naggar, Y.; Wu, Y.C.; Liu, D.; Hu, Y.F.; Wang, K.; Jin, X.L.; Peng, W.J. Untargeted metabolomics description of propolis’s in vitro antibacterial mechanisms against Clostridium perfringens. Food Chem. 2023, 406, 135061. [Google Scholar] [CrossRef]
- Chen, C.Y.; Zhou, Y.Y.; Fu, H.; Xiong, X.W.; Fang, S.M.; Jiang, H.; Wu, J.Y.; Yang, H.; Gao, J.; Huang, L.S. Expanded catalog of microbial genes and metagenome-assembled genomes from the pig gut microbiome. Nat. Commun. 2021, 12, 1106. [Google Scholar] [CrossRef] [PubMed]
- Zhao, J.B.; Bai, Y.; Tao, S.Y.; Zhang, G.; Wang, J.J.; Liu, L.; Zhang, S. Fiber-rich foods affected gut bacterial community and short-chain fatty acids production in pig model. J. Funct. Foods 2019, 57, 266–274. [Google Scholar] [CrossRef]
- Kim, M.; Friesen, L.; Park, J.; Kim, H.M.; Kim, C.H. Microbial metabolites, short-chain fatty acids, restrain tissue bacterial load, chronic inflammation, and associated cancer in the colon of mice. Eur. J. Immunol. 2018, 48, 1235–1247. [Google Scholar] [CrossRef] [PubMed]
- Zheng, H.; Perreau, J.; Powell, J.E.; Han, B.F.; Zhang, Z.J.; Kwong, W.K.; Tringe, S.G.; Moran, N.A. Division of labor in honey bee gut microbiota for plant polysaccharide digestion. Proc. Natl. Acad. Sci. USA 2019, 116, 25909–25916. [Google Scholar] [CrossRef] [PubMed]
- Smith, P.M.; Howitt, M.R.; Panikov, N.; Michaud, M.; Gallini, C.A.; Bohlooly-Y, M.; Glickman, J.N.; Garrett, W.S. The Microbial Metabolites, Short-Chain Fatty Acids, Regulate Colonic Treg Cell Homeostasis. Science 2013, 341, 569–573. [Google Scholar] [CrossRef]
- Zhou, H.; Yu, B.; Sun, J.; Liu, Z.H.; Chen, H.; Ge, L.P.; Chen, D.W. Short-chain fatty acids can improve lipid and glucose metabolism independently of the pig gut microbiota. J. Anim. Sci. Biotechnol. 2021, 12, 61. [Google Scholar] [CrossRef]
- Zheng, H.; Powell, J.E.; Steele, M.I.; Dietrich, C.; Moran, N.A. Honeybee gut microbiota promotes host weight gain via bacterial metabolism and hormonal signaling. Proc. Natl. Acad. Sci. USA 2017, 114, 4775–4780. [Google Scholar] [CrossRef]
Disclaimer/Publisher’s Note: The statements, opinions and data contained in all publications are solely those of the individual author(s) and contributor(s) and not of MDPI and/or the editor(s). MDPI and/or the editor(s) disclaim responsibility for any injury to people or property resulting from any ideas, methods, instructions or products referred to in the content. |
© 2024 by the authors. Licensee MDPI, Basel, Switzerland. This article is an open access article distributed under the terms and conditions of the Creative Commons Attribution (CC BY) license (https://creativecommons.org/licenses/by/4.0/).