Abstract
Microplastics (MP), consisting of particles under 5 mm in size, and fibrous microplastics (FMPs), which originate from textiles and are shed during the washing process, are acknowledged as a new and expanding category of pollutants. This study aimed to conduct an analytical evaluation of the defragmentation process of polyester fabrics featuring a prominent tri-color pile surface. The evaluation involved washing the fabrics with detergent and water and employing various methods to assess the fabric, wastewater, and filter cake both prior to, and following, cryogenization. The specificity of a pile polyester fabric provided a baseline for evaluating the detergent and water system. Subjecting the polyester fabric to five cycles of washing in a detergent solution and water resulted in a measurable loss of mass. The pristine polyester fabric was analyzed microscopically and by FTIR, while the fabrics before and after washing were subjected to gravimetric analysis. The physico–chemical characteristics of the wastewater, such as the conductivity, turbidity, and chemical oxygen demand, were impacted by the composition of the washing bath. The application of pyrolysis, combined with gas chromatography and mass spectrometry (Py-GC/MS), on the filter cake demonstrated the value of using blank samples. The results indicated that both the detergent and the water significantly affected the release of FMPs during the washing process. Polyester fabric sample 1, which was washed in a detergent solution for five cycles, exhibited a mass loss of 1619 mg kg−1. In contrast, sample 2, consisting of a polyester fabric washed solely in water, showed a mass loss of 1707 mg kg−1 over the same number of cycles.
1. Introduction
Textiles may act as carriers for diverse functional and active substances, such as preparations, dyes, and different finishes, in both small and large quantities. Their ability to bind substances depends on numerous factors, including the composition of the raw materials (natural or synthetic) and the structural characteristics (fineness, uniformity, length and cross-section of the fibers, type of yarn (staple fibers or filaments), yarn metrics (fineness, uniformity, density, and twist), the characteristics of the yarn (regular or open-end, hairiness) and the type of manufacture (woven, knitted, non-woven, etc.) [1]. They release the same substances under dry and wet conditions; the donor potential is stimulated by external chemical and physical influences [2,3]. An additional problem is the fact that textiles also release fibrous structures, fragments with a certain adsorption capacity, that can be carriers for the pollutants present in the environment (water, soil, atmosphere) [4]. The source of fibrous microplastics (FMPs) is derived from textile products, mainly synthetic fibers (e.g., polyester) [5,6,7], which occur in different forms (fibers, fragments, flakes, films, grains), types, sizes, and colors [8,9,10,11,12].
Due to their combination with pollutants in water, soil, and air, MPS and FMPs are also regarded as a “pollutant cocktail” [13]. Synthetic fiber washings constitute approximately 34.8% of the primary microplastics released into oceans globally. Consequently, research is concentrated on examining the presence and morphology of microplastic fibers [14]. The reasons why fibrous microplastics are potentially more dangerous than other types of microplastics are outlined in a paper stating that one third of the microplastics in surface waters are caused by microplastics released from textile products containing textile fibers (fibrous microplastics) [15]. In 2011, the first direct assessment of washing wastewater as a source of microplastic fibers was conducted; since 2015, studies have focused on quantifying the release of these fibers during the washing process [16].
The process of washing and drying synthetic textiles is considered to be one of the main causes of FMPs` formation, which is why a large number of studies have focused on this topic [17,18,19,20].
The multifaceted and interdisciplinary characteristics of this issue necessitate the use of various approaches and methodologies in research. The research outcomes and achievements undoubtedly promoted the development and acceptance of international standards (ISO) for textiles and textile products related to microplastics from textile sources in 2023 [21,22,23]. Thus, the existence of simpler and more complex matrices in the environment may create certain threats and risks, highlighting the need for their identification and analysis. This study focuses on the release of FMPs from a complex pile-woven structure during the washing process, using a standard detergent and water.
The objective of this research is to quantify the impact of bath composition on the defragmentation of polyester fabric featuring a pronounced pile surface during the washing process, utilizing various approaches and methods for analyzing the fabric, wastewater, and filter cake.
A further contribution of this research involves the preparation of the filter cake through cryogenization, enabling the analysis of the composition of the separated FMPs via pyrolysis coupled with gas chromatography and mass spectrometry (Py-GC/MS). This analysis will be compared against established standards for MPs.
2. Materials and Methods
2.1. Material
The fabric structure underwent a decomposition analysis, demonstrating the primary fabric and structural units, specifically, the pile and thread. Polyester fabric has a very specific and complex multicomponent structure [24]. The mass-per-unit area of this double-sided weft plush, which is composed of a structure with a higher density in the base weft (plain, twill) and a lower density in the weft floating pile, is 280 g/m2.
The raw material composition of this complex fabric, which consists of the base structure, the pile, and the threads, was determined using FTIR. A digital microscope was utilized to conduct a surface analysis on every component of the sample.
Samples measuring 5 × 5 cm were created using an ultrasonic cutter, model TTS 400, from Sonowave S.r.l., Legnano, Italy, to ensure that the edges of the fabric sample remained intact and free from defragmentation. The polyester fabric samples were prepared, weighed, and then underwent a washing process in two different conditions, one in a detergent solution, and the other in hard water.
2.2. Washing Process
The first washing process (1) was performed according to HRN EN ISO 6330 [25], procedure 2A, in a Rotawash laboratory apparatus (SDL Atlas, Rock Hill, SC, USA). The washing procedure was conducted at a temperature of 60 °C over five cycles, utilizing the reference detergent, ECE A (1.25 g/L) wfk Germany, mixed with tap water at a ratio of 1:7 for a duration of 40 min. After the washing procedure, the polyester samples were rinsed four times with tap water at a 1:8 ratio and allowed to dry in ambient conditions.
The second washing process (2) was performed according to [25], procedure 2A, in a Rotawash laboratory apparatus (SDL Atlas, Rock Hill, SC, USA). The procedure was conducted at a temperature of 60 °C over five cycles, utilizing tap water in a 1:7 ratio for a duration of 40 min. After the washing procedure, the polyester samples were rinsed four times with tap water at a 1:8 ratio and allowed to dry in ambient conditions.
In order to investigate the influence of the textile material on the degree of wastewater pollution more comprehensively, two additional processes (3, 4) were carried out to simulate the washing process without the polyester fabric (blank tests for both the detergent and the water). The aforementioned conditions were reiterated through five washing cycles using a detergent solution and water at a temperature of 60 °C, followed by rinsing, to obtain a composite sample of the wastewater. The wastewater samples, obtained according to the described protocols, are described in Table 1.

Table 1.
Designation of the collected wastewaters.
The protocols were conducted in six replicates, analyzing three distinct groups of wastewater samples by measuring the pH, conductivity, turbidity, and chemical oxygen demand (COD). The three remaining wastewater samples were processed through single-stage membrane filtration employing a China FilterBio® polyethersulfone membrane filter, which has a diameter of 47 mm and a pore size of 0.22 μm (FBM047PES022).
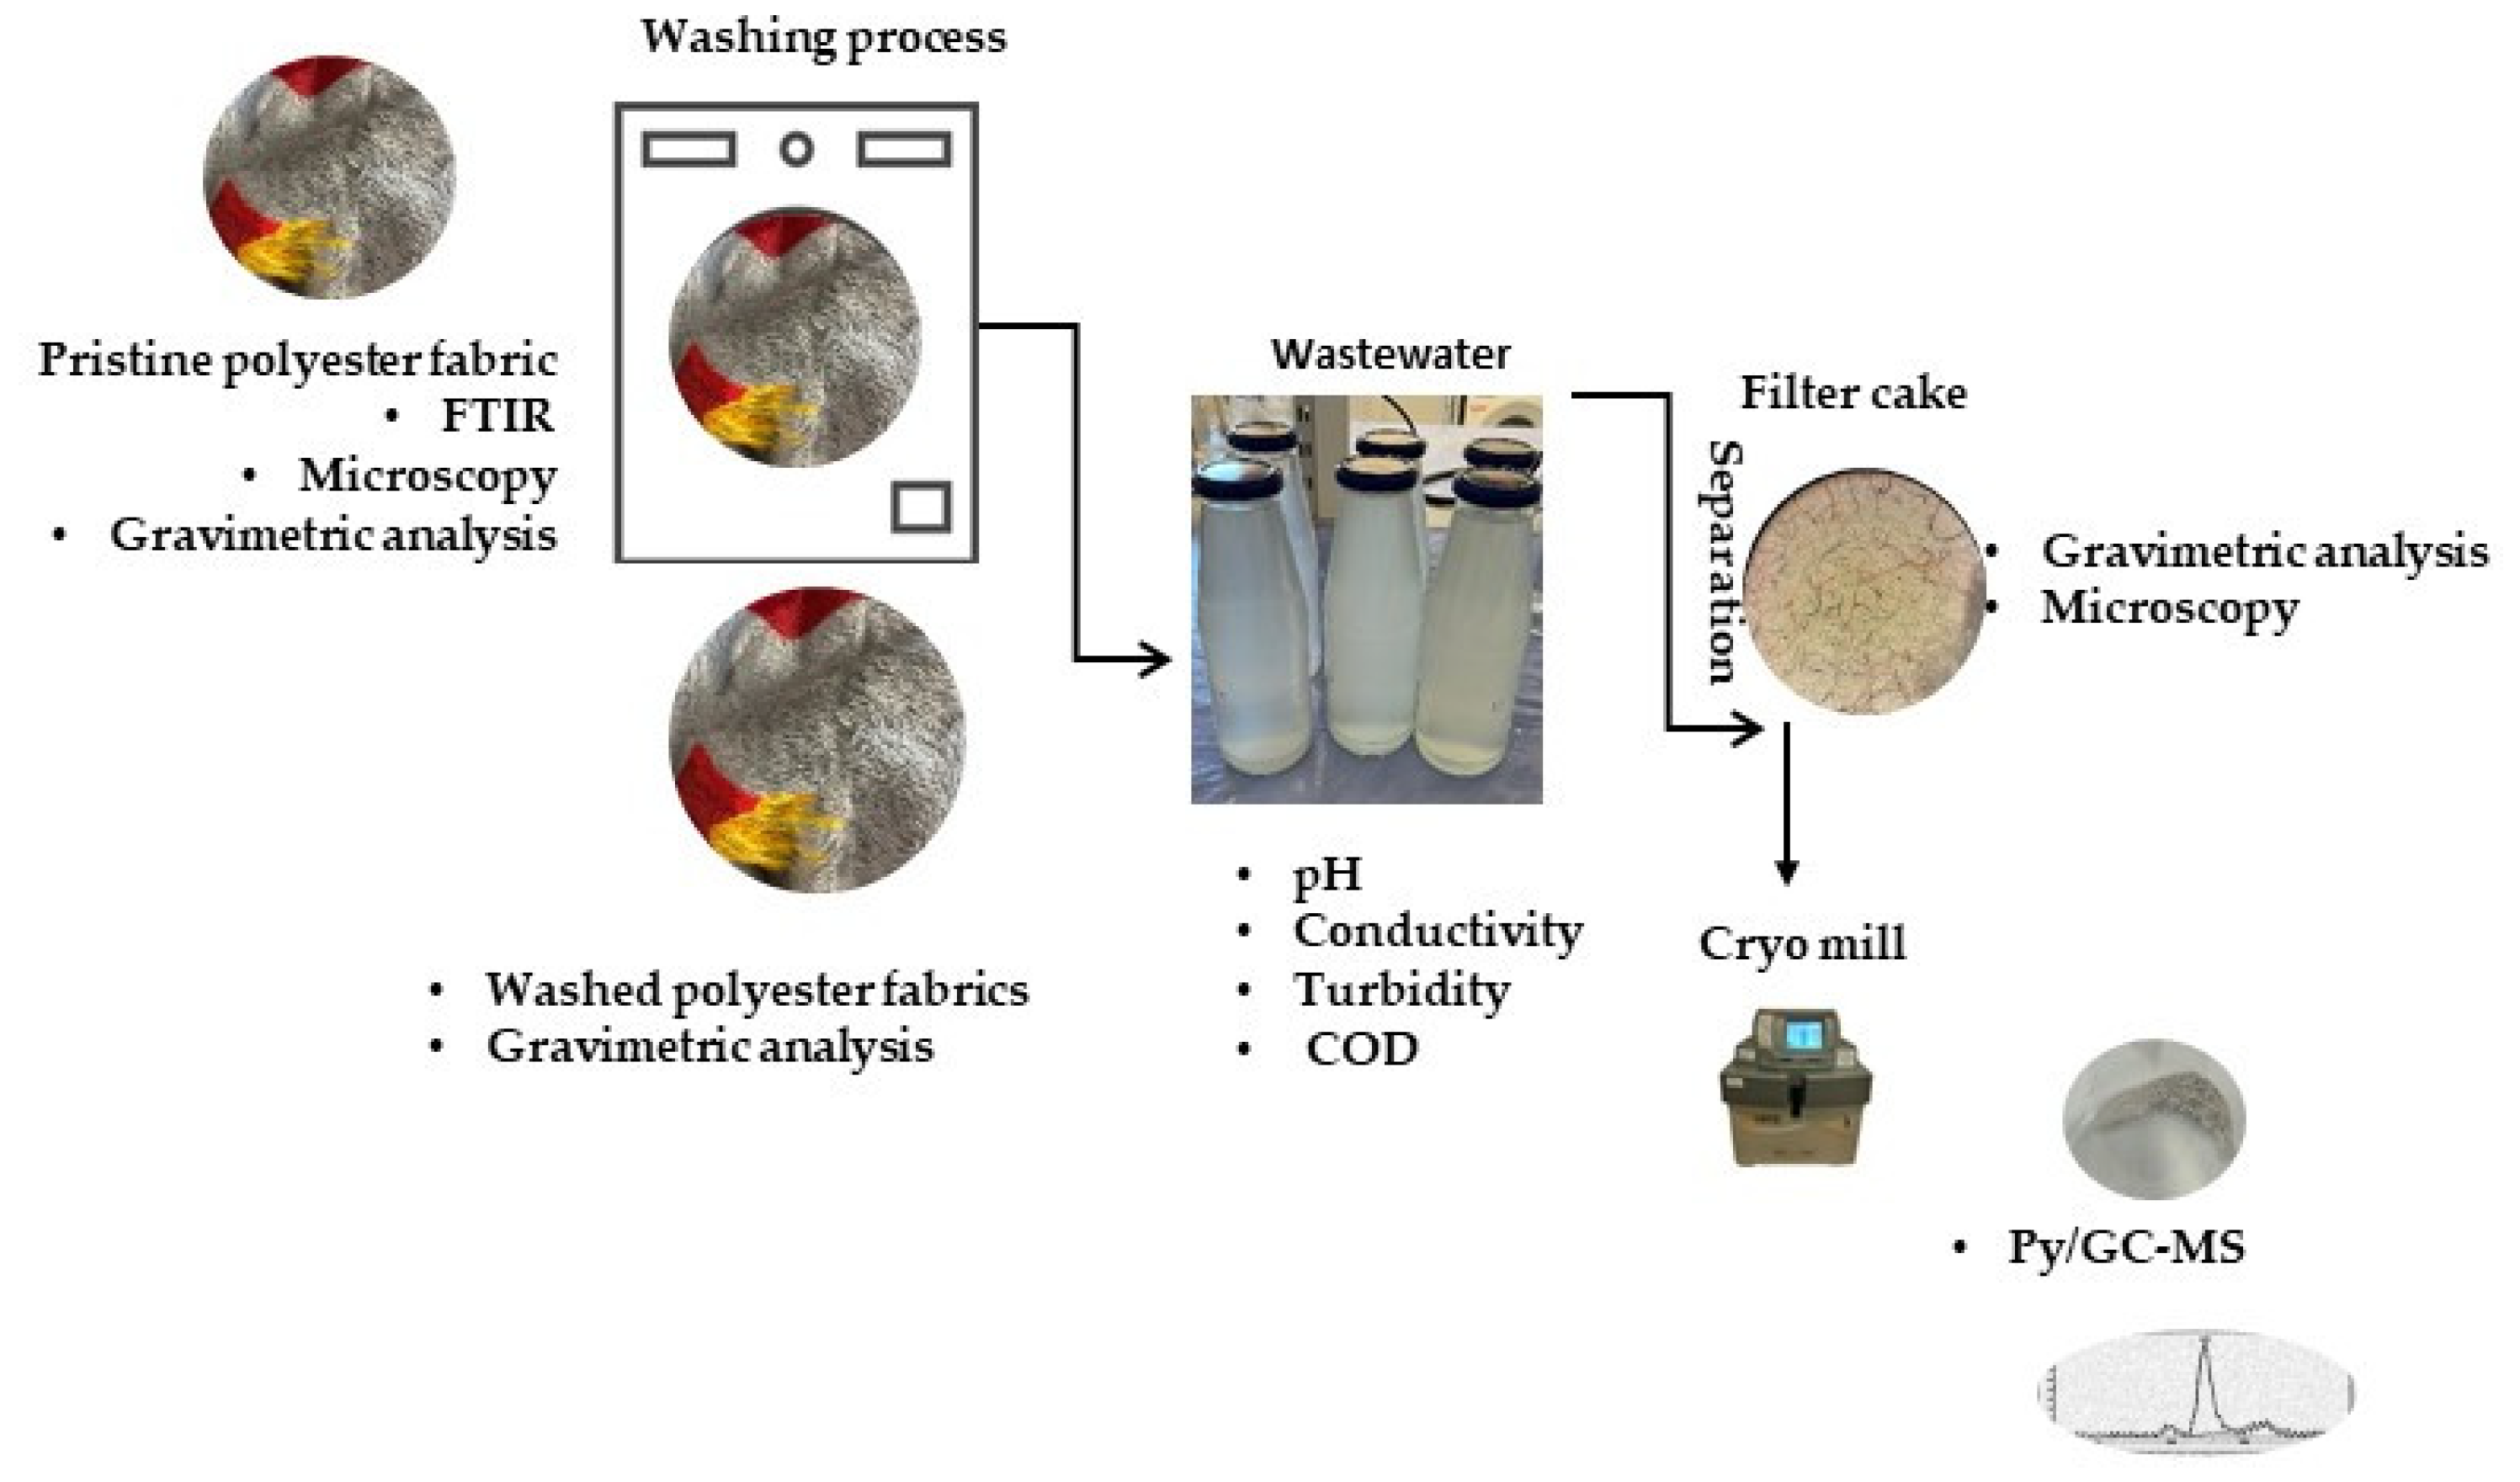
The characterization of the filter cakes labeled as 1*, 2*, 3* and 4*, which were isolated from wastewaters presented in Table 1 via the filtration process, was conducted using gravimetry, microscopy, and Py-GC/MS methods. The washing protocol and methods for the analysis of the polyester fabric, wastewaters and filter cakes are presented in Figure 1.
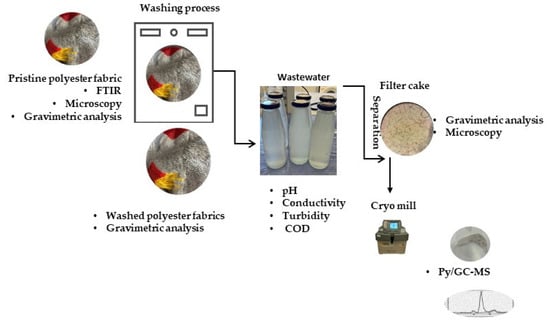
Figure 1.
Protocols and methods.
2.3. Methods
2.3.1. Material
Four structural units of a complex selected fabric were analyzed by Fourier transform infrared spectroscopy (FTIR, Perkin Elmer, Spectrum 100, Shelton, CT, USA), with the attenuated total reflection (ATR) measurement technique supported by the Spectrum 100. Four scans were performed for each unit, with a resolution of 4 cm−1 between 4000 cm−1 and 380 cm−1.
A DinoLite digital microscope, Premier IDCP B.V. Almere, the Netherlands, was utilized to observe and capture images of the structural units at a magnification of 50×.
The gravimetric technique was employed to monitor weight variations in the fabric throughout five washing cycles. A Kern balance, model ALJ 220-5DNM (Hong Kong), was utilized to measure the weight of the polyester fabric prior to (mF), and following, five wash cycles (mF-w). This analysis aimed to assess the changes in mass of the polyester fabric and evaluate the extent of the defragmentation.
2.3.2. Wastewaters
Physico–chemical analysis techniques were employed to assess the loading levels of wastewater generated from five cycles of washing complex fabric using standard ECE-A detergent and water. This was compared to wastewater collected during the washing process conducted without the fabric, which served as blank tests for the system utilizing detergent and water. The wastewater samples obtained following five washing cycles (1, 2, 3 and 4) were analyzed through physico–chemical methods, including analyses of the pH, conductivity, turbidity, and chemical oxygen demand.
The procedure for determining the pH value complied with the standard protocols [26]. The pH and conductivity values were measured using a SevenCompact™ Duo S213 multimeter, Mettler Toledo (Cheung Sha Wan, Hong Kong) [27].
The turbidity was measured in accordance with HRN EN ISO 7027 [28] using a TU5200 turbidimeter from Hach (Ames, IA, USA).
The chemical oxygen demand values were analyzed using the WTW Photolab S6 spectrophotometer (WTW, London, UK) [29].
2.3.3. Filter Cake
The gravimetric analysis was conducted to assess the filter cake (∆m) by measuring the weights of the filters prior to filtration (m0) and following the filtration process (m1) using a Kern balance, model ALJ 220-5DNM.
2.3.4. Microscopic Observation
The filter and filter cakes were examined at different magnifications of 7×, 14×, 35× and 45× using stereo microscope from the Meiji Techno EMZ series (Tokyo, Japan).
2.3.5. Sample Homogenization Prior to Pyrolysis
Filter cake samples (1, 2, 3 and 4) containing FMPs were ground to a fine powder in a compact cryomill from Cole-Parmer, St. Neots, UK (FreezerMill 6775), according to [30]. Prior to cryomilling, the filters were measured using a glass cup; following the grinding process, they were weighed once more to ascertain the mass of the cryofilter. The filter cakes were processed using a stainless-steel ball within small polycarbonate (PC) vials. The grinding process involved an initial pre-cooling phase lasting 1 min at a speed of 13 cycles per second, followed by alternating cycles of 1 min of grinding and 1 min of intermittent cooling. The duration of pre-cooling was determined to achieve a glass transition temperature lower than −196 °C, which is suitable for most polymer materials. The cryo-ground samples intended for MPs analysis, along with the MPs standards, were measured using a Mettler Toledo XPR 226CDR microbalance and placed in an inert stainless-steel cup before undergoing pyrolysis-gas chromatography–mass spectrometry (Py-GC/MS).
The quantitative analysis of the microplastics in separated particles required precise sample weight measurements to ensure that they corresponded with the calibration curve range. As a result, 0.2, 0.4, and 0.8 mg of the samples were selected for analysis (see Table 2), after which 4.0 mg of CaCO3 was incorporated into the sample cup. All samples underwent triplicate weighing for precision.
Table 2.
Mass of the MPs cryo-samples prior to pyrolysis.
2.3.6. Pyrolysis Gas Chromatography Mass Spectrometry (Py-GC/MS)
The analysis of the MPs was conducted on a GC/MS instrument (Shimadzu QP2010 Plus, Shimadzu, Japan) using separate samples following cryogenization. The GC/MS was interfaced directly with a micro-furnace pyrolyzer (EGA/Py3030D, Frontier Laboratories Europe, Essen, Germany), equipped with an auto-shot sampler (AS-1020E, Frontier Laboratories), through the split/splitless injection port. Pyrolysis was carried out at 600 °C, with the interface temperature consistently held at 300 °C. The experiment employed helium as the carrier gas, boasting a purity of 99.999%, and was regulated at a pressure flow control rate of 75 kPa. The injection was executed with a split ratio of 1:50 at a temperature of 300 °C. The GC injection port was connected to a quadrupole mass detector through a column system composed of a pre-column (Ultra ALLOY+-50, 2 m × 0.25 mm i.d., coated with a 1.0 μm film thickness of 50% diphenyl and 50% dimethylpolysiloxane (Frontier Laboratories, Ltd.), a separation column (Ultra ALLOY+-5, 30 m × 0.25 mm i.d., coated with a 0.5 μm film thickness of 5% diphenyl and 95% dimethylpolysiloxane (Frontier Laboratories, Ltd.) and a vent-free GC/MS adapter. The chromatographic sequence began with an initial temperature of 40 °C for 2 min, followed by a temperature increase to 280 °C at a rate of 20 °C per minute, held for 10 min and concluded with a rise to 320 °C at a rate of 40 °C per minute, held for 20 min. The ion source of the mass spectrometer was maintained at a temperature of 250 °C. Electron ionization (EI) mass spectra were obtained at 70 eV, covering a mass-to-charge ratio (m/z) range of 29 to 350 amu. The compounds that define the MPs calibration standard in CaCO3, including indicator ions for 12 polymers, are detailed in Table 3.
Table 3.
Characteristic compounds of the calibration standard for MPs in CaCO3, incorporating indicator ions for twelve different polymers.
The software F-Search MPs 2.1 (Frontier Laboratories, Ltd.) was used for the identification and quantitative analysis of MPs in the separated particles. The calibration curves were validated using polymer mixtures of 12 polymers with a microplastics calibration standard set (Frontier Laboratories Ltd., Japan). Furthermore, the data search libraries utilized included the F-Search all-in-one system (version 3.7) from Frontier Laboratories Ltd., Japan. In order to avoid the accumulation of high boiling compounds in the system, the chromatographic column was conditioned after each measurement of the MPs. The quality-control parameters indicated that the correlation coefficient of the linear calibration curve exceeded 0.99, with a probability greater than 90% and an RSD% value for the measured samples.
3. Results
The examination of the FMPs shed from the polyester fabrics across various washing systems was conducted through multiple methodologies, involving the analysis of textiles, wastewater, and filters.
3.1. Analysis of Polyester Fabric
The fabric structure underwent a decomposition analysis, demonstrating the primary fabric and structural units, specifically the pile and thread. The examination of the intricate chosen fabrics involved microscopy, FTIR, and gravimetric analysis. The fabric of the complex structure, which consists of four structural units, a woven basic fabric, and a pile with three colors (red, yellow and grey), was analyzed before washing and was examined using a digital microscope and FTIR.
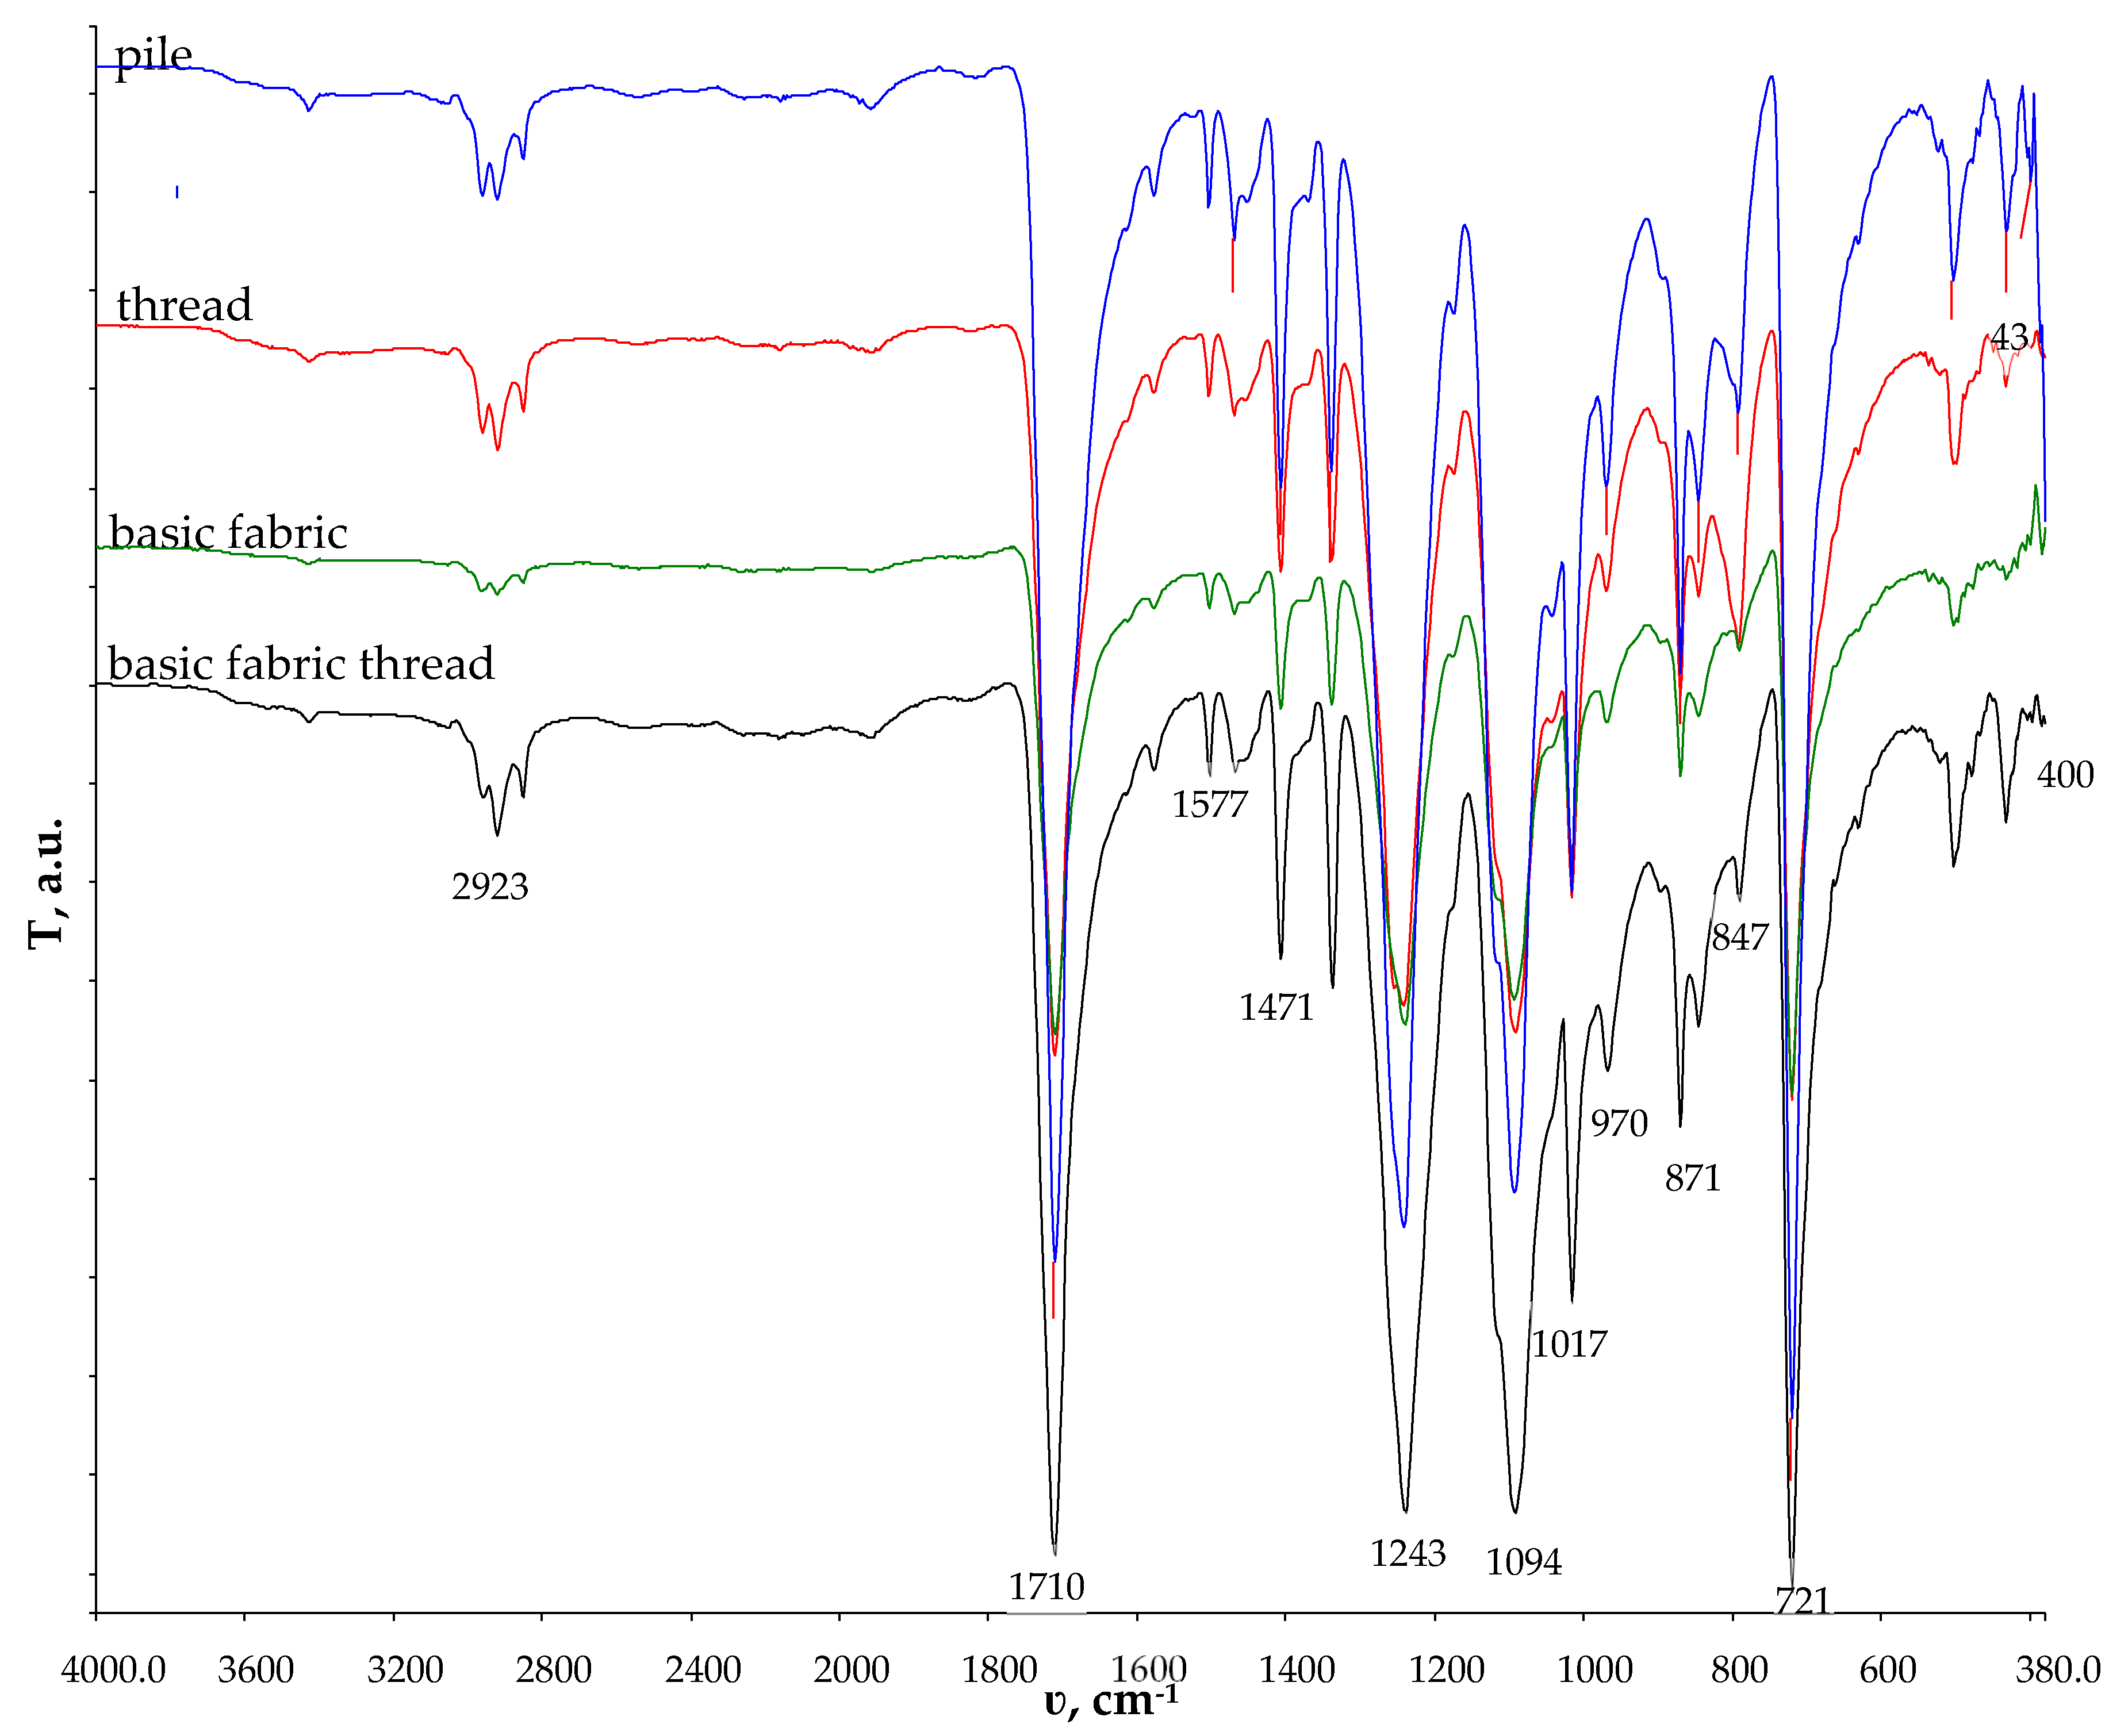
Figure 2 presents the micrographs depicting the front and back sides of the grey, red, and yellow pile, while Figure 3 illustrates the FTIR analysis of the distinct structural components.
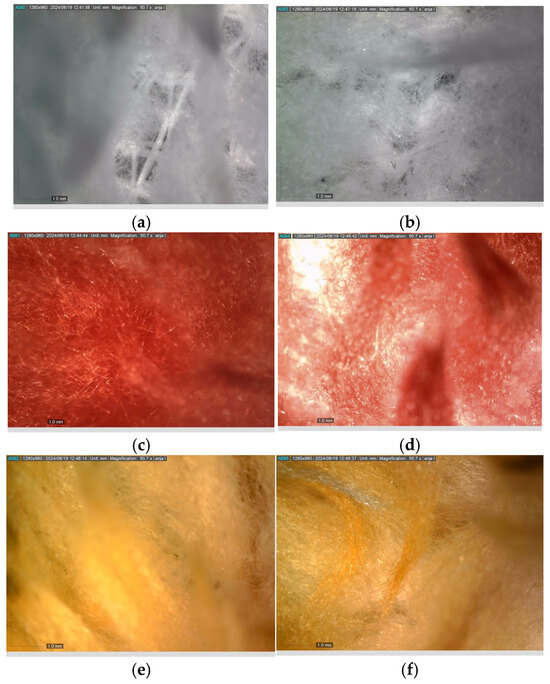
Figure 2.
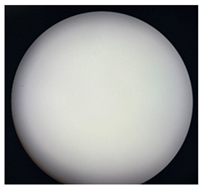
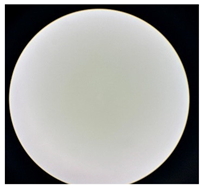
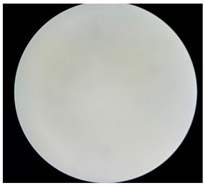
Digital images of the structural units of the complex structure, magnification 50× (a) front side of the white basic fabric with the grey pile, (b) the back side of the white basic fabric with the grey pile, (c) the front side of the red pile, (d) the back side of the red pile, (e) the front side of the yellow pile, (f) the back side of the yellow pile.
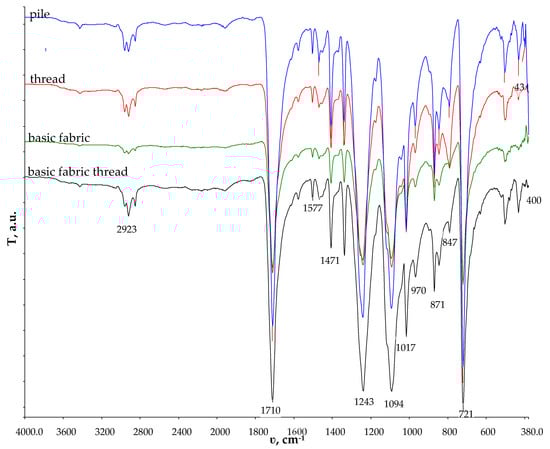
Figure 3.
FTIR–ATR of the structural units of double-sided weft plush polyester fabric.
Figure 2 shows the digital images of the front and back sides of the structural units of the complex structure at 50× magnification. Figure 2a is the white basic fabric with the grey pile. Section 2b is a digital image of the back of the white basic fabric with grey pile. Figure 2c shows the front of the red pile and Figure 2d shows the back of the red pile. The front of the yellow pile is shown in Figure 2e; the back of the yellow pile is shown in Figure 2f.
FTIR was used as the method with which to identify the composition of the fabric structural units in order to later relate the composition of the separated content with the focus on the types of MPs based on the Py-GC/MS results.
According to [31], the PET in the FTIR spectrum has a typical signal at 1710 cm−1, corresponding to the carbonyl C=O stretching of ester bonds. Other peaks are located at the following wavenumbers: 2970–2907 cm−1 (C-H stretching); 1579 cm−1 (C-C aromatic stretching) 1405 cm−1; 1241 cm−1 (C-O stretching); and 871 cm−1 (C-H bending). The FTIR analysis revealed that all the structural units consisted of polyester.
In intricate washing systems, the possibility of fragment accumulation in the pipes exists, which emphasizes the significance of gravimetric analysis as a simple yet trustworthy approach for assessing the fragments released throughout the washing process. The standards released in 2023 validate the previously mentioned facts and the implementation of this method. The weights of the polyester fabric samples were recorded before (mF) and after the washing process (mF-w) to assess the materials’ conditions and, specifically, to examine how the process parameters affect mass change. The results of the gravimetric analysis are shown in Table 4.
Table 4.
Results of polyester fabric before (mF) and after 5 washing cycles (mF-w).
The data presented in Table 4 indicate that the washes performed in the detergent solution (1) and water (2) across five cycles influenced the loss of mass in the polyester fabric, with the loss values being nearly the same. The results of the gravimetric analysis did not support the hypothesis that the composition of the bath, specifically the detergent and water, as a chemical factor, affects the loss of mass. The analysis of the polyester fabric weight loss revealed that FMPs were released from the fabric during washing. This can be attributed to the impact of temperature and mechanical factors, which are essential elements of Sinner’s circle [1]. These findings are not in line with earlier studies concerning standard-quality polyester fabrics, which indicated a mass increase after washing under comparable conditions, nor are they in line with research results on other textile materials [32,33]. This unexpected result required an analysis of the blank samples and the implementation of other methods, as follows.
3.2. Analysis of the Wastewater
The impact of the bath composition on defragmentation and the wastewater load resulting from five washing and rinsing cycles was assessed by measuring the pH values, conductivity, turbidity, and chemical oxygen demand (COD), as presented in Table 5. The relevant values were assessed for tap water and the ECE A detergent at a concentration of 1.25 g/L.
Table 5.
Physico–chemical parameters of the analyzed solutions.
The pH of the wastewater samples varied, ranging from 1 to 4. Samples 1, 2, and 3 exhibited alkaline characteristics, while sample 4 was neutral, slightly exceeding the pH of hard water, which is measured at 6.96. The ECE detergents were found in wastewaters 1 and 3, leading to the anticipated alkalinity. Conversely, the pH of wastewater 2 (water) was not as expected, particularly since hard water usually has a pH of 6.96. The alkalinity of the wastewater can be attributed to the process conditions that allow for the release of alkaline residues from the polyester fabric at a temperature of 60 °C [1].
The conductivity of hard water is 611.4 µS/cm, which corresponds to the quality of hard water [34], the hardness of which is 21.0 °dH. The conductivity values of samples 1, 2 and 3 were aligned, while sample 4 had the highest conductivity, and, thus, the highest degree of contamination with inorganic substances. The high value is a result of the washing process parameters that involve water and do not include the polyester fabric. The calcite deposits were found in the wastewater because they could not adhere to the carrier polyester fabric under the conditions of the washing process.
The turbidity of wastewater samples 1–3 differed significantly and corresponded completely to the composition of the baths in the washing process. Sample 1 was identified as wastewater produced during the washing of the polyester fabric with a detergent solution. The turbidity of this sample was 37.7 FNU, showing a significant reduction from the turbidity of the detergent solution, which measured 60.8 FNU. These differences can be attributed to surfactant substances, which are partly responsible for the turbidity of washing baths. This hypothesis is backed by the turbidity measurements of wastewater sample 3, which were produced from a simulated washing process with ECE A detergent (the blank detergent sample). Notably, its turbidity was 17 FNU units higher compared to that of sample 1.
The COD values indicate the existence of a specific chemical load, suggesting the high level of chemical contamination in sample 2 (COD = 149 mg O2/L), which was several times higher than the COD determined in water (COD = 10 mg O2/L).
The COD value of wastewater 1 (87 mg O2/L) was less than that of the COD of wastewater 2 (149 mg O2/L) as well as that of the ECE detergent (125 mg O2/L).
A possible explanation for COD value differences of samples 1 and 2 could be the deposition of detergent on the surface of the polyester fabric (sample 1) that prevented the release of FMP. Based on these results, it is possible to interpret the almost equal weight loss of the polyester fabric in the processes of washing with the detergent and in water.
Polyester fabric loses fragments in the process of washing with detergent; however, at a temperature of 60 °C, calcites are generated, which, as deposits, partly compensate for the lost mass.
The COD value in blank sample 3 (detergent) was 121 mg O2/L, which is approximately equal to the COD of the detergent (125 mg O2/L).
3.3. Filter Cakes
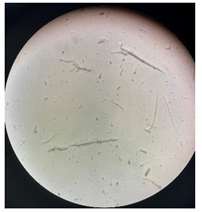
Images of filter cakes at various magnifications are frequently examined to assess and measure the extent of defragmentation. Consequently, a microscopic study was undertaken to investigate the existence and forms of the FMP particles that were separated from the wastewater.
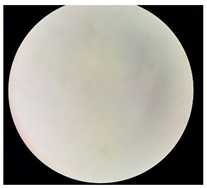
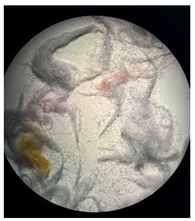
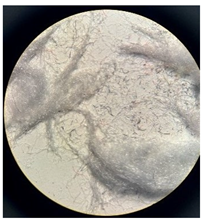
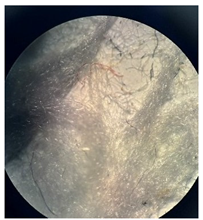
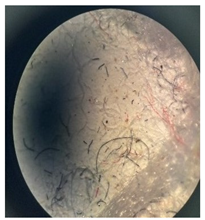
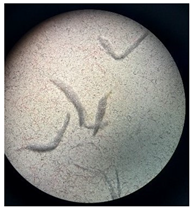
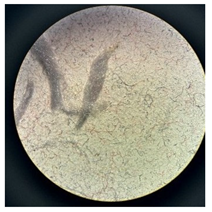
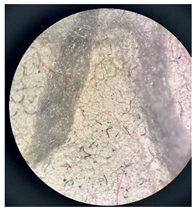
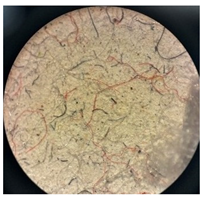
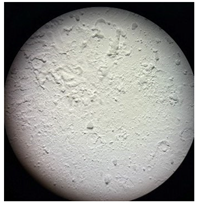
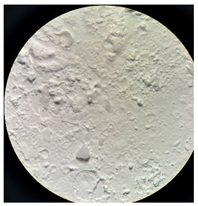
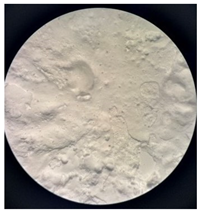
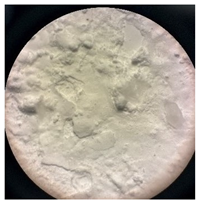
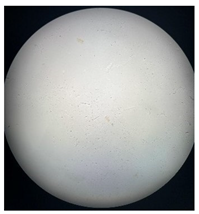
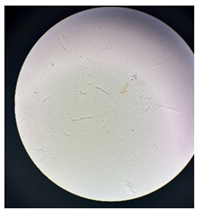
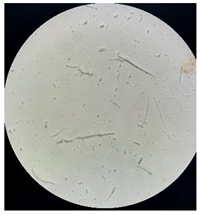
Table 6 displays microscopic images of both the filter and the filter cakes.
Table 6.
Microscopic images of filters and filter cakes (FC) at magnifications of 7×, 14×, 35×, and 45×.
Filter cakes 1* and 2* were found to contain fragments of polyester pile in red, yellow, and grey colors. The filter cake surface of sample 2* (washing with water) exhibits notable characteristics, displaying a more uniform distribution of fragments in comparison to sample 1 (washed with ECE A detergent). The detergent’s heterogeneous formulation, featuring an aluminosilicate builder, played a role in determining the placement of fragments on the filter surface when compared to sample 2. The filter containing the filter cake from sample 3 was heavily coated with undissolved detergent components, obscuring the filter surface. In contrast, the microscopic image of the filter with the filter cake from sample 4 reveals rod-like structures that may be linked to calcite formations, particularly in relation to the washing process conducted at 60 °C in hard water [35].
The data in Table 7 illustrate the mass measurements of sample filters taken before and after the filtration process, aimed at separating the particles from the wastewater (filter cake).
Table 7.
Masses of filter (m0), filter cakes (m1) and separated content (∆m).
When examining MPs in distinct particles, the proper pre-treatment of samples is crucial. The use of a cryomill can simplify the sample preparation process significantly. Thus, the filter cakes were cryomilled into a fine powder to create a uniform and homogeneous sample, which is essential for ensuring the reproducibility of the results. Physical/chemical parameters may have a significant impact on the filtration process and the content of the filter cake. The influence of the detergent on the release of MPs in the washing process after 5 cycles can be seen in the results obtained from the Py-GC/MS analysis (Table 8), characteristic of wastewater solutions (Table 5), and the mass of the filter cakes (Table 7). Sample 1 had the highest value of turbidity with the lowest COD value compared with sample 2, which corresponded with the higher values of the MPs in the filter cakes. Because Py/GC-MS is a very sensitive instrumental technique that involves sample degradation at elevated temperatures and the quantification of 12 polymers with specific markers, interference from ingredients other than the polymers themselves was not to be expected.
Table 8.
Quantitative results of MPs in filter cake samples.
The concentrations of released MPs, along with the corresponding quality-control parameters for the method, are presented in Table 8. In order to determine the content of released MPs quantitatively for Py-GC/MS analysis, it was necessary to adjust the mass of the samples.
The extracted ion chromatograms (EICs) for the MPs derived from sample 1, sample 2, and the blank samples (sample 3 and sample 4) are presented in Figures S1–S4, alongside the characteristic indicator ions from the standard.
4. Discussion
The results of earlier studies have shown that 100 to 300 mg kg−1 of washed textiles are released during household washing processes [36]. The polyester fabric sample 1, which was washed in a detergent solution for five cycles, exhibited a mass loss of 1619 mg kg−1. In contrast, sample 2, consisting of a polyester fabric washed solely in water, showed a mass loss of 1707 mg kg−1 over the same number of cycles. The slightly higher values of the released FMPs can be attributed to the higher number of washing cycles and the pile surface of the analyzed fabric. The results of the gravimetric analysis did not coincide with the results of previous studies, which confirmed the influence of detergent on the increased release of FPMs [33,37]. However, the degree of chemical loading of the wastewater (actual and blank samples) as well as the Py-GC/MS analysis of the filter cake were not aligned with the results of the gravimetric analysis. The reference detergent, ECE A, contains an insoluble aluminosilicate builder that influences the formation of deposits on the surface in hard water, which was confirmed by the filter cake of the blank sample for water (sample 4). Finally, it is important to point out that the insufficient number of standardized protocols for the assessment of FMPs released during the washing process, combined with the complexity of the textile properties and the factors of the washing process, causes difficulty in making comparisons between the methods used, the results obtained, and their interpretation [37].
In relation to the mass of the samples used for analysis, sample 1 displayed the highest levels of released polyester MPs, in contrast to samples 3 and 4, which showed the lowest levels of MPs (the presence of N-6, PVC, PC). Apart from the mass of the sample, the release of MPs is related to the washing process itself and the strong influence of the detergent in the washing process. No other polymers from the calibration standard set of 12 were found in the samples tested, or their concentrations were below the quantification limit established by the method used. The analysis after pyrolysis demonstrated that in samples 3 and 4 (see Table 8), which serve as blank samples or simulations of the washing process without polyester fabric, there were no detectable traces of the released PET polymer.
In order to verify these claims further, the mass of the sample was doubled, and pyrolysis of the samples was performed again. The probability rate and concentrations of the released PET MPs were significantly below the set values and below the limit of quantification. Although the results in samples 3 and 4 (Table 8) regarding the PET polymer MPs were expected, the detected traces of the released PC polymer MPs with a high probability rate were somewhat surprising. The released PC MPs can be attributed to the milling process, because the filter cakes were milled using a stainless-steel ball in small PC vials. Vials composed of PC polymers could potentially be the source of contamination, as evidenced by the detection of the released PCs in the analyzed samples.
Generally, the analysis of the filter cakes for sample 4, which acted as a blank for the water-wash wastewater without the presence of detergent, demonstrated a higher level of released microplastics in comparison to sample 3, where detergent was utilized during the washing process.
In the filter cakes corresponding to samples 3 and 4, traces of microplastics originating from PVC and N6 were detected, as indicated in Table 8. Considering that the samples contained only water and detergent, the presence of PVC and N6 can be linked to the detergent in sample 3 as the source of contamination.
Figures S3 and S4 present the extracted ion chromatograms (EIC) for the released MPs derived from sample 3 and sample 4, alongside the characteristic indicator ions from the standard.
After five cycles of washing with detergent, sample 1 demonstrated higher levels of released microplastics in comparison to sample 2. Sample 1 showed the highest concentration of released microplastic particles of PET and N6 (Table 8). In light of the significant concentrations of released MPs, it became necessary to minimize the sample volume to ensure compatibility with the calibration curve area for quantifying sample 1. The detected higher MPs concentrations can be attributed to the strong influence of detergent on the washing process. Following five cycles of washing with detergent (blank sample 3) and water (blank sample 4), the presence of released particles of N6 and PVC microplastics was observed. It is clear that the release of polyester microplastic fibers was significantly affected by the detergent used, which had a greater impact on the release of microplastics than the washing process with water alone, as indicated in Table 8. During the implementation of this research, in order to avoid contamination and system errors, we avoided direct contact of the solutions as well as the filter cakes with any type of plastic and preferred, instead, the use of glassware. The manufacturer recommended the use of this type of mill for the analysis of MPs. The Py/GC-MS system in this research was optimized for the quantitative determination of MPs with F-Search MPs 2.1 (Frontier Laboratories, Ltd.) software. PC MPs were detected in all samples except in sample 1. Compared to the other measured amounts of microplastics, PC was observed in the lowest concentrations, which we assume was due to contamination. As the focus of this work was solely on the detection and quantification of PET microplastics, the low detected concentrations of PC should not have any impact on the final results of this study. The only logical solution for the obtained results for the PC-MPs that came to our mind was direct contact of the sample with cryo-milling vials during the milling process.
5. Conclusions
The analysis of the polyester fabric, conducted before and after undergoing five washing cycles with ECE A detergent and water, demonstrated a measurable loss in mass. The surface tri-color pile of the complex structure of the polyester fabric contributed to the release of FMPs during the 5 washing cycles, which were conducted separately from the wastewater samples (sample 1 and sample 2). The lack of fabric in blank samples 3 (for detergent) and 4 (for water) was beneficial for analyzing the composition of the wastewater and the filter cake. Based on these results, there is a need to apply several methods for analyzing the influence of detergent and water in order to better connect the textile material, wastewaters, and filter cake. The results confirmed that this complex fabric with a tri-color pile has the potential to release FMPs when washed with detergent and water; therefore, future studies will also consider the influence of drying. Furthermore, given these findings, future research should include additional testing with another grinding system, such as, for example, a cup made of stainless steel.
Supplementary Materials
The following supporting information can be downloaded at: https://www.mdpi.com/article/10.3390/separations12020028/s1, Figure S1: Extracted ion chromatograms (EIC) MPs obtained from sample 1* and compared with characteristic indicator ions from the Standard; Figure S2: Extracted ion chromatograms (EIC) MPs obtained from sample 2* and compared with the characteristic indicator ions from the Standard; Figure S3: Extracted ion chromatograms (EIC) MPs obtained from sample 3* and compared with the characteristic indicator ions from the Standard; Figure S4: Extracted ion chromatograms (EIC) MPs obtained from sample 4* and compared with the characteristic indicator ions from the Standard.
Author Contributions
Conceptualization, T.P.; methodology, N.D. and A.Š.; validation, N.D.; formal analysis, N.D. and A.Š.; investigation, A.Š.; writing—original draft preparation, T.P. and N.D.; writing—review and editing, T.P., N.D., A.Š., T.D. and I.V.Š. All authors have read and agreed to the published version of the manuscript.
Funding
This research was funded by the Croatian Science Foundation, grant number HrZZ-IP-2020-02-7575, and, in part, by the HrZZ-DOK-2021-02-6750.
Data Availability Statement
The data are presented in the article.
Acknowledgments
The authors thank Sandra Flinčec Grgac for providing the FTIR analysis.
Conflicts of Interest
The authors do not declare conflicts of interest.
References
- Bishop, D. Physical and Chemical Effects of Domestic Laundering Processes, Chemistry of the Textiles Industry. In Chemistry of the Textile Industry, 1st ed.; Carr, C.M., Ed.; Blackie Academic and Professional: Glasgow, Scotland, 1995; Volume 4, pp. 125–171. [Google Scholar]
- Yun, C.; Cho, Y.; Park, C. Washing efficiency and fabric damage by beating and rubbing movements in comparison with a front-loading washer. Text. Res. J. 2017, 87, 708–714. [Google Scholar] [CrossRef]
- Palme, A.; Idström, A.; Nordstierna, L.; Brelid, H. Chemical and ultrastructural changes in cotton cellulose induced by laundering and textile use. Cellulose 2014, 21, 4681–4691. [Google Scholar] [CrossRef]
- Fred-Ahmadu, O.H.; Bhagwat, G.; Oluyoye, I.; Benson, N.U.; Ayejuyo, O.O.; Palanisami, T. Interaction of chemical contaminants with microplastics: Principles and perspectives. Sci. Total Environ. 2020, 706, 135978. [Google Scholar] [CrossRef] [PubMed]
- de Oliveira, C.R.S.; da Silva Júnior, A.H.; Mulinari, J.; Ferreira, A.J.S.; da Silva, A. Fibrous microplastics released from textiles: Occurrence, fate, and remediation strategies. J. Contam. Hydrol. 2023, 256, 104169. [Google Scholar] [CrossRef]
- Mitic, J.; Amin, G.; Kodrić, M.; Šmelcerović, M.; Ðordević, D. Polyester fibres structure modification using some organic solutions. Tekstil 2016, 65, 196–200. [Google Scholar]
- Wang, S.; Salmon, S. Progress toward Circularity of Polyester and Cotton Textiles. Sustain. Chem. 2022, 3, 376–403. [Google Scholar] [CrossRef]
- Deng, H.; Wei, R.; Luo, W.; Hu, L.; Li, B.; Di, Y.; Shi, H. Microplastic pollution in water and sediment in a textile industrial area. Environ. Pollut. 2020, 258, 113658. [Google Scholar] [CrossRef]
- Batool, I.; Qadir, A.; Levermore, J.M.; Kelly, F.J. Dynamics of airborne microplastics, appraisal and distributional behaviour in atmosphere; a review. Sci. Total Environ. 2022, 806, 150745. [Google Scholar] [CrossRef]
- Carney Almroth, B.M.; Åström, L.; Roslund, S.; Petersson, H.; Johansson, M.; Persson, N.K. Quantifying Shedding of synthetic fibers from textiles; a source of microplastics released into the environment. Environ. Sci. Pollut. Res. 2018, 25, 21191–21199. [Google Scholar] [CrossRef]
- Ma, Y.; Bao, Z.; Cai, S.; Wang, Q.; Dou, B.; Niu, X.; Meng, Q.; Li, P.; Guo, X. The Pollution Characteristics and Fate of Microplastics in Typical Wastewater Treatment Systems in Northern China. Separations 2024, 11, 177. [Google Scholar] [CrossRef]
- Zhang, Y.; Li, Y.; Su, F.; Peng, L.; Liu, D. The life cycle of micro-nano plastics in domestic sewage. Sci. Total Environ. 2022, 802, 149658. [Google Scholar] [CrossRef] [PubMed]
- Júnior, A.H.; Mulinari, J.; Oliveira, P.V.; Oliveira, C.R.S.; Júnior, F.W.R. Impacts of metallic nanoparticles application on the agricultural soils microbiota. J. Hazard. Mater. Adv. 2022, 7, 100103. [Google Scholar]
- Özkan, I.; Gündoğdu, S. Investigation on the microfiber release under controlled washings from the knitted fabrics produced by recycled and virgin polyester yarns. J. Text. Instute 2021, 112, 264–272. [Google Scholar] [CrossRef]
- Militký, J.; Novotná, J.; Wiener, J.; Křemenáková, D.; Venkataraman, M. Microplastics and Fibrous Fragments Generated during the Production and Maintenance of Textiles. Fibers 2024, 12, 51. [Google Scholar] [CrossRef]
- Browne, M.A.; Crump, P.; Niven, S.J.; Teuten, E.; Tonkin, A.; Galloway, T.; Thompson, R. Accumulation of microplastic on shorelines woldwide: Sources and sinks. Environ. Sci. Technol. 2011, 45, 9175–9184. [Google Scholar] [CrossRef]
- Piribauer, B.; Laminger, T.; Ipsmiller, W.; Koch, D.; Bartl, A. Assessment of Microplastics in the Environment—Fibres: The Disregarded Twin? Detritus 2020, 9, 201–212. [Google Scholar] [CrossRef]
- Choi, S.; Kwon, M.; Park, M.J.; Kim, J. Characterization of Microplastics Released Based on Polyester Fabric Construction during Washing and Drying. Polymers 2021, 13, 4277. [Google Scholar] [CrossRef]
- Pušić, T.; Vojnović, B.; Flinčec Grgac, S.; Čurlin, M.; Malinar, R. Particle Shedding from Cotton and Cotton-Polyester Fabrics in the Dry State and in Washes. Polymers 2023, 15, 3201. [Google Scholar] [CrossRef]
- Hernandez, E.; Nowack, B.; Mitrano, D.M. Polyester textiles as a source of microplastics from households: A mechanistic study to understand microfiber release during washing. Environ. Sci. Technol. 2017, 51, 7036–7046. [Google Scholar] [CrossRef]
- ISO 4484-1:2023; Textiles and Textile Products—Microplastics from Textile Sources. Part 1: Determination of Material Loss from Fabrics During Washing. International Organization for Standardization: Geneva, Switzerland, 2023.
- ISO 4484-2:2023; Textiles and Textile Products—Microplastics from Textile Sources. Part 2: Qualitative and Quantitative Analysis of Microplastics. International Organization for Standardization: Geneva, Switzerland, 2023.
- ISO 4484-3:2023; Textiles and Textile Products—Microplastics from Textile Sources. Part 3: Measurement of Collected Material Mass Released from Textile End Products by Domestic Washing Method. International Organization for Standardization: Geneva, Switzerland, 2023.
- Desinatura Tkanina, Hrvatska Tehnička Enciklopedija, 204. Available online: https://tehnika.lzmk.hr/tehnickaenciklopedija/desinatura_tkanina.pdf (accessed on 20 October 2024).
- HRN EN ISO 6330:2021; Textiles—Household Washing and Drying Procedures for Testing Textiles. Hrvatski Zavod za Norme: Zagreb, Croatia, 2021.
- HRN EN 27888:2008; Water Quality—Determination of Electrical Conductivity. Hrvatski Zavod za Norme: Zagreb, Croatia, 2008.
- HRN EN ISO 10523:2012; Water Quality—Determination of pH. Hrvatski Zavod za Norme: Zagreb, Croatia, 2012.
- HRN EN ISO 7027-1:2016; Water Quality—Determination of Turbidity. Hrvatski Zavod za Norme: Zagreb, Croatia, 2016.
- HRN EN ISO 15705:2003; Water Quality—Determination of the Chemical Oxygen Demand Index (ST-COD)—Small-Scale Sealed-Tube Method. Hrvatski Zavod za Norme: Zagreb, Croatia, 2003.
- ASTM D8401-24; Standard Test Method for Identification of Polymer Type and Quantity of Microplastic Particles and Fibers in Waters with High to Low Suspended Solids Using Pyrolysis-Gas Chromatography/Mass Spectrometry Significance and Use. American Society for Testing and Materials: West Conshohocken, PA, USA, 2024.
- Available online: https://spectra.cs.ut.ee/textile-fibres/polyester/ (accessed on 22 December 2024).
- Pušić, T.; Čurlin, M.; Šaravanja, A.; Šimić, K.; Vidić Štrac, I.; Dimitrov, N. Quantification of shedding propensity of polyester fabrics in the washing process. Holist. Approach Environ. 2024, 14, 114–122. [Google Scholar] [CrossRef]
- Cesa, F.S.; Turra, A.; Checon, H.H.; Leonardi, B.; Baruque-Ramos, J. Laundering and textile parameters influence fibers release in household washings. Environ. Pollut. 2020, 257, 113553. [Google Scholar] [CrossRef] [PubMed]
- Danby, S.G.; Brown, K.; Wigley, A.M.; Chittock, J.; Pyae, P.K.; Flohr, C.; Cork, M.J. The Effect of Water Hardness on Surfactant Deposition after Washing and Subsequent Skin Irritation in Atopic Dermatitis Patients and Healthy Control Subjects. J. Investig. Dermatol. 2018, 138, 68–77. [Google Scholar] [CrossRef] [PubMed]
- Gotto-Doshida, S.; Saito, M.; Nagayama, M. Effects of Calcium Present in Fabric and in Washing Liquor on Detergency. J. Oleo Sci. 2003, 52, 73–82. [Google Scholar] [CrossRef]
- De Falco, F.; Di Pace, E.; Cocca, M.; Avella, M. The contribution of washing processes of synthetic clothes to microplastic pollution. Sci. Rep. 2019, 9, 6633. [Google Scholar] [CrossRef]
- Allen, E.; Henniger, C.E.; Garforth, A.; Asuquo, E. Microfiber Pollution: A Systematic Literature Review to Overcome the Complexities in Knit Design to Create Solutions for Knit Fabrics. Environ. Sci. Technol. 2024, 58, 4031–4045. [Google Scholar] [CrossRef]

Disclaimer/Publisher’s Note: The statements, opinions and data contained in all publications are solely those of the individual author(s) and contributor(s) and not of MDPI and/or the editor(s). MDPI and/or the editor(s) disclaim responsibility for any injury to people or property resulting from any ideas, methods, instructions or products referred to in the content. |
© 2025 by the authors. Licensee MDPI, Basel, Switzerland. This article is an open access article distributed under the terms and conditions of the Creative Commons Attribution (CC BY) license (https://creativecommons.org/licenses/by/4.0/).