Article

Assessment of Bioactive Compounds and Antioxidant Activity of Barley Sprouts

1
Department of Food Biotechnology and Environmental Science, Kangwon National University, Chuncheon 24341, Republic of Korea
2
Atomy R&D Center, Gongju 32511, Republic of Korea
3
F&B Bio Co., Ltd., Cheonan 31005, Republic of Korea
4
Department of Digital Cooperative Management, Agricultural Cooperative University, Goyang 10292, Republic of Korea
5
Agricultural and Life Sciences Research Institute, Kangwon National University, Chuncheon 24341, Republic of Korea
*
Authors to whom correspondence should be addressed.
Separations 2025, 12(3), 68; https://doi.org/10.3390/separations12030068
Submission received: 20 February 2025 / Revised: 5 March 2025 / Accepted: 11 March 2025 / Published: 13 March 2025
(This article belongs to the Special Issue Extraction and Isolation of Nutraceuticals from Plant Foods)

Abstract

:
Barley sprouts, rich in bioactive compounds, have gained attention as functional food ingredients because of their antioxidant potential. This study evaluated their bioactive composition and antioxidant capacity, focusing on the saponarin, chlorophyll, policosanol, total polyphenol (TP), and total flavonoid (TF) contents. The antioxidant capacity was assessed using 2,2-diphenyl-1-picrylhydrazyl (DPPH), 2,2′-azino-bis(3-ethylbenzothiazoline-6-sulfonic acid) (ABTS), and ferric-reducing antioxidant power (FRAP) assays. The results showed that barley sprouts contained 8.14 ± 0.02 mg/g of saponarin, 15.36 ± 0.18 mg/g of total chlorophyll, 396.99 mg/100 g of policosanols, 12.64 ± 0.04 mg of gallic acid equivalent (GAE)/g, and 5.99 ± 0.09 mg of rutin equivalent (RE)/g. The half-maximal inhibitory concentration (IC50) values exhibited the trend FRAP > DPPH > ABTS. Significant correlations (R > 0.891, p < 0.05) were observed between the antioxidant assays and TP and TF contents, indicating their substantial role in the antioxidant properties of barley sprout extracts. These findings suggest that barley sprouts are a valuable natural source of antioxidants for functional food applications. Nevertheless, additional in vivo and clinical research is necessary to improve their bioavailability and expand their potential use in food formulations.

1. Introduction

Sprouted grains are consumed globally, and have gained significant attention because they improve the nutritional content of food when used as ingredients [1]. In sprouted grains, various proportions of carbohydrates, proteins, and lipids undergo degradation, converting into simpler and more bioavailable compounds, such as sugars, free amino acids, and fatty acids, respectively [2,3,4,5]. Additionally, the germination process can influence the levels of essential minerals, vitamins, and phytochemical compounds, such as polyphenols, phytic acid, enzyme inhibitors, and glucosinolates [6,7,8,9,10].
The increasing demand for health-promoting foods is primarily driven by consumers’ interest in improving their well-being, further supported by the growing market for functional ingredient-based products [11]. Researchers are actively exploring new functional ingredients to expand the potential for developing innovative foods with nutritional advantages. Among these, barley powder, which is rich in bioactive compounds and easily incorporable into various food matrices, is considered a promising candidate for this purpose [12]. Sprouting is an inexpensive and sustainable process that enhances the content of functional compounds, digestibility, and bioavailability of grains [13,14].
Barley sprout is recognized as one of the oldest cultivated cereal grains in the world [15]. It is widely cultivated, and ranks as the fourth most produced grain globally, with an annual production of 157 million tons [16]. Barley sprout continues to be a staple grain in certain regions of Asia and North Africa. In recent years, its application as a food ingredient has increased, due to its high nutritional profile and abundance of bioactive compounds [17]. The major phytochemicals found in barley sprouts include phenolic acids, flavonoids, lignans, vitamin E (tocols), sterols, and folates [18]. Previous research has shown that barley sprouts exhibit significant free radical-scavenging activities, which may be attributed to their high levels of polyphenols, flavonoids, and other bioactive compounds [12,19].
This research aimed to analyze the bioactive compounds in barley sprouts by analyzing their saponarin, chlorophyll, and policosanol contents. Additionally, their antioxidant capacity was evaluated using a 2,2-diphenyl-1-picrylhydrazyl (DPPH)-scavenging activity assay, a 2,2′-azino-bis(3-ethylbenzothiazoline-6-sulfonic acid) (ABTS)-scavenging activity assay, and a ferric-reducing antioxidant power (FRAP) assay, along with determining the total polyphenol (TP) and total flavonoid (TF) contents.

2. Materials and Methods

2.1. Barley Sprout Sample and Chemicals

Barley sprouts (Hordeum vulgare L.) were freeze-dried at the Agricultural Cooperative University (Goyang, Republic of Korea). The barley sprouts were ground using a blender (SFM-555SP; Shinil Industrial Co., Ltd., Seoul, Republic of Korea) and sieved through a 40-mesh screen before use.
Barley sprouts (500 mg) were precisely measured (500 mg) and transferred into a 100 mL volumetric flask. Next, 100% methanol was introduced to adjust the volume to 100 mL, followed by extraction using a sonicator (JAC-4020, KODO Technical Research Co., Ltd., Hwaseong, Republic of Korea) for 30 min. Following the extraction process, the solution was subjected to centrifugation at 1520× g for 30 min to separate the supernatant. The resulting solution was then passed through a 0.45 µm syringe filter to ensure purity before analysis.
To extract policosanols, 1 g of barley sprouts was subjected to shaking extraction in hexane at 25 °C for 24 h. After the extraction, the solution underwent filtration, followed by vacuum evaporation to concentrate the crude extract. For gas chromatography–mass spectrometry (GC-MS) analysis, the extract was derivatized using N-methyl-N-(trimethylsilyl)trifluoroacetamide (MSTFA, Sigma-Aldrich, St. Louis, MO, USA), employing the same protocol as the reference standards.
A precise amount of 10 mg of saponarin (PHL89784; Sigma-Aldrich, St. Louis, MO, USA) was weighed and dissolved in 10 mL of absolute methanol to create a stock solution at a concentration of 1 mg/mL. This solution was stored at 4 °C and further diluted with methanol to obtain calibration standard solutions at concentrations of 6.25, 12.5, 25, 50, and 100 µg/mL.
For identification, the policosanols were derivatized into trimethylsilyl forms. To achieve this, 250 µL of MSTFA was introduced into 0.5 mL of chloroform containing the policosanol standards. The resulting mixture was then agitated at 50 °C for 15 min, after which additional chloroform was added to bring the final volume to 1 mL for subsequent analysis.
To measure the TP and TF contents and antioxidant activity, 1 g of the sample was extracted in 30 mL of methanol:water (1:1, v/v) using a sonicator for 1 h. The extract was then centrifuged at 1520× g for 30 min, filtered through a 0.45 µm syringe filter, and subsequently used for the experiments.

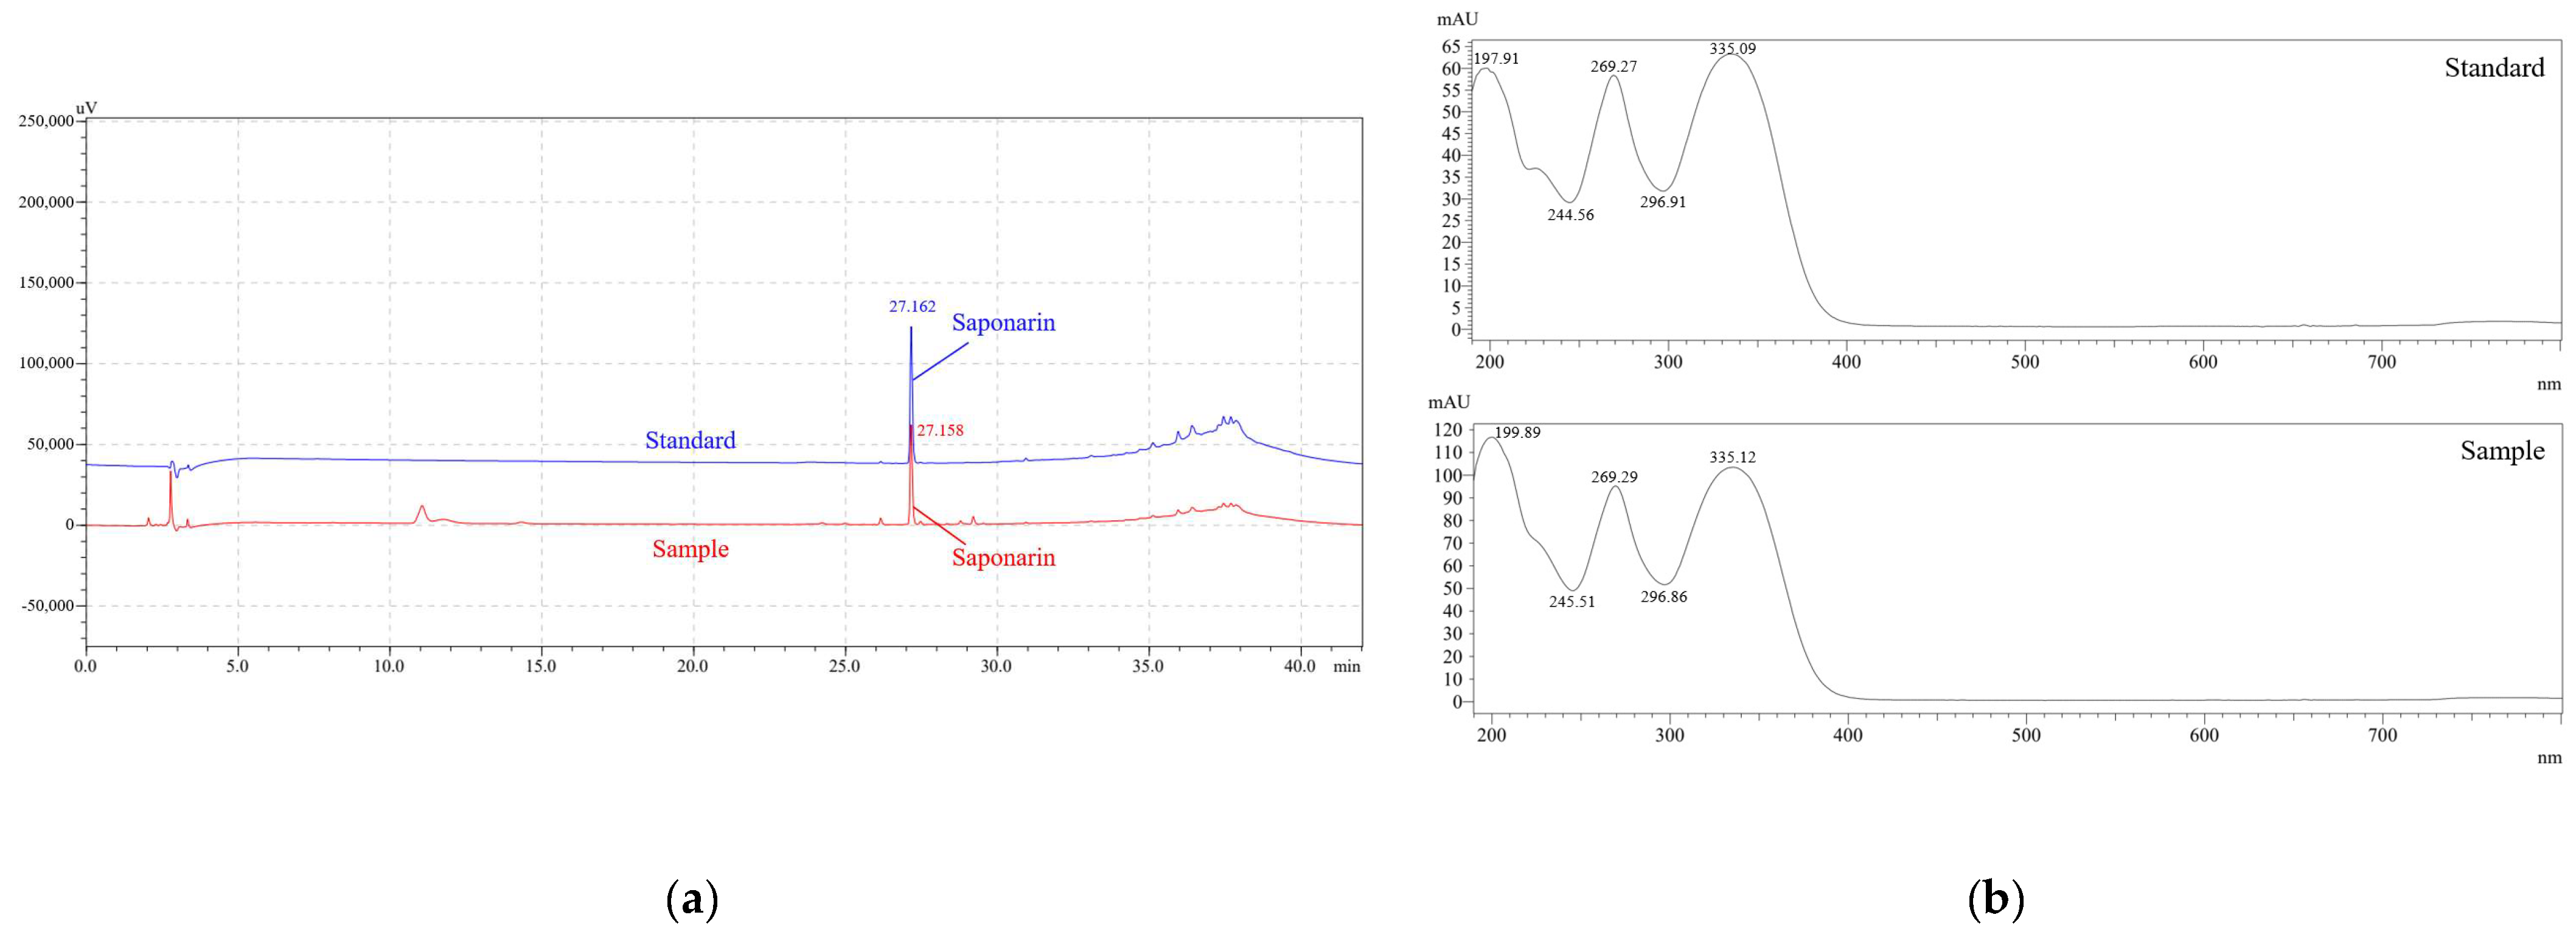
2.2. Analysis of Saponarin

The quantification of saponarin was carried out using high-performance liquid chromatography (HPLC) coupled with a photodiode detection array (PDA), following the protocol outlined by Kim et al. [20]. An HPLC analysis was performed utilizing a Shimadzu LC system (LC-40B XR, Shimadzu Co., Ltd., Kyoto, Japan) integrated with an PDA detector (SPD-M40, Shimadzu Co., Ltd., Kyoto, Japan). Chromatographic separation was achieved using a CAPCELL PAK C18 UG120 column (4.6 mm × 250 mm, 5 µm). The mobile phase consisted of 0.1% triple-distilled water containing 1% formic acid (solvent A) and acetonitrile with 1% formic acid (solvent B). The system operated at a flow rate of 1.0 mL/min, with the column temperature maintained at 40 °C. Sample injections were performed with a volume of 5 µL, and detection was conducted at a wavelength of 254 nm. The specific experimental parameters are summarized in Table 1.

2.3. Analysis of Chlorophylls

Barley sprouts (50 mg) were mixed with 10 mL of a solvent consisting of acetone and methanol (8:2, v/v). The solution underwent vortex mixing, followed by extraction for 1 h at 25 °C under dark conditions. After the extraction step, 1.5 mL of the resulting extract was subjected to centrifugation at 15,680× g for 10 min, and the supernatant was carefully separated. The remaining pellet was resuspended in 1 mL of the same acetone–methanol solvent (8:2, v/v), vortexed thoroughly, and re-centrifuged at 15,680× g for 10 min. The final supernatant was collected and pooled together with the previously obtained extracts. The combined extract was analyzed using a quartz cuvette to measure the absorbance at 645 and 663 nm, using an acetone–methanol solvent (8:2, v/v) as a blank. The chlorophyll content was calculated based on the measured absorbance values using Equations (1)–(3):
Chlorophyll a (mg⁄g) = (12.21 × A663 nm − 2.81 × A645 nm) × N × V/(1000 × M)
Chlorophyll b (mg⁄g) = (20.13 × A645 nm − 5.03 × A663 nm) × N × V/(1000 × M)
Total chlorophyll (mg⁄g) = chlorophyll a + chlorophyll b

2.4. Analysis of Policosanols

Policosanols were quantified following the analytical protocol established by Seo et al. [21]. The trimethylsilyl alcohol derivatives were characterized via gas chromatography (GC) coupled with mass spectrometry (MS). An Agilent Technologies 7890A series GC system, integrated with a single quadrupole MS detector (Agilent Technologies, Palo Alto, CA, USA), was utilized for the analysis. Chromatographic separation was performed using an HP-5MS capillary GC column (30 m × 0.25 mm × 0.25 µm film thickness; Agilent Technologies, Santa Clara, CA, USA). The oven temperature was programmed to gradually increase from 150 °C to 325 °C at a controlled rate of 4 °C/min, followed by a 5 min hold at 320 °C. Helium was employed as the carrier gas, flowing at a rate of 1.8 mL/min. Sample injection was conducted with a volume of 1 µL using an autosampler (Agilent Technologies, Santa Clara, CA, USA) and a split ratio of 1:5. For MS detection, the electron impact ion source and transfer line temperatures were set to 200 °C and 280 °C, respectively, with an ionization energy of 70 eV. The detailed experimental conditions are summarized in Table 2.

2.5. Total Polyphenol and Flavonoid Content

The TP content was assessed following the procedure outlined by Duval and Shetty [22]. A reaction mixture was prepared by combining 1 mL of the sample, 2% Folin–Ciocalteu phenol reagent, and 10% Na2CO3 in a 1:1:1 ratio, followed by incubation for 1 h. Upon completion of the reaction, absorbance was measured at 750 nm using a microplate reader (Spectramax i3; Molecular Devices Co., Sunnyvale, CA, USA). The TP content was quantified using a gallic acid calibration curve, and expressed as gallic acid equivalent (GAE)/g.
To evaluate the TF content, 0.5 mL of the sample was combined with 1.5 mL of 95% ethanol, 0.1 mL of 10% aluminum nitrate, 0.1 mL of 1 M potassium acetate, and 2.8 mL of distilled water. The solution was incubated at 25 °C for 30 min, and the absorbance was measured at 415 nm using a microplate reader (Spectramax i3, Molecular Devices Co., Sunnyvale, CA, USA). The TF content was determined using a rutin calibration curve, and expressed as rutin equivalent (RE)/g.

2.6. DPPH Radical-Scavenging Activity

The DPPH radical-scavenging activity assay operates on the principle that the stable free radical DPPH undergoes reduction in the presence of sulfur-containing amino acids, such as cysteine and glutathione, as well as ascorbic acid and aromatic amines. This reduction reaction results in a shift in color from purple DPPH to colorless diphenyl picrylhydrazine, which is accompanied by a corresponding change in absorbance. This method serves as a reliable approach for evaluating the antioxidant capacity of bioactive compounds [23].
A reaction mixture was prepared by combining 200 µL of the sample with 800 µL of 0.4 mM DPPH reagent, and incubating it in darkness for 10 min. The absorbance was recorded at 517 nm using a microplate reader (Spectramax i3, Molecular Devices Co., Sunnyvale, CA, USA). The DPPH radical-scavenging activity was determined based on Equation (4), with the results expressed as the half-maximal inhibitory concentration (IC50).
DPPH radical-scavenging activity (%) = (Blank O.D − Sample O.D)/Blank O.D × 100

2.7. ABTS Radical-Scavenging Activity

The ABTS radical-scavenging activity assay is a commonly employed method for evaluating antioxidant capacity. This assay is based on the principle that ABTS reacts with potassium persulfate under dark conditions, leading to the formation of ABTS radicals (ABTS+). These radicals are subsequently neutralized by the antioxidant components present in the sample, resulting in the decolorization of the characteristic teal hue associated with ABTS+ radicals [24].
A 7 mM ABTS solution and a 2.45 mM potassium persulfate solution were mixed in a 2:1 ratio, and incubated in the dark for 16 h to facilitate radical generation. The resulting solution was subsequently diluted with anhydrous ethanol in a 1:88 ratio. For the assay, 10 µL of the sample was added to 1 mL of the diluted ABTS solution, and incubated in darkness for 6 min. Following the reaction, absorbance was recorded at 734 nm using a microplate reader (Spectramax i3, Molecular Devices Co., Sunnyvale, CA, USA). ABTS radical-scavenging activity was determined using Equation (5), and the results were expressed as IC50.
ABTS radical-scavenging activity (%) = (Blank O.D − Sample O.D)/Blank O.D × 100

2.8. FRAP Assay

The FRAP assay operates on the principle that ferric tripyridyltriazine (Fe3+-TPTZ) complex undergoes reduction to Fe2+-TPTZ by a reducing agent under acidic conditions. This method is founded on the concept that most antioxidants exhibit reducing power [25].
To prepare the FRAP reagent, 300 mM acetate buffer (pH 3.6), 10 mM TPTZ, and 20 mM FeCl3·6H2O were separately prepared and combined in a 10:1:1 ratio. A reaction mixture was then formulated by mixing 1.5 mL of the FRAP solution, 50 µL of the sample, and 150 µL of distilled water. The mixture was incubated at 37 °C for 4 min, after which the absorbance was recorded at 593 nm using a microplate reader (Spectramax i3, Molecular Devices Co., Sunnyvale, CA, USA), and the results were expressed as IC50.

2.9. Statistical Analyses

The experimental data are expressed as means ± standard deviations (SD). Statistical analysis was performed using SPSS software (version 24.0; SPSS Inc., Chicago, IL, USA). The significance of differences among experimental groups was assessed using Duncan’s multiple range test, with p-values less than 0.05 considered statistically significant. The correlation strength was evaluated using Pearson’s correlation coefficient.

3. Results

3.1. Saponarin and Clorophyll Contents in Barley Sprout

The saponarin standard solution was diluted with distilled water to final concentrations of 6.25, 12.5, 25, 50, and 100 μg/mL, establishing a linear concentration range. Standard solutions prepared at each concentration were analyzed using HPLC-PDA, and a calibration curve was constructed to represent the relationship between the concentration and peak area (Figure 1a). The correlation coefficient (R2) of the calibration curve (y = 7847.7x + 2180.5) exhibited a high linearity, exceeding 0.9999. Furthermore, similarity was confirmed when the UV spectrum of the selected peak from the 25 μg/mL saponarin standard solution and the 5000 μg/mL barley sprout sample was examined (Figure 1b). In this study, we demonstrated the potential of saponarin in barley sprouts as a marker compound, and confirmed the reproducibility of quantitative analysis using a widely applicable HPLC-PDA system.
The absorbance readings of the centrifuged solution measured at 663 nm and 645 nm indicated that the freeze-dried barley sprout contained 13.10 ± 0.29 mg/g of chlorophyll a, 2.25 ± 0.09 mg/g of chlorophyll b, and 15.36 ± 0.18 mg/g of total chlorophyll, respectively (Table 3).

3.2. Identification and Quantification of Policosanols

Figure 2 presents the GC-MS chromatograms of the policosanol standard solutions alongside those of the barley sprout samples. The retention times of the components in the simultaneous analysis of the standard solution were as follows: eicosanol, 19.481; heneicosanol, 21.373; docosanol, 23.236; tricosanol, 25.015; tetracosanol, 26.766; hexacosanol, 30.069; heptacosanol, 31.650; octacosanol, 33.175; and triacontanol, 36.111.
The types and contents of the TMS derivatives of policosanols in the silylated barley sprout samples are shown in Table 4. The measured contents were as follows: eicosanol, 1.32 mg/100 g; heneicosanol, 0.45 mg/100 g; docosanol, 15.28 mg/100 g; tricosanol, 3.46 mg/100 g; tetracosanol, 46.65 mg/100 g; hexacosanol, 299.39 mg/100 g; heptacosanol, 8.35 mg/100 g; octacosanol, 19.82 mg/100 g; and triacontanol, 2.27 mg/100 g.

3.3. TP and TF Contents

Polyphenolic compounds encompass various subclasses, including flavonoids, anthocyanins, tannins, catechins, isoflavones, lignans, and resveratrol, which are extensively distributed across the plant kingdom, and predominantly found in fruits and leafy vegetables [26]. Polyphenols and flavonoids possess multiple hydroxyl (–OH) groups, enabling them to interact with reactive oxygen species (ROS) and exhibit antioxidant effects [27]. The results of TP and TF content analysis are summarized in Table 5. The TP content in barley sprout was 12.64 ± 0.04 mg GAE/g, while the TF content was 5.99 ± 0.09 mg RE/g.

3.4. Antioxidant Effects of Barley Sprout

The results of the DPPH and ABTS free radical-scavenging activity assays, as well as the FRAP assay, are presented in Table 6. The IC50 values for DPPH, ABTS, and FRAP in barley sprout were 21.04 ± 0.00 mg/mL, 88.53 ± 2.75 mg/mL, and 2.50 ± 0.00 µg/mL, respectively, following the order of FRAP > DPPH > ABTS in terms of antioxidant activity. For ascorbic acid, the IC50 values for DPPH, ABTS, and FRAP were 0.03 ± 0.00 µg/mL, 0.44 ± 0.01 µg/mL, and 0.01 ± 0.00 µg/mL, respectively. Although ascorbic acid exhibited significantly higher antioxidant activity than barley sprouts across all assays, the trend in activity remained consistent, following the order FRAP > DPPH > ABTS.

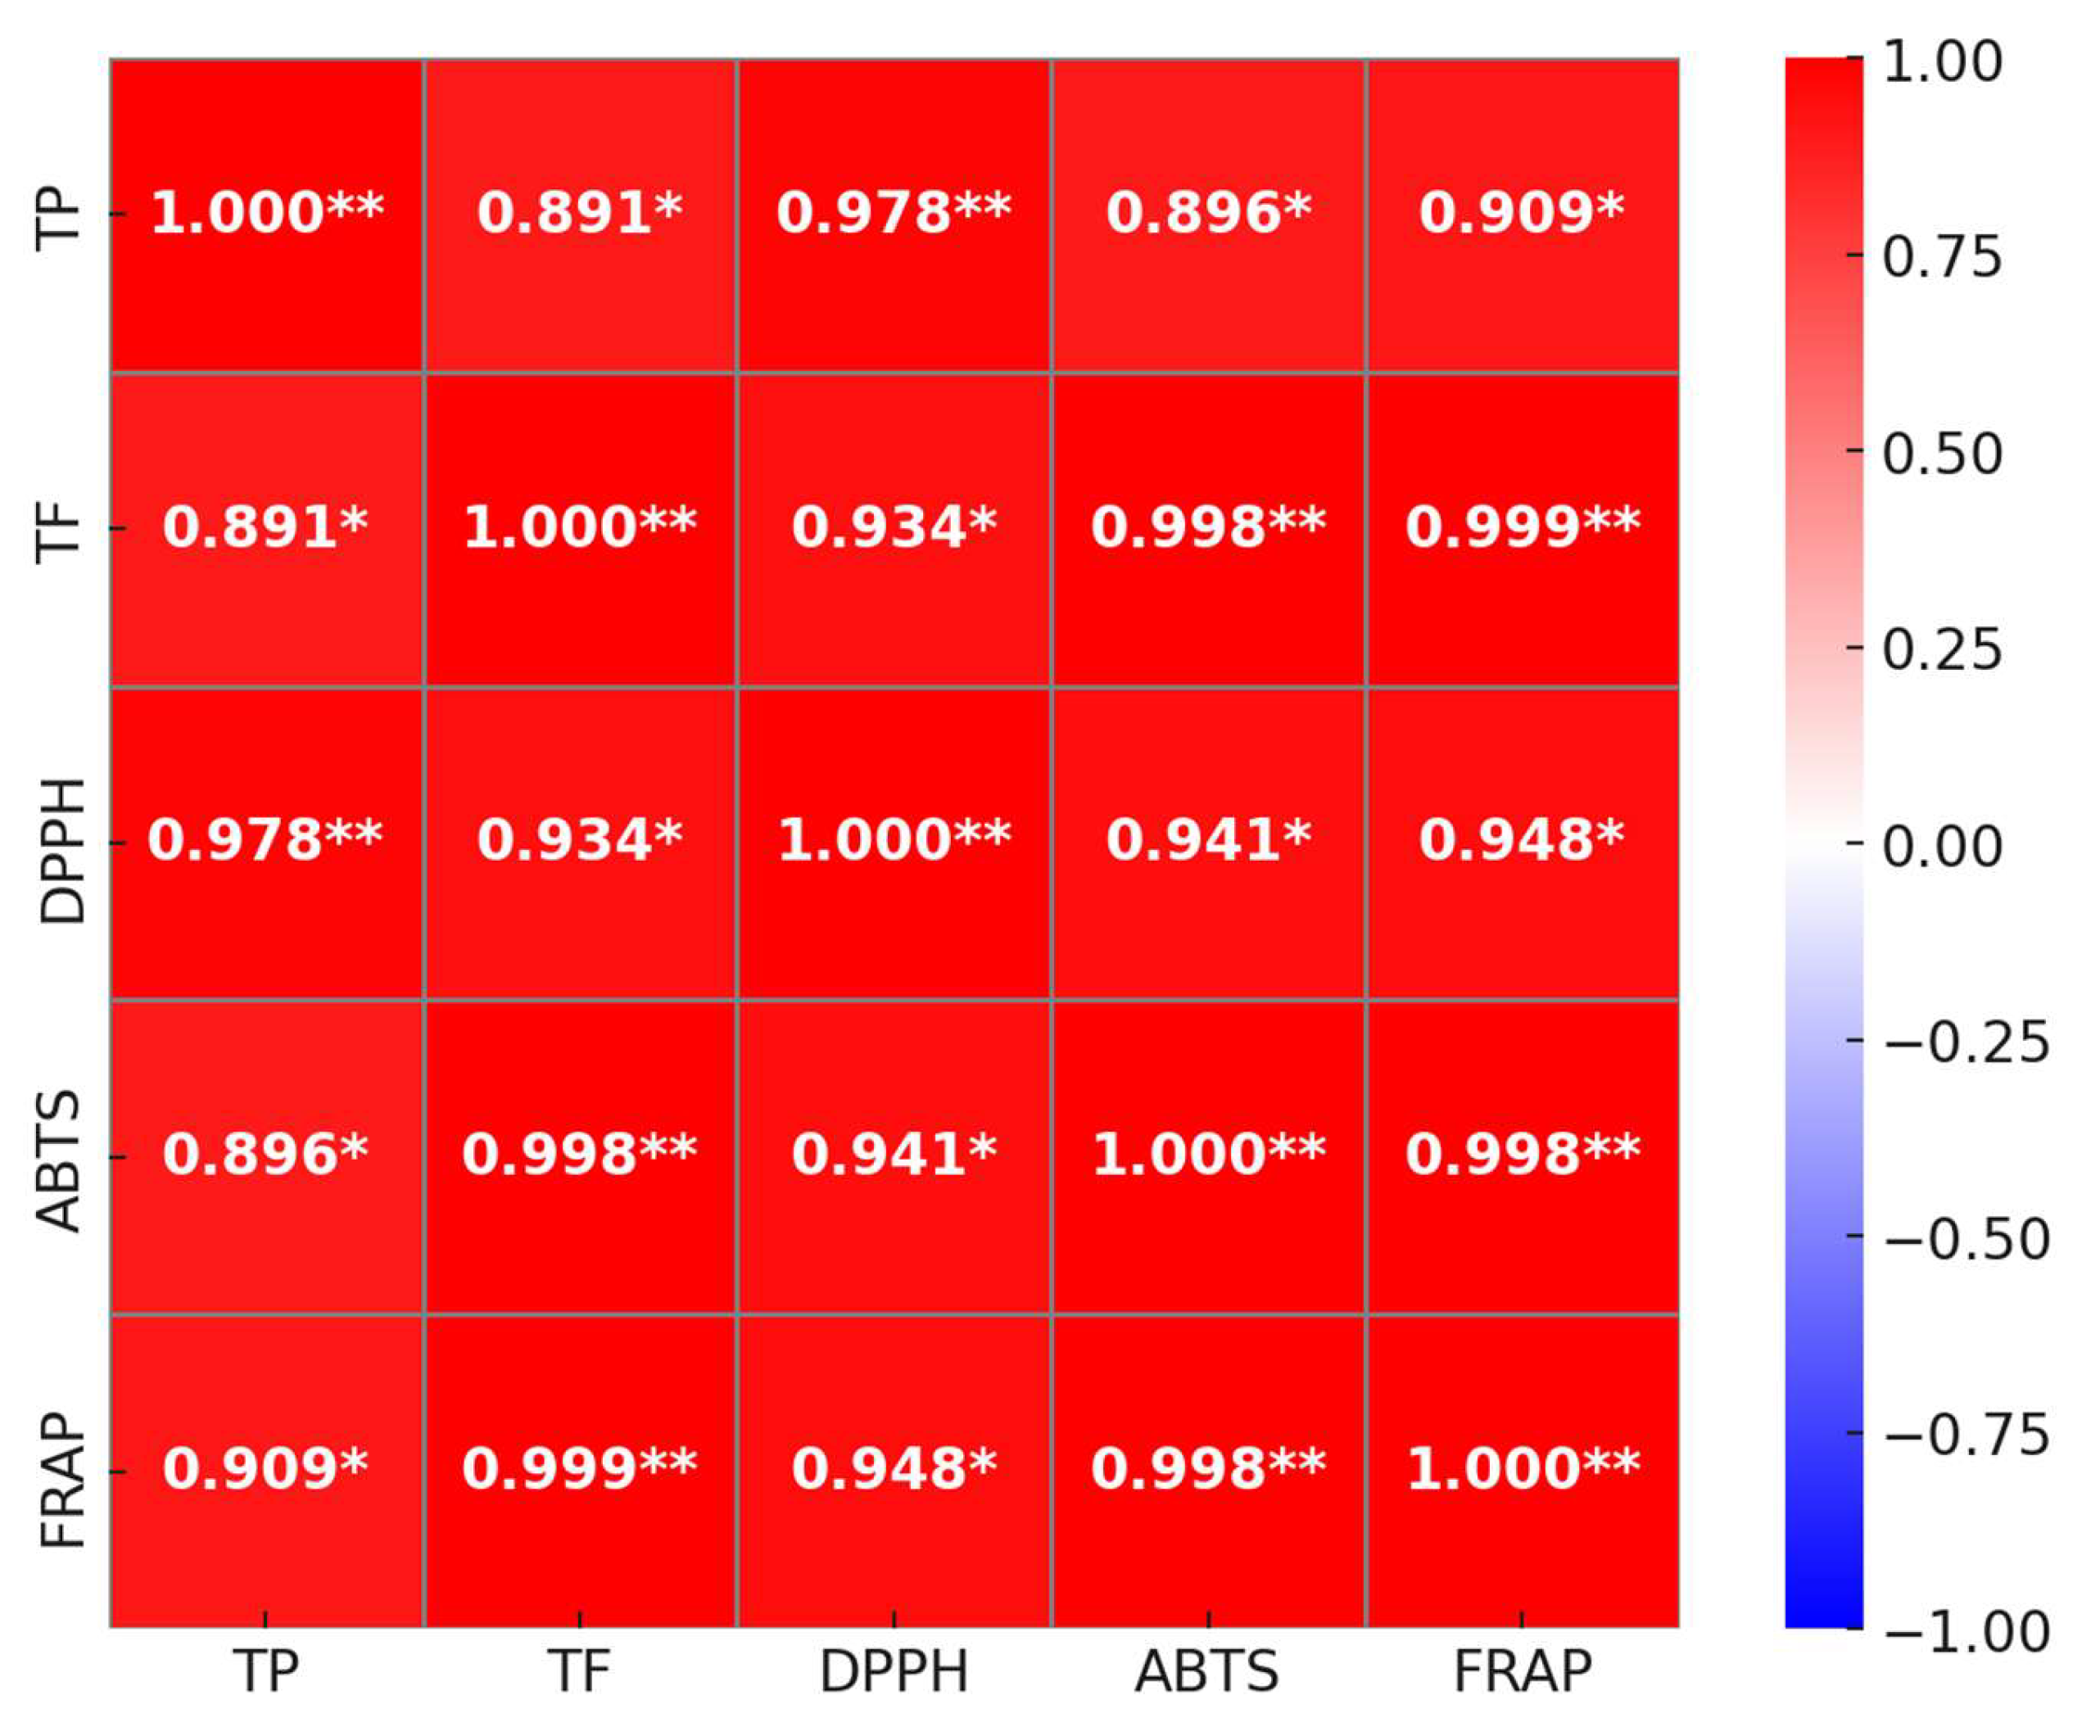
3.5. Relationship Between Antioxidant Activities and Phenolic Contents

Correlation analysis of the total antioxidant capacity values was conducted to evaluate the suitability and reliability of the analytical methods used to measure the antioxidant activity and phenolic content. As shown in Figure 3, all R-values exhibited a positive correlation at a significance level of p < 0.05, indicating a strong correlation among antioxidant capacity values. Among them, the correlation between TF and FRAP was the strongest (R = 0.999), followed by the correlation between ABTS and FRAP, as well as between TF and ABTS, which also exhibited strong relationships (R = 0.998).

4. Discussion

We confirmed, using HPLC-PDA, that the barley sprouts contained 8.14 ± 0.02 mg/g of saponarin (Table 3). According to Yoon et al. [28], extracts from two cultivars of another staple crop, Triticum aestivum (wheat), contained trace amounts of saponarin. Another study reported that three mature wheat varieties contained approximately 2.5 nmol of saponarin/seed [29]. As for other crops, the saponarin content was approximately 0.99 mg/g in dried leaf extracts of Bryonia alba L. [30], while Hibiscus syriacus L. (Rose of Sharon) was found to accumulate up to 1.528 mg/cm2 of TFs in its flowers, with saponarin identified as the major component, accounting for more than 50% [31]. Kim et al. [20] measured the saponarin content in barley sprout extracts cultivated under various conditions using LED lighting and supplements, and reported a content range of 1.66–11.14 mg/g.
Previous studies on chlorophyll content in other crops have reported that rice seedlings contain approximately 2.4 mg/g of chlorophyll a and 0.9 mg/g of chlorophyll b [32]. The total chlorophyll content in green tea leaves was shown to be 4.33 ± 0.02 mg/g, while that of eucalyptus leaves was 1.26 mg/g [33]. Furthermore, the total chlorophyll content in broccoli was reported to be 6.94 mg/g [34], in spinach, 20.33 mg/g [35], and in mung bean, 1.85 mg/g [36]. Differences in chlorophyll content are likely because of various factors that influence the nutritional value of microgreens, such as seed type, growth conditions, nutrient solution components, and harvest timing [37].
According to Ra et al. [38], who studied the policosanol content of wheat seedlings based on the cultivation duration and variety, eicosanol, heneicosanol, and tricosanol were undetectable under all conditions. Additionally, the total policosanol content varied significantly, ranging from 0.58 to 9.91 mg/g, depending on cultivation time and variety. Similarly, Lee et al. [39] measured the policosanol content of oat seedlings based on cultivar and cultivation period, and reported a total policosanol content ranging from 3.17 to 6.48 mg/g. No eicosanol, heneicosanol, tricosanol, heptacosanol, or triacontanol was detected. Compared to previous studies that examined policosanol content in other crops, barley sprouts contain unique compounds, such as eicosanol, heneicosanol, and tricosanol, which have not been detected in different crops.
Efforts to identify antioxidant compounds capable of scavenging reactive oxygen species (ROS) from food sources and natural products capable of scavenging ROS have long been actively pursued. Antioxidant activity is a multifaceted process involving various mechanisms, and is influenced by multiple factors, making it difficult to fully characterize using a single analytical approach [40]. Consequently, employing multiple antioxidant capacity assays is crucial to comprehensively assess the diverse mechanisms of antioxidant action [41]. In this study, the antioxidant capacity and phenolic content of barley sprouts were evaluated, and a correlation analysis demonstrated a strong positive relationship among the applied methods. These findings demonstrate that each analytical method is suitable for evaluating the antioxidant capacity of barley sprouts.

5. Conclusions

In this study, we aimed to evaluate the bioactive compounds and antioxidant capacity of barley sprouts by analyzing their saponarin, chlorophyll, and policosanol contents, as well as their TP and TF contents. Additionally, we assessed their antioxidant capacity using ABTS, DPPH, and FRAP assays, and performed a correlation analysis to validate the reliability of these methods. Our findings confirm that barley sprouts contain significant amounts of bioactive compounds, with 8.14 ± 0.02 mg/g of saponarin, 15.36 ± 0.18 mg/g of total chlorophyll, and 396.99 mg/100 g of policosanols. The IC50 values for antioxidant activity followed the sequence FRAP > DPPH > ABTS. Furthermore, strong positive correlations (R > 0.891, p < 0.05) among the different antioxidant assays support the reliability of these methods in assessing the antioxidant properties of barley sprouts. These results indicate that barley sprouts could be valuable functional ingredients, rich in antioxidants and bioactive compounds. Given the increasing demand for natural antioxidants and functional foods, barley sprouts can be a health-promoting ingredient in food formulations. Nevertheless, as this study was confined to in vitro analyses, additional investigations utilizing in vivo models and clinical trials are required to gain a more comprehensive understanding of the physiological effects of barley sprout consumption. In addition, investigating the influence of cultivation conditions, extraction methods, and processing techniques could further optimize the bioavailability and functional efficacy of barley sprout-derived antioxidants.

Author Contributions

Conceptualization, D.S.P. and S.W.P.; methodology, J.-H.I. and Y.-S.S.; software, J.-W.C. and Y.-S.S.; validation, J.-S.L. and M.-H.K.; formal analysis, J.-H.I. and J.-S.L.; investigation, G.O. and X.F.; resources, I.-J.L. and D.-S.L.; data curation, S.W.P. and X.F.; writing—original draft preparation, G.O.; writing—review and editing, O.-H.L.; visualization, D.-S.L. and M.-H.K.; supervision, I.-J.L. and D.S.P.; project administration, O.-H.L.; funding acquisition, J.-W.C. All authors have read and agreed to the published version of the manuscript.

Funding

This research was supported by the 2024 Research Grant from the Atomy R&D Center, the Basic Science Research Program (NRF-2021R1A6A1A03044242, 2017R1D1A3B06028469), and the BK21 FOUR program (Grant No. 4299990913942) through the National Research Foundation of Korea (NRF), funded by the Ministry of Education (MOE, Republic of Korea).

Data Availability Statement

The data presented in this study are available upon request.

Conflicts of Interest

Im-Joung La and Do-Sang Lee were employed by Atomy R&D Center, and Jong-Woo Chae was employed by F&B Bio Co., Ltd. The remaining authors declare that the research was conducted in the absence of any commercial or financial relationships that could be construed as a potential conflict of interest.

References

  1. Peñaranda, J.D.; Bueno, M.; Álvarez, F.; Pérez, P.D.; Perezábad, L. Sprouted grains in product development. Case studies of sprouted wheat for baking flours and fermented beverages. Int. J. Gastr. Food Sci. 2021, 25, 100375. [Google Scholar] [CrossRef]
  2. Saithalavi, K.M.; Bhasin, A.; Yaqoob, M. Impact of sprouting on physicochemical and nutritional properties of sorghum: A review. J. Food Meas. Charact. 2021, 15, 4190–4204. [Google Scholar] [CrossRef]
  3. Drabińska, N.; Siger, A.; Jeleń, H.H. Metabolic Changes during Sprouting of Rapeseed and Their Consequences for the Volatilome of Cold-Pressed Oil. Eur. J. Lipid Sci. Technol. 2023, 125, 2200181. [Google Scholar] [CrossRef]
  4. Avezum, L.; Rondet, E.; Mestres, C.; Achir, N.; Madode, Y.; Gibert, O.; Lefevre, C.; Hemery, Y.; Verdeil, J.L.; Rajjou, L. Improving the nutritional quality of pulses via germination. Food Rev. Int. 2022, 39, 6011–6044. [Google Scholar] [CrossRef]
  5. Benincasa, P.; Falcinelli, B.; Lutts, S.; Stagnari, F.; Galieni, A. Sprouted grains: A comprehensive review. Nutrients 2019, 11, 421. [Google Scholar] [CrossRef] [PubMed]
  6. Miyahira, R.F.; Lopes, J.D.O.; Antunes, A.E.C. The use of sprouts to improve the nutritional value of food products: A brief review. Plant Foods Hum. Nutr. 2021, 76, 143–152. [Google Scholar] [CrossRef]
  7. Maqbool, Z.; Khalid, W.; Mahum; Khan, A.; Azmat, M.; Sehrish, A.; Zia, S.; Koraqi, H.; AL-Farga, A.; Aqlan, F.; et al. Cereal sprout-based food products: Industrial application, novel extraction, consumer acceptance, antioxidant potential, sensory evaluation, and health perspective. Food Sci. Nutr. 2024, 12, 707–721. [Google Scholar] [CrossRef]
  8. Wojdyło, A.; Nowicka, P.; Tkacz, K.; Turkiewicz, I.P. Sprouts vs. microgreens as novel functional foods: Variation of nutritional and phytochemical profiles and their in vitro bioactive properties. Molecules 2020, 25, 4648. [Google Scholar] [CrossRef]
  9. Kehinde, B.A.; Majid, I.; Hussain, S. Isolation of bioactive peptides and multiple nutraceuticals of antidiabetic and antioxidant functionalities through sprouting: Recent advances. J. Food Biochem. 2022, 46, e14317. [Google Scholar] [CrossRef]
  10. Islam, M.Z.; Shim, M.J.; Jeong, S.Y.; Lee, Y.T. Effects of soaking and sprouting on bioactive compounds of black and red pigmented rice cultivars. Int. J. Food Sci. Technol. 2022, 57, 201–209. [Google Scholar] [CrossRef]
  11. Vicentini, A.; Liberatore, L.; Mastrocola, D. Functional foods: Trends and development of the global market. Ital. J. Food Sci. 2016, 28, 338. [Google Scholar]
  12. Rico, D.; Peñas, E.; García, M.D.C.; Martínez-Villaluenga, C.; Rai, D.K.; Birsan, R.I.; Frias, J.; Martín-Diana, A.B. Sprouted barley flour as a nutritious and functional ingredient. Foods 2020, 9, 296. [Google Scholar] [CrossRef] [PubMed]
  13. Cáceres, P.J.; Martínez-Villaluenga, C.; Amigo, L.; Frias, J. Maximising the phytochemical content and antioxidant activity of Ecuadorian brown rice sprouts through optimal germination conditions. Food Chem. 2014, 152, 407–414. [Google Scholar] [CrossRef] [PubMed]
  14. Cáceres, P.J.; Peñas, E.; Martínez-Villaluenga, C.; Amigo, L.; Frias, J. Enhancement of biologically active compounds in germinated brown rice and the effect of sun-drying. J. Cereal Sci. 2017, 73, 1–9. [Google Scholar] [CrossRef]
  15. Ghahremaninejad, F.; Hoseini, E.; Jalali, S. The cultivation and domestication of wheat and barley in Iran, brief review of a long history. Bot. Rev. 2021, 87, 1–22. [Google Scholar] [CrossRef]
  16. Perera, W.N.U.; Abdollahi, M.R.; Zaefarian, F.; Wester, T.J.; Ravindran, V. Barley, an undervalued cereal for poultry diets: Limitations and opportunities. Animals 2022, 12, 2525. [Google Scholar] [CrossRef]
  17. Martínez, M.; Motilva, M.J.; de Las Hazas, M.C.L.; Romero, M.P.; Vaculova, K.; Ludwig, I.A. Phytochemical composition and β-glucan content of barley genotypes from two different geographic origins for human health food production. Food Chem. 2018, 245, 61–70. [Google Scholar] [CrossRef]
  18. Raj, R.; Shams, R.; Pandey, V.K.; Dash, K.K.; Singh, P.; Bashir, O. Barley phytochemicals and health promoting benefits: A comprehensive review. J. Agric. Food Res. 2023, 14, 100677. [Google Scholar] [CrossRef]
  19. Castro, A.G.; Ortiz, F.A.G.; Hernández, G.H.; Román-Gutiérrez, A.D. Analysis of bioactive compounds in lyophilized aqueous extracts of barley sprouts. J. Food Meas. Charact. 2024, 18, 5327–5338. [Google Scholar] [CrossRef]
  20. Kim, J.S.; Jeong, E.; Jo, S.M.; Park, J.; Kim, J.Y. Comparative study of the effects of light-controlled germination conditions on saponarin content in barley sprouts and lipid accumulation suppression in HepG2 hepatocyte and 3T3-L1 adipocyte cells using barley sprout extracts. Molecules 2020, 25, 5349. [Google Scholar] [CrossRef]
  21. Seo, W.D.; Yuk, H.J.; Curtis-Long, M.J.; Jang, K.C.; Lee, J.H.; Han, S.I.; Kang, H.W.; Nam, M.H.; Lee, S.J.; Lee, J.H.; et al. Effect of the growth stage and cultivar on policosanol profiles of barley sprouts and their adenosine 5′-monophosphate-activated protein kinase activation. J. Agric. Food Chem. 2013, 61, 1117–1123. [Google Scholar] [CrossRef]
  22. Duval, B.; Shetty, K. The stimulation of phenolics and antioxidant activity in pea (Pisum sativum) elicited by genetically transformed anise root extract. J. Food Biochem. 2001, 25, 361–377. [Google Scholar] [CrossRef]
  23. Miller, N.J.; Rice, C.; Davies, M.J.; Gopinathan, V.; Milner, A. A novel method for measuring antioxidant capacity and its application to monitoring the antioxidant status in premature neonates. Clin. Sci. 1993, 84, 407–412. [Google Scholar] [CrossRef]
  24. Dai, J.; Mumper, R.J. Plant phenolics: Extraction, analysis, and their antioxidant and anticancer properties. Molecules 2010, 15, 7313–7352. [Google Scholar] [CrossRef]
  25. Benzie, I.F.F.; Strain, J.J. The ferric reducing ability of plasma (FRAP) as a measure of ‘antioxidant power’: The FRAP assay. Anal. Biochem. 1996, 239, 70–76. [Google Scholar] [CrossRef]
  26. Lu, Y.; Foo, L.Y. Antioxidant and radical scavenging activities of polyphenols from apple pomace. Food Chem. 2000, 68, 81–85. [Google Scholar] [CrossRef]
  27. Sánchez-Moreno, C. Methods used to evaluate the free radical scavenging activity in foods and biological systems. Food Sci. Technol. Int. 2002, 8, 121–137. [Google Scholar] [CrossRef]
  28. Yoon, N.; Jeong, S.H.; Park, J.S.; Kim, W.J.; Lee, S. Comparative analysis of chemical composition and radical-scavenging activities in two wheat cultivars. Appl. Sci. 2024, 14, 10763. [Google Scholar] [CrossRef]
  29. Kohyama, N.; Chono, M.; Nakagawa, H.; Matsuo, Y.; Ono, H.; Matsunaka, H. Flavonoid compounds related to seed coat color of wheat. Biosci. Biotechnol. Biochem. 2017, 81, 2112–2118. [Google Scholar] [CrossRef]
  30. Ielciu, I.; Mouithys-Mickalad, A.; Franck, T.; Angenot, L.; Ledoux, A.; Păltinean, R.; Cieckiewicz, E.; Etienne, D.; Tits, M.; Crişan, G.; et al. Flavonoid composition, cellular antioxidant activity and (myelo) peroxidase inhibition of a Bryonia alba L. (Cucurbitaceae) leaves extract. J. Pharm. Pharmacol. 2019, 71, 230–239. [Google Scholar] [CrossRef]
  31. Yoo, K.O.; Lim, H.T.; Kim, J.H. Studies on the flavonoids of the Hibiscus syriacus L. complex. Korean J. Plant Resour. 1996, 9, 224–229. [Google Scholar]
  32. Dang, K.; Mu, J.; Tian, H.; Gao, D.; Zhou, H.; Guo, L.; Shao, X.; Geng, Y.; Zhang, Q. Zinc regulation of chlorophyll fluorescence and carbohydrate metabolism in saline-sodic stressed rice seedlings. BMC Plant Biol. 2024, 24, 464. [Google Scholar] [CrossRef]
  33. Datt, B. Remote sensing of chlorophyll a, chlorophyll b, chlorophyll a + b, and total carotenoid content in Eucalyptus leaves. Remote Sens. Environ. 1998, 66, 111–121. [Google Scholar] [CrossRef]
  34. Burns, J.; Fraser, P.D.; Bramley, P.M. Identification and quantification of carotenoids, tocopherols and chlorophylls in commonly consumed fruits and vegetables. Phytochemistry 2003, 62, 939–947. [Google Scholar] [CrossRef] [PubMed]
  35. Teng, S.S.; Chen, B.H. Formation of pyrochlorophylls and their derivatives in spinach leaves during heating. Food Chem. 1999, 65, 367–373. [Google Scholar] [CrossRef]
  36. Turkmen, N.; Poyrazoglu, E.S.; Sari, F.; Velioglu, Y.S. Effects of cooking methods on chlorophylls, pheophytins and colour of selected green vegetables. Int. J. Food Sci. Technol. 2006, 41, 281–288. [Google Scholar] [CrossRef]
  37. Kim, K.C.; Kim, J.S. Comparative analysis of hydroponically cultivated barley sprouts yield, polyphenol and mineral content by nutrient solution treatment. J. Plant Biotechnol. 2021, 48, 193–200. [Google Scholar] [CrossRef]
  38. Ra, J.E.; Woo, S.Y.; Lee, K.S.; Lee, M.J.; Kim, H.Y.; Ham, H.M.; Chung, I.M.; Kim, D.H.; Lee, J.H.; Seo, W.D. Policosanol profiles and adenosine 5′-monophosphate-activated protein kinase (AMPK) activation potential of Korean wheat seedling extracts according to cultivar and growth time. Food Chem. 2020, 317, 126388. [Google Scholar] [CrossRef]
  39. Lee, H.G.; Woo, S.Y.; Ahn, H.J.; Yang, J.Y.; Lee, M.J.; Kim, H.Y.; Seo, W.D. Comparative analysis of policosanols related to growth times from the seedlings of various Korean oat (Avena sativa L.) cultivars and screening for adenosine 5′-monophosphate-activated protein kinase (AMPK) activation. Plants 2022, 11, 1844. [Google Scholar] [CrossRef]
  40. El Jemli, M.; Kamal, R.; Marmouzi, I.; Zerrouki, A.; Cherrah, Y.; Alaoui, K. Radical-scavenging activity and ferric reducing ability of Juniperus thurifera (L.), J. oxycedrus (L.), J. phoenicea (L.) and Tetraclinis articulata (L.). Adv. Pharmacol. Pharm. Sci. 2016, 2016, 6392656. [Google Scholar] [CrossRef]
  41. Schlesier, K.; Harwat, M.; Böhm, V.; Bitsch, R. Assessment of antioxidant activity by using different in vitro methods. Free Radic. Res. 2002, 36, 177–187. [Google Scholar] [CrossRef] [PubMed]
Figure 1. HPLC chromatogram of saponarin standard and barley sprout for saponarin content. HPLC chromatogram of 25 µg/mL saponarin standard and 5000 µg/mL barley sprout sample (a). Blue curve is saponarin standard chromatogram and red curve is sample chromatogram. (b) UV spectrum of saponarin standard and barley sprout.
Separations 12 00068 g001
Figure 2. GC-MS chromatogram regarding TMS derivatives of (a) policosanol standards and (b) barley sprout sample. Peaks: 1, eicosanol; 2, heneicosanol; 3, docosanol; 4, tricosanol; 5, tetracosanol; 6, hexacosanol; 7, heptacosanol; 8, octacosanol; and 9, triacosanol.
Separations 12 00068 g002
Figure 3. Heatmap illustrating correlation coefficients among total phenolic (TP) content, total flavonoid (TF) content, DPPH radical-scavenging activity (DPPH), ABTS radical-scavenging activity (ABTS), and ferric-reducing antioxidant power (FRAP). Blue and red shades represent negative and positive correlations between parameters. Statistically significant correlation differences are denoted by white asterisk, * p < 0.05, and ** p < 0.01.
Separations 12 00068 g003
Table 1. HPLC-PDA conditions for saponarin analysis.
ParametersConditions
HPLC systemShimadzu LC system LC-40B XR
Detection systemShimadzu SPD-M40 PDA
ColumnCAPCELL PAK C18 UG120 (4.6 mm × 250 mm, 5 µm)
Column temperature40 °C
Flow rate1.0 mL/min
Wavelength254 nm
Injection volume5 µL
Mobile phaseA: DDW containing 1% formic acid
B: Acetonitrile containing 1% formic acid
GradientTime (min)A (%)B (%)
01000
209010
326040
364060
429010
Table 2. GC-MS conditions for analysis of policosanols.
ParametersConditions
GC system7890A series GC system coupled with 5975C single quadrupole MS
ColumnHP-5MS capillary column (30 m × 0.25 µm × 0.25 µm film thickness)
Carrier gasHelium, 1.8 mL/min
Temperature program150 °C to 325 °C with a 4 °C/min heating rate, and then maintained at 320 °C for 5 min
InletTemperature280 °C
Injection volume1 µL
Split ratio1:5
Mass spectraIonization modeElectron impact
Ionization energy70 Ev
Ion source and transfer line temperatures200 and 280 °C
Mass range40–500 amu
Analytical modeSCAN and SIM
Table 3. Contents of saponarin and chlorophylls in barley sprout.
Barley Sprout (mg/g)
Saponarin8.14 ± 0.02 (RSD 1) 0.25%)
Chlorophyll a13.10 ± 0.29 (RSD 2.21%)
Chlorophyll b2.25 ± 0.09 (RSD 4.00%)
Total chlorophyll15.36 ± 0.18 (RSD 1.17%)
Results are presented as mean ± SD of 3 independent experiments in triplicate. 1 Relative standard deviation.
Table 4. Content of policosanol compounds in barley sprout.
CompoundPeak NumberRetention TimePolicosanol—TMS Derivative Mass (m/z)Contents (mg/100g)Ratio (%)
Eicosanol119.475355.30 [M-15]+1.320.33
Heneicosanol221.395369.30 [M-15]+0.450.11
Docosanol323.287383.40 [M-15]+15.283.84
Tricosanol424.840397.40 [M-15]+3.460.87
Tetracosanol526.901411.40 [M-15]+46.6511.75
Hexacosanol630.289439.40 [M-15]+299.3975.41
Heptacosanol731.701453.50 [M-15]+8.352.10
Octacosanol833.310467.50 [M-15]+19.824.99
Triacontanol936.218495.50 [M-15]+2.270.57
Total 396.99
Table 5. Phenolic contents in samples.
SampleTotal Polyphenol Content (mg GAE 1/g)Total Flavonoid Content (mg RE 2/g)
Barley sprouts12.64 ± 0.045.99 ± 0.09
Results are presented as mean ± SD of 3 independent experiments in triplicate. 1 GAE: gallic acid equivalent. 2 RE: rutin equivalent.
Table 6. Antioxidant activities of barley sprout.
CompoundDPPH (IC50, mg/mL)ABTS (IC50, mg/mL)FRAP (IC50, mg/mL)
Barley sprout21.04 ± 0.0088.53 ± 2.752.50 ± 0.00
Ascorbic acid0.03 ± 0.000.44 ± 0.010.01 ± 0.00
Results are presented as the mean ± SD of 3 independent experiments in triplicate.
Disclaimer/Publisher’s Note: The statements, opinions and data contained in all publications are solely those of the individual author(s) and contributor(s) and not of MDPI and/or the editor(s). MDPI and/or the editor(s) disclaim responsibility for any injury to people or property resulting from any ideas, methods, instructions or products referred to in the content.

