

Competitive Adsorption Behavior of CO2 and CH4 in Coal Under Varying Pressures and Temperatures

Abstract
1. Introduction
2. Materials and Methods
2.1. Coal Sample
2.2. Experimental Methods
- (1)
- The coal sample was set in a drying cabinet at 100 °C for a predetermined drying time.
- (2)
- A 25 mL penetrating column with an inner diameter of 10 mm was selected. Quartz asbestos was inserted at one end of the column, followed by filling of the column with the coal sample. Quartz asbestos was then added to the other end. Once loaded, the column was placed into the heating furnace.
- (3)
- Helium was purged into the penetrating column at a flow rate of 10 mL/min. First, the vacuum meter was heated by setting the temperature to 100 °C for 2 h. Subsequently, in situ heating was activated under atmospheric pressure for 30 min.
- (4)
- The four-way valve was adjusted and the CO2 and CH4 mixed gas concentrations were set to equal proportions. For the experimental procedures, temperatures of 20, 40, and 60 °C were employed. The pressure was set to 0.1, 0.5, and 1 MPa. The zero-concentration signal was identified using the MS, with no gas passing through the penetration column. Once the MS signal stabilized, the four-way valve was switched to allow gas to pass through the penetration column. After completing the gas concentration test, mass spectrometry detection was stopped while the gas flow and valve were closed.
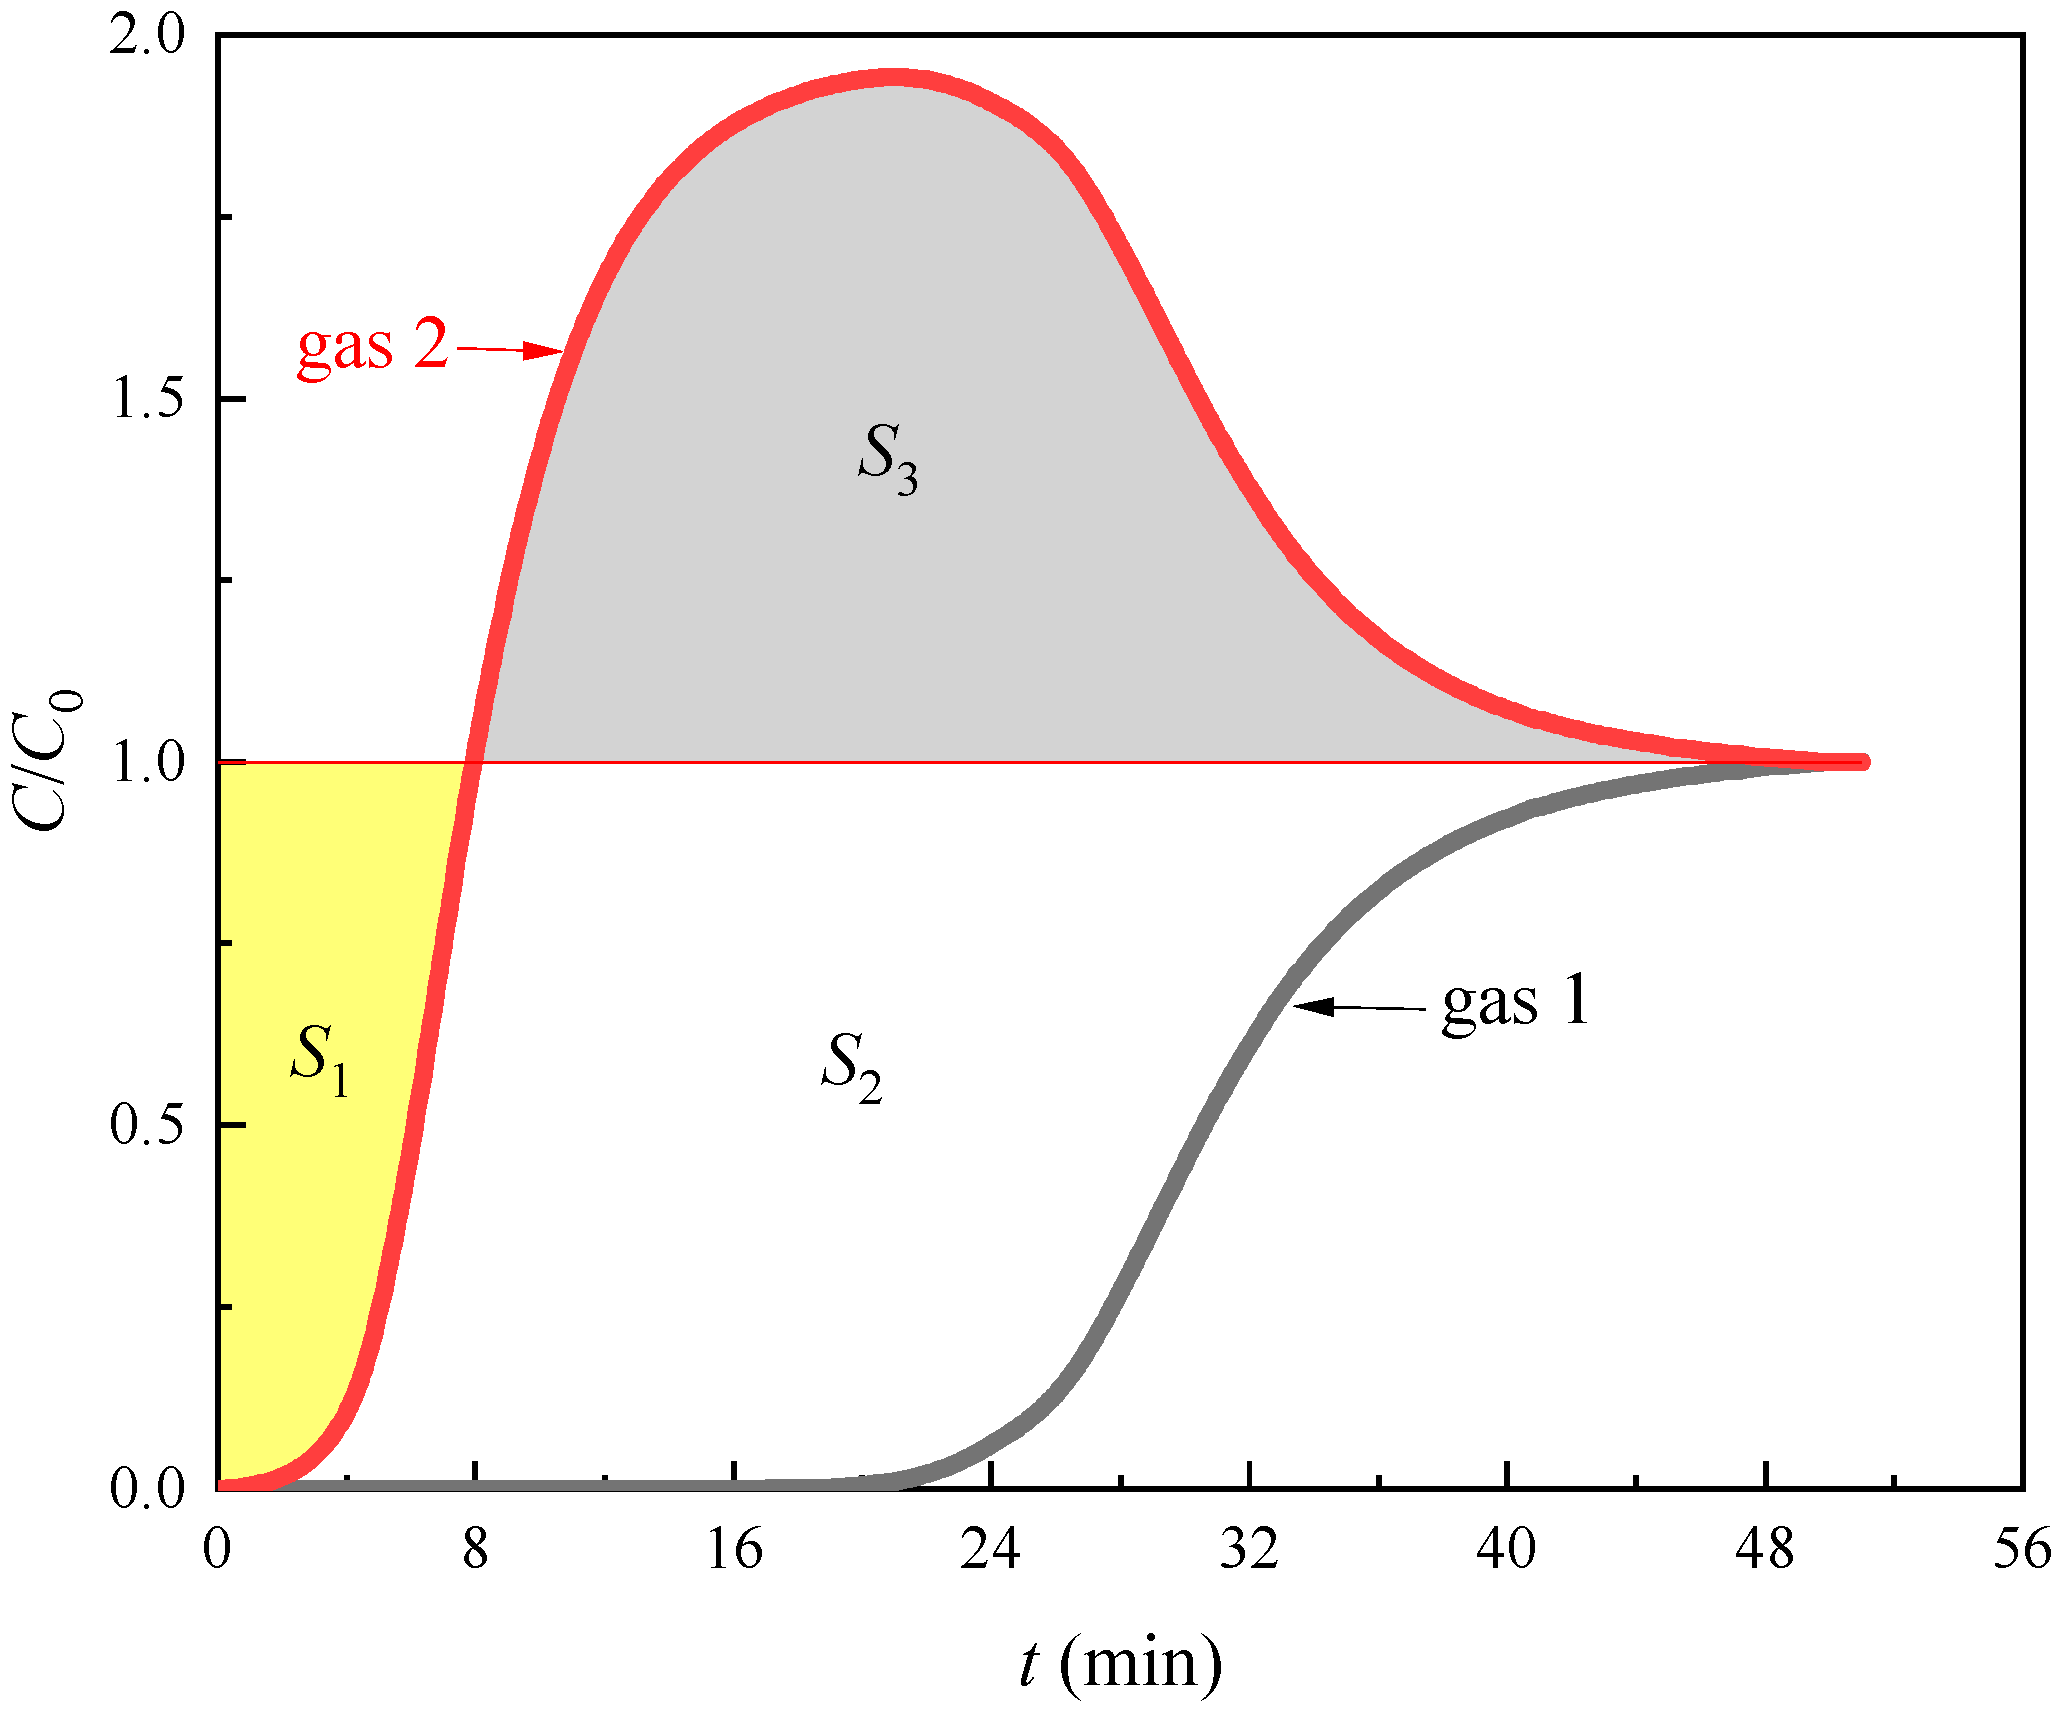
2.3. Data Processing
2.4. Theoretical Modeling
2.4.1. Kinetic Model of Adsorption
2.4.2. Adsorption Heat
3. Results and Discussion
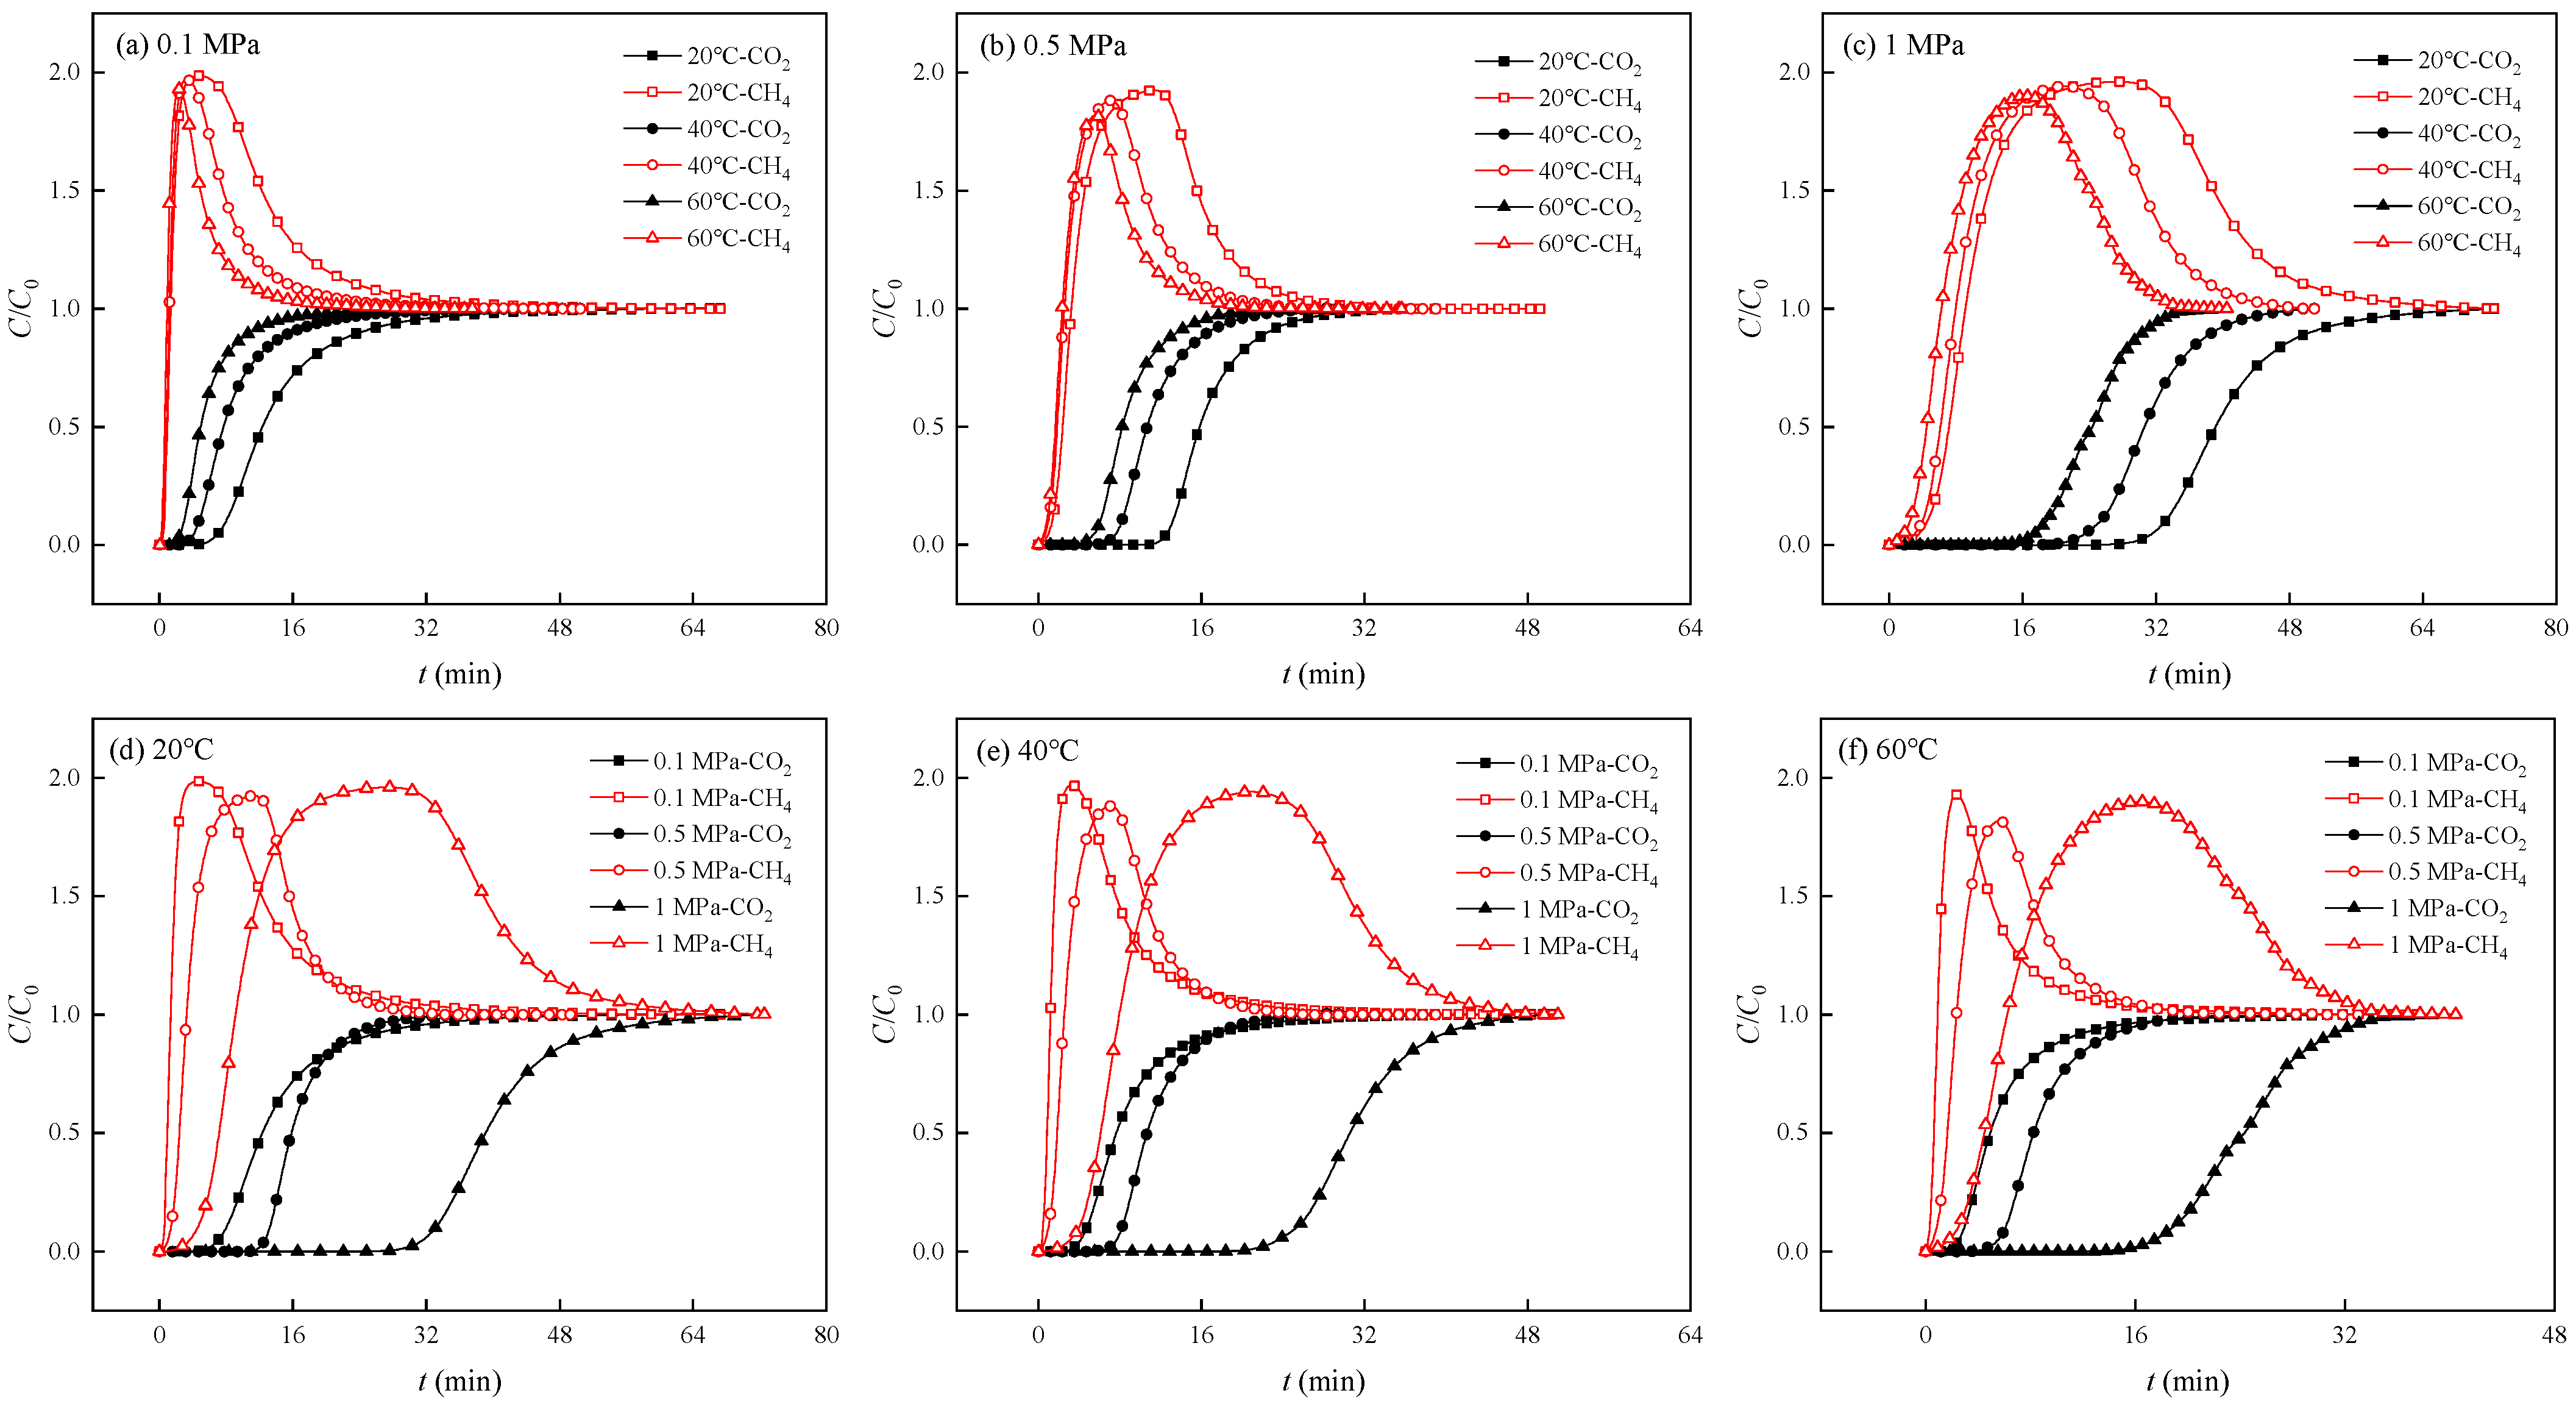
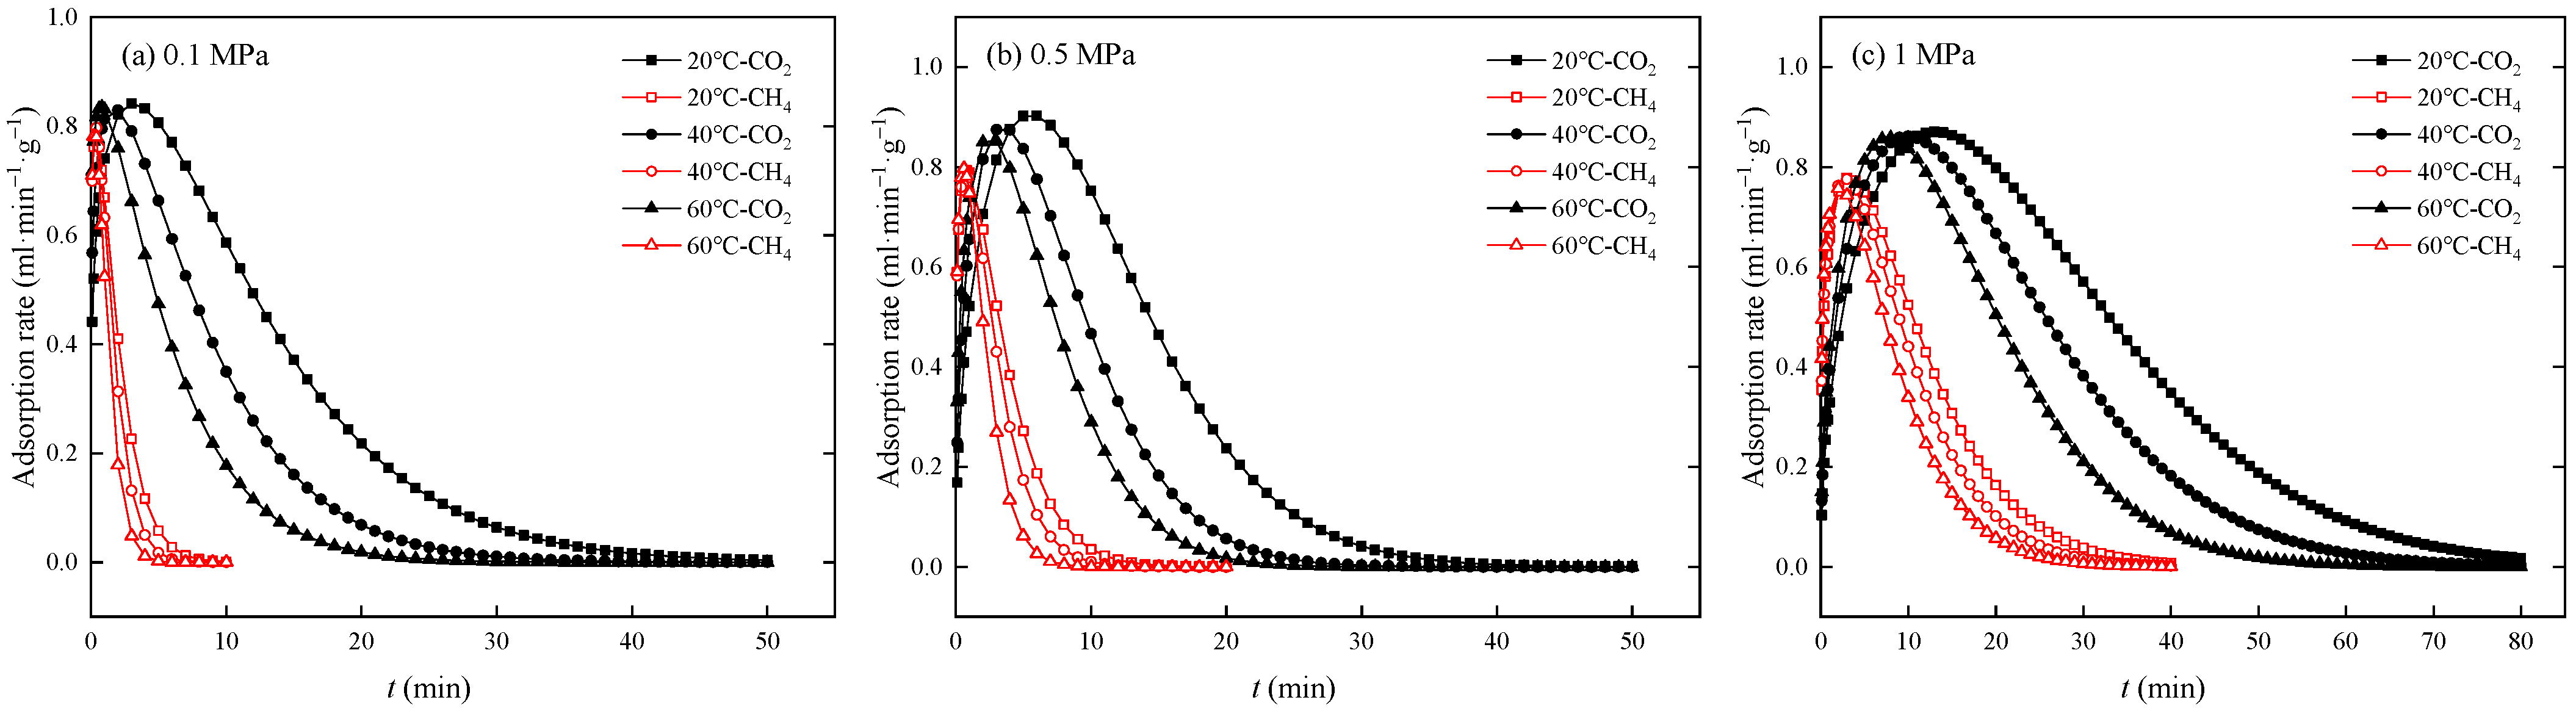
3.1. Competitive Adsorption Breakthrough Curves
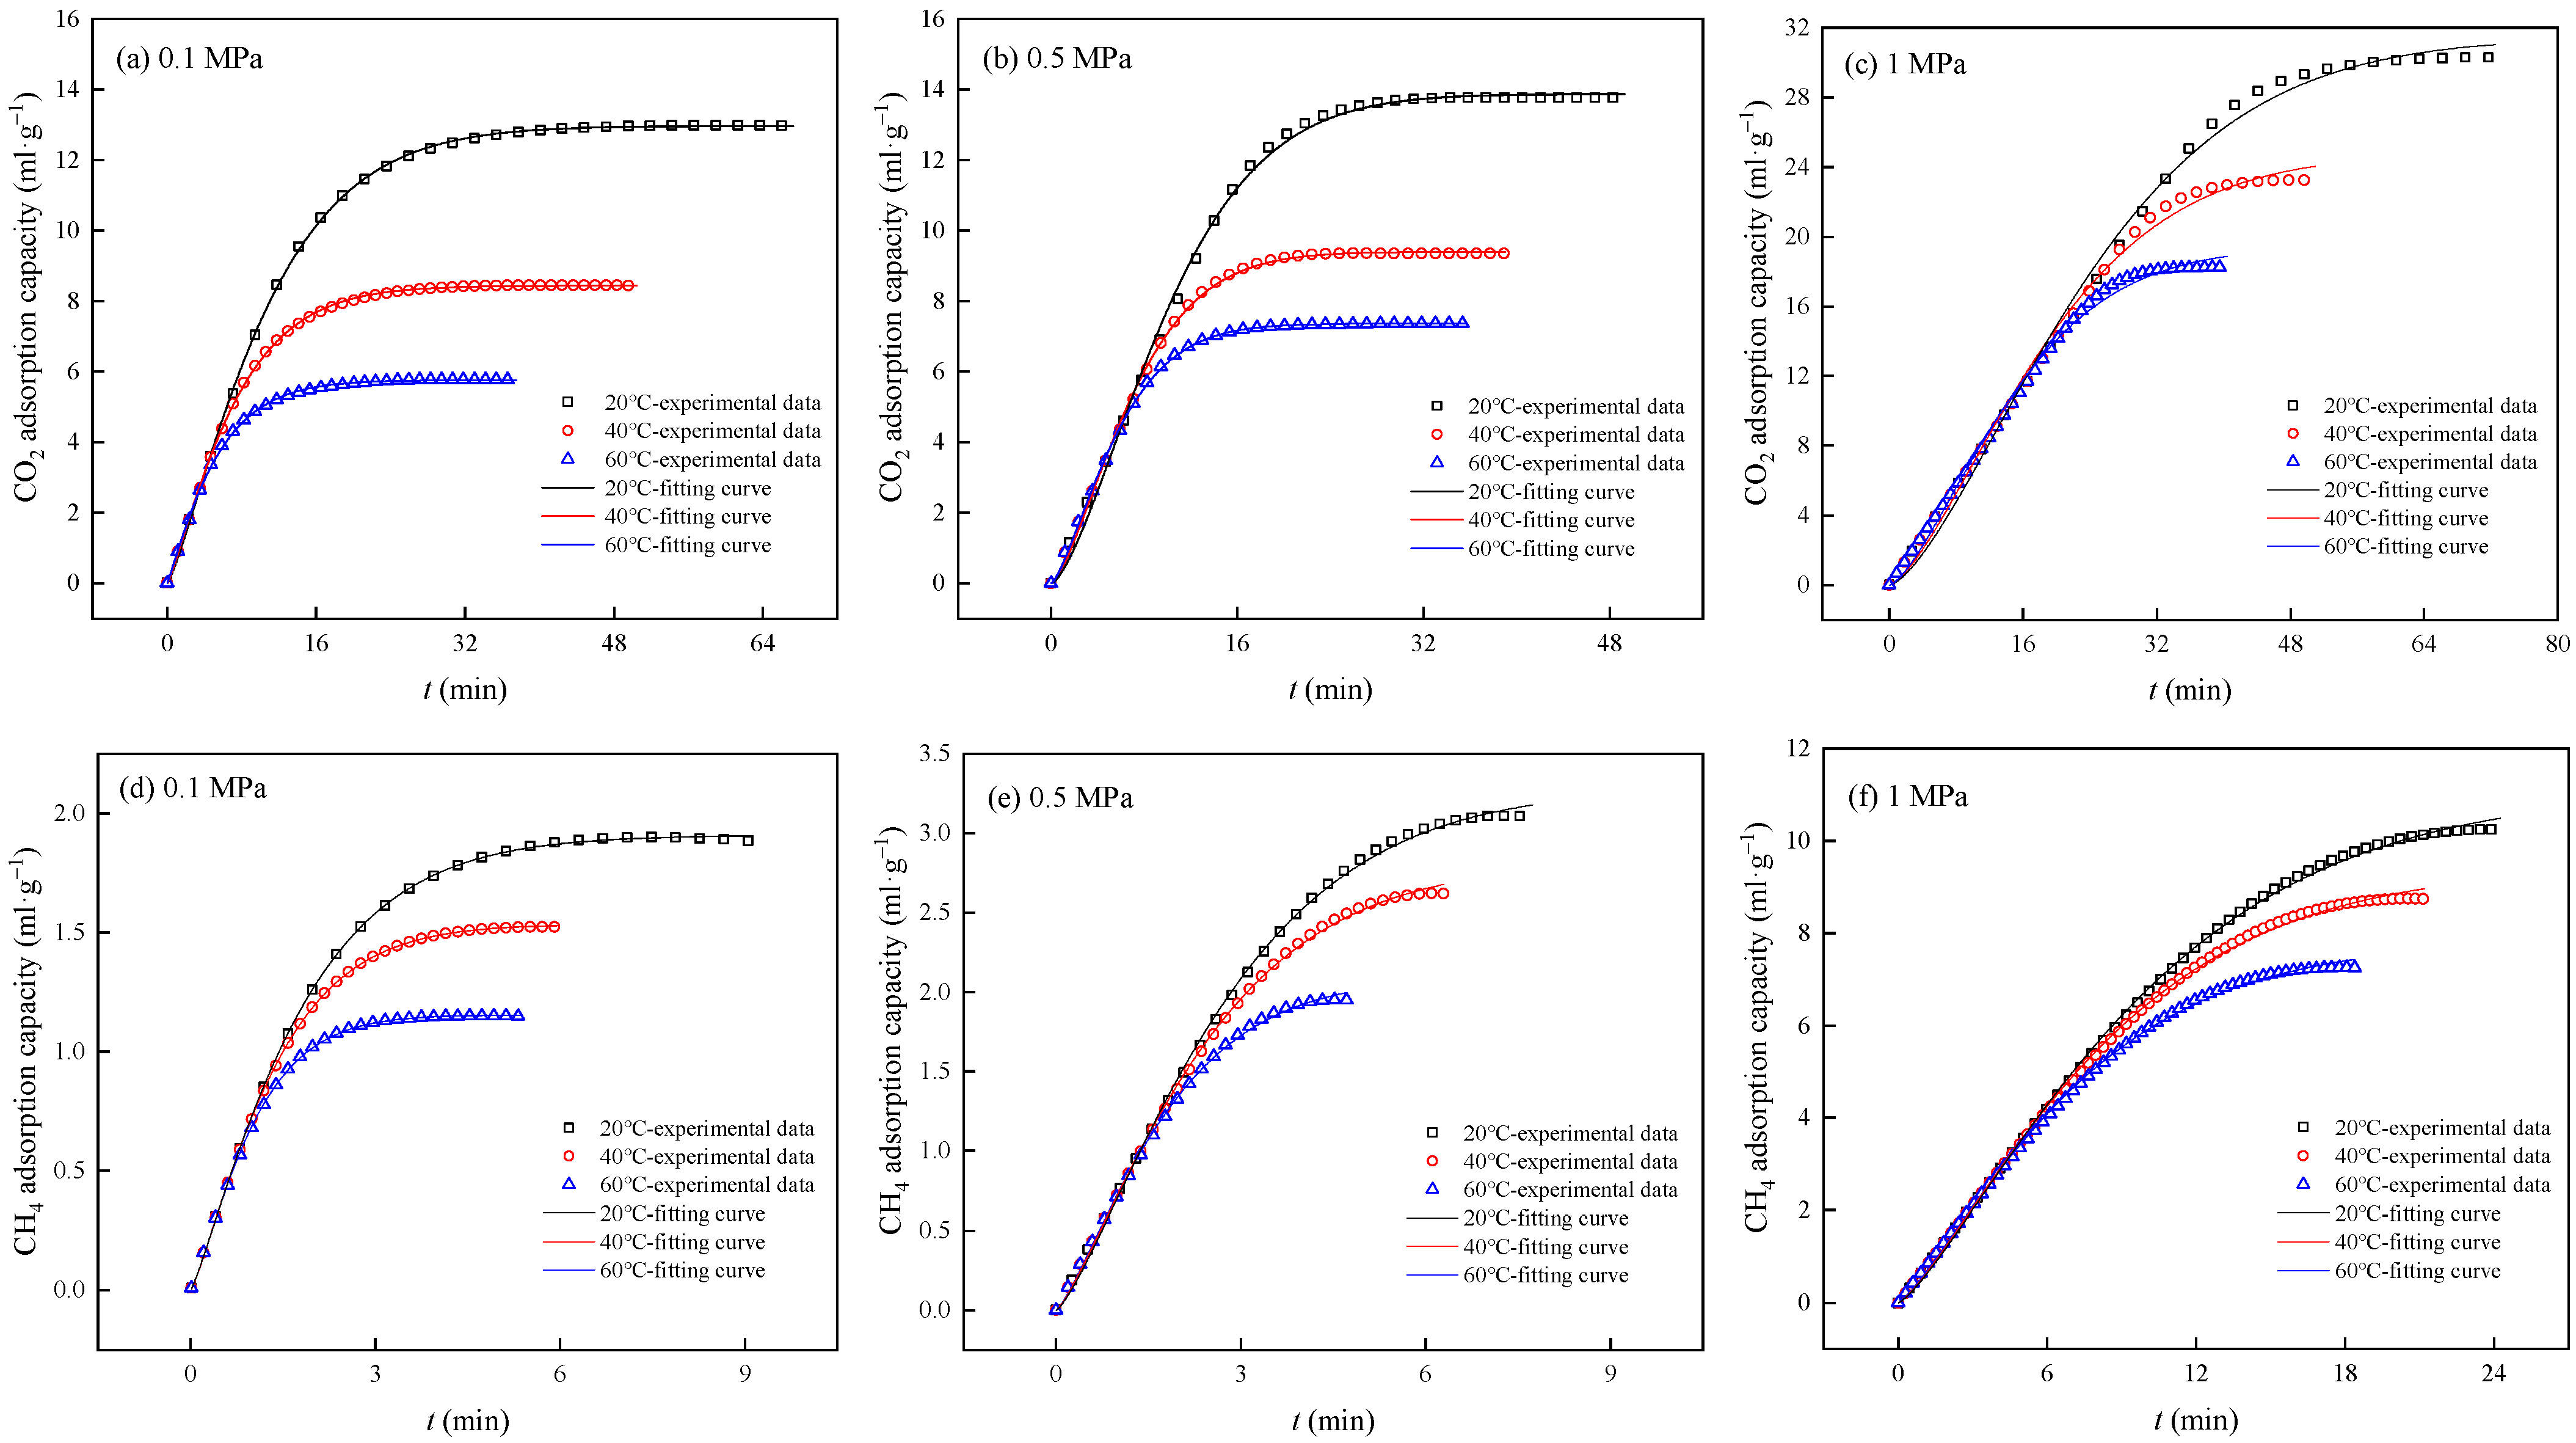
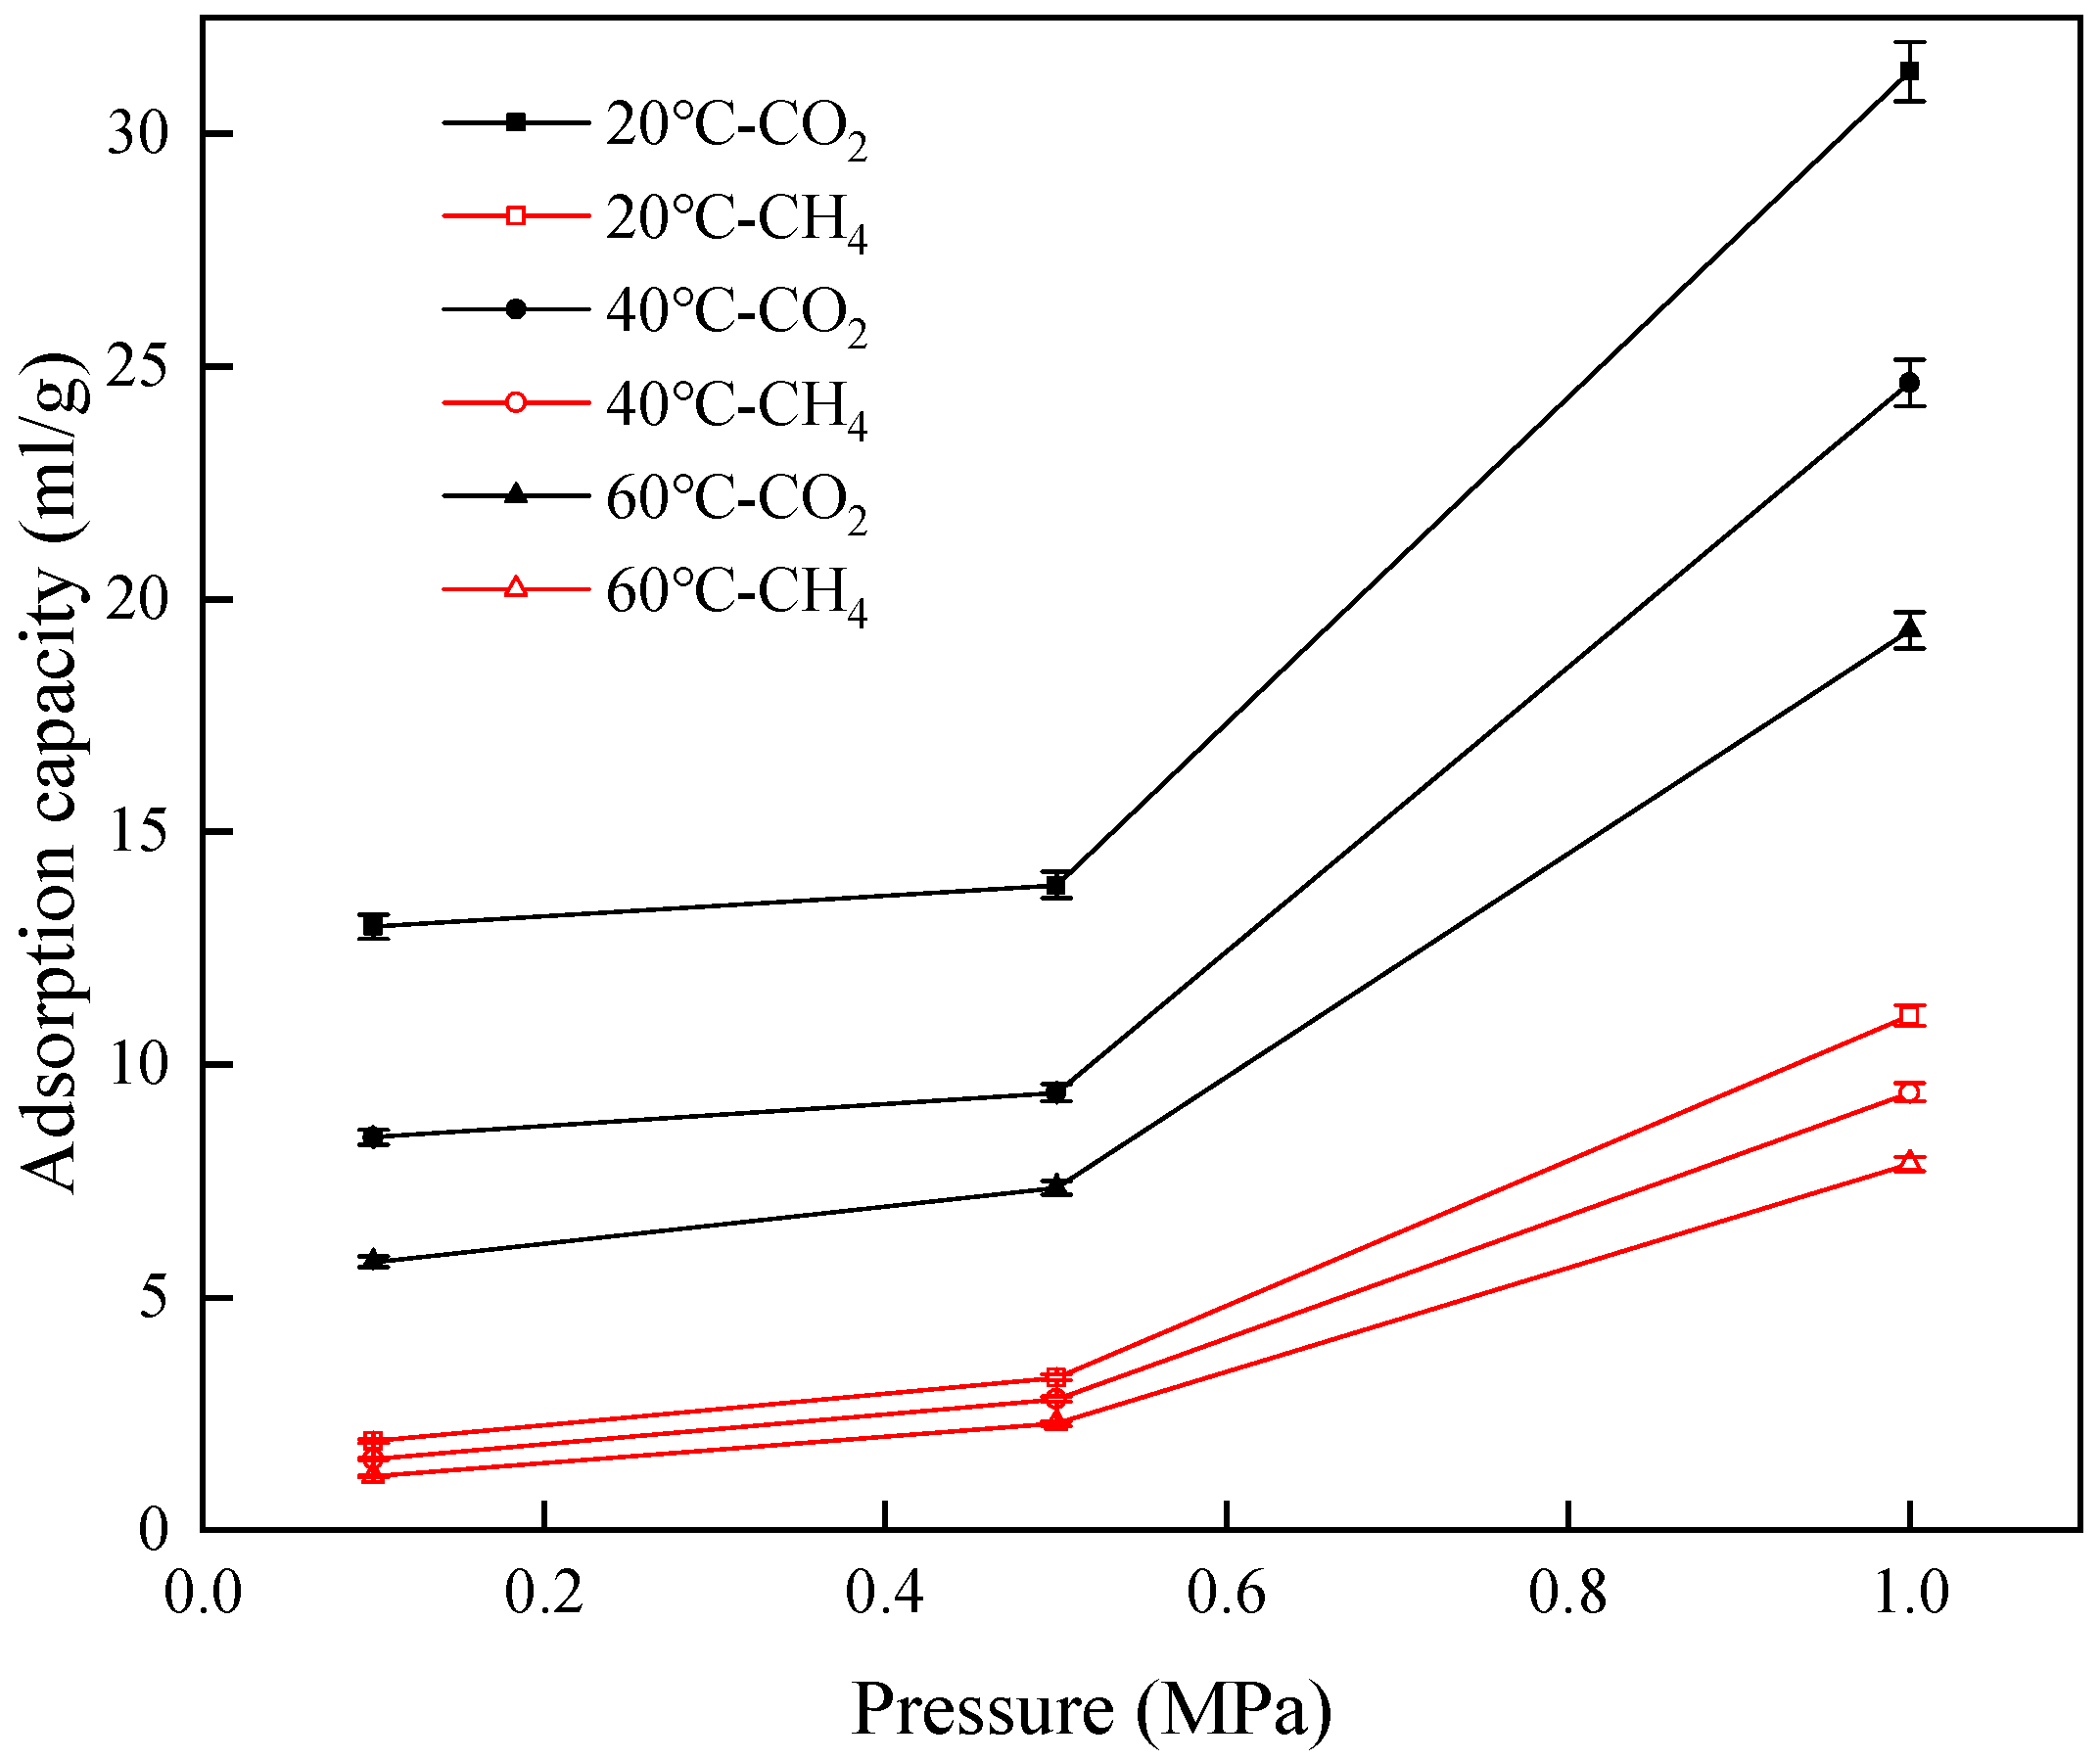
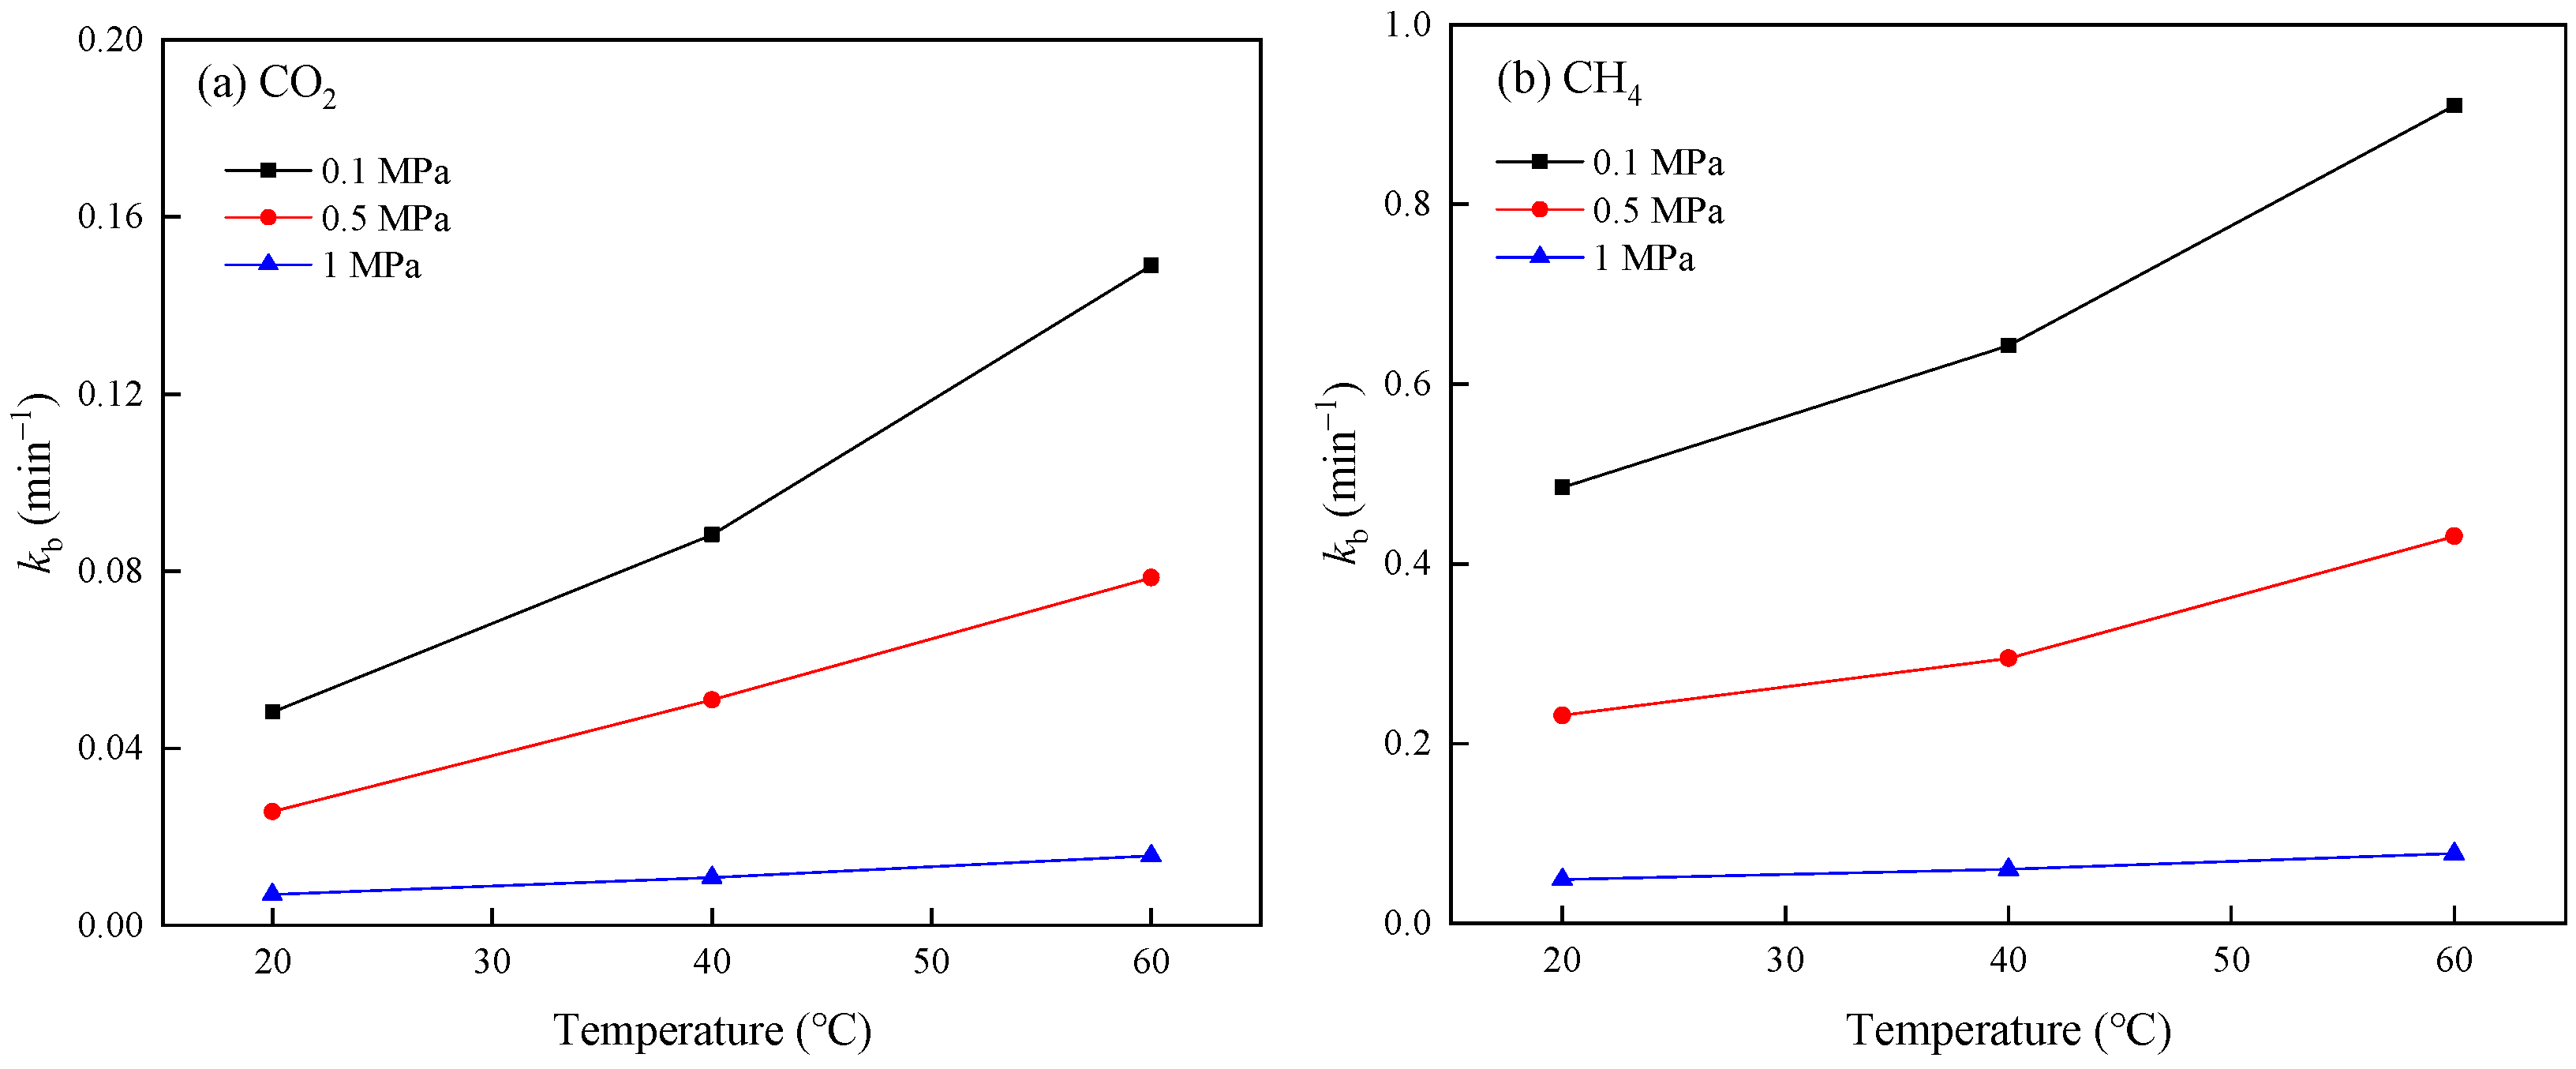
3.2. Adsorption Capacity and Rate
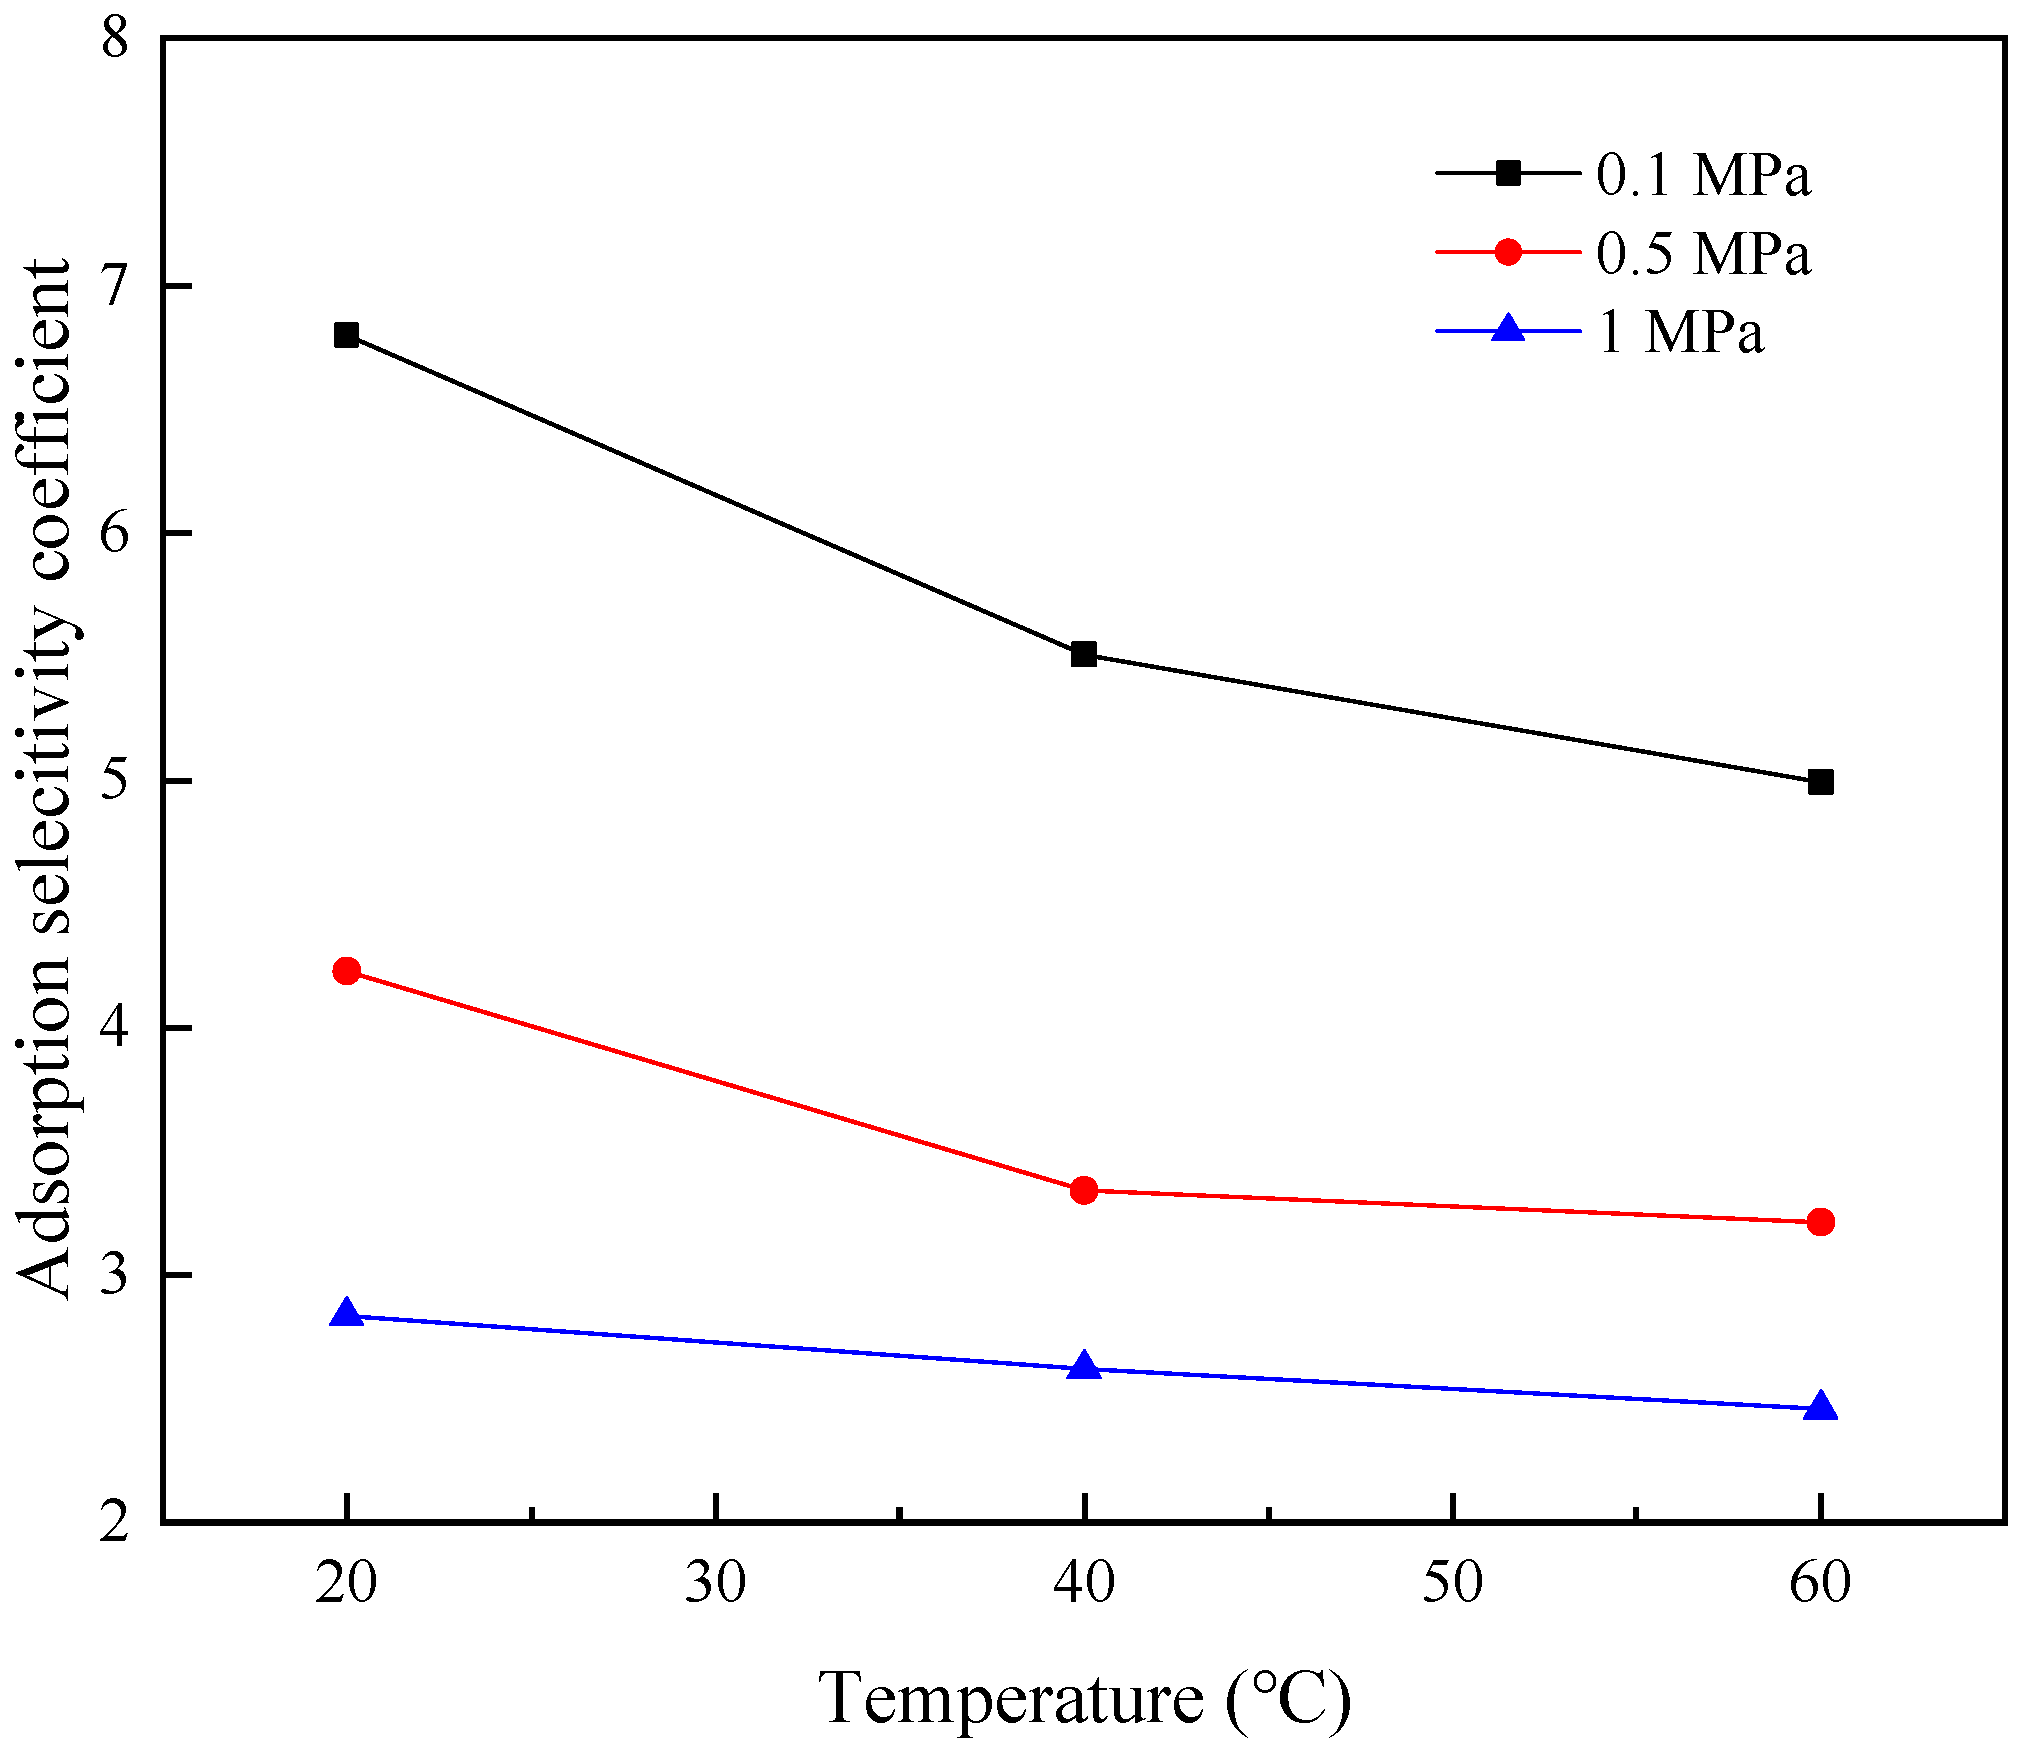
3.3. Analysis of Adsorption Selectivity
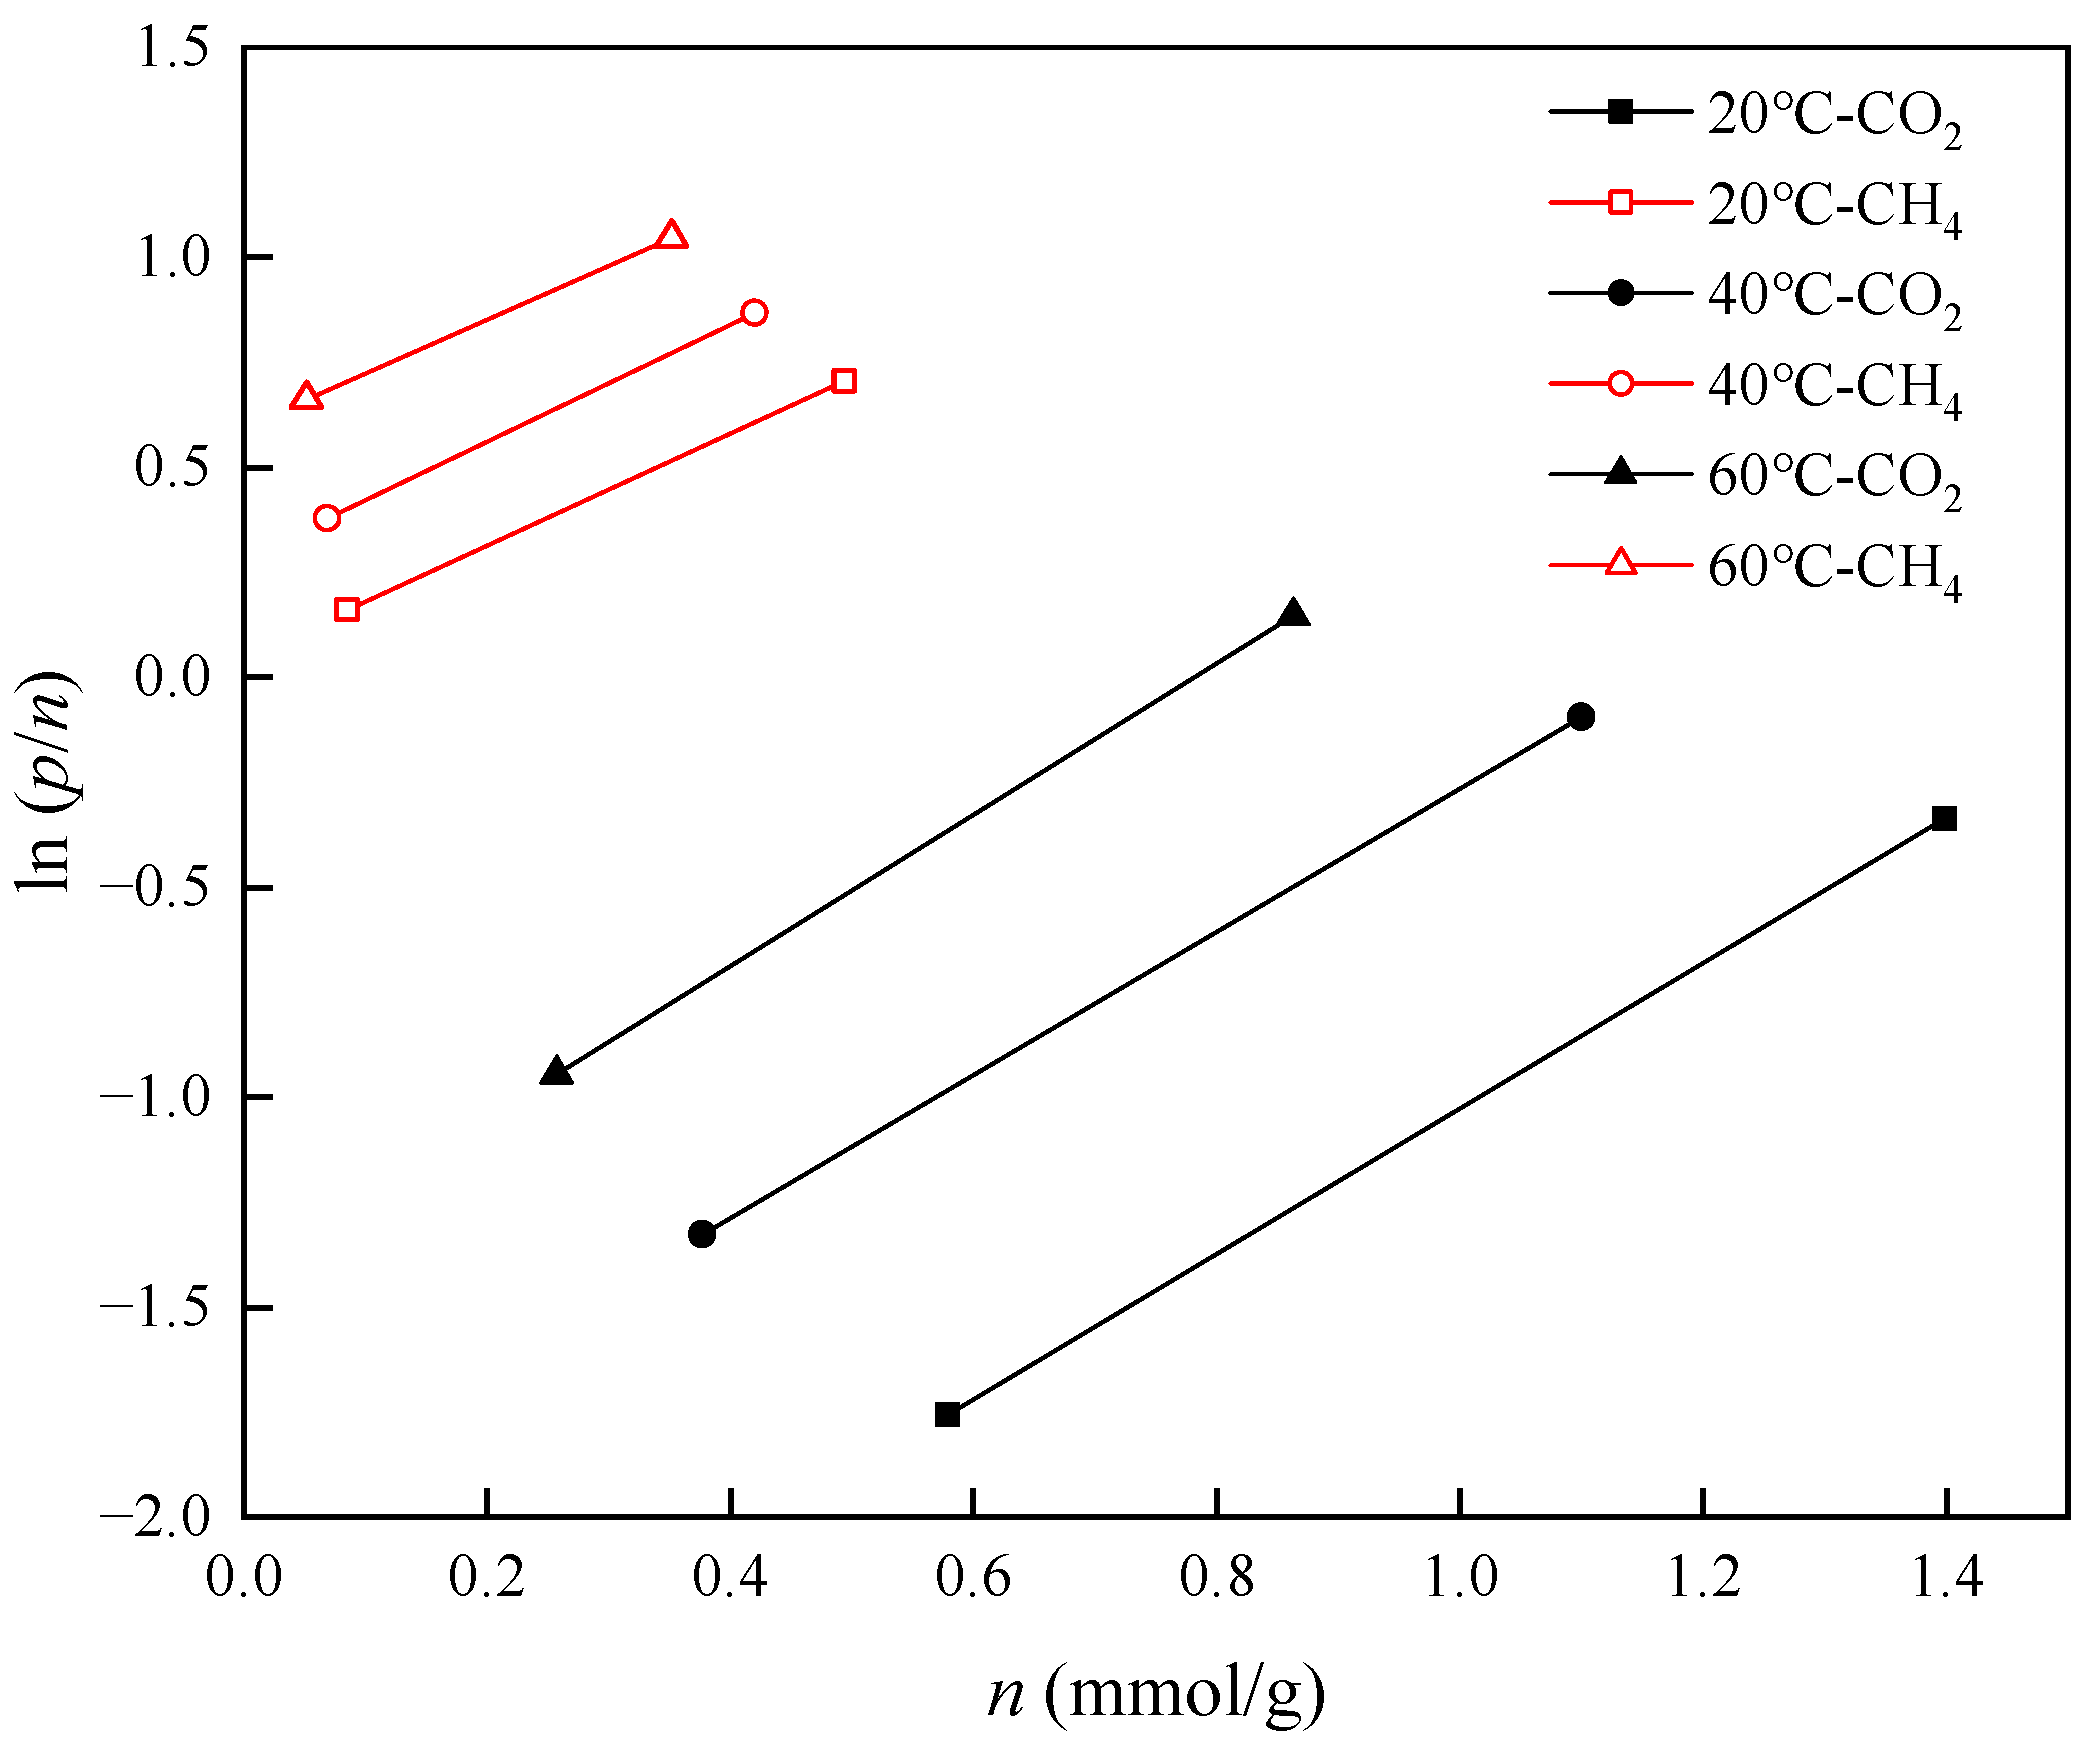
3.4. Thermodynamic Analysis of the Adsorption Process
4. Conclusions
- (1)
- At a constant temperature and within the pressure range of 0.1 MPa to 1 MPa, the adsorption capacities and rates of CO2 and CH4 increase with the increase in pressure. Additionally, the relative increase in the adsorption capacity of CH4 exceeds that of CO2, which results in the selectivity coefficient for CO2/CH4 decreasing with an increase in pressure, indicating that high pressure in the range of 0.1 MPa to 1 MPa is unfavorable for the replacement efficiency of CH4 by CO2.
- (2)
- At a constant pressure and within the temperature range of 20–60 °C, the adsorption capacities and rates of CO2 and CH4 decrease with the increase in temperature and the relative decrease in the adsorption capacity of CO2 is greater than that of CH4. Thus, the selectivity coefficient for CO2/CH4 decreases as temperature rises, indicating that lower temperatures are beneficial to the replacement efficiency of CH4 by CO2.
- (3)
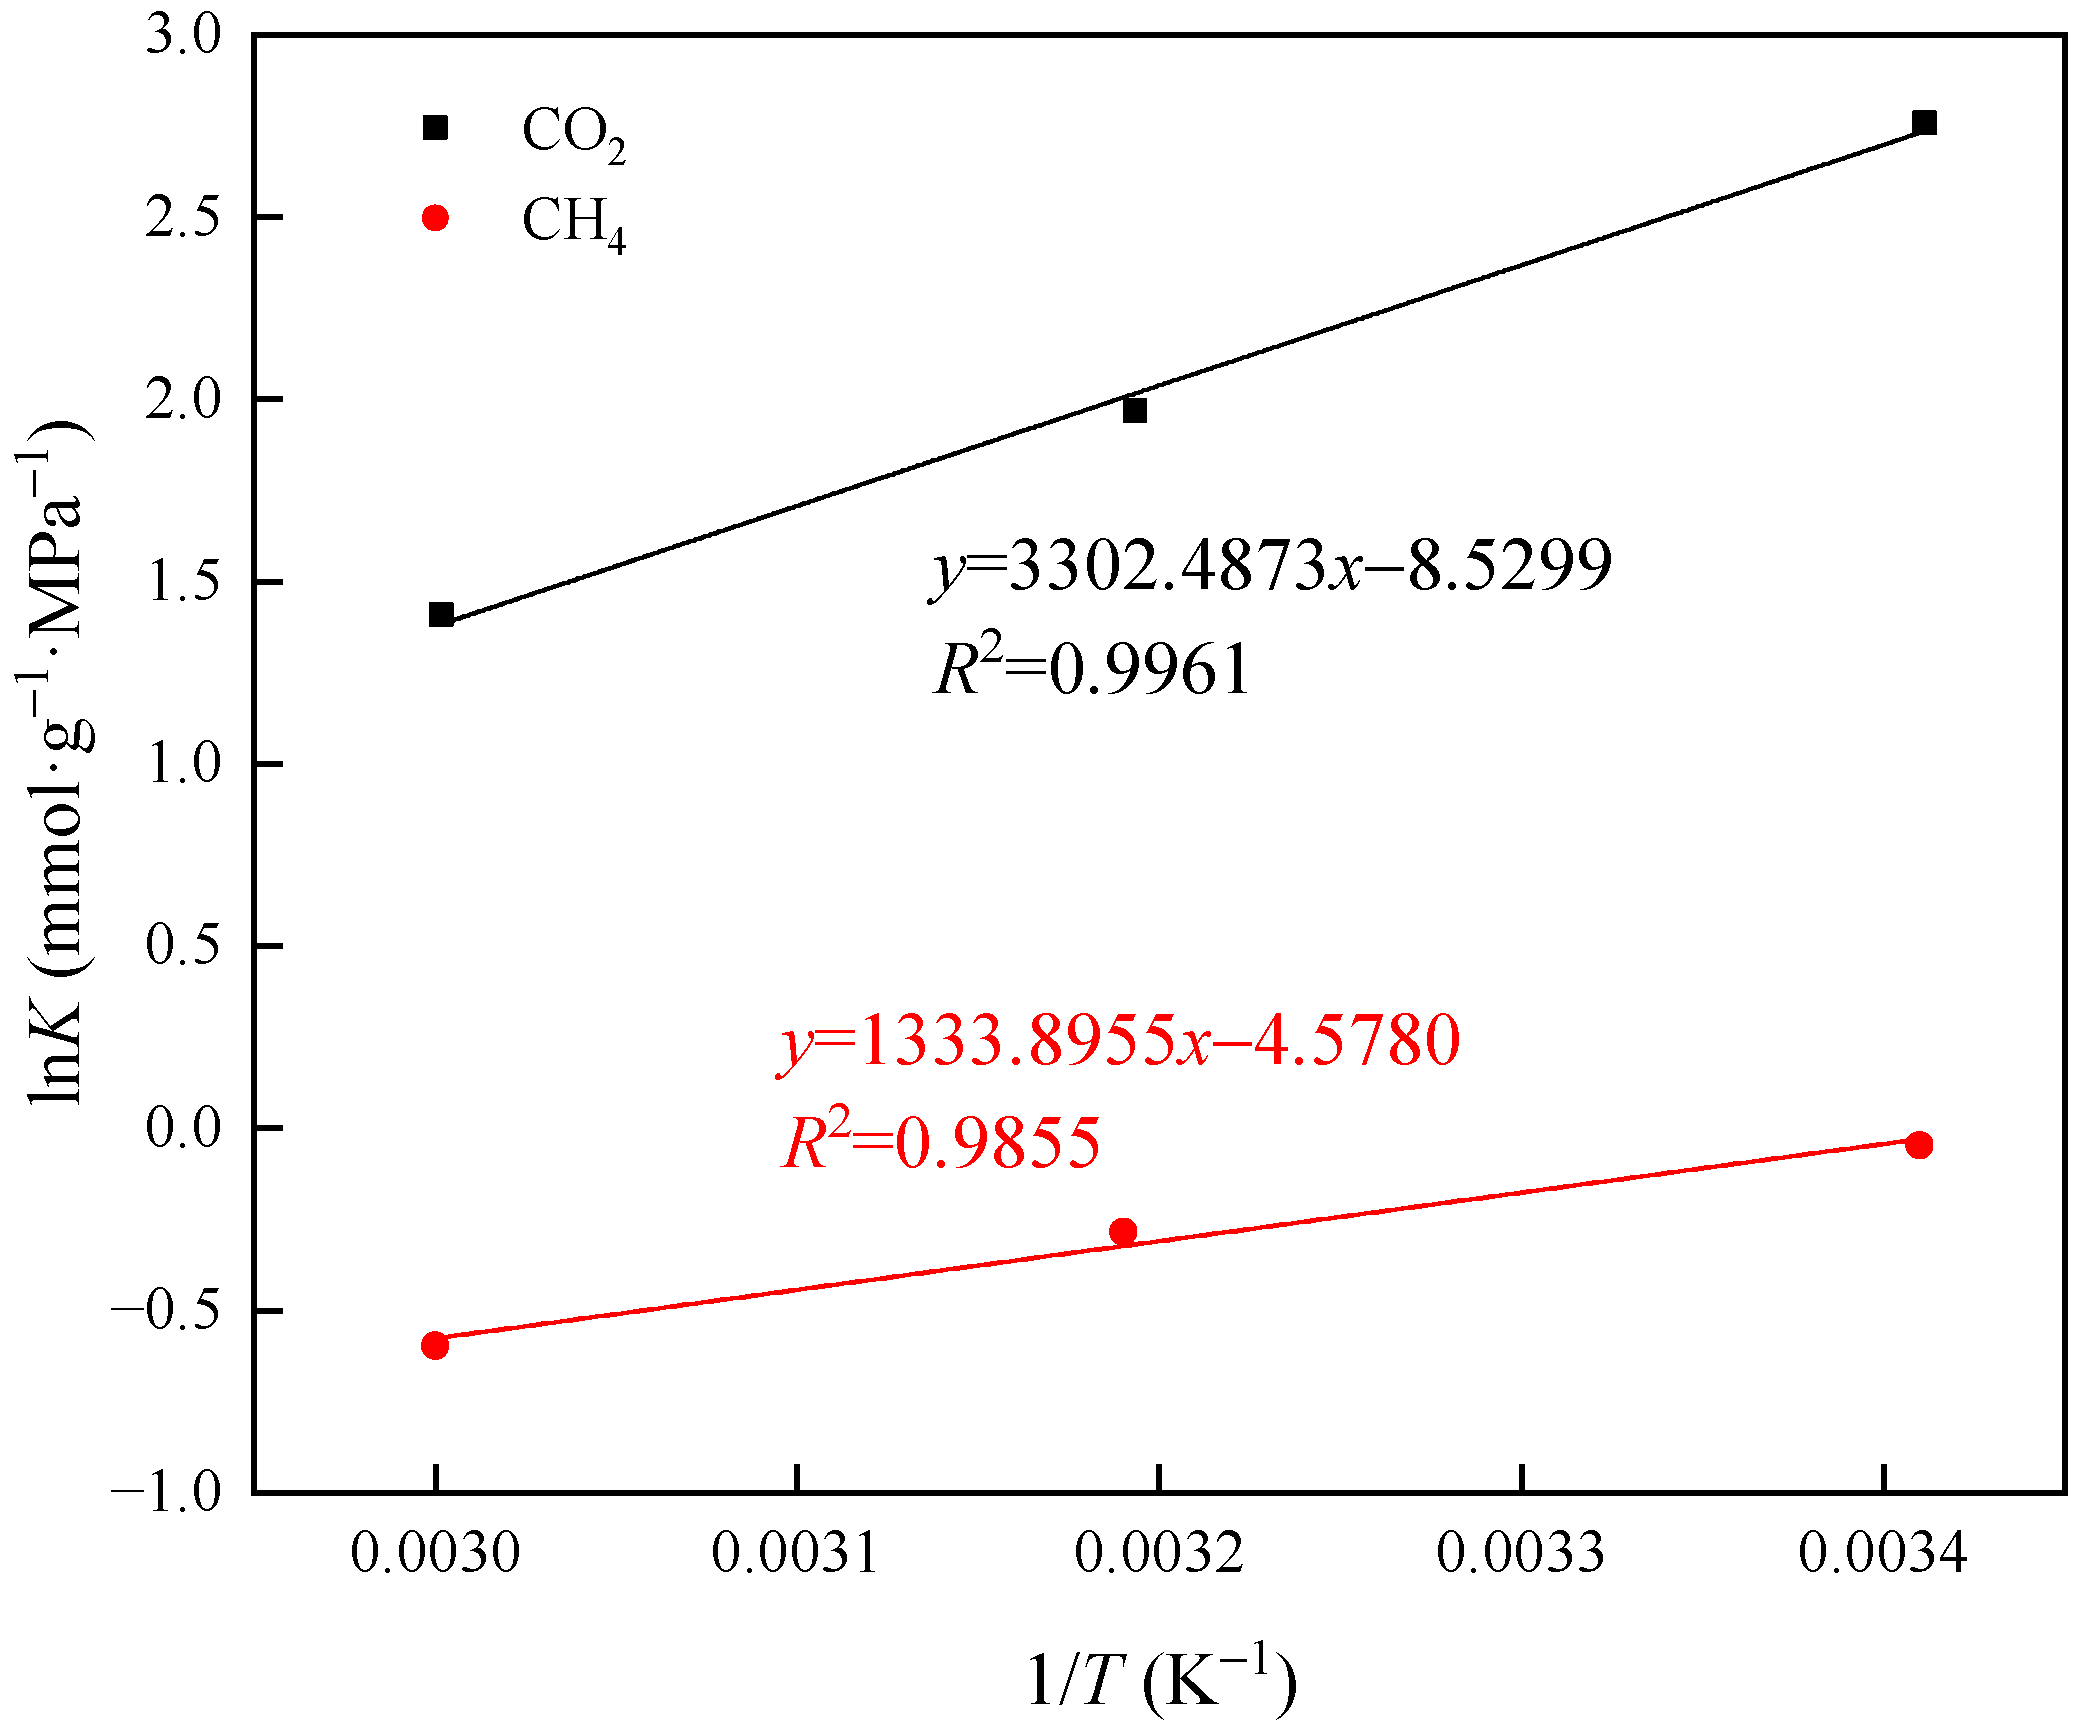
- The isosteric heat values of CO2 and CH4 are 27.46 kJ/mol and 11.09 kJ/mol, respectively, suggesting that both gases undergo physical adsorption. The isosteric heat value of CO2 is greater than that of CH4, which may be because CH4 molecules lack polarity and have a larger molecular size compared to CO2 molecules.
- (4)
- A higher isosteric heat indicates that the adsorption process encounters significant energy barriers, potentially resulting in the initial adsorption rate of CH4 being higher than that of CO2. As time progresses, CO2 begins to adsorb more rapidly than CH4, and this trend persists for the duration of the adsorption process.
- (5)
- In this study, only the operational conditions (temperature and pressure) were varied to evaluate their effects on the competitive adsorption behavior. Other factors, such as the composition ratio of mixed gases, specific surface area of coal, porosity, pore size, particle size, and moisture content, remain insufficiently understood.
- (6)
- To further improve the understanding of the competitive adsorption behavior of coal for gas mixtures, future studies should investigate the effects of modifying the composition ratio of CO2 and CH4, using different coal grades, or varying the moisture content of coal on the competitive adsorption characteristics.
Author Contributions
Funding
Data Availability Statement
Acknowledgments
Conflicts of Interest
References
- Wang, W.D.; Li, S.J.; Han, J.X. Analysis of coal supply and demand situation and industry development prospect in major coal resource countries in the world. China Min. Mag. 2015, 24, 5–9. [Google Scholar]
- Lin, Y.B.; Qin, Y.; Duan, Z.H.; Ma, D.M. Coalbed methane exploration technology and method in coal resource exploration. Coal Geol. Explor. 2019, 47, 90–97. [Google Scholar]
- Asif, M.; Wang, L.; Naveen, P.; Longinos, S.N.; Hazlett, R.; Ojha, K.; Panigrahi, D.C. Influence of competitive adsorption, diffusion, and dispersion of CH4 and CO2 gases during the CO2-ECBM process. Fuel 2024, 358, 130065. [Google Scholar] [CrossRef]
- Zhang, K.; Sang, S.X.; Liu, S.Q.; Liu, C.J. Feasibility and existing problems of CO2-ECBM technology. China Coalbed Methane 2016, 13, 43–46. [Google Scholar]
- Zhu, W.C.; Liu, S.Y.; Zhang, X.F.; Wei, C.H. Coupled coal-gas interaction during CBM and CO2-ECBM recovery in coal seams: A critical review. Geomech. Geophys. Geo-Energy Geo-Resour. 2022, 8, 195. [Google Scholar]
- Cui, Y.J. Study on the Adsorption of CH4, N2, CO2, and Multicomponent Gases on Coal. Ph.D. Thesis, China Coal Research Institute, Xi’an, China, 2003. [Google Scholar]
- Battistutta, E.; Van Hemert, P.; Lutynski, M.; Bruining, H.; Wolf, K.-H. Swelling and sorption experiments on methane, nitrogen and carbon dioxide on dry Selar Cornish coal. Int. J. Coal Geol. 2010, 84, 39–48. [Google Scholar] [CrossRef]
- Zhu, C.; Hu, S.J.; Gao, Z.S.; Liu, N.; Liu, Q.; Liu, T. Experimental comparison of CO2, CH4, and N2 adsorption capacity on typical Chinese coals at different temperatures. Energy Sources Part A 2024, 46, 14526–14537. [Google Scholar] [CrossRef]
- Yu, H.G.; Fang, W.T.; Sun, M.Y.; Ye, J.P. Isothermal adsorption characteristics and prediction of CH4/CO2 binary gas on coal. J. China Coal Soc. 2005, 5, 76–80. [Google Scholar]
- Huang, K.B.; Du, X.D.; Li, K.G.; Zhou, J.P.; Zhang, D.F.; Abbas, N.; Cheng, Y.G.; Wu, T.F.; Liu, G.J.; He, C. Competitive adsorption of CO2 / CH4 on coal: Insights from thermodynamics. Alex. Eng. J. 2024, 97, 114–126. [Google Scholar]
- Brochard, L.; Vandamme, M.; Pellenq, R.J.-M.; Fen-Chong, T. Adsorption-induced deformation of microporous materials: Coal swelling induced by CO2–CH4 competitive adsorption. Langmuir 2012, 28, 2659–2670. [Google Scholar]
- Zhao, Y.L.; Feng, Y.H.; Zhang, X.X. Selective adsorption and selective transport diffusion of CO2–CH4 binary mixture in coal ultramicropores. Environ. Sci. Technol. 2016, 50, 9380–9389. [Google Scholar] [CrossRef] [PubMed]
- Liu, A.; Liu, S.M.; Zhang, K.M.; Xia, K.M. Competitive sorption of CH4 and CO2 on coals: Implications for carbon geo-storage. Sep. Purif. Technol. 2025, 354, 129399. [Google Scholar] [CrossRef]
- Liao, Q.; Zhou, J.P.; Xian, X.F.; Yang, K.; Zhang, C.P.; Dong, Z.Q.; Yin, H. Competition adsorption of CO2/CH4 in shale: Implications for CO2 sequestration with enhanced gas recovery. Fuel 2023, 339, 127400. [Google Scholar] [CrossRef]
- Zhang, J.Y.; Zhou, J.P.; Xian, X.F.; Jiang, Y.D.; Tang, J.R.; Liao, Q.; Li, H.L.; Chen, Y.L. Adsorption behavior and thermodynamic analysis of pure and binary CO2/CH4 mixture on shale. Gas Sci. Eng. 2025, 134, 205520. [Google Scholar] [CrossRef]
- Bai, G.; Zhang, H.J.; Zhang, X.; Fan, C.J.; Wang, J.; Wei, J.; Zhang, Y.L. Simulation study of competitive adsorption of CH4/CO2 and CH4/N2 in anthracite coal. Energy Rep. 2024, 12, 6082–6092. [Google Scholar] [CrossRef]
- Zhang, S.H.; Tang, S.H.; Li, Z.C.; Liu, B.; Wang, R.X. Effect of pore structure on competitive sorption and diffusion of mixed methane and carbon dioxide in anthracite, South Qinshui Basin, China. Int. J. Coal Geol. 2022, 253, 103956. [Google Scholar] [CrossRef]
- Tao, H.H.; Zhang, L.H.; Liu, Q.G.; Zhao, Y.L.; Feng, Q. Competitive adsorption and selective diffusion of CH4 and the intruding gases in coal vitrinite. Energy Fuels 2019, 33, 6971–6982. [Google Scholar] [CrossRef]
- Jia, J.Z.; Wang, D.M.; Li, B.; Wu, Y.M.; Zhao, D. Molecular simulation study on the effect of coal metamorphism on the competitive adsorption of CO2/CH4 in binary system. Fuel 2023, 335, 127046. [Google Scholar] [CrossRef]
- Li, Y.; Yang, Z.Z.; Li, X.G. Molecular simulation study on the effect of coal rank and moisture on CO2 / CH4 competitive adsorption. Energy Fuels 2019, 33, 9087–9098. [Google Scholar] [CrossRef]
- Guang, W.F.; Zhang, Z.Y.; Liu, X.Q.; He, X.J.; Luo, P.; Lu, Y.P. Adsorption selectivity of confined CH4-CO2 mixture in coal: Influence of physicochemical structure and thermodynamic competitive mechanism. Sep. Purif. Technol. 2025, 360, 130982. [Google Scholar] [CrossRef]
- Zhang, S.H.; Zhang, S.R.; Tang, S.H.; Xin, D.; Liu, B. Adsorption and migration of methane and carbon dioxide mixture in anthracite. J. China Coal Soc. 2021, 46, 544–555. [Google Scholar]
- Li, J.W.; Wang, Y.Z.; Chen, Z.X.; Rahman, S.S. Simulation of adsorption–desorption behavior in coal seam gas reservoirs at the molecular level: A comprehensive review. Energy Fuels 2020, 34, 2619–2642. [Google Scholar]
- Wang, S.B.; Qin, Z.H.; Zhou, J.L.; Lian, L.L.; Yang, X.Q.; Lin, Z. Application of molecular dynamics simulation in coal structure and related fields. Clean Coal Technol. 2019, 25, 29–34. [Google Scholar]
- GB/T 31391-2015; Ultimate Analysis of Coal. The National Standards Compilation Group of Peoples Republic of China, Standards Press of China: Beijing, China, 2015.
- GB/T 212-2008; Proximate Analysis of Coal. The National Standards Compilation Group of Peoples Republic of China, Standards Press of China: Beijing, China, 2008.
- Li, H.J.; Wang, S.C.; Zeng, Q.; Kang, J.H.; Guan, W.M.; Li, W.T. Effects of pore structure of different rank coals on methane adsorption heat. Processes 2021, 9, 1971. [Google Scholar] [CrossRef]
- Vigdorovich, V.; Tsygankova, L.; Esina, M.; Uryadnikov, A.; Shel, N. Calculation of the dynamic sorbent capacity in the presence of two sorbates. J. Water Process. Eng. 2017, 20, 180–186. [Google Scholar] [CrossRef]
- Wang, L.Y.; Xu, N.; Hu, Y.Q.; Sun, W.Q.; Krishna, R.; Li, J.H.; Jiang, Y.J.; Duttwyler, S.; Zhang, Y.B. Efficient capture of C2H2 from CO2 and CnH4 by a novel fluorinated anion pillared MOF with flexible molecular sieving effect. Nano Res. 2023, 16, 3536–3541. [Google Scholar]
- Chu, K.H. Rebuttal to comment on “Breakthrough curve analysis by simplistic models of fixed bed adsorption: In defense of the century-old Bohart-Adams model”. Chem. Eng. J. 2020, 398, 125546. [Google Scholar]
- Liu, X.H.; Chen, Y.; Li, J.L.; Lu, C.Y.; Wang, Y.; Li, L.B.; Li, J.P. Study on molding and CO2 / N2 separation performance of porous material M-MOF-74(M=Mg, Co, Ni). J. Taiyuan Univ. Technol. 2022, 53, 474–481. [Google Scholar]
- Zuo, L.; Hu, Z.M.; Cui, Y.X.; Xiong, W.; Gao, S.S.; Shen, R.; Xiao, H.R. Experimental study on adsorption kinetics of shale at high temperature and high pressure. J. China Coal Soc. 2016, 41, 2017–2023. [Google Scholar]
- Tang, X.; Ripepi, N.; Stadie, N.P.; Yu, L.J. Thermodynamic analysis of high pressure methane adsorption in Longmaxi shale. Fuel 2017, 193, 411–418. [Google Scholar]
- Zhu, H.Z.; Zhu, X.L.; Chen, H.C.; Wei, Y.J. Aging effects on thermodynamics in palladium–tritium system during tritium storage. Int. J. Hydrogen Energy 2008, 33, 1890–1896. [Google Scholar]
- Zhao, X.B.; Xiao, B.; Fletcher, A.; Thomas, K. Hydrogen adsorption on functionalized nanoporous activated carbons. J. Phys. Chem. B 2005, 109, 8880–8888. [Google Scholar] [PubMed]
- Gao, B.B.; Gao, Z.; Li, J.H.; Ren, C.H.; Wang, B.; Zhang, Y. Study on adsorption thermodynamic characteristics of gas under different temperatures and pressures. J. Saf. Environ. 2021, 21, 2479–2488. [Google Scholar]
- Guan, L.L.; Duan, L.Y.; Xie, Y.C. Adsorption and separation of N2 and Ar on modified NaA molecular sieve. Acta Chim. Sin. 2004, 62, 1392. [Google Scholar]
- Xiang, J.H.; Lei, L. Study on the influence of coal surface functional groups on the adsorption properties of CH4 and CO2. Coal Sci. Technol. 2021, 49, 0253–2336. [Google Scholar]
- Wasserstein, R.L.; Lazer, N.A. The ASA statement on p-values: Context, process, and purpose. Taylor Fr. 2016, 70, 129–133. [Google Scholar]
- Jeong, S.R.; Park, J.H.; Lee, J.H.; Jeon, P.R.; Lee, C.-H. Review of the adsorption equilibria of CO2, CH4, and their mixture on coals and shales at high pressures for enhanced CH4 recovery and CO2 sequestration. Fluid Phase Equilibria 2023, 564, 113591. [Google Scholar] [CrossRef]
- Zhao, S.; Chen, X.J.; Li, X.J.; Qi, L.L.; Zhang, G.X. Experimental analysis of the effect of temperature on coal pore structure transformation. Fuel 2021, 305, 121613. [Google Scholar] [CrossRef]
- Tong, S.Q.; Jian, W.W.; Hai, Q.Y.; Xie, W.X.; Sun, Y. Research progress of porous solid materials for CO2 adsorption and removal. J. Liaoning Univ. Pet. Chem. Technol. 2022, 42, 30. [Google Scholar]
- Li, S.G.; Bai, Y.; Lin, H.F.; Yan, M.; Long, H. Molecular simulation of adsorption thermodynamic characteristics of CH4, CO2 and N2 multicomponent gases in coal molecules. J. China Coal Soc. 2018, 43, 2476–2483. [Google Scholar]

| Analysis Results | Surveillance Project | Proportion (%) |
|---|---|---|
| Elemental analysis | Cad | 77.59 |
| Had | 2.84 | |
| Oad | 3.48 | |
| Nad | 1.21 | |
| Sad | 0.24 | |
| Industrial analysis | Mad | 0.72 |
| Aad | 13.88 | |
| Vad | 7.54 | |
| FCad | 77.86 |
| Pore Diameter (nm) | Pore Volume (cm3/g) | Specific Surface Area (m2/g) |
|---|---|---|
| d ≤ 2 | 0.0515 | 160.06 |
| 2 ≤ d ≤ 50 | 0.0777 | 54.42 |
| d > 50 | 0.0053 | 0.0381 |
| Pressure (MPa) | Temperature (°C) | Gas Component | Breakthrough Point (min) | Breakthrough Time Difference (min) |
|---|---|---|---|---|
| 0.1 | 20 | CH4 | 0.485 | 6.602 |
| CO2 | 7.087 | |||
| 40 | CH4 | 0.367 | 3.773 | |
| CO2 | 4.140 | |||
| 60 | CH4 | 0.210 | 2.358 | |
| CO2 | 2.568 | |||
| 0.5 | 20 | CH4 | 1.038 | 11.629 |
| CO2 | 12.667 | |||
| 40 | CH4 | 0.707 | 6.956 | |
| CO2 | 7.663 | |||
| 60 | CH4 | 0.590 | 4.952 | |
| CO2 | 5.542 | |||
| 1 | 20 | CH4 | 3.677 | 27.946 |
| CO2 | 31.623 | |||
| 40 | CH4 | 3.125 | 20.470 | |
| CO2 | 23.595 | |||
| 60 | CH4 | 1.777 | 15.690 | |
| CO2 | 17.467 |
| Pressure (MPa) | Temperature (°C) | Gas Component | ne (mL/g) | kb (min−1) | z | R2 |
|---|---|---|---|---|---|---|
| 0.1 | 20 | CO2 | 12.9654 | 0.0482 | 1.2448 | 0.9998 |
| CH4 | 1.9072 | 0.4851 | 1.1760 | 0.9998 | ||
| 40 | CO2 | 8.4388 | 0.0883 | 1.1918 | 0.9998 | |
| CH4 | 1.5325 | 0.6441 | 1.2215 | 0.9998 | ||
| 60 | CO2 | 5.7627 | 0.1489 | 1.1234 | 0.9995 | |
| CH4 | 1.1545 | 0.9085 | 1.2383 | 0.9997 | ||
| 0.5 | 20 | CO2 | 13.8577 | 0.0257 | 1.5032 | 0.9979 |
| CH4 | 3.2790 | 0.2421 | 1.3009 | 0.9988 | ||
| 40 | CO2 | 9.3935 | 0.0509 | 1.4422 | 0.9988 | |
| CH4 | 2.8104 | 0.2978 | 1.2639 | 0.9990 | ||
| 60 | CO2 | 7.3626 | 0.0786 | 1.3833 | 0.9994 | |
| CH4 | 2.2912 | 0.4297 | 1.2761 | 0.9987 | ||
| 1 | 20 | CO2 | 31.3332 | 0.0070 | 1.5077 | 0.9959 |
| CH4 | 11.0565 | 0.0485 | 1.2899 | 0.9990 | ||
| 40 | CO2 | 24.6431 | 0.0109 | 1.4785 | 0.9957 | |
| CH4 | 9.4067 | 0.0597 | 1.2873 | 0.9991 | ||
| 60 | CO2 | 19.3309 | 0.0157 | 1.4747 | 0.9956 | |
| CH4 | 7.8680 | 0.0778 | 1.2496 | 0.9991 |
| Source | Gas Component | Degrees of Freedom | Sum of Squares | Mean Square | F-Value | p-Value |
|---|---|---|---|---|---|---|
| Temperature | CO2 | 2 | 111.86335 | 55.93167 | 24.66437 | 0.00563 |
| CH4 | 2 | 4.04936 | 2.02468 | 4.48049 | 0.09525 | |
| Pressure | CO2 | 2 | 480.76329 | 240.38164 | 106.00188 | 3.42924 × 10⁻⁴ |
| CH4 | 2 | 108.42316 | 54.21158 | 119.967 | 2.6889 × 10⁻⁴ | |
| Interaction | CO2 | 4 | 592.62664 | 148.15666 | 65.33313 | 6.74953 × 10⁻⁴ |
| CH4 | 4 | 112.47251 | 28.11813 | 62.22375 | 7.42604 × 10⁻⁴ | |
| Error | CO2 | 4 | 9.07084 | 2.26771 | - | - |
| CH4 | 4 | 1.80755 | 0.45189 | - | - | |
| Total | CO2 | 8 | 601.69748 | - | - | - |
| CH4 | 8 | 114.28006 | - | - | - |
| Pressure (MPa) | Temperature Range (°C) | Gas Component | Relative Decrease in Adsorption Capacity (%) | Temperature (°C) | Pressure Range (MPa) | Gas Component | Relative Increase in Adsorption Capacity (%) |
|---|---|---|---|---|---|---|---|
| 0.1 | 20–60 | CO2 | 55.553 | 20 | 0.1–1 | CO2 | 141.668 |
| CH4 | 39.466 | CH4 | 479.724 | ||||
| 0.5 | CO2 | 46.870 | 40 | CO2 | 192.021 | ||
| CH4 | 30.125 | CH4 | 513.814 | ||||
| 1 | CO2 | 38.305 | 60 | CO2 | 235.449 | ||
| CH4 | 28.838 | CH4 | 581.507 |
| Pressure (MPa) | Temperature (°C) | Adsorption Selectivity Coefficients for CO2/CH4 |
|---|---|---|
| 0.1 | 20 | 6.798 |
| 40 | 5.507 | |
| 60 | 4.992 | |
| 0.5 | 20 | 4.226 |
| 40 | 3.342 | |
| 60 | 3.213 | |
| 1 | 20 | 2.834 |
| 40 | 2.620 | |
| 60 | 2.457 |
| Gas Components | Temperature (°C) | Intercept | K (mmol·g−1·MPa−1) |
|---|---|---|---|
| CO2 | 20 | −2.7583 | 15.7730 |
| 40 | −1.9674 | 7.1521 | |
| 60 | −1.4088 | 4.0910 | |
| CH4 | 20 | 0.0472 | 0.9539 |
| 40 | 0.2846 | 0.7523 | |
| 60 | 0.5969 | 0.5505 |
Disclaimer/Publisher’s Note: The statements, opinions and data contained in all publications are solely those of the individual author(s) and contributor(s) and not of MDPI and/or the editor(s). MDPI and/or the editor(s) disclaim responsibility for any injury to people or property resulting from any ideas, methods, instructions or products referred to in the content. |
© 2025 by the authors. Licensee MDPI, Basel, Switzerland. This article is an open access article distributed under the terms and conditions of the Creative Commons Attribution (CC BY) license (https://creativecommons.org/licenses/by/4.0/).
Share and Cite
Zhu, Y.; Li, H.; Liu, J.; Zhou, C.; Zhao, Y. Competitive Adsorption Behavior of CO2 and CH4 in Coal Under Varying Pressures and Temperatures. Separations 2025, 12, 75. https://doi.org/10.3390/separations12040075
Zhu Y, Li H, Liu J, Zhou C, Zhao Y. Competitive Adsorption Behavior of CO2 and CH4 in Coal Under Varying Pressures and Temperatures. Separations. 2025; 12(4):75. https://doi.org/10.3390/separations12040075
Chicago/Turabian StyleZhu, Yijin, Haijian Li, Jiahong Liu, Caiwen Zhou, and Yunpeng Zhao. 2025. "Competitive Adsorption Behavior of CO2 and CH4 in Coal Under Varying Pressures and Temperatures" Separations 12, no. 4: 75. https://doi.org/10.3390/separations12040075
APA StyleZhu, Y., Li, H., Liu, J., Zhou, C., & Zhao, Y. (2025). Competitive Adsorption Behavior of CO2 and CH4 in Coal Under Varying Pressures and Temperatures. Separations, 12(4), 75. https://doi.org/10.3390/separations12040075