
Nonylphenol Removal from Water and Wastewater with Alginate-Activated Carbon Beads

 ,
,  , , ,
, , ,
Abstract
1. Introduction
2. Materials and Methods
2.1. Materials
2.2. Preparation of Alg-C Beads
2.3. Characterization of Alg-C Beads
2.4. Dosage Experiments
- C0 = the initial concentration of NPs (mg L−1);
- Ct = the concentration of NPs at a specific time during the sampling, starting from 0 min (mg L−1);
- Ce = the concentration (mg L−1) of NPs at equilibrium;
- V = the volume of the NP solution (L);
- M = the mass of the Alg-C bead dosage (g).
2.5. Kinetics, Isotherms, and Thermodynamics Determination
2.6. pH Experiments
2.7. Reusability of Alg-C Beads Experiments
2.8. Wastewater Experiments
2.9. SBSE-TDU-GC-MS Analysis, Calibration Curve, and Statistical Analysis
3. Results and Discussion
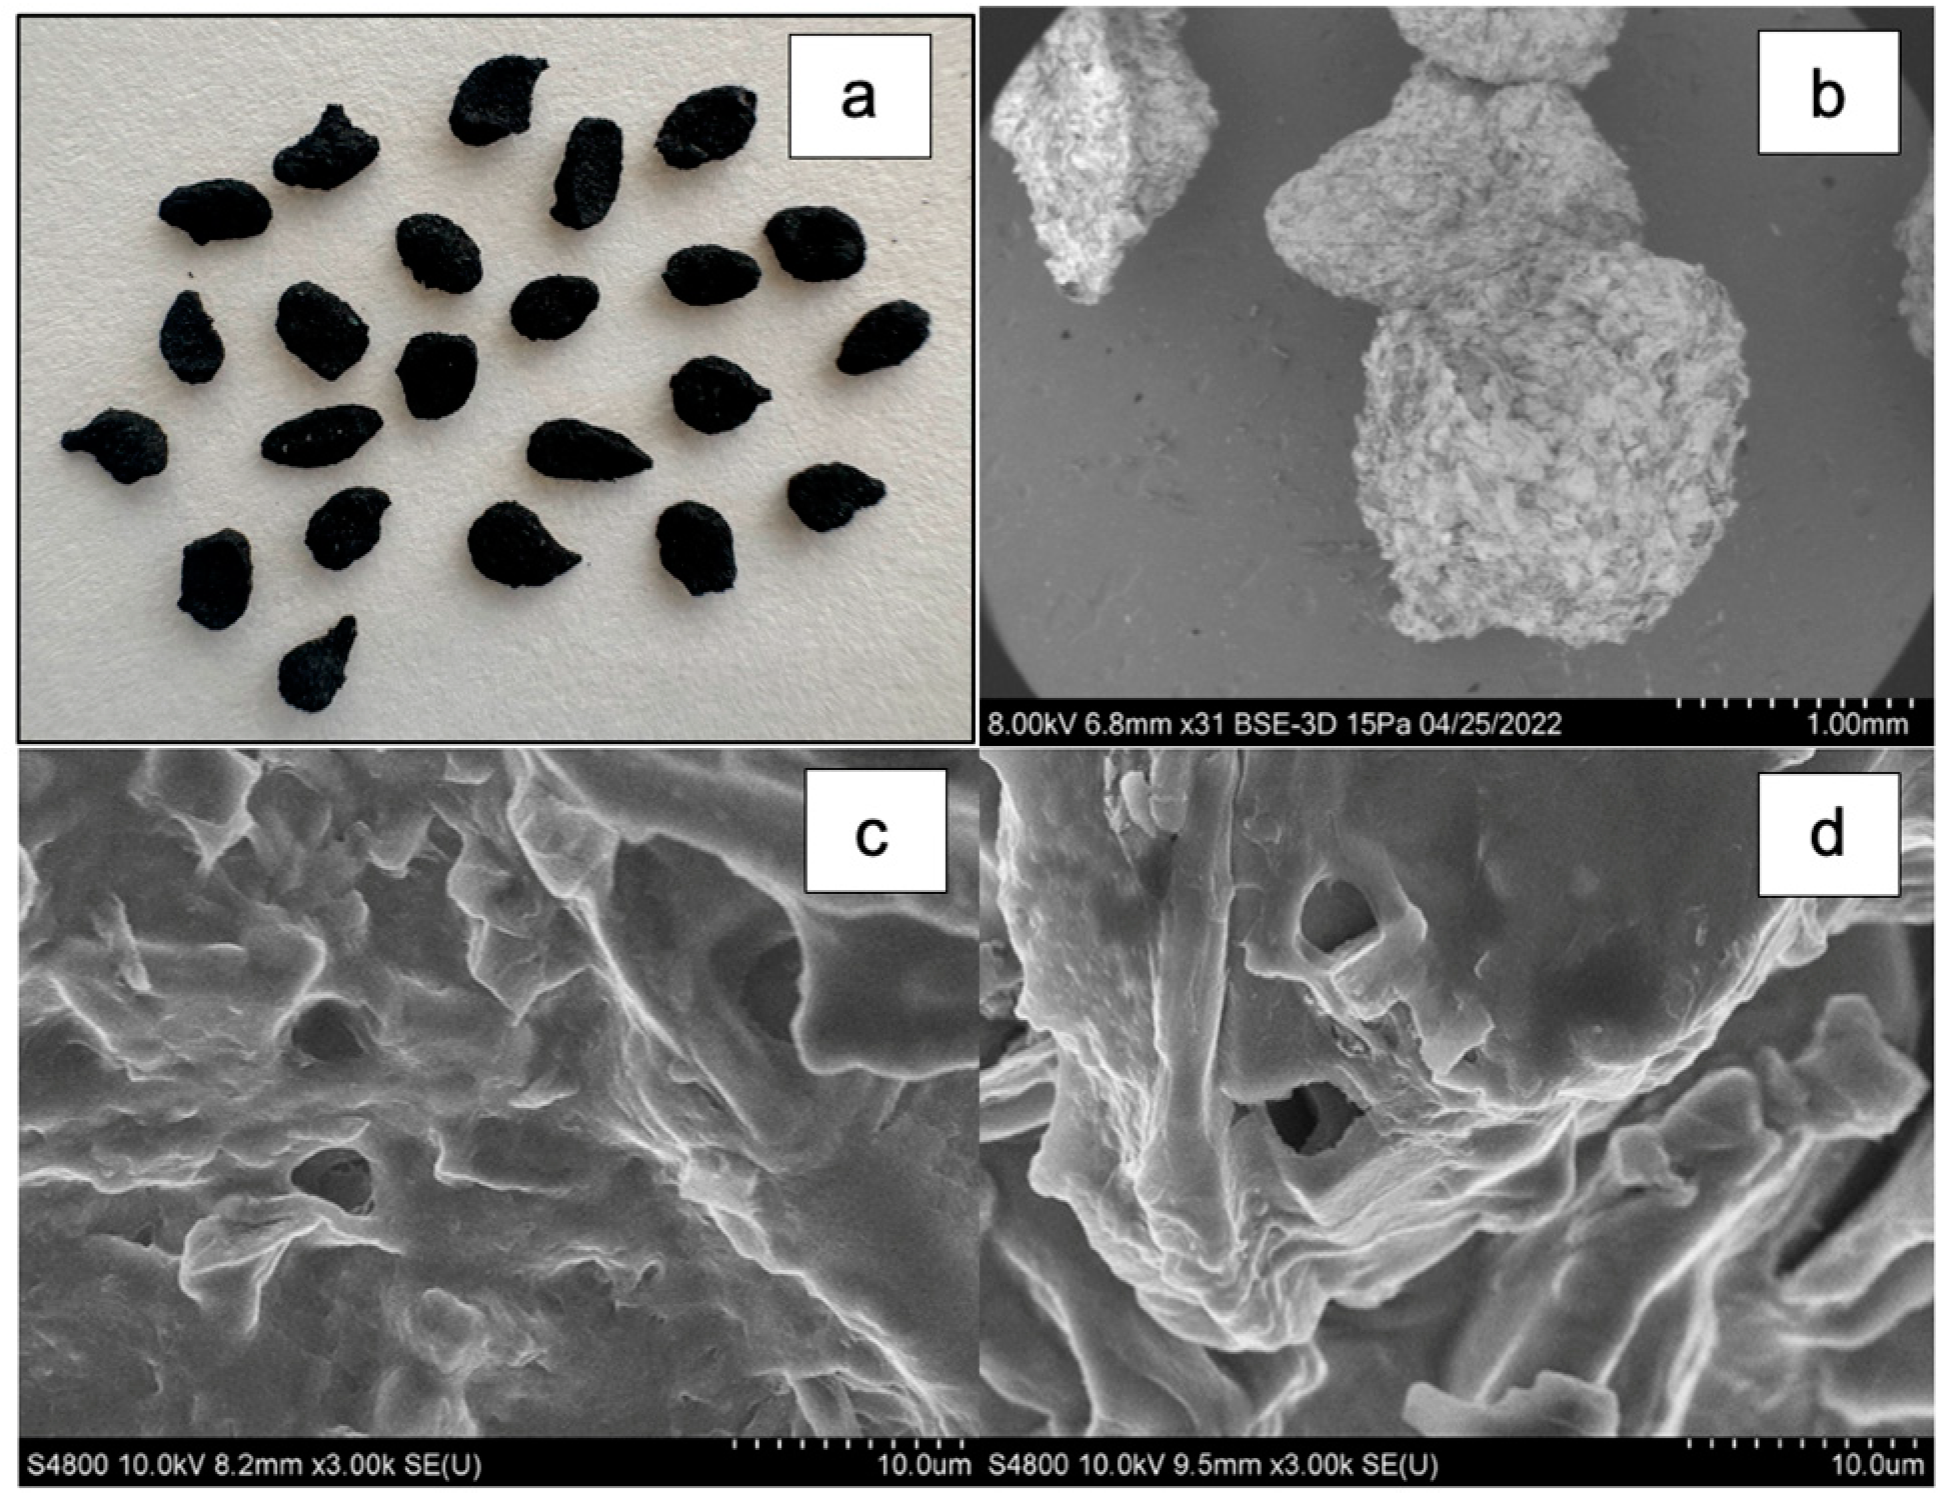
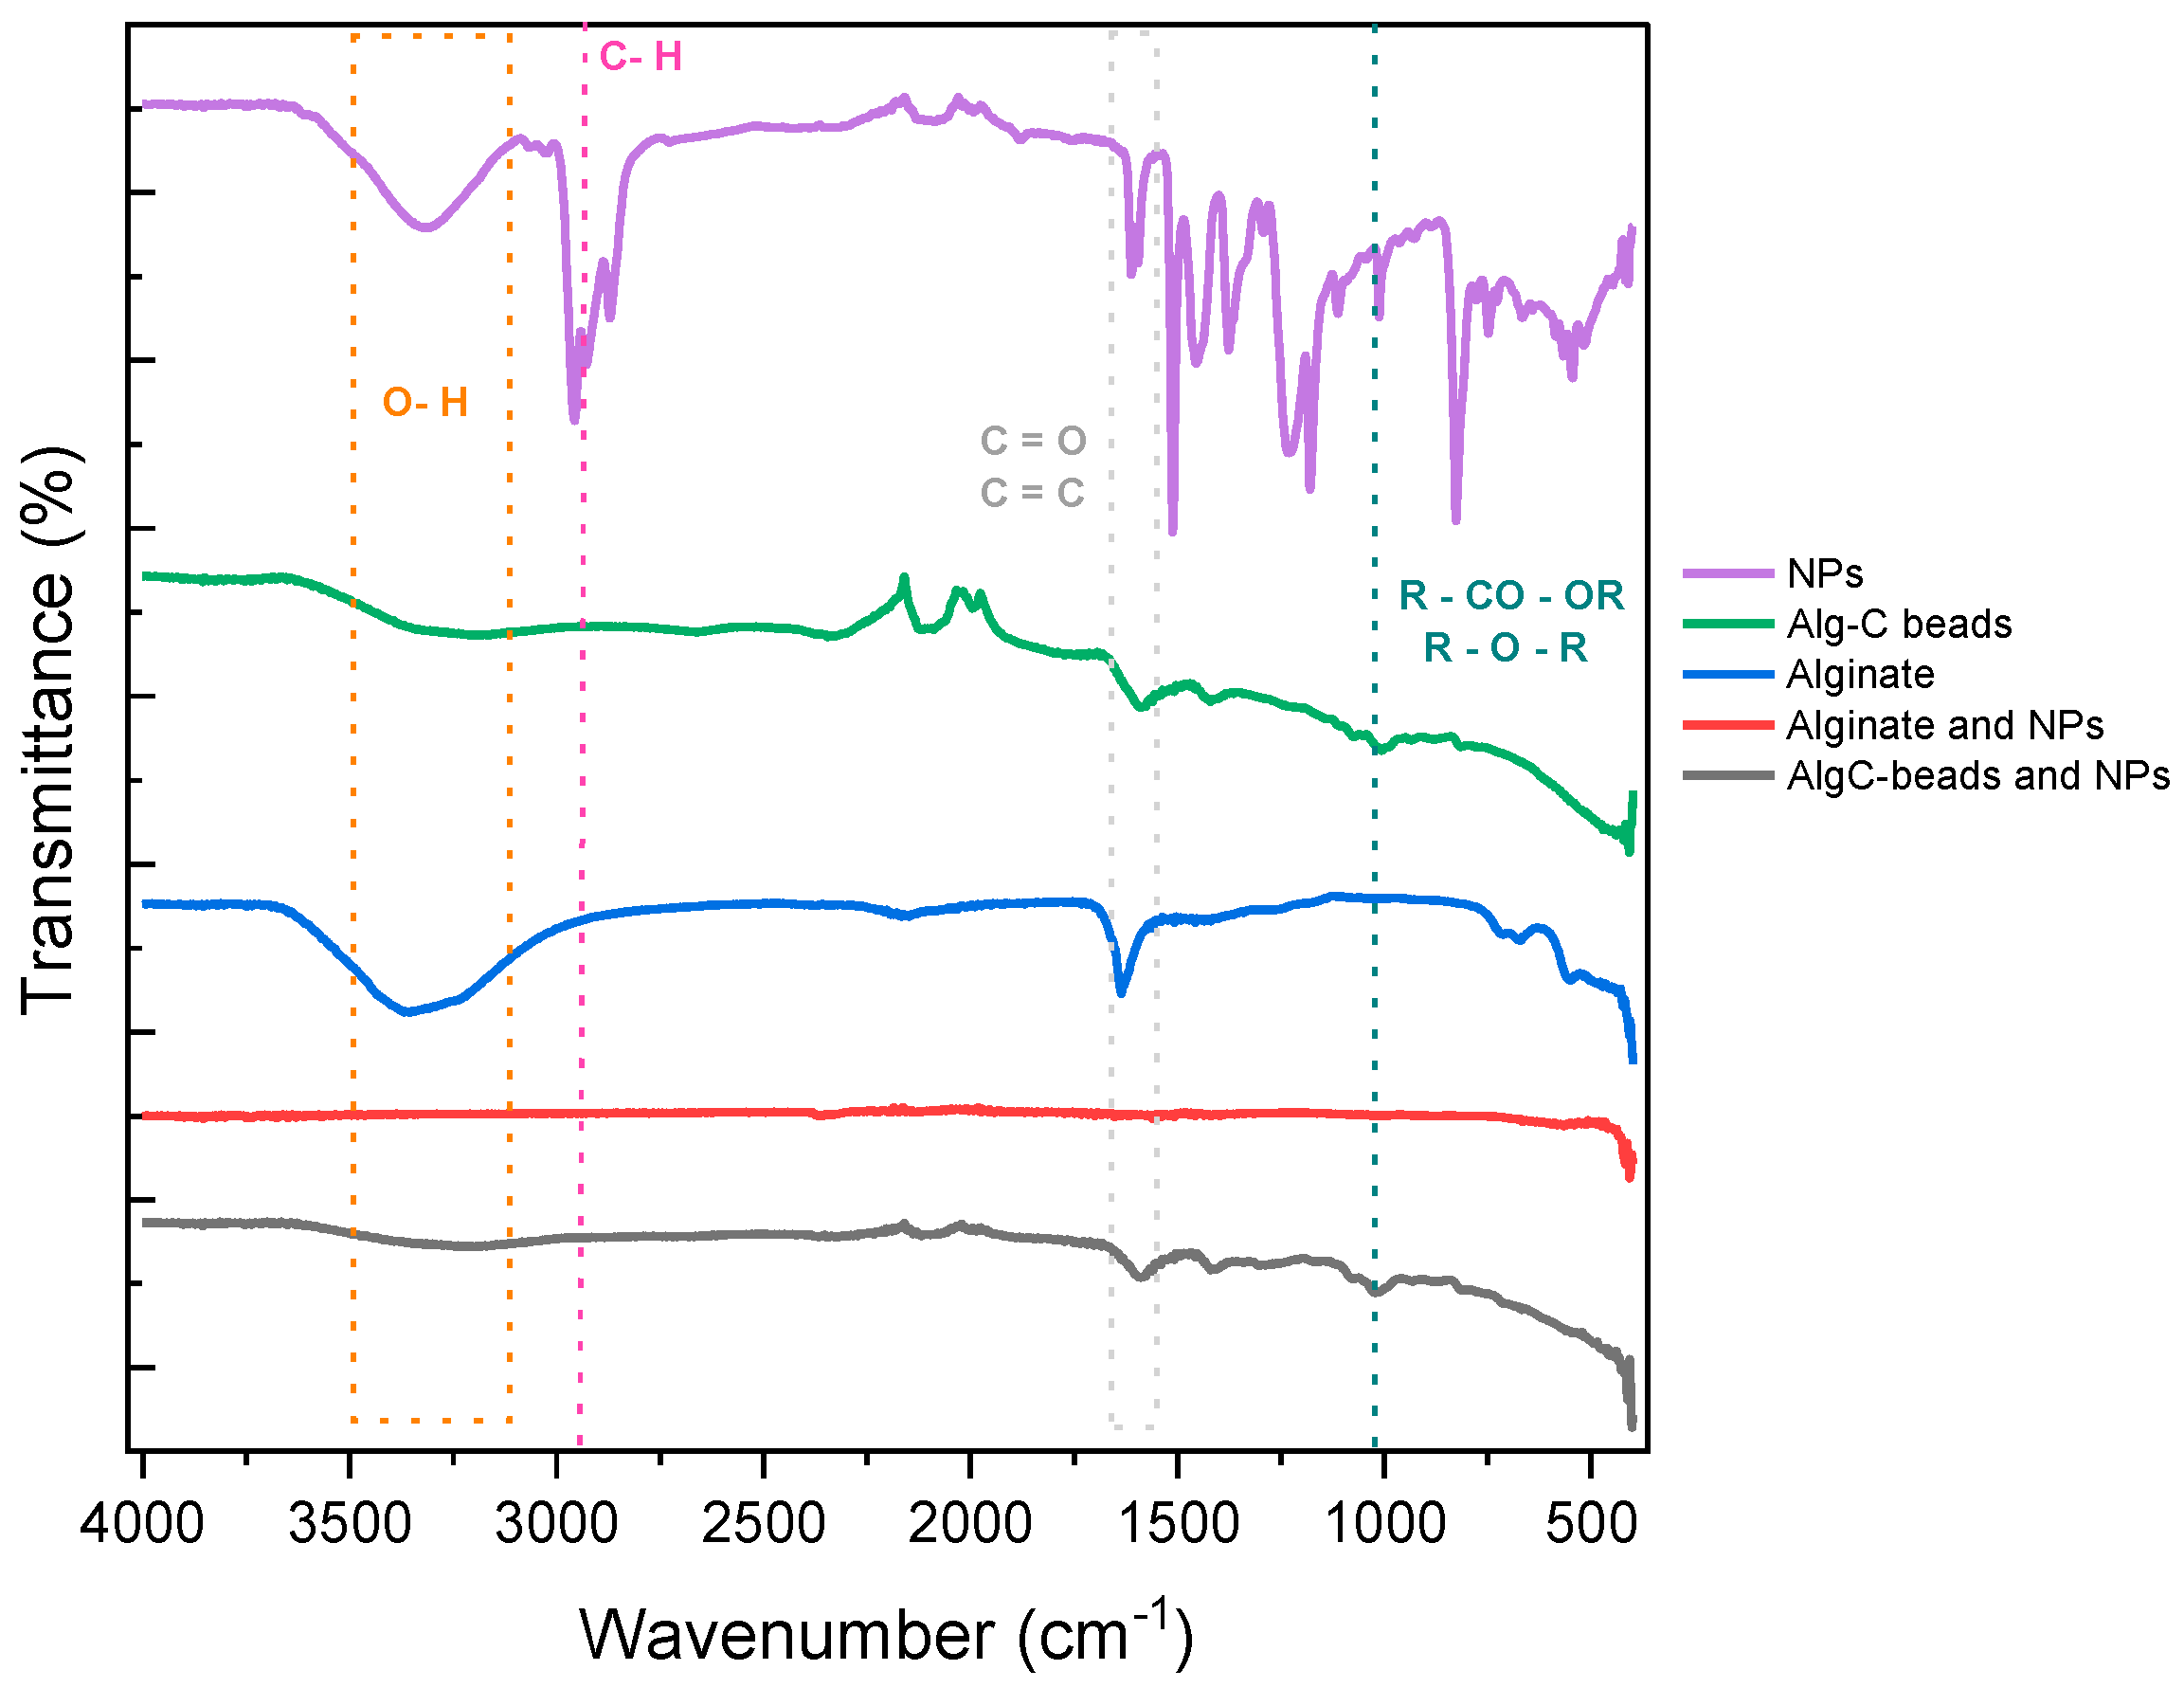
3.1. Characterization of Alg-C Beads
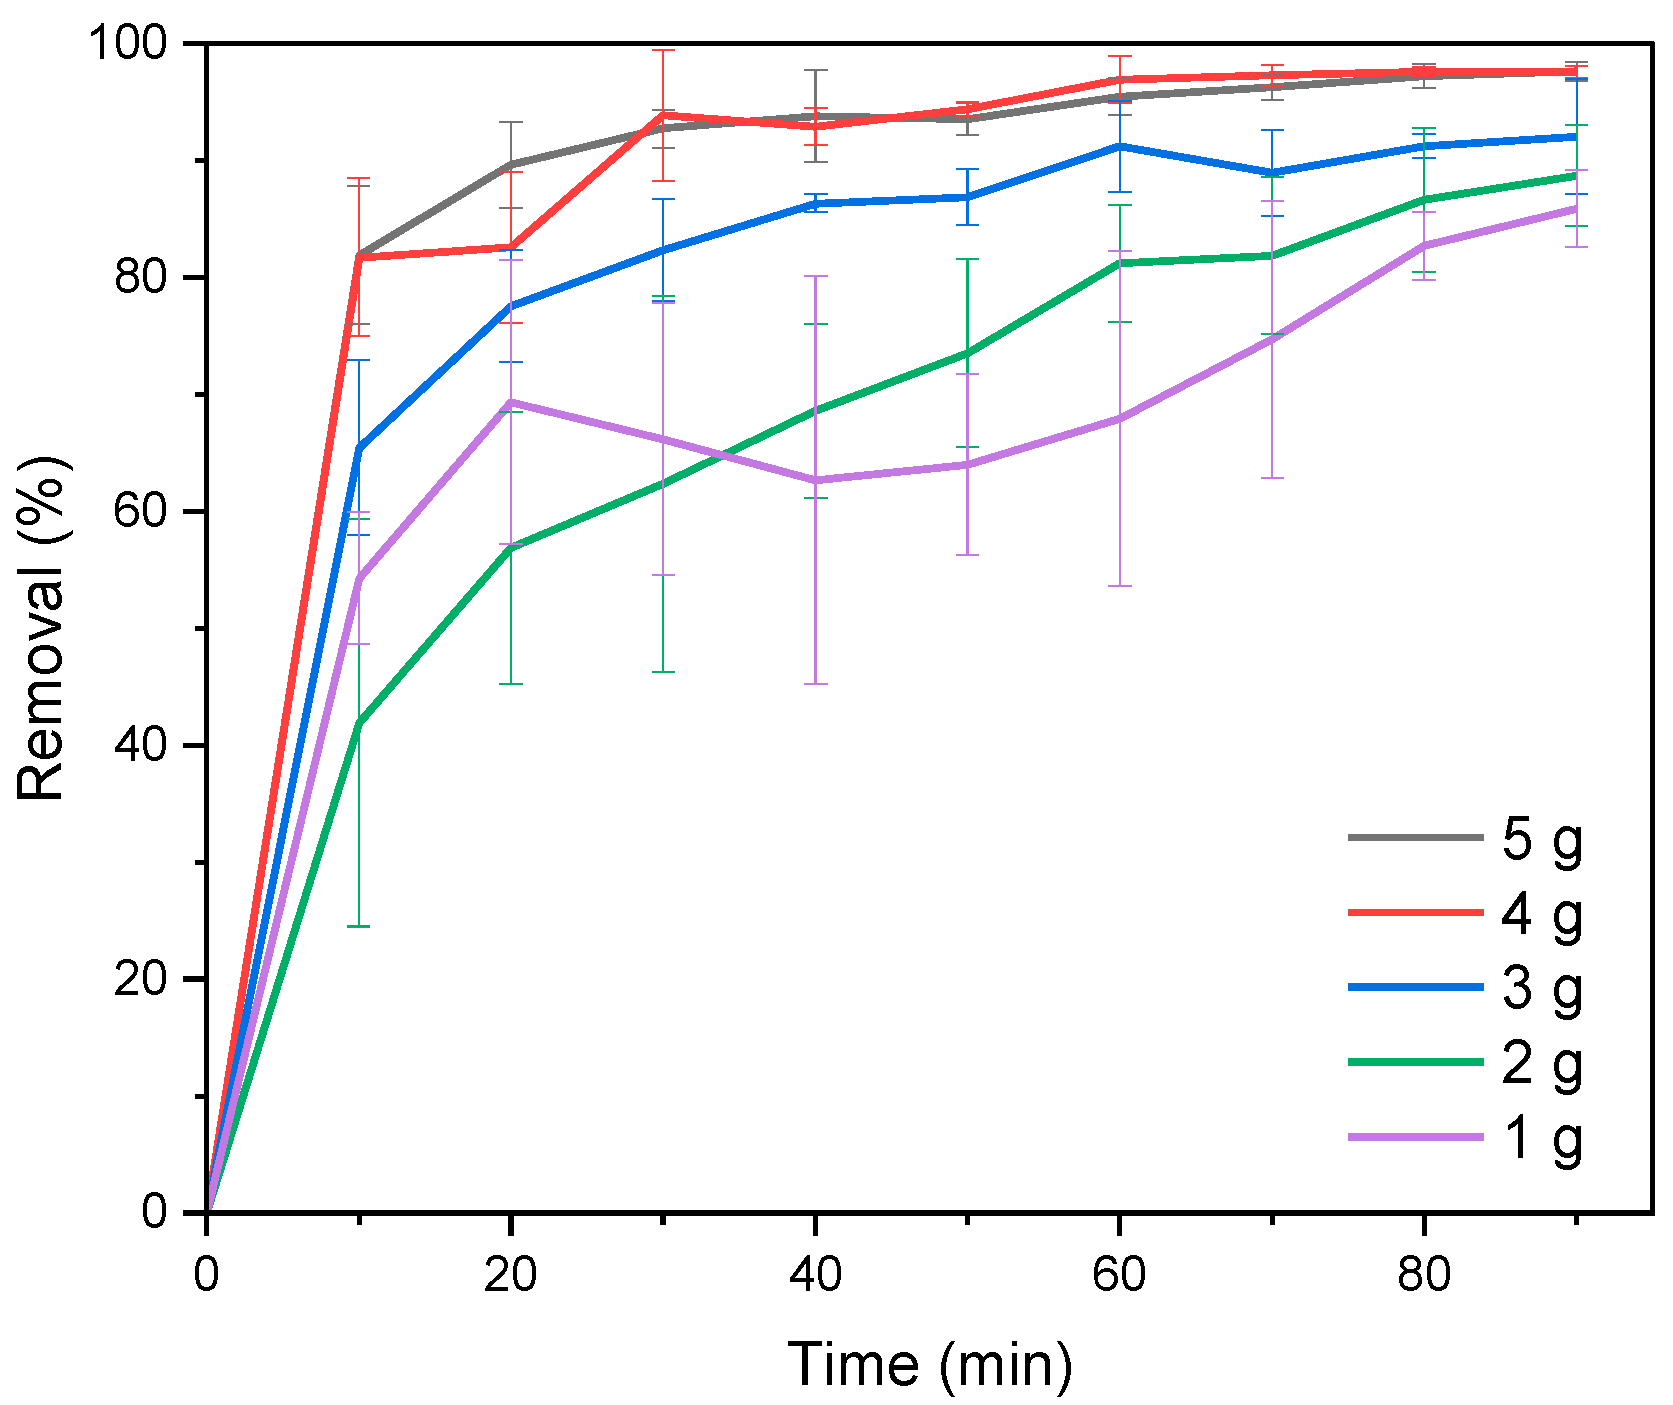
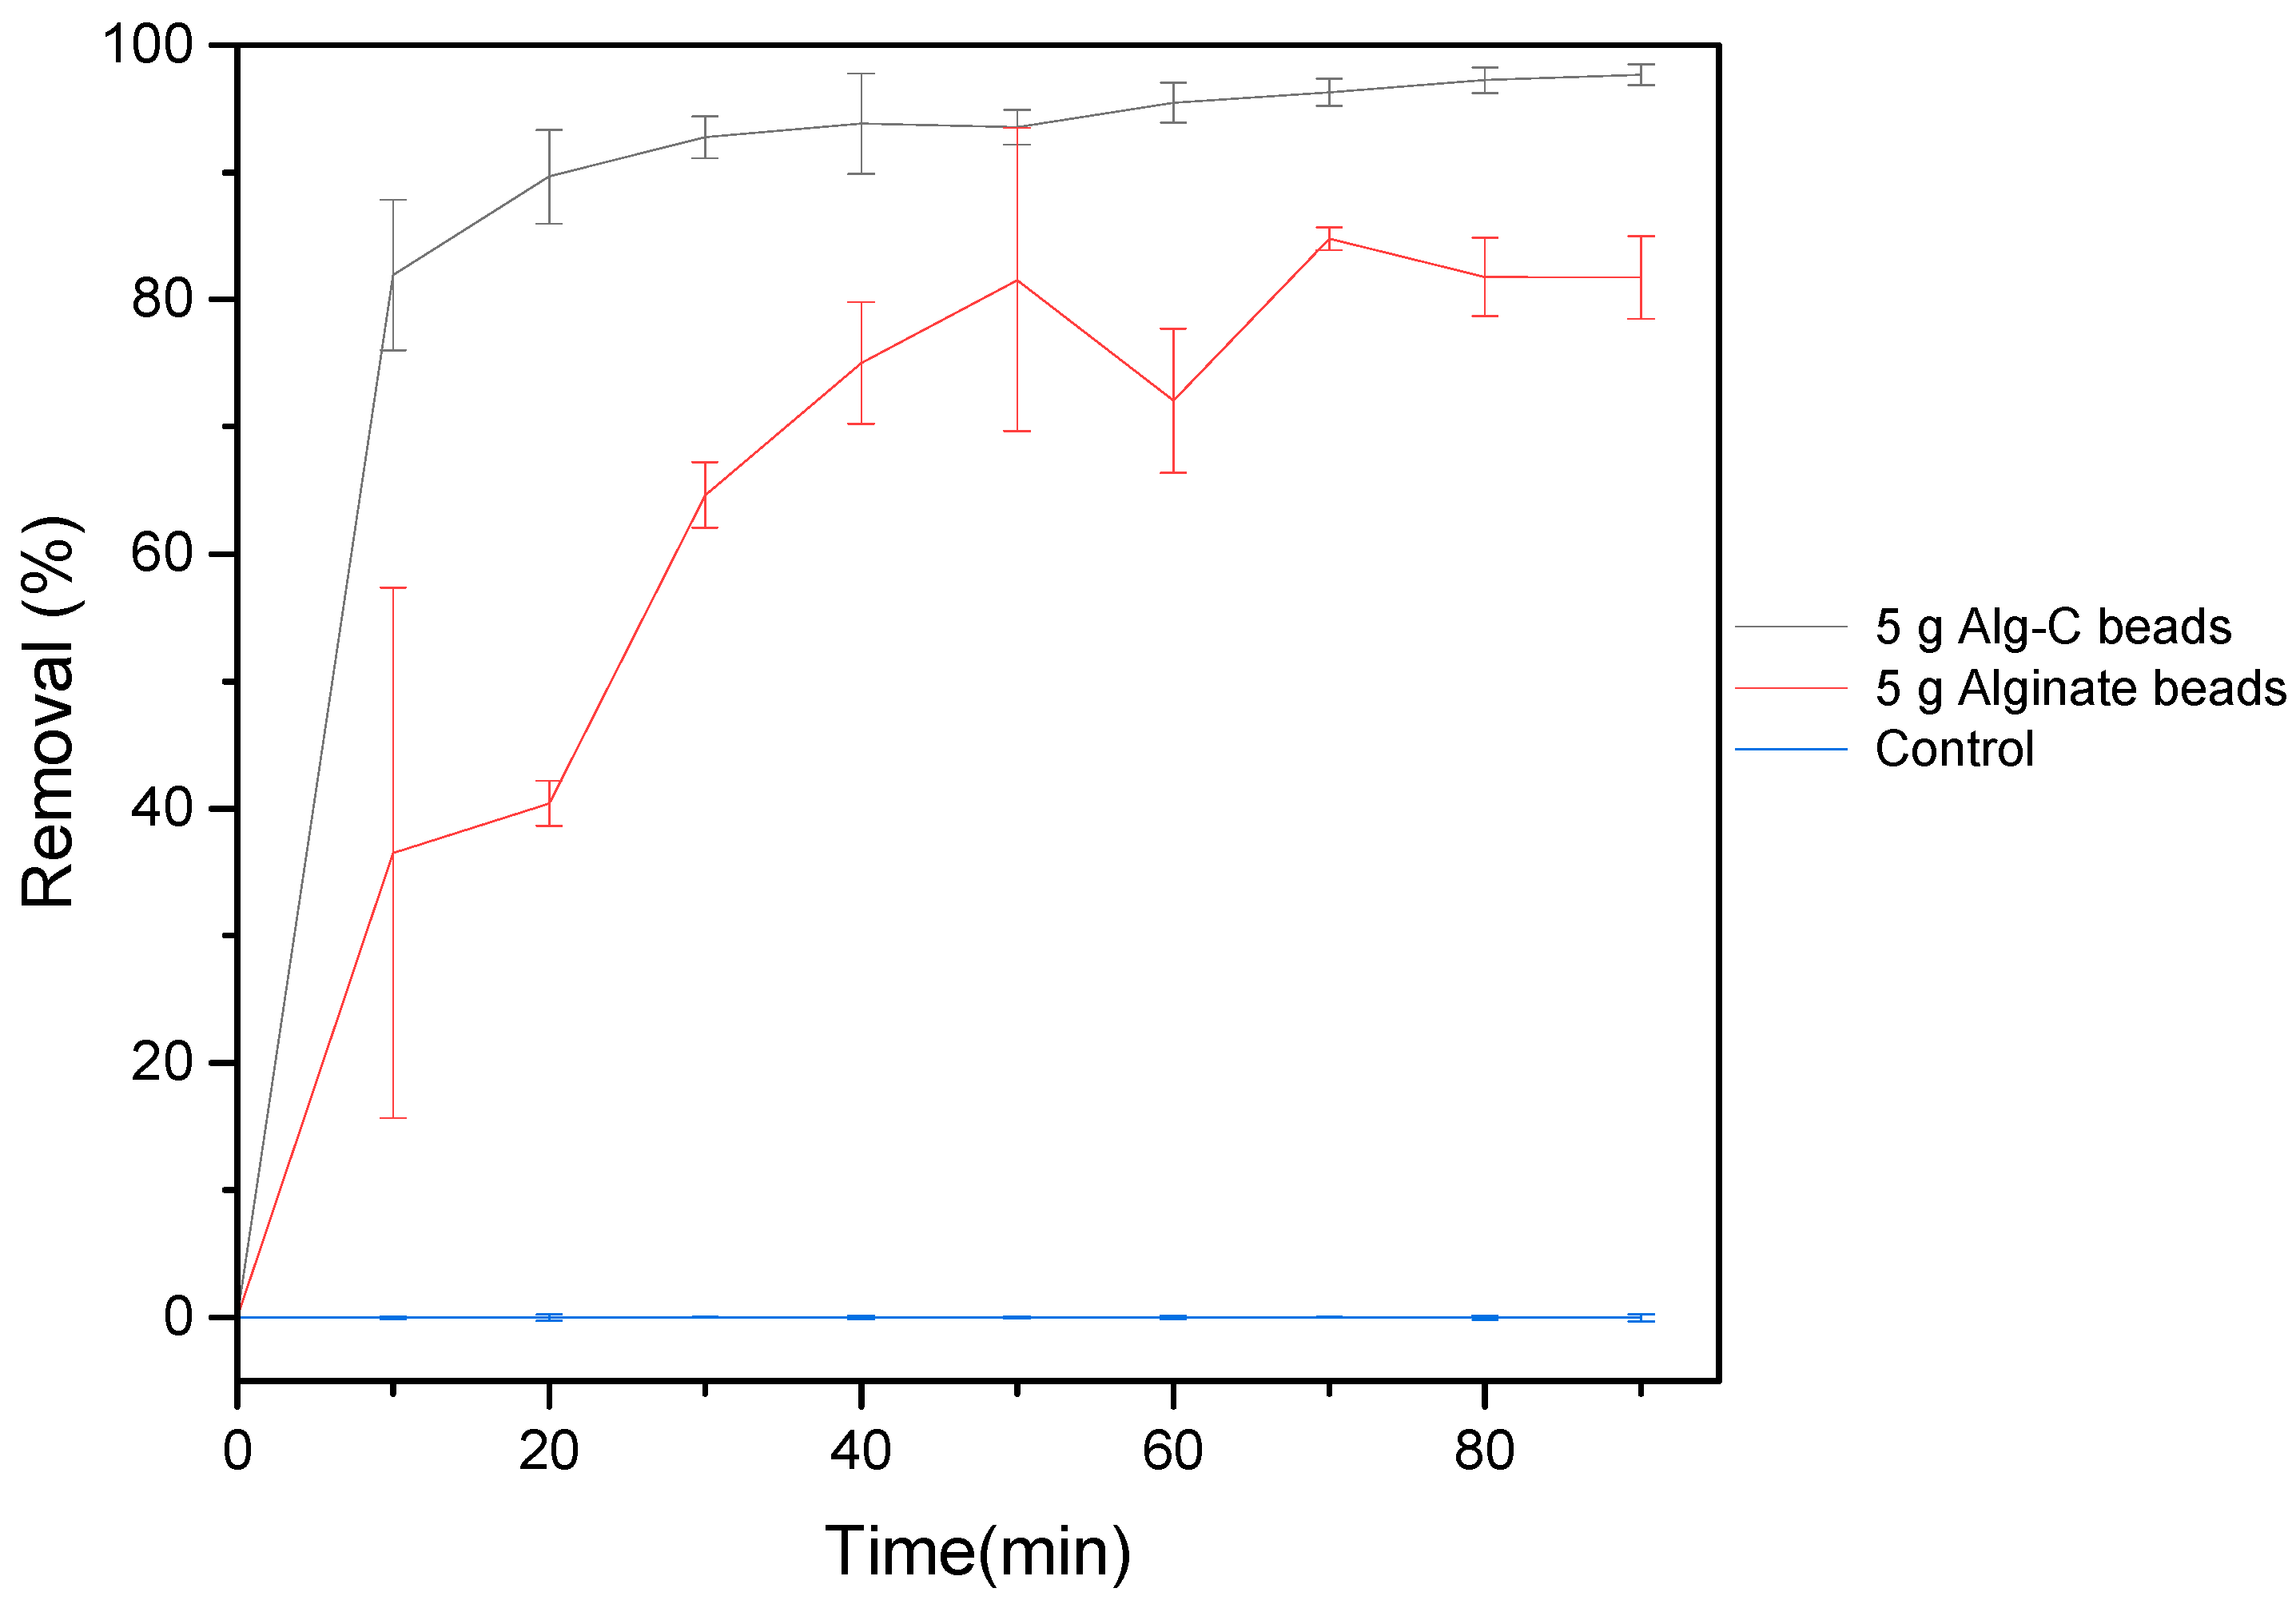
3.2. Dosage Experiments
3.3. Adsorption Capacity, Kinetics, Adsorption Isotherms, and Thermodynamics
3.3.1. Adsorption Capacity
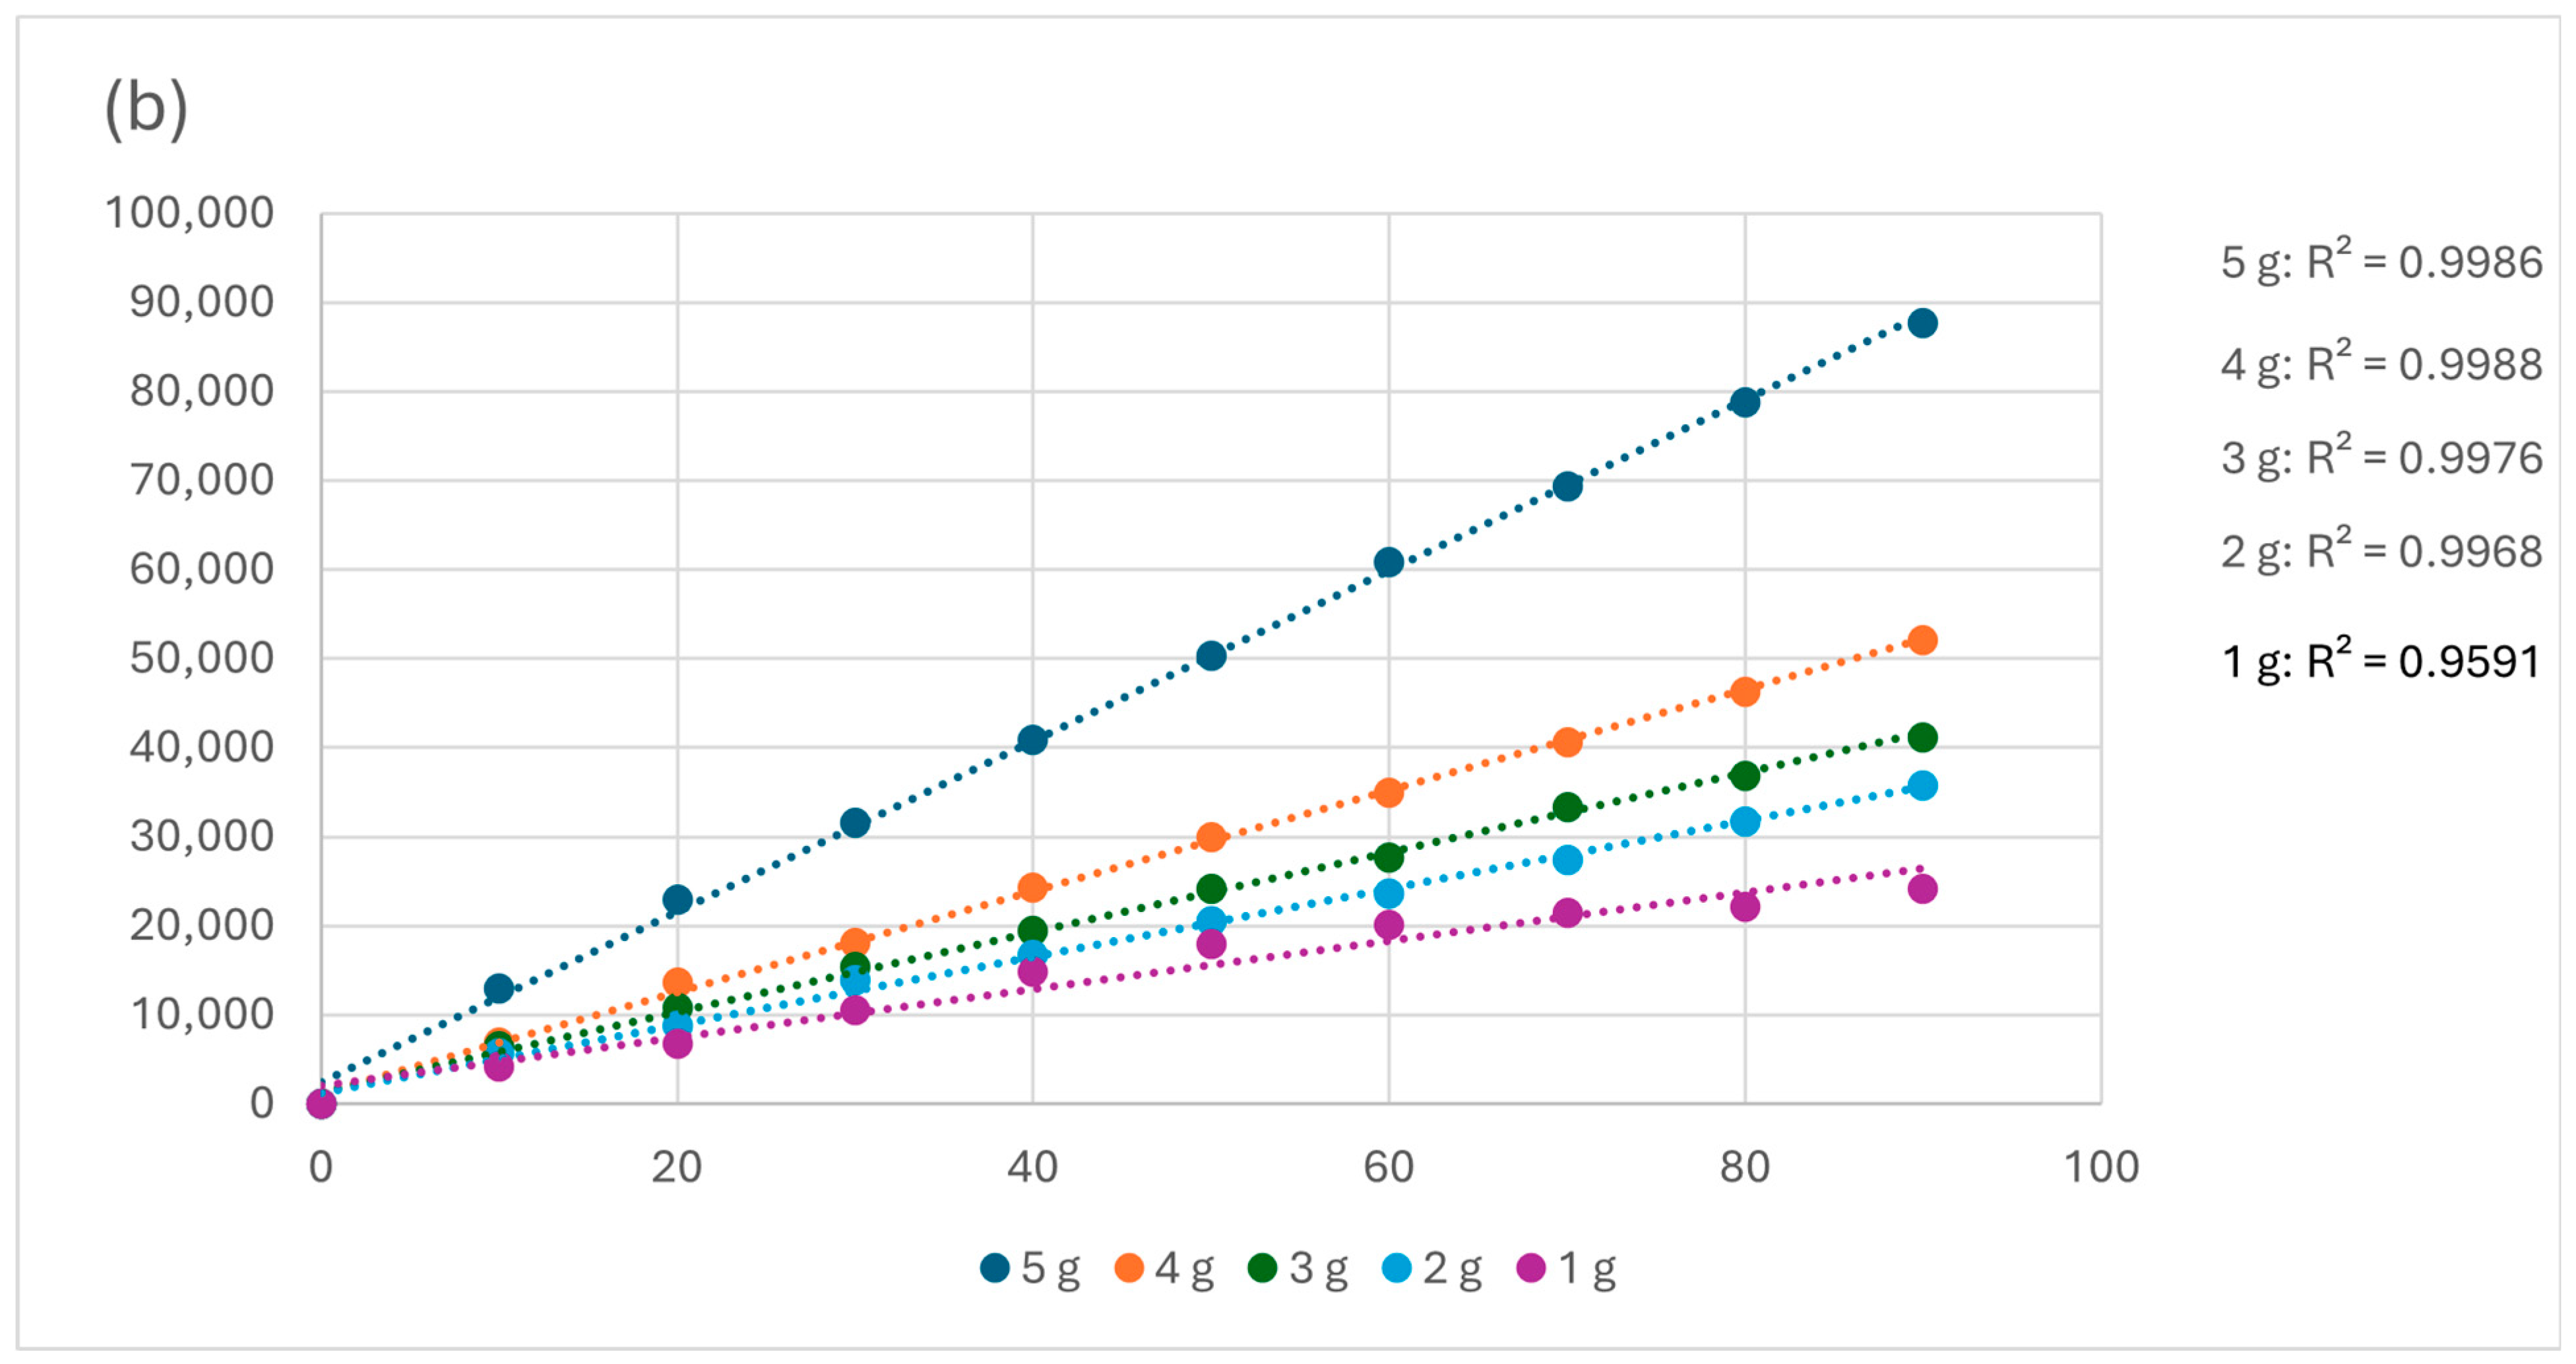
3.3.2. Kinetics
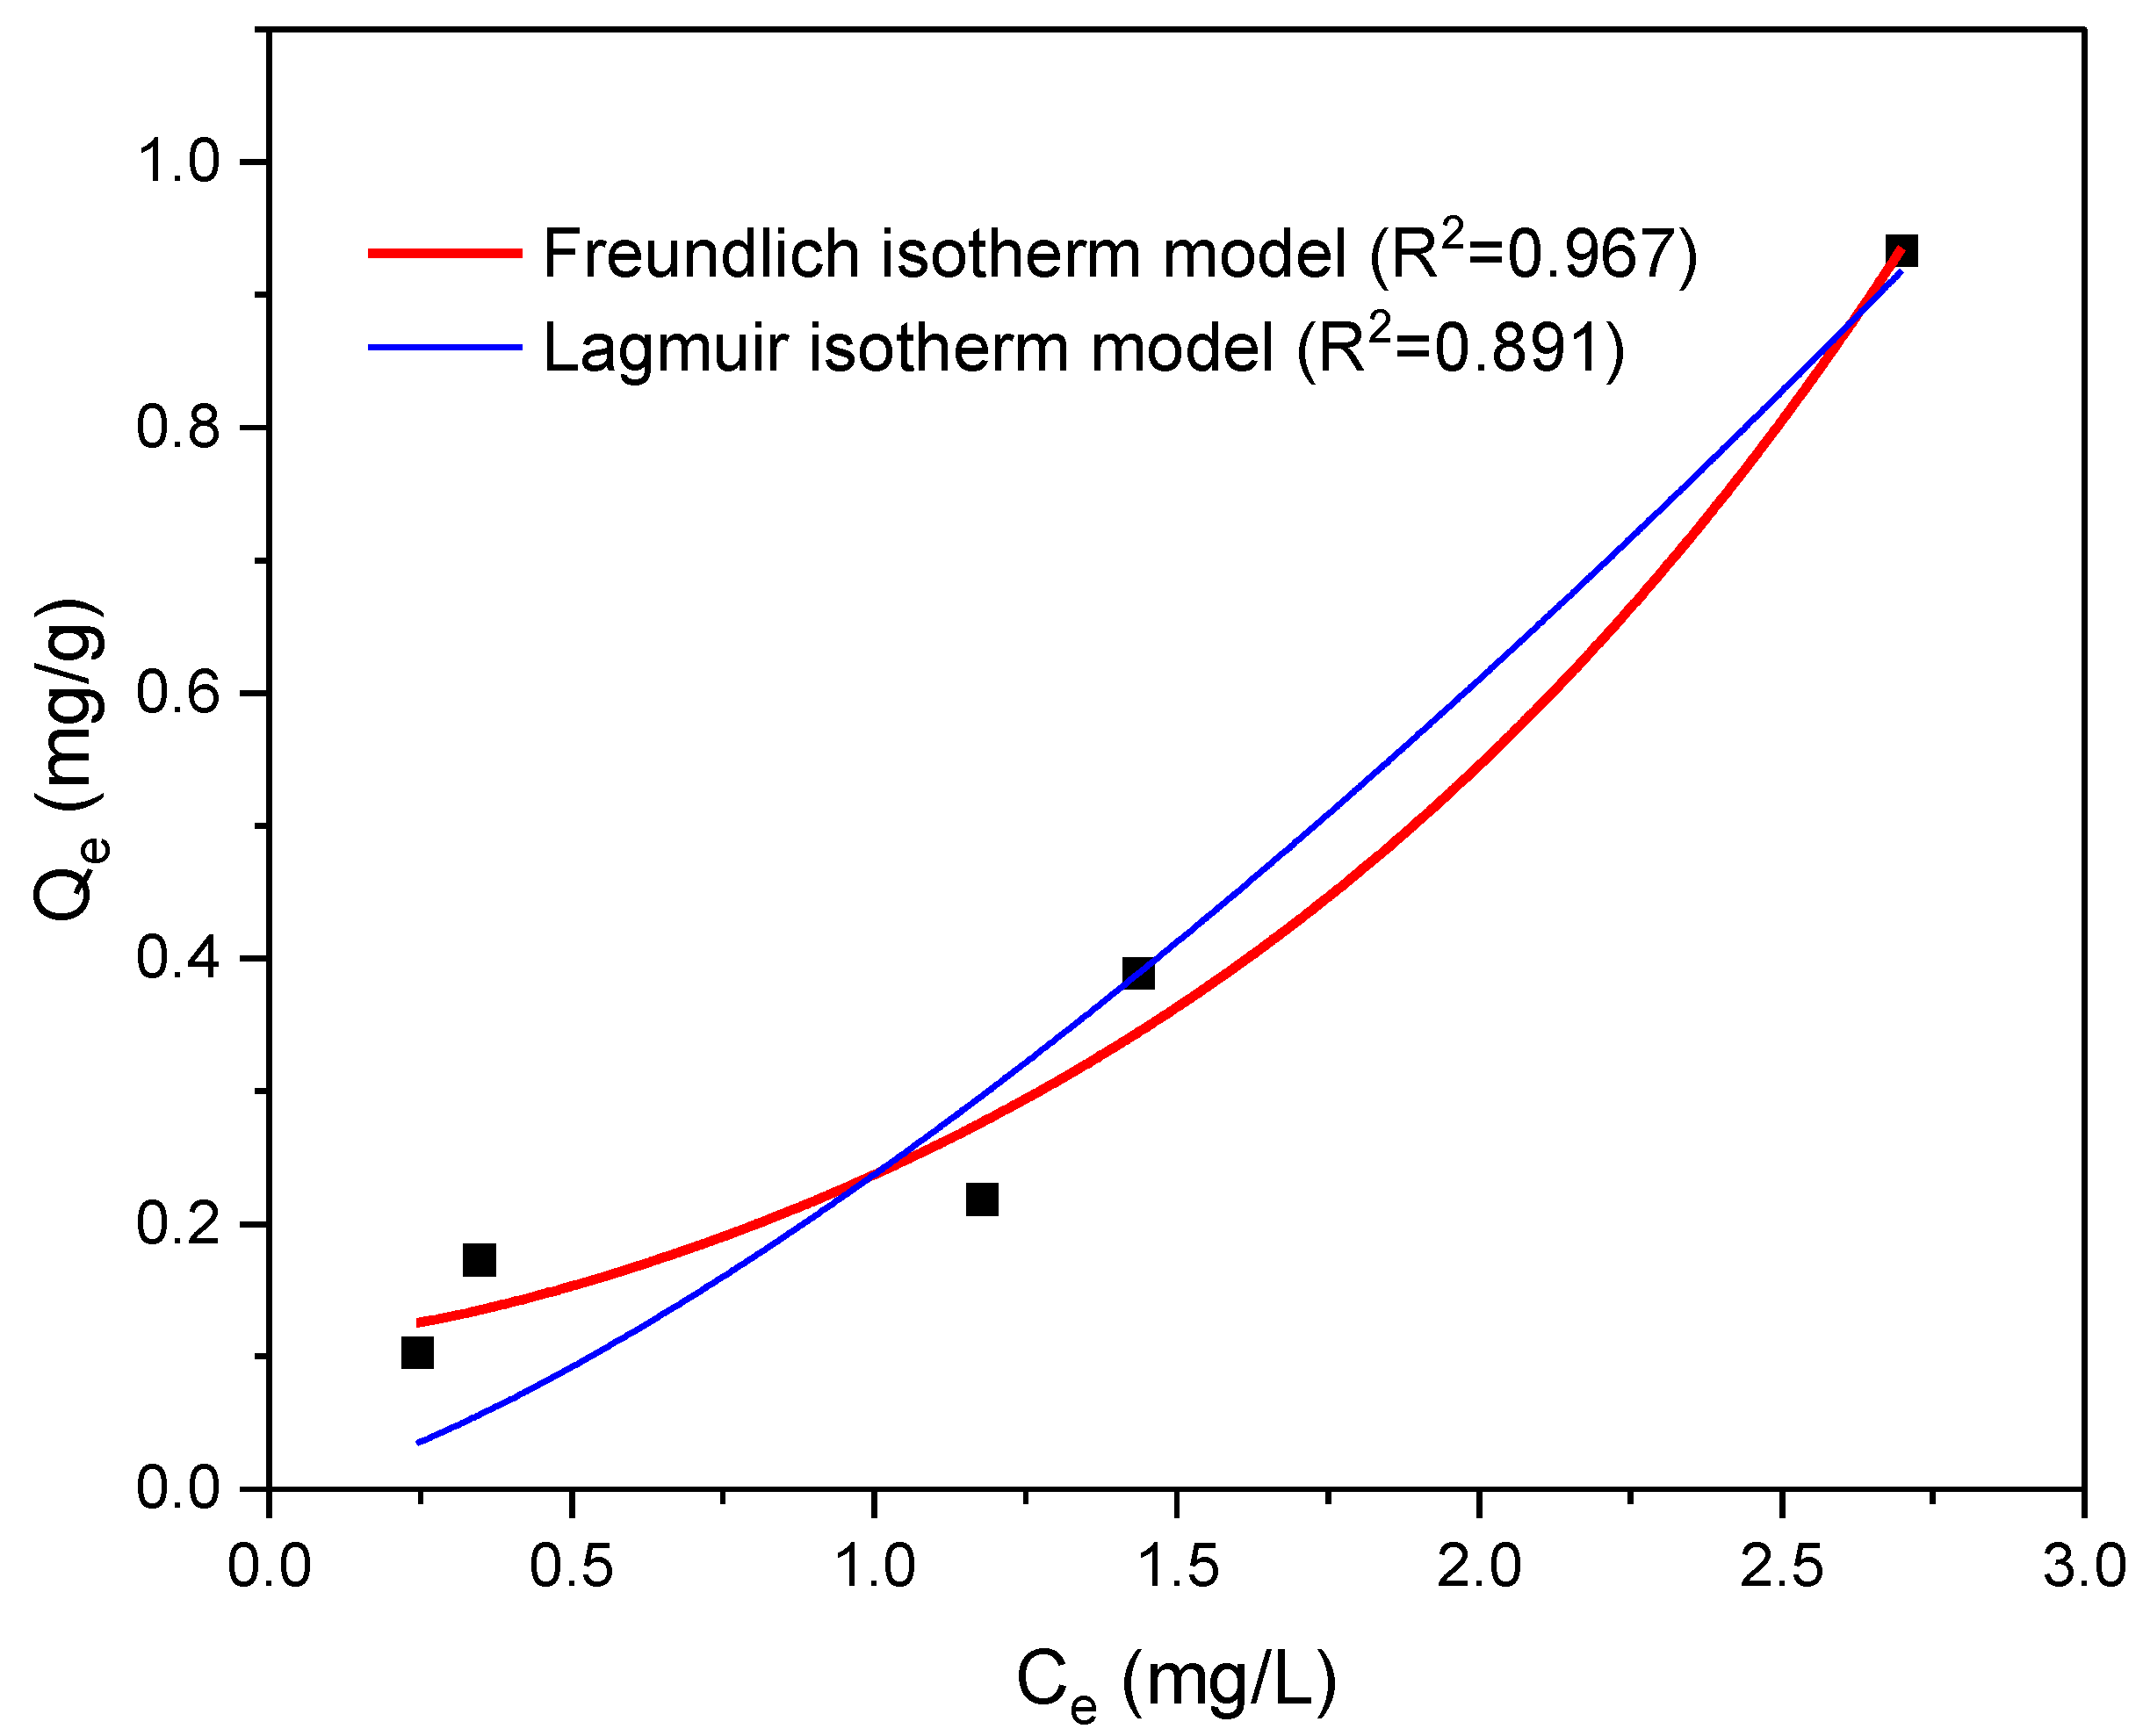
3.3.3. Isotherm Models Study of NPs Adsorption
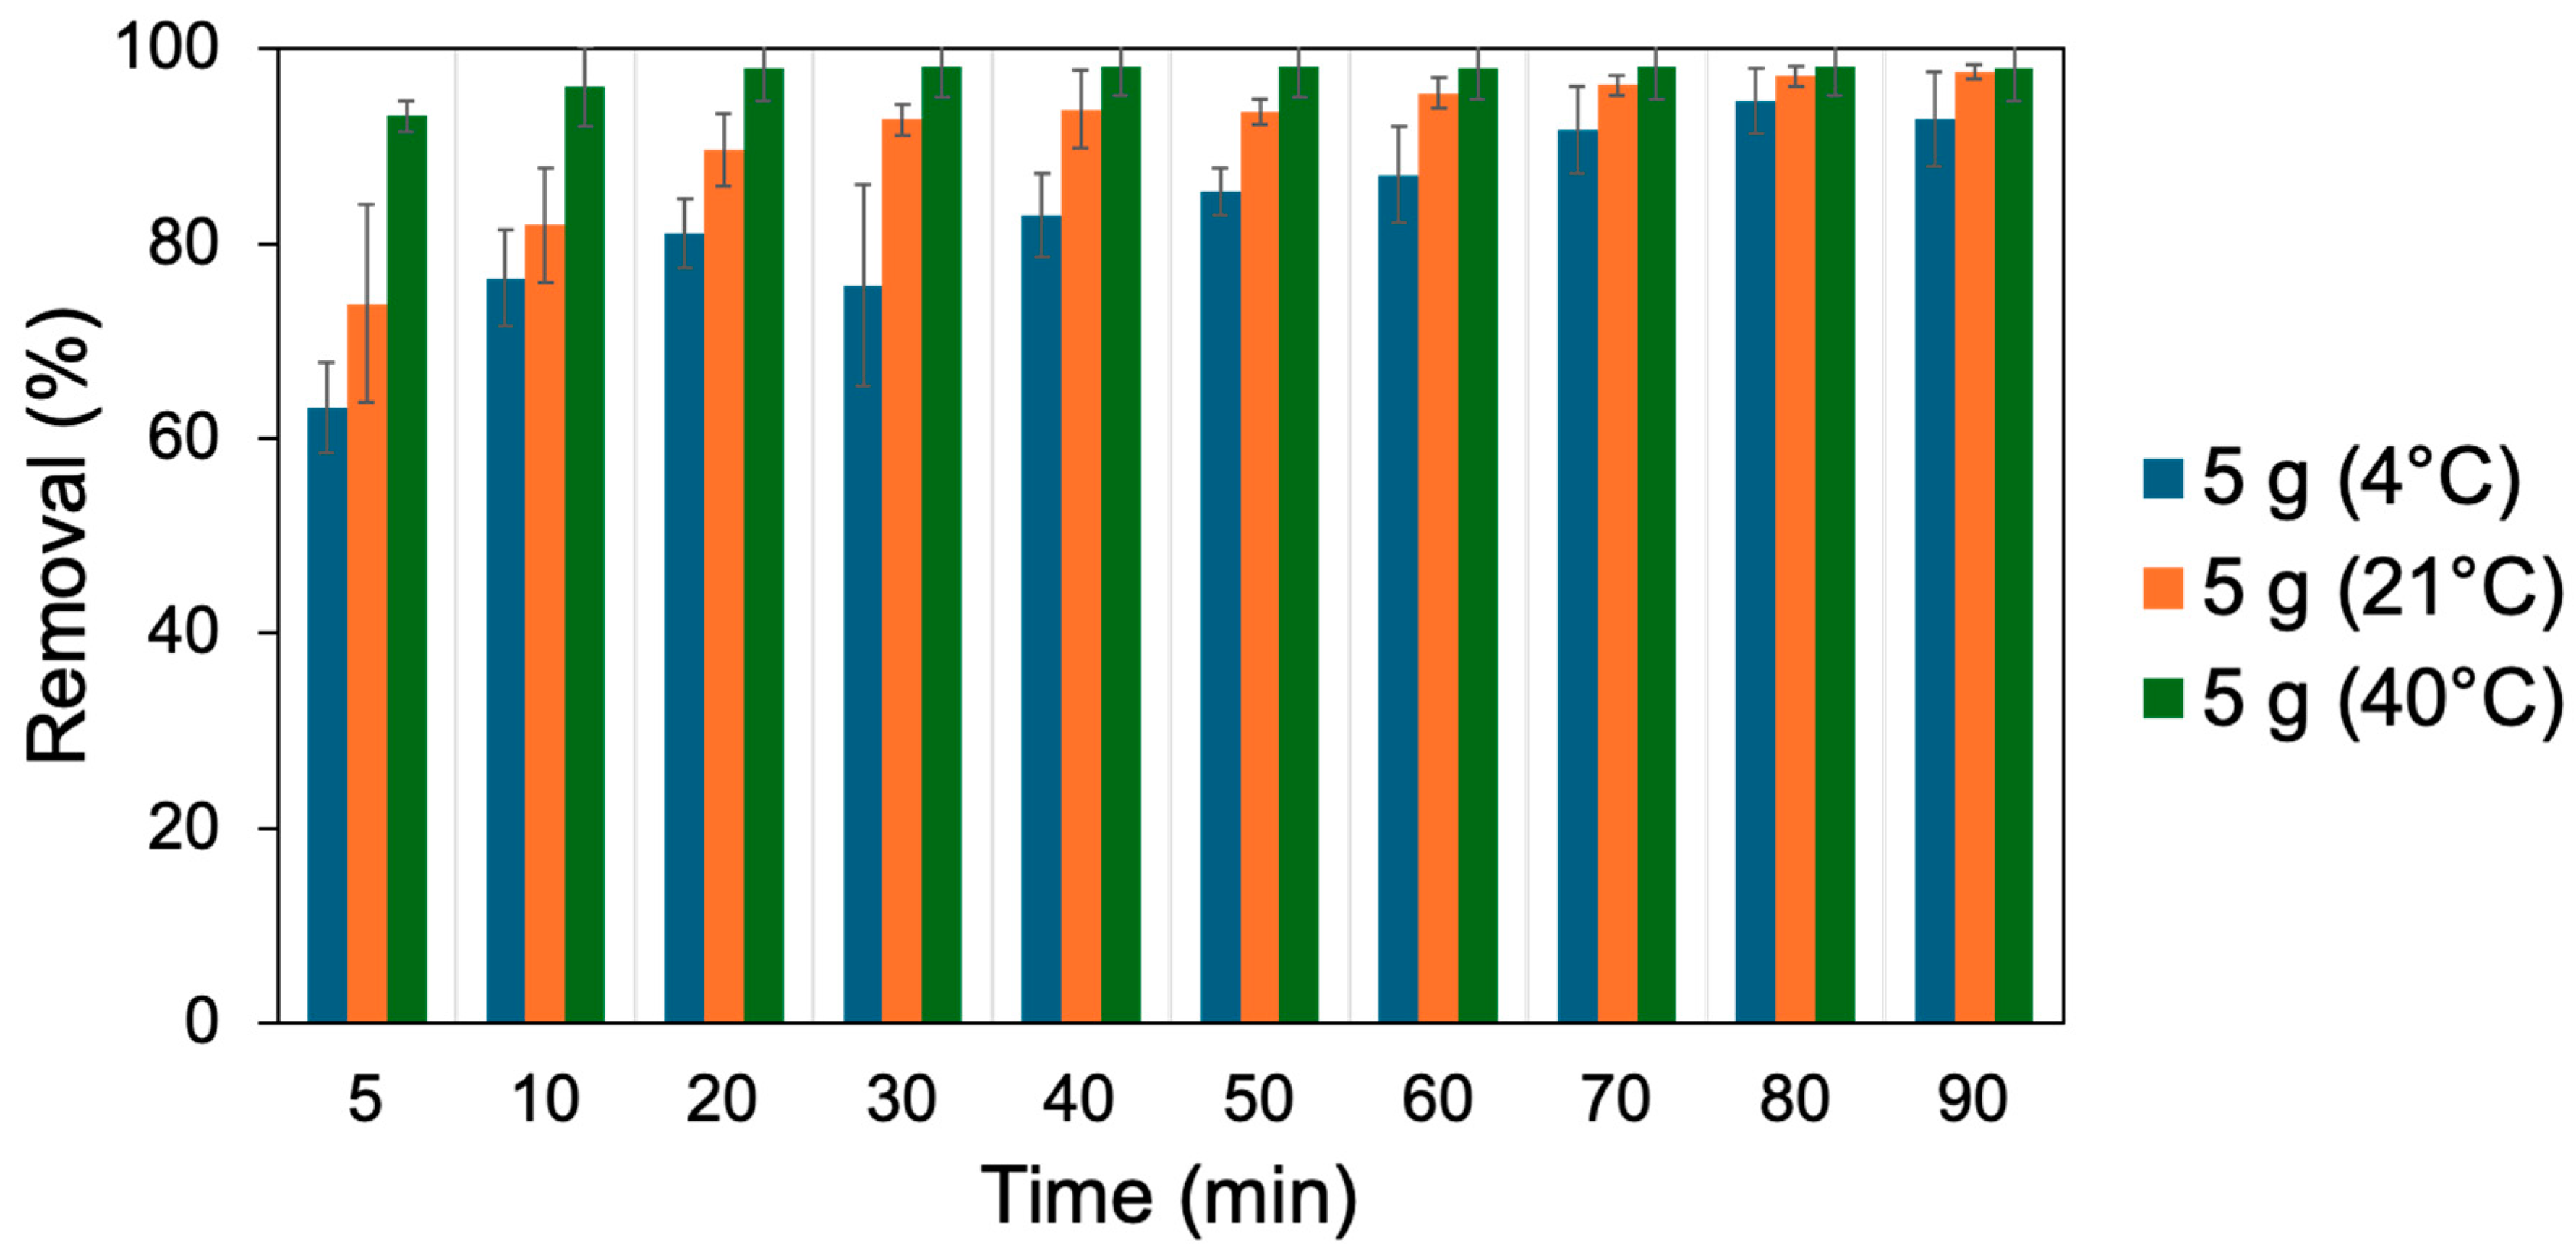
3.3.4. Thermodynamics
3.4. pH
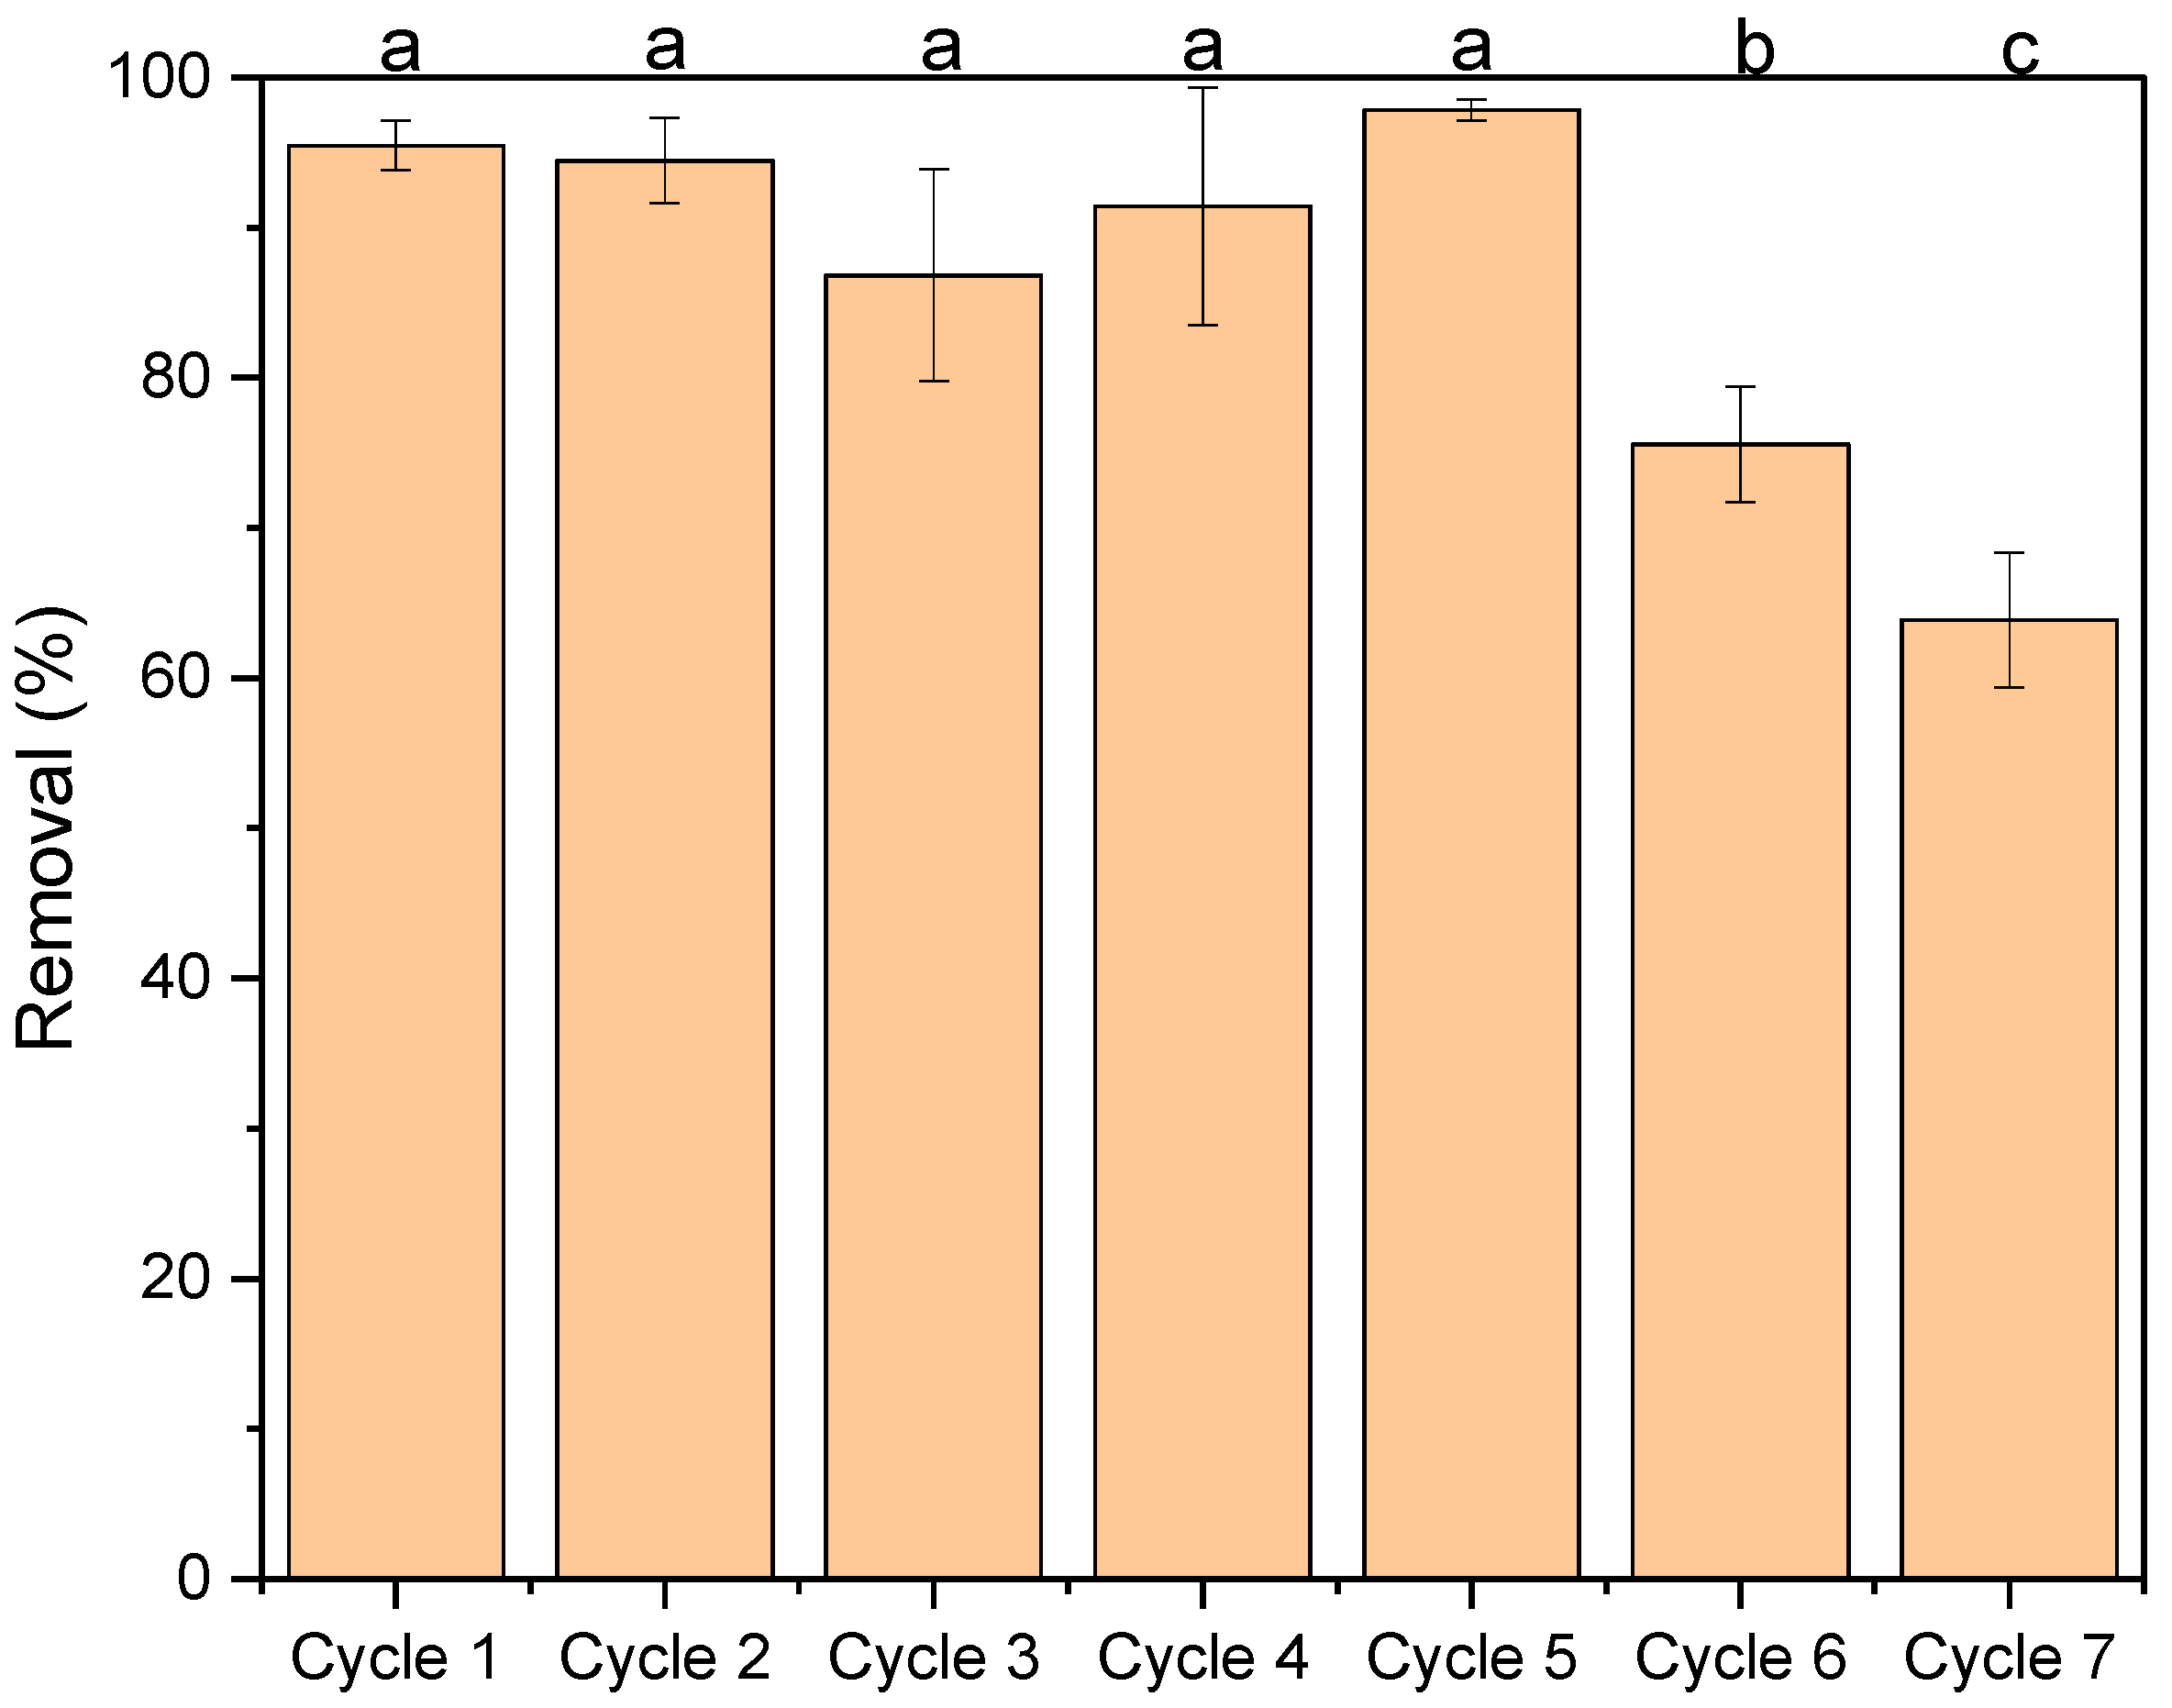
3.5. Reusability
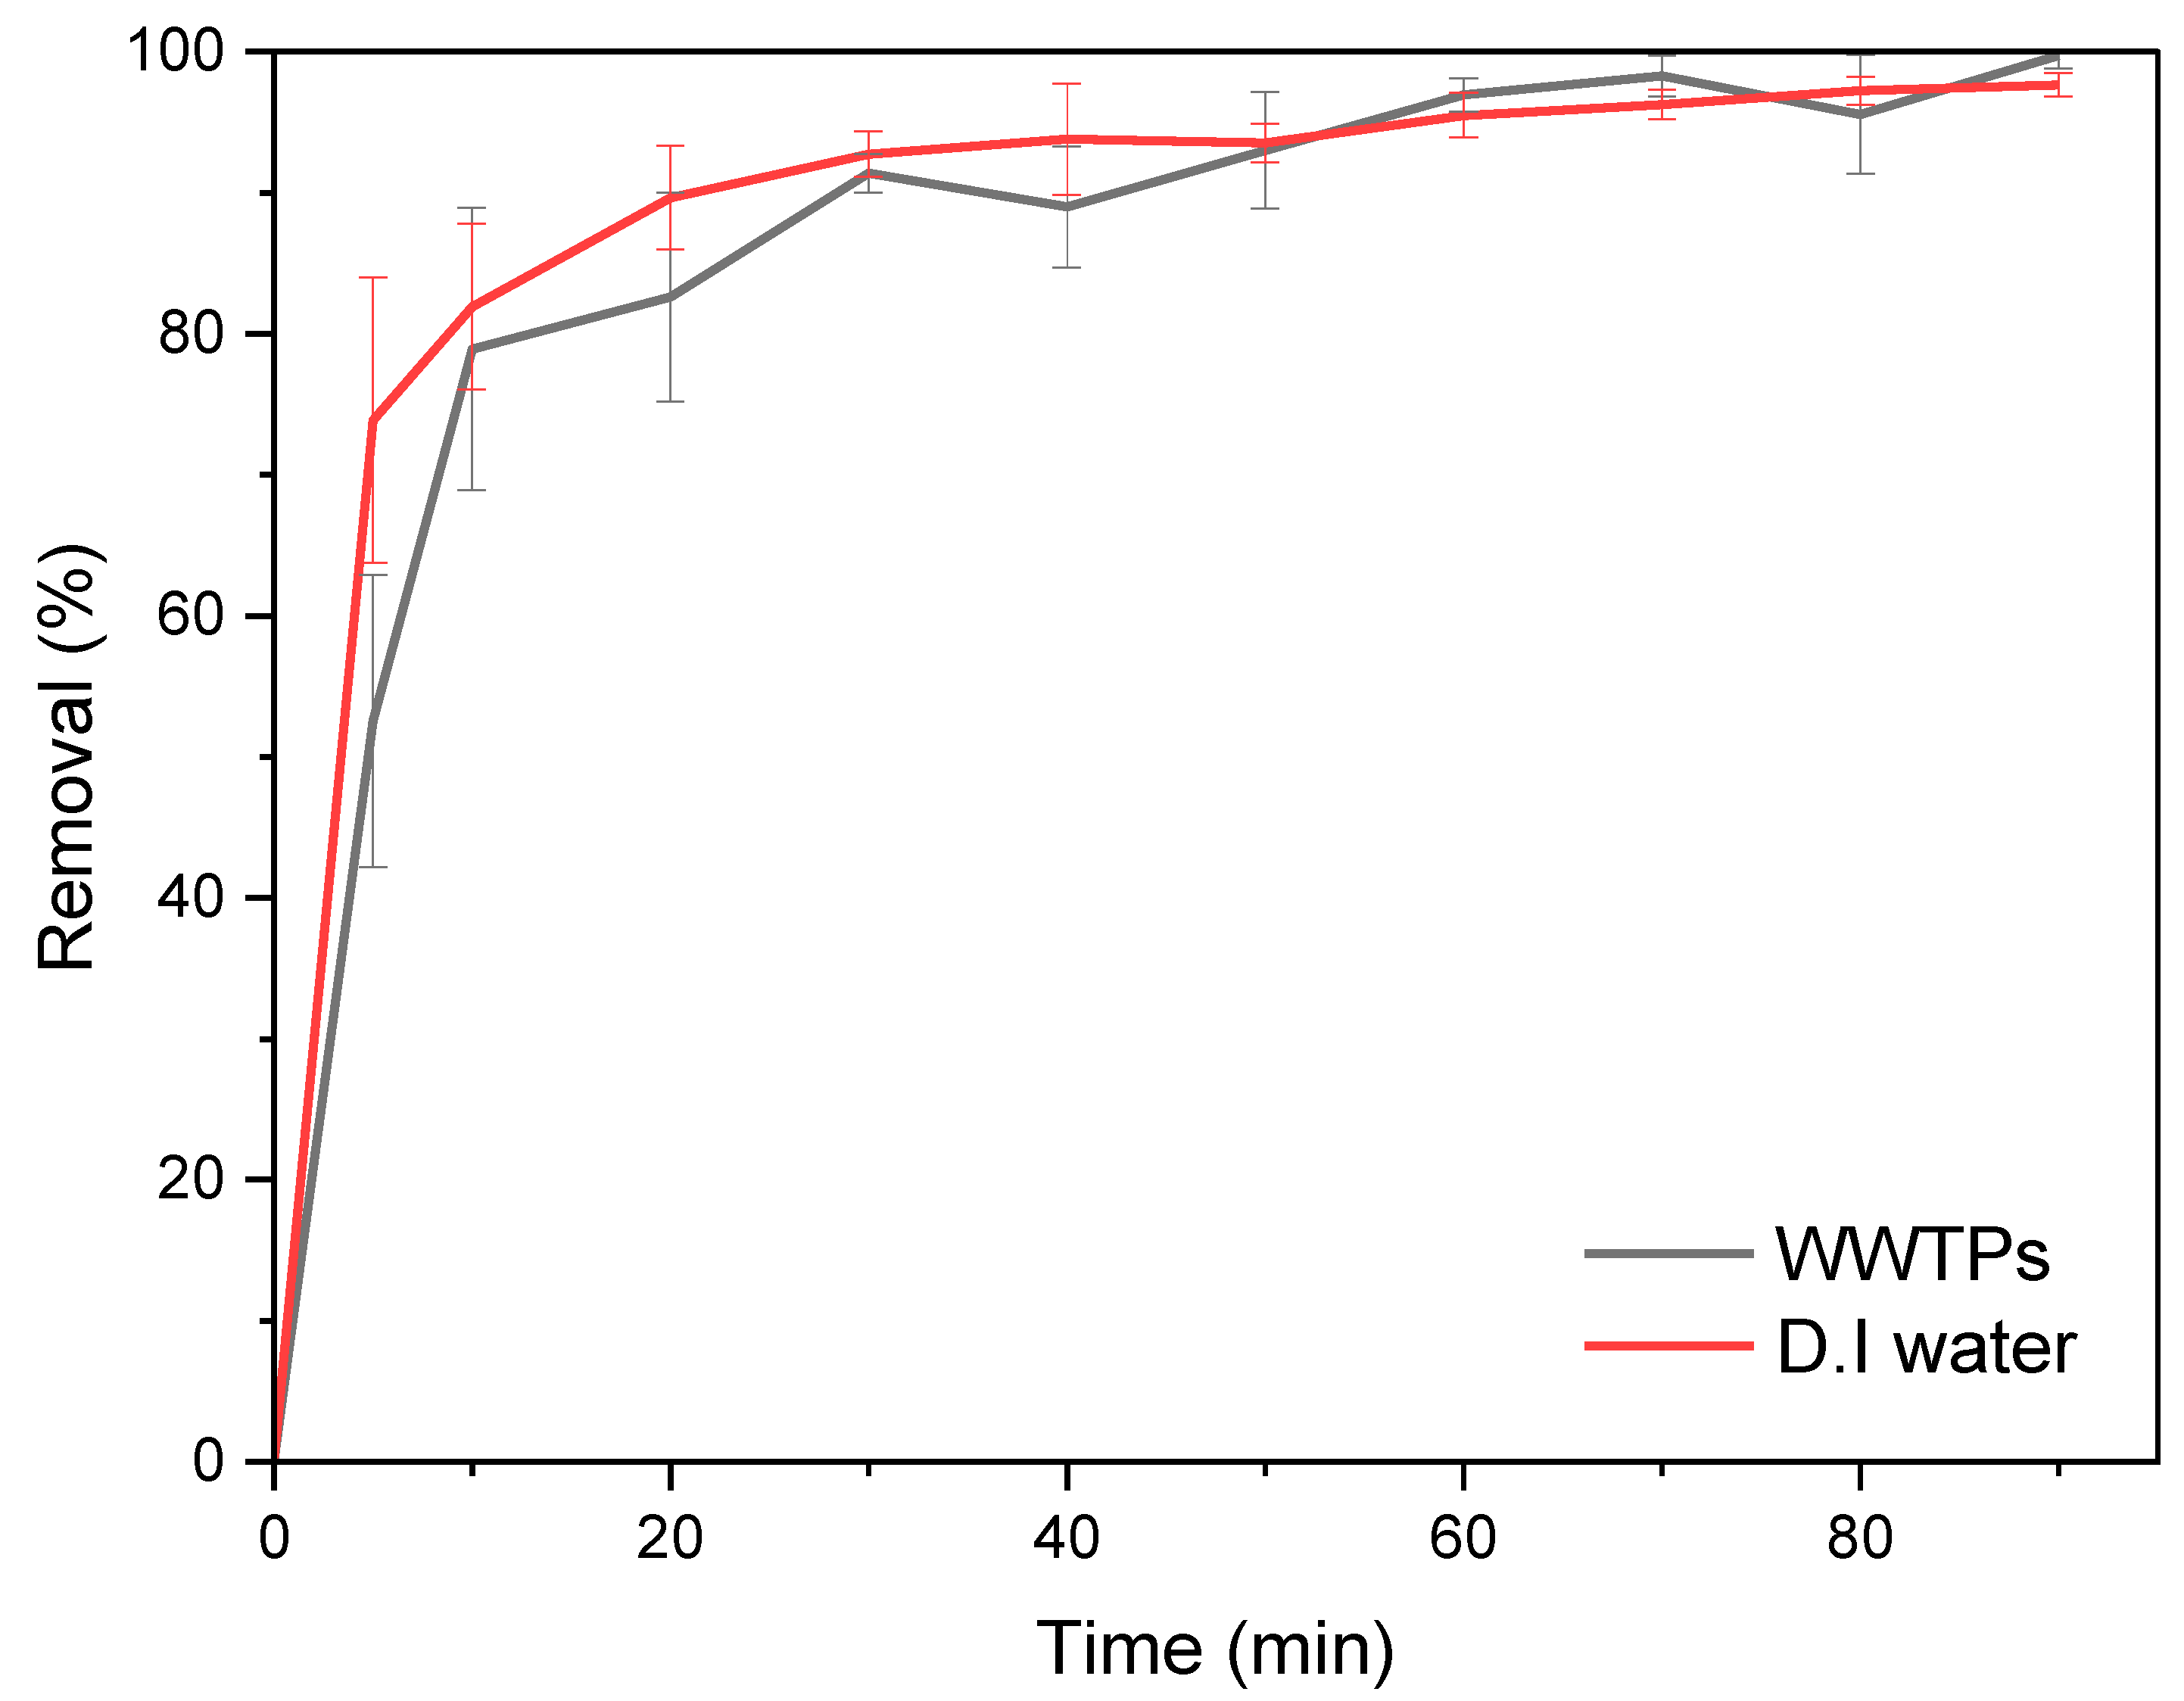
3.6. Wastewater Treatment
3.7. Comparative Analysis
4. Conclusions
Supplementary Materials
Author Contributions
Funding
Data Availability Statement
Acknowledgments
Conflicts of Interest
References
- Sauvé, S.; Desrosiers, M. A review of what is an emerging contaminant. Chem. Cent. J. 2014, 8, 15. [Google Scholar] [CrossRef] [PubMed]
- Vasantha Raman, N.; Dubey, A.; Millar, E.; Nava, V.; Leoni, B.; Gallego, I. Monitoring contaminants of emerging concern in aquatic systems through the lens of citizen science. Sci. Total Environ. 2023, 874, 162527. [Google Scholar] [CrossRef]
- Cantoni, B.; Ianes, J.; Bertolo, B.; Ziccardi, S.; Maffini, F.; Antonelli, M. Adsorption on activated carbon combined with ozonation for the removal of contaminants of emerging concern in drinking water. J. Environ. Manag. 2024, 350, 119537. [Google Scholar] [CrossRef]
- Bhandari, G.; Bagheri, A.R.; Bhatt, P.; Bilal, M. Occurrence, potential ecological risks, and degradation of endocrine disrupter, nonylphenol, from the aqueous environment. Chemosphere 2021, 275, 130013. [Google Scholar] [CrossRef] [PubMed]
- Zhao, Y.; Ji, J.; Wu, Y.; Chen, S.; Xu, M.; Cao, X.; Liu, H.; Wang, Z.; Bi, H.; Guan, G.; et al. Nonylphenol and its derivatives: Environmental distribution, treatment strategy, management and future perspectives. Chemosphere 2024, 352, 141377. [Google Scholar] [CrossRef] [PubMed]
- Crini, G.; Cosentino, C.; Bradu, C.; Fourmentin, M.; Torri, G.; Ruzimuradov, O.; Alaton, I.A.; Tomei, M.C.; Derco, J.; Barhoumi, M.; et al. Innovative technologies to remove alkylphenols from wastewater: A review. Environ. Chem. Lett. 2022, 20, 2597–2628. [Google Scholar] [CrossRef]
- Hong, Y.; Feng, C.; Yan, Z.; Wang, Y.; Liu, D.; Liao, W.; Bai, Y. Nonylphenol occurrence, distribution, toxicity and analytical methods in freshwater. Environ. Chem. Lett. 2020, 18, 2095–2106. [Google Scholar] [CrossRef]
- Cheng, Q.; Du, L.; Xu, L.; Zhao, Y.; Ma, J.; Lin, H. Toxicity alleviation and metabolism enhancement of nonylphenol in green algae Dictyosphaerium sp. by NaHCO3. Sci. Total Environ. 2022, 848, 157698. [Google Scholar] [CrossRef]
- Ruczyńska, W.; Szlinder-Richert, J.; Nermer, T. The occurrence and distribution of nonylphenols and nonylphenol ethoxylates in different species of fish. Environ. Sci. Process. Impacts 2020, 22, 1057–1070. [Google Scholar] [CrossRef]
- Wang, M.-H.; Chen, C.-F.; Albarico, F.P.J.B.; Lin, S.-L.; Chen, C.-W.; Dong, C.-D. Phthalate esters and nonylphenol concentrations correspond with microplastic distribution in anthropogenically polluted river sediments. Mar. Pollut. Bull. 2024, 199, 116031. [Google Scholar] [CrossRef]
- Ricciardi, F.; Matozzo, V.; Marin, M.G. Effects of 4-nonylphenol exposure in mussels (Mytilus galloprovincialis) and crabs (Carcinus aestuarii) with particular emphasis on vitellogenin induction. Mar. Pollut. Bull. 2008, 57, 365–372. [Google Scholar] [CrossRef]
- Osimitz, T.G.; Droege, W.; Driver, J.H. Human Risk Assessment for Nonylphenol. Hum. Ecol. Risk Assess. Int. J. 2015, 21, 1903–1919. [Google Scholar] [CrossRef]
- Nehring, I.; Staniszewska, M. Comparison of prenatal and postnatal exposure to endocrine active phenol derivatives in mammals—Humans and Baltic grey seals. Mar. Pollut. Bull. 2023, 196, 115567. [Google Scholar] [CrossRef]
- Li, J.; Zhang, H.; Li, J.; Qin, N.; Wei, Q.; Li, Y.; Peng, Y.; Li, H. Assessment of nonylphenol exposure based on global urinary concentration data and its risk analysis. Environ. Res. 2024, 244, 117903. [Google Scholar] [CrossRef]
- Sise, S.; Uguz, C. Nonylphenol in Human Breast Milk in Relation to Sociodemographic Variables, Diet, Obstetrics Histories and Lifestyle Habits in a Turkish Population. Iran. J. Public Health 2017, 46, 491–499. [Google Scholar] [PubMed]
- Wang, J.; Zhang, L.; He, Y.; Ji, R. Biodegradation of phenolic pollutants and bioaugmentation strategies: A review of current knowledge and future perspectives. J. Hazard. Mater. 2024, 469, 133906. [Google Scholar] [CrossRef]
- Weatherly, S.; Lyons, R. The photolytic conversion of 4-nonylphenol to 4-nonylcatechol within snowpack of the Palisade Glacier, Sierra Nevada, CA, USA. Sci. Total Environ. 2023, 876, 162835. [Google Scholar] [CrossRef]
- Moukhtari, F.E.; Martín-Pozo, L.; Zafra-Gómez, A. Strategies based on the use of microorganisms for the elimination of pollutants with endocrine-disrupting activity in the environment. J. Environ. Chem. Eng. 2023, 11, 109268. [Google Scholar] [CrossRef]
- Ho, H.; Watanabe, T. Distribution and Removal of Nonylphenol Ethoxylates and Nonylphenol from Textile Wastewater—A Comparison of a Cotton and a Synthetic Fiber Factory in Vietnam. Water 2017, 9, 386. [Google Scholar] [CrossRef]
- Arifin, M.N.; Jusoh, R.; Abdullah, H.; Ainirazali, N.; Setiabudi, H.D. Recent advances in advanced oxidation processes (AOPs) for the treatment of nitro- and alkyl-phenolic compounds. Environ. Res. 2023, 229, 115936. [Google Scholar] [CrossRef]
- Zhang, Y.; Zhang, X.; Wang, S. Recent advances in the removal of emerging contaminants from water by novel molecularly imprinted materials in advanced oxidation processes—A review. Sci. Total Environ. 2023, 883, 163702. [Google Scholar] [CrossRef]
- Yan, X.; Zhang, Q.; Rao, Q.; Chen, S.; Wang, X.; Song, W.; Cheng, L.; Guan, S.; Song, W. Efficient Removal of Nonylphenol Contamination from Water Using Optimized Magnesium Silicate. Materials 2022, 15, 4445. [Google Scholar] [CrossRef] [PubMed]
- Hassan, A.F.; Abdel-Mohsen, A.M.; Fouda, M.M.G. Comparative study of calcium alginate, activated carbon, and their composite beads on methylene blue adsorption. Carbohydr. Polym. 2014, 102, 192–198. [Google Scholar] [CrossRef]
- Sinha, P.; Banerjee, S.; Kar, K.K. Characteristics of Activated Carbon. In Handbook of Nanocomposite Supercapacitor Materials I; Kar, K.K., Ed.; Springer Series in Materials Science; Springer International Publishing: Cham, Switzerland, 2020; Volume 300, pp. 125–154. ISBN 978-3-030-43008-5. [Google Scholar]
- Quesada, H.B.; De Araújo, T.P.; Vareschini, D.T.; De Barros, M.A.S.D.; Gomes, R.G.; Bergamasco, R. Chitosan, alginate and other macromolecules as activated carbon immobilizing agents: A review on composite adsorbents for the removal of water contaminants. Int. J. Biol. Macromol. 2020, 164, 2535–2549. [Google Scholar] [CrossRef]
- Sher, F.; Hanif, K.; Rafey, A.; Khalid, U.; Zafar, A.; Ameen, M.; Lima, E.C. Removal of micropollutants from municipal wastewater using different types of activated carbons. J. Environ. Manag. 2021, 278, 111302. [Google Scholar] [CrossRef]
- Fuzil, N.S.; Othman, N.H.; Jamal, N.A.S.R.A.; Mustapa, A.N.; Alias, N.H.; Dollah, ‘A.; Him, N.R.N.; Marpani, F. Bisphenol A Adsorption from Aqueous Solution Using Graphene Oxide-Alginate Beads. J. Polym. Environ. 2022, 30, 597–612. [Google Scholar] [CrossRef]
- Lee, J.W.; Han, J.; Choi, Y.-K.; Park, S.; Lee, S.H. Reswellable alginate/activated carbon/carboxymethyl cellulose hydrogel beads for ibuprofen adsorption from aqueous solutions. Int. J. Biol. Macromol. 2023, 249, 126053. [Google Scholar] [CrossRef]
- Nasrullah, A.; Bhat, A.H.; Naeem, A.; Isa, M.H.; Danish, M. High surface area mesoporous activated carbon-alginate beads for efficient removal of methylene blue. Int. J. Biol. Macromol. 2018, 107, 1792–1799. [Google Scholar] [CrossRef]
- Kumar, A.; Prasad, B.; Mishra, I.M. Isotherm and kinetics study for acrylic acid removal using powdered activated carbon. J. Hazard. Mater. 2010, 176, 774–783. [Google Scholar] [CrossRef]
- Omer, A.M.; Abdel-Alim Sadik, W.; Elady, R.A.; Tamer, T.M.; Abd-Ellatif, M.M.; Mohy-Eldin, M.S. Novel amino-ethyl carboxymethyl cellulose crosslinked ampholyte hydrogel development for Methyl Orange Removal from Waste water: Kinetics, isotherms, and thermodynamics studies. Desalination Water Treat. 2024, 317, 100041. [Google Scholar] [CrossRef]
- Khedr, A.A.; Fawzy, M.E.; Ahmed, H.M.; Alshammari, S.O.; El-Khateeb, M.A. Treatment of heavy metal ions from simulated water using adsorption process via modified iron magnetic nanocomposite. Desalination Water Treat. 2024, 317, 100071. [Google Scholar] [CrossRef]
- Kwak, H.W.; Hong, Y.; Lee, M.E.; Jin, H.-J. Sericin-derived activated carbon-loaded alginate bead: An effective and recyclable natural polymer-based adsorbent for methylene blue removal. Int. J. Biol. Macromol. 2018, 120, 906–914. [Google Scholar] [CrossRef] [PubMed]
- Pathania, D.; Sharma, S.; Singh, P. Removal of methylene blue by adsorption onto activated carbon developed from Ficus carica bast. Arab. J. Chem. 2017, 10, S1445–S1451. [Google Scholar] [CrossRef]
- Balsiger, H.A.; De La Torre, R.; Lee, W.-Y.; Cox, M.B. A four-hour yeast bioassay for the direct measure of estrogenic activity in wastewater without sample extraction, concentration, or sterilization. Sci. Total Environ. 2010, 408, 1422–1429. [Google Scholar] [CrossRef]
- Alamin, N.U.; Khan, A.S.; Nasrullah, A.; Iqbal, J.; Ullah, Z.; Din, I.U.; Muhammad, N.; Khan, S.Z. Activated carbon-alginate beads impregnated with surfactant as sustainable adsorbent for efficient removal of methylene blue. Int. J. Biol. Macromol. 2021, 176, 233–243. [Google Scholar] [CrossRef]
- Park, H.G.; Kim, T.W.; Chae, M.Y.; Yoo, I.-K. Activated carbon-containing alginate adsorbent for the simultaneous removal of heavy metals and toxic organics. Process Biochem. 2007, 42, 1371–1377. [Google Scholar] [CrossRef]
- De Araújo, T.P.; Quesada, H.B.; Dos Santos, D.F.; Da Silva Fonseca, B.C.; Barbieri, J.Z.; Bergamasco, R.; De Barros, M.A.S.D. Acetaminophen removal by calcium alginate/activated hydrochar composite beads: Batch and fixed-bed studies. Int. J. Biol. Macromol. 2022, 203, 553–562. [Google Scholar] [CrossRef]
- Khan, A.S.; Ibrahim, T.H.; Khamis, M.I.; Nancarrow, P.; Iqbal, J.; AlNashef, I.; Jabbar, N.A.; Hassan, M.F.; Mjalli, F.S. Preparation of sustainable activated carbon-alginate beads impregnated with ionic liquid for phenol decontamination. J. Clean. Prod. 2021, 321, 128899. [Google Scholar] [CrossRef]
- Sujiono, E.H.; Zabrian, D.; Zurnansyah; Mulyati; Zharvan, V.; Samnur; Humairah, N.A. Fabrication and characterization of coconut shell activated carbon using variation chemical activation for wastewater treatment application. Results Chem. 2022, 4, 100291. [Google Scholar] [CrossRef]
- Wang, B.; Wan, Y.; Zheng, Y.; Lee, X.; Liu, T.; Yu, Z.; Huang, J.; Ok, Y.S.; Chen, J.; Gao, B. Alginate-based composites for environmental applications: A critical review. Crit. Rev. Environ. Sci. Technol. 2019, 49, 318–356. [Google Scholar] [CrossRef]
- Shamsudin, M.S.; Azha, S.F.; Sellaoui, L.; Badawi, M.; Bonilla-Petriciolet, A.; Ismail, S. Performance and interactions of diclofenac adsorption using Alginate/Carbon-based Films: Experimental investigation and statistical physics modelling. Chem. Eng. J. 2022, 428, 131929. [Google Scholar] [CrossRef]
- Kalam, S.; Abu-Khamsin, S.A.; Kamal, M.S.; Patil, S. Surfactant Adsorption Isotherms: A Review. ACS Omega 2021, 6, 32342–32348. [Google Scholar] [CrossRef]
- Tang, Y.; Liu, D.; He, H.; Zou, J.; Wang, D.; Yang, X.; Zhang, L.; Yang, C. Immobilization of zirconium-modified activated carbon in an alginate matrix for the removal of atrazine: Preparation, performances and mechanisms. Environ. Technol. Innov. 2024, 35, 103699. [Google Scholar] [CrossRef]
- Sun, R.; Gao, S.; Zhang, K.; Cheng, W.-T.; Hu, G. Recent advances in alginate-based composite gel spheres for removal of heavy metals. Int. J. Biol. Macromol. 2024, 268, 131853. [Google Scholar] [CrossRef] [PubMed]
- Raghav, S.; Kumar, D. Adsorption Equilibrium, Kinetics, and Thermodynamic Studies of Fluoride Adsorbed by Tetrametallic Oxide Adsorbent. J. Chem. Eng. Data 2018, 63, 1682–1697. [Google Scholar] [CrossRef]
- Al-Hazmi, G.A.A.M.; Alayyafi, A.A.; El-Desouky, M.G.; El-Bindary, A.A. Guava seed activated carbon loaded calcium alginate aerogel for the adsorption of diclofenac sodium: Characterization, isotherm, kinetics, and optimization via Box-Behnken design. Int. J. Biol. Macromol. 2024, 262, 129995. [Google Scholar] [CrossRef] [PubMed]
- Mahmoud, R.; Mahgoub, S.M.; Ashraf, A.M.; Allam, A.A.; Alawam, A.S.; Rudayni, H.A.; Moaty, S.A. Activated carbon alginate as adsorbent for simultaneous removal of almotriptan and paracetamol from binary solutions. Sustain. Chem. Pharm. 2024, 41, 101708. [Google Scholar] [CrossRef]
- Chaima, H.; Eddine, B.C.; Faouzia, B.; Rana, H.; Aymene Salah, B.; Gil, A.; Imene, B.-A.; Ferhat, D.; Riadh, B.; Mokhtar, B. Adsorptive removal of cationic dye from aqueous solutions using activated carbon prepared from Crataegus monogyna/sodium alginate/polyaniline composite beads: Experimental study and molecular dynamic simulation. J. Mol. Liq. 2024, 408, 125372. [Google Scholar] [CrossRef]
- Liu, Z.; Kanjo, Y.; Mizutani, S. Removal mechanisms for endocrine disrupting compounds (EDCs) in wastewater treatment—Physical means, biodegradation, and chemical advanced oxidation: A review. Sci. Total Environ. 2009, 407, 731–748. [Google Scholar] [CrossRef]
- Lara-Moreno, A.; Aguilar-Romero, I.; Rubio-Bellido, M.; Madrid, F.; Villaverde, J.; Santos, J.L.; Alonso, E.; Morillo, E. Novel nonylphenol-degrading bacterial strains isolated from sewage sludge: Application in bioremediation of sludge. Sci. Total Environ. 2022, 847, 157647. [Google Scholar] [CrossRef]
- Mahgoub, S.M.; Kotp, A.A.; Mohamed, M.A.; Alfassam, H.E.; Rudayni, H.A.; Allam, A.A.; Mahmoud, R.; Abdel Moaty, S.A. Assessment of activated carbon/alginate for the concurrent removal efficiency of paracetamol and caffeine from wastewater in their binary solutions. Chin. J. Anal. Chem. 2024, 52, 100403. [Google Scholar] [CrossRef]


| NP1 | NP2 | NP3 | NP4 | NP5 | NP6 | NP7 | NP8 | |
| RT | 19.35 | 19.46 | 19.55 | 19.65 | 19.81 | 19.94 | 19.99 | 20.10 |
| Ion | 121 | 135 | 149 | 135 | 149 | 163 | 135 | 149 |
| R2 | 0.99 | 0.99 | 0.99 | 0.99 | 0.99 | 0.99 | 0.99 | 0.99 |
| Alg-C Bead Sample | Surface Area (m2 g−1) | Micropore Volume (cm3 g−1) | Average Pore Diameter (Å) | Average Particle Size (Å) |
|---|---|---|---|---|
| Before NP sorption | 662.90 | 0.15 | 55.43 | 90.51 |
| After NP sorption | 341.90 | 0.080 | 53.23 | 175.50 |
| Dose (g) | 1 | 2 | 3 | 4 | 5 |
| qe (mg g−1) | 0.39 | 0.25 | 0.22 | 0.17 | 0.10 |
| Pseudo-First Order | Pseudo-Second Order | ||||||
|---|---|---|---|---|---|---|---|
| Dose (g) | qe (mg·g−1) | k1 (min−1) | R2 | Dose (g) | qe (mg·g−1) | k2 (mg·g−1·min−1) | R2 |
| 5 | 0.0001 | 0.00142 | 0.0150 | 5 | 0.001045 | 372.2 | 0.9986 |
| 4 | 0.0002 | 0.0029 | 0.0006 | 4 | 0.001763 | 277.7 | 0.9988 |
| 3 | 0.0002 | 0.0086 | 0.0066 | 3 | 0.002237 | 143.2 | 0.9976 |
| 2 | 0.0001 | 0.0652 | 0.3248 | 2 | 0.002615 | 121.7 | 0.9968 |
| 1 | 0.0007 | 0.0187 | 0.0554 | 1 | 0.003681 | 37.38 | 0.9591 |
| Isotherm | Parameters | Adsorption Values |
|---|---|---|
| Langmuir | qmax (mg g−1) | 0.35 |
| KL (L mg−1) | 0.97 | |
| R2 | 0.89 | |
| Freundlich | n | 1.28 |
| KF (mg g−1) | 0.068 | |
| R2 | 0.96 |
| Temperature (K) | (KJ mol−1) | (KJ mol−1) | (KJ mol−1) |
|---|---|---|---|
| 277.15 | −18.60 | 23.020 | 67.070 |
| 294.15 | −19.73 | ||
| 313.15 | −21.010 |
| Contaminant | Removal Efficiency (%) | Sorbent Dose (g) | Contaminant Concentration (mg L−1) | Contact Time (min) | Reference | |
|---|---|---|---|---|---|---|
| 1 | Nonylphenols | 85.9–97.6% | 1–5 | 10 | 90 | This work |
| 2 | Methylene blue | 74.3–99.0% | 0.01–0.10 | 50 | 120 | [29] |
| 3 | Diclofenac | 67.7–87.8% | 0.02–0.25 | 1000 | 5–100 | [47] |
| 4 | Paracetamol | 83.6% | 0.025–0.2 | 5–500 | 240 | [52] |
| 5 | Bisphenol-A | ~60.0–85.0% | 0.1 | 50–500 | 420 | [27] |
Disclaimer/Publisher’s Note: The statements, opinions and data contained in all publications are solely those of the individual author(s) and contributor(s) and not of MDPI and/or the editor(s). MDPI and/or the editor(s) disclaim responsibility for any injury to people or property resulting from any ideas, methods, instructions or products referred to in the content. |
© 2025 by the authors. Licensee MDPI, Basel, Switzerland. This article is an open access article distributed under the terms and conditions of the Creative Commons Attribution (CC BY) license (https://creativecommons.org/licenses/by/4.0/).
Share and Cite
Chacon, A.A.; Noriega Landa, E.; Yin, S.; Habib, A.; Holbrook, K.L.; Duran Bojorquez, L.R.; Badmos, S.; Villagrán, D.; Lee, W.-Y. Nonylphenol Removal from Water and Wastewater with Alginate-Activated Carbon Beads. Separations 2025, 12, 103. https://doi.org/10.3390/separations12050103
Chacon AA, Noriega Landa E, Yin S, Habib A, Holbrook KL, Duran Bojorquez LR, Badmos S, Villagrán D, Lee W-Y. Nonylphenol Removal from Water and Wastewater with Alginate-Activated Carbon Beads. Separations. 2025; 12(5):103. https://doi.org/10.3390/separations12050103
Chicago/Turabian StyleChacon, Angelica A., Elizabeth Noriega Landa, Sheng Yin, Ahsan Habib, Kiana L. Holbrook, Luis R. Duran Bojorquez, Sabur Badmos, Dino Villagrán, and Wen-Yee Lee. 2025. "Nonylphenol Removal from Water and Wastewater with Alginate-Activated Carbon Beads" Separations 12, no. 5: 103. https://doi.org/10.3390/separations12050103
APA StyleChacon, A. A., Noriega Landa, E., Yin, S., Habib, A., Holbrook, K. L., Duran Bojorquez, L. R., Badmos, S., Villagrán, D., & Lee, W.-Y. (2025). Nonylphenol Removal from Water and Wastewater with Alginate-Activated Carbon Beads. Separations, 12(5), 103. https://doi.org/10.3390/separations12050103