Abstract
A rapid, synchronized liquid chromatographic method was established for the estimation of hydrochlorothiazide (HCZ), amlodipine (AMD), olmesartan (OLM), telmisartan (TEL), and irbesartan (IRB) in binary and ternary coformulations using the same chromatographic conditions. Five analytes were separated on a Zorbax C18 column using isocratic elution with a mobile phase consisting of acetonitrile, methanol, and 20 mM phosphate buffer (pH 3.5) in a ratio of 45:20:35% v/v. The analytes were detected at a wavelength of 230 nm at ambient temperature. Furthermore, the proposed liquid chromatographic procedure was validated for linearity, precision, accuracy, stability, and robustness using an experimental design. Analytes were separated with good resolution within 3.5 min. Analytes showed good linearity in a concentration satisfactory to analyze the different ratios of these analytes in the formulations. Pareto charts showed that the flow rate and mobile phase composition have a significant effect on the peak area of analytes and hence need to be carefully controlled, however, the method is robust. Finally, the different formulations consisting of HCZ, AMD, OLM, TEL, and IRB in different ratios were analyzed with high accuracy using an optimized HPLC method and compared with reported methods. Furthermore, the reported HPLC procedure is simple, rapid, and accurate and therefore can used for regular quality control of binary and ternary formulations using the same stationary and mobile phase.
1. Introduction
Hypertension is a leading cause of mortality in elderly patients; however, due to the stresses of modern life, even younger people are now suffering from hypertension [1,2]. Globally, about 25% of the population are suffering from hypertension, and this is expected to increase to 30% by 2025 [3]. Different classes of antihypertensive agents are available to control hypertension. However, the most commonly used class of drugs includes calcium channel blockers, angiotensin receptor blockers, and diuretics [4]. A combination therapy showed better control of hypertension than monotherapy due to the different mechanisms of action of a combination of drugs [5,6,7]. Calcium channel blockers reduce blood pressure by acting on the heart as a beta-blocker and due to a peripheral vasodilation effect on the arteries and veins. Amlodipine besylate (AMD) is the most extensively used, long-acting calcium channel blocker used for the treatment of hypertension, heart attack, and angina. Sartans, angiotensin II receptor antagonists, reduce blood pressure by inhibiting the vasoconstriction effects of angiotensin on the blood vessels. Telmisartan (TEL), olmesartan (OLM), and irbesartan (IRB) are used for the management of hypertension and cardiac failure, either alone or in combination with other antihypertensive drugs and diuretics such as hydrochlorothiazide (HCZ) [4,8,9,10]. Diuretics reduce blood pressure by reducing blood volume through increasing the excretion of sodium and water in the urine. Telmisartan, olmesartan, and irbesartan are available on the market in combination with amlodipine and hydrochlorothiazide (Figure 1), manufactured by the same or different pharmaceutical industries [4]. Different analytical methods such as spectrophotometric [11,12,13,14,15,16,17,18], derivative spectrofluorimetric [19], HPLC [20,21,22,23,24,25,26,27], electrophoresis [28], and HPTLC [29] were reported for the concurrent determination of sartans, amlodipine, or hydrochlorothiazide from formulations and biological fluids. The literature has also reported a few analytical methods for the concurrent determination of ternary mixtures of sartans, amlodipine, and hydrochlorothiazide [30,31,32,33,34]. Furthermore, the estimation of several angiotensin II receptor antagonists with other cardiovascular drugs has been reported in the literature [35,36,37,38,39].
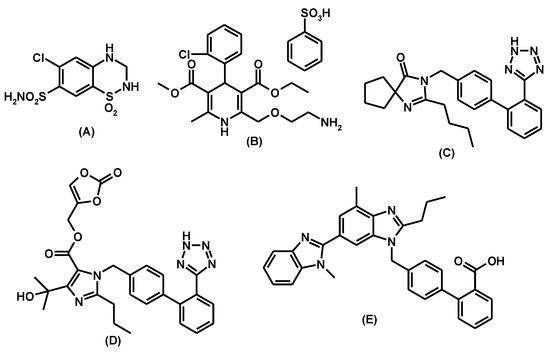
Figure 1.
Chemical structures of hydrochlorothiazde (A), amlodipine besylate (B), irbesartan (C), olmesartan medoxomil (D), and telmisartan (E).
Quality control laboratories of pharmaceutical industries and regulatory agencies prefer to use common analytical techniques for the analysis of diverse pharmaceutical formulations. The development of a common HPLC method saves time and solvents and increases the rate of routine analysis of different batches of formulations. The use of the same HPLC column and solvents reduces the time required to attain equilibrium between the stationary and mobile phases [40,41]. Hence, in the present work, a simple RP-HPLC method has been established and validated using the same reverse-phase high-performance liquid chromatography (RP-HPLC) column and mobile phase for the analysis of amlodipine and/or hydrochlorothiazide with different sartans. The major advantage of the proposed method is that the sartans, along with amlodipine and/or hydrochlorothiazide, can be determined as binary and ternary combinations using the same chromatographic conditions.
2. Materials and Methods
2.1. Materials
Standards AMD (99.56%) and HCZ (99.6%) were purchased from Sigma Aldrich (Buchs, Switzerland). Standards TEL (assay 99.4%) and OLM (assay 99.8%) were purchased from Biokemics (Hyderabad, India), and IRB (Assay 99.4%) was provided by Apotex Advancing Generics (Bangalore, India) as a gift sample. HPLC grade acetonitrile and methanol procured from Sigma Aldrich (St. Louis, MO, USA). Analytical grade potassium dihydrogen phosphate and orthophosphoric acid were acquired from Scharlau (Sentmenata, Spain). Various formulations (Table 1) consisting of these analytes were purchased from the market. Ultra-pure water prepared using Milli-Q (Millipore, Burlington, MA, USA) was used for preparing the mobile phase.

Table 1.
List of formulations.
2.2. Instrumentation
The HPLC system used for the development of the liquid chromatographic method was an Agilent LC system (1200 series, Agilent, Waldbronn, Germany) equipped with a degasser, auto sampler, quaternary pump, and PDA detector. The chromatogram was monitored using Agilent Chemstation software (Version B.2.4.1). A benchtop pH meter (Mettler-Toledo, Bekasi, Indonesia) was used for adjusting the pH of the mobile phase.
2.3. Chromatographic Conditions
All five antihypertensive drugs, AMD, HCZ, TEL, OLM, and IRB, were chromatographically separated using an Agilent chromatographic system. The column used was a Zorbax Agilent HPLC analytical C18 column (150 mm × 4.6 mm, 5 µM), the mobile phase was potassium dihydrogen phosphate (20 mM, pH adjusted to 3.5 by orthophosphoric acid), and acetonitrile and methanol were at a ratio of 35:45:20% v/v. The mobile phase was pumped at a flow rate of 1.5 mL/min at ambient temperature. The chromatogram of eluting was recorded by maintaining the wavelength of PDA at 230 nm. Then, 20 µL of analyte solutions were injected into the HPLC system for the analysis.
2.4. Preparation of Standard Solutions
Standards AMD, HCZ, OLM, and IRB (100 mg each) were weighed into 100 mL measuring flasks separately consisting of 50 mL of methanol, whereas TEL was dissolved in ethanol. The flasks were mixed to solubilize the drugs, and the final volume was adjusted to the 100 mL mark with methanol to get a 1 mg/mL concentration of analytes. Furthermore, working standard solutions for the calibration curve, accuracy, and precision were arranged by adding the required amount of mobile phase to the standard solutions.
2.5. Preparation of Sample Solutions
Twenty tablets consisting of different combinations of AMD, HCZ, TEL, OLM, and IRB (Table 1) were weighed and separately crushed into powder. Tablet powders consisting of different ratios of analytes were weighed and transferred to graduated flasks containing a sufficient amount of solvent. Formulations consisting of TEL were dissolved in ethanol, whereas other formulations were dissolved in methanol. The flasks were sonicated for 15 min to dissolve the analytes, then filtered into other volumetric flasks, and the final volume was adjusted with methanol. Moreover, the solutions were diluted with mobile phase to make the concentration of analytes in the range of the calibration curve. Then, 20 µL of the sample was introduced into the HPLC system for analysis. The concentration of analytes was calculated using corresponding regression equations.
2.6. Validation of HPLC Method
The optimized chromatographic method was validated for different validation parameters such as linearity, system suitability, LOD, LOQ, accuracy, precision, and robustness, per the ICH guidelines [42].
2.6.1. System Suitability Test
A low concentration of all analytes (2 µg/mL of HCZ, 1 µg/mL of AMD, 5 µg/mL of OLM and TEL, and 10 µg/mL of IRB) and six injection replicates were used for the system suitability tests. The different parameters calculated were peak area, retention time, resolution, and peak symmetry.
2.6.2. Linearity
The linearity range was determined by injecting standard solutions of all analytes in a series of 1 to 15 µg/mL of AMD, 2 to 30 µg/mL of HCZ, 5 to 160 µg/mL of OLM and TEL, and 10 to 300 µg/mL of IRB in triplicate. The average peak area was calculated for corresponding chromatograms and a linearity curve was prepared compared to respective concentrations. The regression coefficient (R2), along with a regression equation consisting of slope and intercept generated, were used for further calculation of the analyte concentrations in samples.
2.6.3. Sensitivity
The limit of detection (LOD) and quantification (LOQ) indicate the sensitivity of the analytical method. The signal-to-noise ratio (S/N) method has been used to determine the LOD and LOQ. The chromatogram was generated by injecting a very low concentration of analytes, and signal-to-noise ratios of 3.3 × S/N and 10 × S/N were used to determine the LOD and LOQ, respectively.
2.6.4. Precision
The overall precision of the proposed method was assessed in the form of intraday and interday precision and expressed as the percent relative standard deviation. Intraday precision was assessed by analyzing three different concentrations (low, medium, and high), covering the entire calibration range. The analysis was performed in triplicate. Interday precision was assessed by analyzing the above solution on three consecutive days.
2.6.5. Accuracy
Accuracy was calculated by determining the percent assay and percent relative error using the standard addition technique. To the previously analyzed laboratory-prepared mixture (HCZ 10 mg + AMD 5 mg + TEL 40 mg + OLM 20 mg + IRB 100 mg), a known amount of standard drug was added (50%, 100%, or 150%) and the total analyte amount was determined using the optimized HPLC method. Furthermore, the accuracy of the procedure was confirmed by computing the percent recovery of the added amount of drugs and the percent relative error.
2.6.6. Robustness
According to the ICH guidelines, robustness has to be assessed for the newly proposed analytical method to understand the effect of slight changes on the experimental conditions. The multivariate approach provides complete information regarding the effect of simultaneous variation in the different independent variables. Hence, the full factorial 2n factorial approach, where n indicates the number of independent variables, was performed using Design Expert version 12 software (Minneapolis, MN, USA). The variables considered were flow rate (1.4, 1.5, or 1.6 mL/min), the pH of the mobile phase (3.0, 3.5, or 4.0), and the mobile phase composition (buffer: 30%, 35% or 40%; the volume of acetonitrile and methanol were changed equally to make the total volume 100%) on the percent assay. The final assay depends on the peak area; hence, the peak area of analytes was selected in response to studying the effect of independent variables. Thirteen runs were performed per the Plackett‒Burman design, including five center points. Pareto charts were generated to show the effect of the independent variables on the peak area.
Further, a robustness study was performed to study the effect of wavelength (230 ± 2 nm), injection volume (20 ± 2 µL), and pH (3.5 ± 0.2) of the mobile phase on the peak area. One parameter was varied at a time by keeping all the other parameters at the optimized level. Analysis was performed in triplicate and percent relative standard deviation of peak area was calculated.
3. Results and Discussion
The chromatographic conditions were optimized to get the highest resolution for all five analyte peaks through the selection of different stationary phases, mobile phase compositions, pH values of the mobile phase, and flow rates. Different stationary phases such as chromolith speed rod, Sepax BR-C18, and Zorbax C18 were also tried, and the Zorbax C18 column showed good separation of analytes with excellent resolution and shape of peaks. The mobile phase composition was elevated by observing the effect of the mobile phase on the peak shape, resolution, capacity factor, and peak symmetry. Potassium dihydrogen phosphate was selected to maintain the ionic strength. Different strengths from 10 mM to 50 mM were tried, with 10 mM tailing observed in AMD and TEL peaks. However, at 20 mM an acceptable peak shape was observed; hence, 20 mM was selected for further development of the HPLC method. The organic modifier acetonitrile was selected for its low viscosity and to reduce the column backpressure. However, with a phosphate buffer and acetonitrile, AMD, OLM, and IRB could not be separated. To separate all five analytes with good resolution, methanol was added to the mobile phase. Varied ratios of phosphate buffer, acetonitrile, and methanol were studied (Figure 2). With less than 35% of phosphate buffer, the HCZ peak was broad; furthermore, more than 35% of telmisartan was eluted after 5 min. In addition, with the increase in the amount of acetonitrile, the retention times of analytes were reduced; however, with more than 45% OLM the IRB resolution was less than 2, so 45% acetonitrile was selected. Furthermore, 20% methanol led to good resolution for all the analytes. The effect of mobile phase pH was evaluated in acidic pH values of 3, 3.5, and 4 (Figure 3). At pH 3, good resolution was observed between HCZ and AMD; however, the TEL and IRB peaks overlapped and a baseline separation was not observed. At pH 4, the AMD and TEL retention time increased and the AMD peak overlapped completely with the IRB peak. At pH 3.5, all five analytes were separated with good resolution and peak shape. The different flow rates of 1 mL/min, 1.2 mL/min, and 1.5 mL/min were evaluated. A flow rate of 1 or 1.2 mL/min took a long analysis time, whereas 1.5 mL/min gave good resolution with baseline separation of all analytes within 3.5 min. From the UV absorption spectra (16, 17, Figure S3) of all five analytes, a wavelength of 230 nm was selected for recording the chromatogram. Finally, the optimized mobile phase, consisting of 20 mM phosphate buffer, acetonitrile, and methanol in a ratio of 35%:45%:20% v/v, led to acceptable retention times of 1.01 min, 1.42 min, 1.8 min, 2.1 min, and 3.3 min for HCZ, AMD, OLM, IRB, and TEL, respectively (Figure 4).
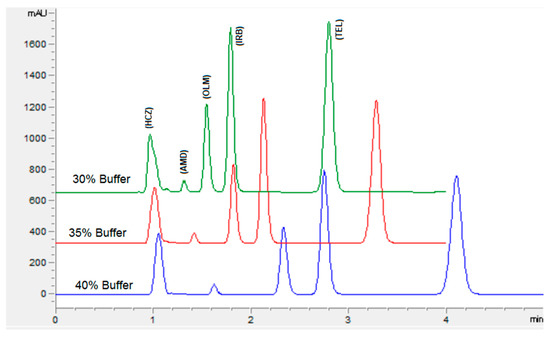
Figure 2.
Chromatogram showing the effect of buffer concentration on the separation of analytes. Mobile phase: potassium dihydrogen phosphate (20 mM, pH adjusted to 3.5 via orthophosphoric acid) and acetonitrile and methanol. Flow rate 1.5 mL Min−1, wavelength 230 nm.
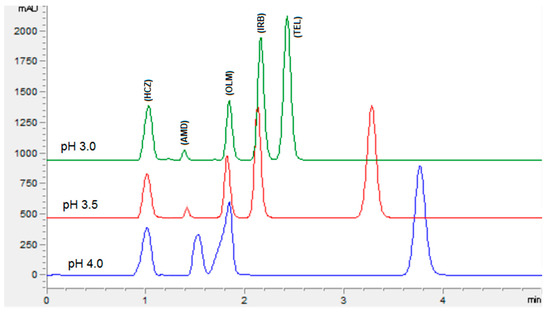
Figure 3.
Chromatogram showing the effect of the pH of the mobile phase on the separation of analytes. Mobile phase: potassium dihydrogen phosphate (20 mM, pH adjusted via orthophosphoric acid) and acetonitrile and methanol were at a ratio of 35:45:20% v/v. Flow rate 1.5 mL Min−1, wavelength 230 nm.
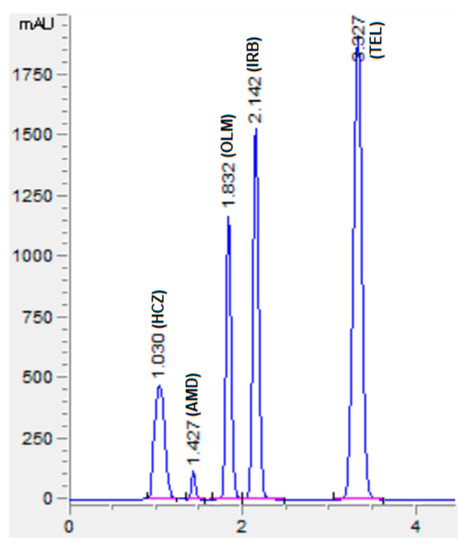
Figure 4.
Representative chromatogram of standard solutions of HCZ (25 µg/mL), AMD (20 µg/mL), OLM (100 µg/mL), IRB (300 µg/mL), and TEL (100 µg/mL). Mobile phase: potassium dihydrogen phosphate (20 mM, pH adjusted to 3.5 via orthophosphoric acid) and acetonitrile and methanol were at a ratio of 35:45:20% v/v. Flow rate 1.5 mL Min−1, wavelength 230 nm.
3.1. Validation of HPLC Method
3.1.1. System Suitability Studies
The different system suitability parameters such as peak area, retention time, resolution, and peak symmetry were calculated by injecting analytes in triplicate. The results are tabulated in Table 2. All the system suitability parameters were well within the acceptable range. (SM S1)
Table 2.
System suitability and regression analysis results.
3.1.2. Linearity
Linearity was established by plotting a graph of the concentrations of the analyte against the corresponding peak areas. The regression equation and regression coefficient (Microsoft Excel 10) were computed from the calibration curve (Table 2). Linearity with a good regression coefficient was observed in the concentration of 2–30 µg/mL for HCZ, 1–15 µg/mL for AMD, 5–160 µg/mL for OLM and TEL, and 10–300 µg/mL for IRB (Figure S1).
3.1.3. Limit of Detection and Quantification
LOD and LOQ were determined by the signal-to-noise ratio and the results are tabulated in Table 2. The low LOD and LOQ values confirm the sensitivity of the method.
3.1.4. Precision
Intraday and interday precision were assessed at three different levels for all analytes. The % RSD for both intraday and interday precision (Table 3) was found to be 1.03 to 1.49 for HCZ, 1.42 to 1.98 for AMD, 1.38 to 1.70 for OLM, 1.22 to 1.30 for TEL, and 0.84 to 1.32 for IRB. The low % RSD confirms the precision of the method. The percent relative error (% RE) was in the acceptable range (±2%) for all analytes, confirming the precision of the optimized HPLC method.
Table 3.
Precision results for analytes using the optimized HPLC method.
3.1.5. Accuracy
The standard addition method with the determination of percentage recovery was adopted for the confirmation of the accuracy of the optimized HPLC method. The mean of percent recovery was found to be 99.61% for HCZ, 99.42% for AMD, 98.71% for OLM, 98.83% for TEL, and 99.48% for IRB. Furthermore, the low percent relative error confirmed the accuracy of the method (Table 4).
Table 4.
Recovery study results for the accuracy of the optimized HPLC method.
3.1.6. Robustness
The robustness of the analytical procedure was assessed to identify the effect of variations in the experimental settings of the analysis. The univariate method was based on changing one factor at a time; it does not provide information about the combined effect of different independent variables. Hence, in accordance with the Plackett‒Burman design, a factorial design was selected. The Pareto chart in Figure 5 illustrates the individual and combined effects of independent variables on the response. The effects of variables above the Bonferroni limit were highly significant, whereas the effects above the t-value limit were significant. The 13 runs carried out as per the software suggestion, in random order, showed that the buffer volume and flow rate had a significant effect on the peak area of HCZ and TEL, respectively. However, the combined variation of all these factors and pH × buffer volume had a highly significant effect on the peak area of OLM and IRB, respectively. In addition, the combined effect of flow rate × pH and flow rate × buffer volume had a significant effect on the peak area of TEL and OLM, respectively. Hence, these variables need to be controlled carefully during the analysis. Furthermore, a slight variation in individual factors did not affect the peak area of AMD, OLM, and IRB.
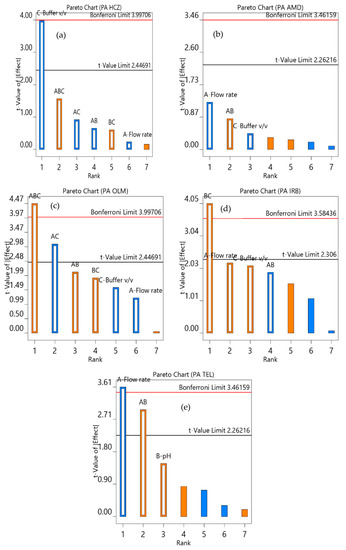
Figure 5.
Pareto chart showing the effect of flow rate (A); pH (B); and percentage of buffer (C) on the peak area (PA) of HCZ (a), AMD (b), OLM (c), IRB (d), and TEL (e).
The results of deliberate changes in the experimental condition for the robustness determination included wavelength (230 ± 2 nm), injection volume (20 ± 2 µL), and pH (3.5 ± 0.2). The percentage RSD of the peak area of the analytes was found to be in the range of 0.67–1.73%, 0.78–1.16%, 1.23–1.58%, 1.55–1.81%, and 1.23–1.56% for HCZ, AMD, OLM, IRB, and TEL, respectively. In all the cases, the percentage RSD was less than 2%, indicating the robustness of the optimized HPLC method (Table 5).
Table 5.
Robustness results of optimized HPLC method.
3.2. Application to Formulations and Comparison with Reported Methods
The optimized HPLC method was applied for concurrent quantification of HCZ, AMD, OLM, IRB, and TEL in binary and ternary combination formulations (Figure 6). The assay results (Table 6) were in agreement with the label claim, and no interfering peaks were witnessed at the retention time of analytes (Figure 6 and Figure S2). The percentage assay was found to be in the range of 98% to 102% for all the analytes (HCZ, AMD, OLM, IRB, and TEL). Furthermore, the present method was compared with the reported methods [27,28]. Student’s t-test and F test were performed to compare the assay results. The calculated t and F values were found to be less than the critical values (Table 7), which indicated no significant difference in the assay outcomes between the present and reported methods.
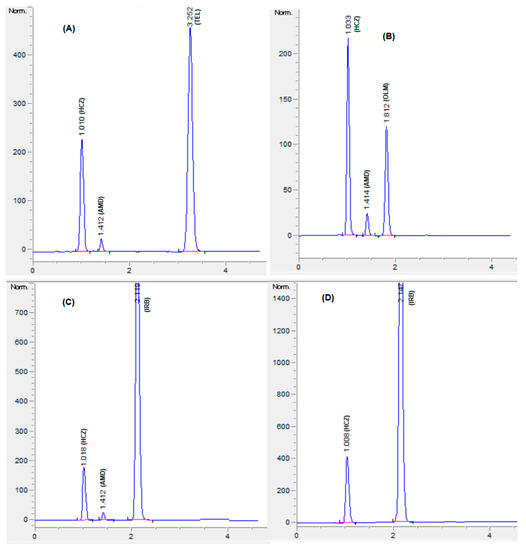
Figure 6.
Chromatograms of formulations, HCZ:AMD:TEL:12.5:5:40 mg (A); HCZ:AMD:OLM:12.5:5:20 mg (B); HCZ:AMD:IRB:12.5:5:150 mg (C); HCZ:IRB:25:300 mg (D). Mobile phase: potassium dihydrogen phosphate (20 mM, pH 3.5 adjusted by orthophosphoric acid) and acetonitrile and methanol were at a ratio of 35:45:20% v/v. Flow rate 1.5 mL Min−1, wavelength 230 nm.
Table 6.
Analysis results of drugs from formulations using the optimized HPLC method.
Table 7.
Assay and statistical comparison of the results of the optimized HPLC method with the reported methods.
4. Conclusions
A simple HPLC procedure was established for the concurrent determination of HCZ, AMD, OLM, IRB, and TEL from binary and ternary formulations, using similar experimental conditions. The developed HPLC method is economical and timesaving for analyzing several binary and ternary mixture formulations because it uses the same stationary and mobile phase. The formulation excipients did not interfere with the analysis and the method was rapid (<3.5 min). The robustness study showed the effect of different variable parameters on the analysis. A statistical comparison of the present method with the reported method showed no significant difference in the assay results.
Supplementary Materials
The following are available online at https://www.mdpi.com/article/10.3390/separations8060086/s1, Figure S1: Calibration curves of analytes from the optimized HPLC method. Figure S2: Chromatograms of formulations; HCZ AMD:12.5:5 µg/mL (A); HCZ:TEL:12.5:40 µg/mL (B); HCZ:TEL: 12.5:80 µg/mL (C); HCZ:AMD:TEL:12.5:5:40 µg/mL (D); HCZ:IRB:12.5:150 µg/mL (E); HCZ:IRB:12.5:300 µg/mL (F); AMD:IRB:10:150 µg/mL (G); HCZ:AMD:OLM:12.5:5:20 µg/mL (H); HCZ:TEL:12.5:40 µg/mL (I). Figure S3: UV absorption spectra of AMD, HCZ, and TEL. SM S1: Equations used for calculations and preparation of standard solutions for validation.
Author Contributions
Conceptualization, M.A. and S.S.; data curation, N.S., K.N.V., and A.B.N.; formal analysis, M.A., N.S., and S.P.; funding acquisition, M.S.C. and S.S.; investigation, N.S., M.S.C., K.N.V., S.S., and S.P.; methodology, M.A., M.S.C., K.N.V., S.S., A.B.N., and S.P.; project administration, M.A., A.B.N., and S.P.; resources, M.S.C. and S.S.; supervision, N.S., M.S.C., and K.N.V.; validation, N.S., A.B.N., and S.S.; visualization, S.P.; writing—original draft, M.A., N.S., K.N.V., and A.B.N.; writing—review and editing, M.A., N.S., M.S.C., K.N.V., A.B.N., S.S., and S.P. All authors have read and agreed to the published version of the manuscript.
Funding
The authors are thankful to the Deanship of Scientific Research, King Faisal University, Al-Ahsa, Saudi Arabia for financial support under Nasher track (Grant # 186279). The APC was funded by the Deanship of Scientific Research, King Faisal University, Al-Ahsa.
Data Availability Statement
The data presented in this study is available in supplementary material.
Acknowledgments
The authors are thankful to the Deanship of Scientific Research, King Faisal University, Al-Ahsa, Saudi Arabia, for financial and moral support. The authors also thank Tameem Alyahian for his support.
Conflicts of Interest
The authors declare no conflict of interest.
References
- Adji, A.; O’Rourke, M.F.; Namasivayam, M. Arterial stiffness, its assessment, prognostic value, and implications for treat-ment. Am. J. Hypertens. 2011, 24, 5–17. [Google Scholar] [CrossRef] [PubMed]
- Maatouk, I.; Wild, B.; Herzog, W.; Wesche, D.; Schellberg, D.; Schöttker, B.; Müller, H.; Rothenbacher, D.; Stegmaier, C.; Brenner, H. Longitudinal predictors of health-related quality of life in middle-aged and older adults with hyperten-sion: Results of a population-based study. J. Hypertens. 2012, 30, 1364–1372. [Google Scholar] [CrossRef]
- Filipova, E.; Dineva, S.; Uzunova, K.; Pavlova, V.; Kalinov, K.; Vekov, T. Combining angiotensin receptor blockers with chlorthalidone or hydrochlorothiazide—Which is the better alternative? A meta-analysis. Syst. Rev. 2020, 9, 1–12. [Google Scholar] [CrossRef]
- Smith, D.K.; Lennon, R.P.; Carlsgaard, P.B. Managing Hypertension Using Combination Therapy. Am. Fam. Physician 2020, 101, 341–349. [Google Scholar] [PubMed]
- Guerrero-García, C.; Rubio-Guerra, A.F. Combination therapy in the treatment of hypertension. Drugs Context 2018, 7, 1–9. [Google Scholar] [CrossRef]
- Taddei, S. Combination Therapy in Hypertension: What Are the Best Options According to Clinical Pharmacology Principles and Controlled Clinical Trial Evidence? Am. J. Cardiovasc. Drugs 2015, 15, 185–194. [Google Scholar] [CrossRef] [PubMed]
- Benjamin, I.J.; Kreutz, R.; Olsen, M.H.; Schutte, A.E.; Lopez-Jaramillo, P.; Frieden, T.R.; Sliwa, K.; Lackland, D.T.; Brainin, M. Fixed-dose combination antihypertensive medications. Lancet 2019, 394, 637–638. [Google Scholar] [CrossRef]
- Volpe, M.; Tocci, G. Rationale for triple fixed-dose combination therapy with an angiotensin II receptor blocker, a calcium channel blocker, and a thiazide diuretic. Vasc. Health Risk Manag. 2012, 8, 371–380. [Google Scholar] [CrossRef] [PubMed][Green Version]
- Oh, G.C.; Lee, H.-Y.; Chung, W.J.; Youn, H.-J.; Cho, E.-J.; Sung, K.-C.; Chae, S.C.; Yoo, B.-S.; Park, C.G.; Hong, S.J.; et al. Comparison of effects between calcium channel blocker and diuretics in combination with angiotensin II receptor blocker on 24-h central blood pressure and vascular hemodynamic parameters in hypertensive patients: Study design for a multicenter, double-blinded, active-controlled, phase 4, randomized trial. Clin. Hypertens. 2017, 23, 18. [Google Scholar] [CrossRef]
- Deeks, E.D. Olmesartan medoxomil/amlodipine/hydrochlorothiazide: Fixed-dose combination in hypertension. Drugs 2011, 71, 209–220. [Google Scholar] [CrossRef] [PubMed]
- Attimarad, M.; Venugopala, K.N.; Aldhubiab, B.E.; Nair, A.B.; Sreeharsha, N.; Pottathil, S.; Akrawi, S.H. Development of UV Spectrophotometric Procedures for Determination of Amlodipine and Celecoxib in Formulation: Use of Scaling Factor to Improve the Sensitivity. J. Spectrosc. 2019, 2019, 1–10. [Google Scholar] [CrossRef]
- Giri, P.; Jadhav, P.; Patil, U.; Jadhav, N.R. Hydrochlorothiazide Nanocrystals Stabilization by Silk Sericin. Indian J. Pharm. Educ. Res. 2019, 53, 494–502. [Google Scholar] [CrossRef]
- Ahsan, S.F.; Sheraz, M.A.; Khan, M.F.; Anwar, Z.; Ahmed, S.; Ahmad, I. Formulation and Stability Studies of Fast Disinte-grating Tablets of Amlodipine Besylate. Indian J. Pharm. Educ. Res. 2019, 53, 480–493. [Google Scholar] [CrossRef]
- Attimarad, M.; Narayanswamy, V.K.; Aldhubaib, B.E.; Sreeharsha, N.; Nair, A.B. Development of UV spectrophotometry methods for concurrent quantification of amlodipine and celecoxib by manipulation of ratio spectra in pure and pharmaceutical formulation. PLoS ONE 2019, 14, e0222526. [Google Scholar] [CrossRef]
- Desavathu, M.; Raghuveer, P.; Sarada, P. Insertion of Dual Drugs of Hypertension in Gelatin Pockets for Chrono pharma-cotherapy and its Evaluation by in-vitro and ex-vivostudies. Indian J. Pharm. Educ. Res. 2018, 52, S184–S196. [Google Scholar] [CrossRef]
- Shakya, P.; Jain, P.K.; Shrivastava, S.P.; Gajbhiye, A. Simultaneous estimation of irbesartan and hydrochlorothiazide by UV spectroscopy. Int. J. ChemTech Res. 2015, 7, 389–391. [Google Scholar]
- Darwish, H.W.; Bakheit, A.H.; Abdelhameed, A.S. Simultaneous quantitative analysis of olmesartan, amlodipine and hydrochlorothiazide in their combined dosage form utilizing classical and alternating least squares based chemometric methods. Acta Pharm. 2016, 66, 83–95. [Google Scholar] [CrossRef] [PubMed]
- Usharani, N.; Divya, K.; Ashrtiha, V.V.S. Development and Validation of UV-Derivative Spectroscopic and RP-HPLC Methods for the Determination of Amlodipine Besylate and Valsartan in Tablet Dosage form and Comparison of the Developed Methods by Student’s T-Test. Indian J. Pharm. Educ. Res. 2017, 51, S776–S782. [Google Scholar]
- Shalan, S.; Nasr, J.J. Simultaneous evaluation of losartan and amlodipine besylate using second-derivative synchronous spectrofluorimetric technique and liquid chromatography with time-programmed fluorimetric detection. R. Soc. Open Sci. 2019, 6, 190310. [Google Scholar] [CrossRef]
- Bangaruthalli, J.; Harini, U.; Divya, M.; Sushma, P.; Eswar, N. Simultaneous estimation of telmisartan and atorvastatin cal-cium in API and tablet dosage form. J. Drug Deliv. Ther. 2019, 9, 175–179. [Google Scholar]
- Nisa, Z.; Ali, S.I.; Rizvi, M.; Khan, M.A.; Sultan, R.A.; Fatima, R.; Shaheen, N.; Zafar, F.; Kashif, S.S.; Khatian, N. Development and validation of reverse phase HPLC method for determination of angiotensin receptor blocking agent irbesartan in plasma. Pak. J. Pharm. Sci. 2019, 32, 853–858. [Google Scholar]
- Attimarad, M.; Venugopala, K.N.; SreeHarsha, N.; Aldhubiab, B.E.; Nair, A.B. Validation of rapid RP-HPLC method for concurrent quantification of amlodipine and celecoxib in pure and formulation using an experimental design. Microchem. J. 2020, 152, 104365. [Google Scholar] [CrossRef]
- Kasagić-Vujanović, I.; Jančić-Stojanović, B.; Ivanović, D. Investigation of the retention mechanisms of amlodipine besylate, bisoprolol fumarate, and their impurities on three different HILIC columns. J. Liq. Chromatogr. Relat. Technol. 2018, 41, 523–531. [Google Scholar] [CrossRef]
- Heidari, H.; Limouei-Khosrowshahi, B. Magnetic solid phase extraction with carbon-coated Fe3O4 nanoparticles coupled to HPLC-UV for the simultaneous determination of losartan, carvedilol, and amlodipine besylate in plasma samples. J. Chromatogr. B 2019, 1114–1115, 24–30. [Google Scholar] [CrossRef] [PubMed]
- Kurbanoğlu, S.; Yarman, A. Simultaneous Determination of Hydrochlorothiazide and Irbesartan from Pharmaceutical Dosage Forms with RP-HPLC. Turk. J. Pharm. Sci. 2020, 17, 523–527. [Google Scholar] [CrossRef] [PubMed]
- Palakurthi, A.K.; Dongala, T.; Katakam, L.N.R. QbD based development of HPLC method for simultaneous quantification of Telmisartan and Hydrochlorothiazide impurities in tablets dosage form. Pract. Lab. Med. 2020, 21, e00169. [Google Scholar] [CrossRef]
- Maslarska, V.; Yankov, V.; Obreshkova, D.; Bozhanov, S. Simultaneous Determination of Sartans by High Performance Liq-uid Chromatography with Ultra Violet Detection. Indian J. Pharm. Educ. Res. 2017, 51, 343–348. [Google Scholar] [CrossRef]
- Attimarad, M.; Sreeharsha, N.; Al-Dhubaib, B.E.; Nair, A.B.; Venugopala, K.N. Capillary Electrophoresis: MEKC assay method for simultaneous determination of olmesartan medopomil, Amlodipine besylate and hydrochlorothiazide in tab-lets. Indian J. Pharm. Educ. Res. 2016, 50, 188–195. [Google Scholar]
- Sivasubramanian, L. Simultaneous Estimation of Irbesartan, Telmisartan, Hydrochlorothiazide and Ramipril in combined dosage forms by Validated HPTLC method. J. Anal. Pharm. Res. 2017, 4, 00112. [Google Scholar] [CrossRef]
- Attimarad, M.; Chohan, M.S.; Elgorashe, R.E.E. Smart analysis of a ternary mixture of amlodipine, hydrochlorothiazide and telmisartan by manipulation of UV spectra: Development, validation and application to formulations. J. Mol. Struct. 2020, 1212, 128095. [Google Scholar] [CrossRef]
- Trang, N.T.Q.; Van Hop, N.; Chau, N.D.G.; Tran, T.B. Simultaneous Determination of Amlodipine, Hydrochlorothiazide, and Valsartan in Pharmaceutical Products by a Combination of Full Spectrum Measurement and Kalman Filter Algorithm. Adv. Mater. Sci. Eng. 2019, 2019, 1–9. [Google Scholar] [CrossRef]
- Kulkarni, P.; Gangrade, D. Simultaneous estimation of hydrochlorothiazide, amlodipine besylate and telmisartan in com-bined tablet dosage form by using RP- HPLC method. Int. J. Pharm. Sci. Res. 2017, 8, 268–276. [Google Scholar] [CrossRef]
- Elkady, E.F.; Mandour, A.A.; Algethami, F.K.; Aboelwafa, A.A.; Farouk, F. Sequential liquid-liquid extraction coupled to LC-MS/MS for simultaneous determination of amlodipine, olmesartan and hydrochlorothiazide in plasma samples: Application to pharmacokinetic studies. Microchem. J. 2020, 155, 104757. [Google Scholar] [CrossRef]
- Patchala, A.; Nadendla, R. Quantification and validation of amlodipine besylate, olmesartan medoxomil and hydrochloro-thiazide by RP-HPLC in marketed dosage form. Int. J. Pharm. Sci. Res. 2020, 11, 2350–2355. [Google Scholar] [CrossRef]
- Nezhadali, A.; Shapouri, M.R.; Amoli-Diva, M.; Hooshangi, A.H.; Khodayari, F. Method development for simultaneous determination of active ingredients in cough and cold pharmaceuticals by high performance liquid chromatography. Heliyon 2019, 5, e02871. [Google Scholar] [CrossRef]
- Ebeid, W.M.; Elkady, E.; Patonay, G.; El-Zaher, A.A.; El-Bagary, R.I. Synchronized separation of seven medications representing most commonly prescribed antihypertensive classes by using reversed-phase liquid chromatography: Application for analysis in their combined formulations. J. Sep. Sci. 2014, 37, 748–757. [Google Scholar] [CrossRef] [PubMed]
- Alothman, Z.A.; Alsheetan, K.M.; Aboul-Enein, H.Y.; Ali, I. Applications of shun shell column and nanocomposite sorbent for analysis of eleven anti-hypertensive in human plasma. J. Chromatogr. B 2020, 1146, 122125. [Google Scholar] [CrossRef]
- Zareh, M.M.; Saad, M.Z.; Hassan, W.S.; Elhennawy, M.E.; Soltan, M.K.; Sebaiy, M.M. Gradient HPLC Method for Simultaneous Determination of Eight Sartan and Statin Drugs in Their Pure and Dosage Forms. Pharmaceuticals 2020, 13, 32. [Google Scholar] [CrossRef]
- Sebaiy, M.M.; Sm, E.-A.; Mm, B.; Aa, H. Analytical Methods for Determination of Certain Sartans and Diuretics. J. Chem. Sci. Chem. Eng. 2020, 1, 11–18. [Google Scholar] [CrossRef]
- Tekkeli, S.E.K. Development of an HPLC-UV Method for the Analysis of Drugs Used for Combined Hypertension Therapy in Pharmaceutical Preparations and Human Plasma. J. Anal. Methods Chem. 2013, 2013, 1–10. [Google Scholar] [CrossRef]
- Celia, C.; Di Marzio, L.; Locatelli, M.; Ramundo, P.; D’Ambrosio, F.; Tartaglia, A. Current Trends in Simultaneous Determination of Co-Administered Drugs. Separations 2020, 7, 29. [Google Scholar] [CrossRef]
- ICH Secretariat. ICH Harmonized Tripartite Guideline. Text on Validation of Analytical Procedures. In Proceedings of the International Conference on Harmonization, Geneva, Switzerland, 27 October 1994; pp. 1–17. [Google Scholar]


Publisher’s Note: MDPI stays neutral with regard to jurisdictional claims in published maps and institutional affiliations. |
© 2021 by the authors. Licensee MDPI, Basel, Switzerland. This article is an open access article distributed under the terms and conditions of the Creative Commons Attribution (CC BY) license (https://creativecommons.org/licenses/by/4.0/).