Communication

An Unmanned Vehicle-Based Remote Raman System for Real-Time Trace Detection and Identification

1
State Key Laboratory of Transient Optics and Photonics, Xi’an 710119, China
2
Xi’an Institute of Optics and Precision Mechanics, Chinese Academy of Sciences, Xi’an 710119, China
3
University of Chinese Academy of Sciences, No. 19 Yuquan Road, Shijingshan District, Beijing 100049, China
4
Science and Technology on Near-Surface Detection Laboratory, Wuxi 214035, China
5
The First Scientific Research Institute of Wuxi, Wuxi 214035, China
6
Key & Core Technology Innovation Institute of the Greater Bay Area, Building B3, No.11 Kaiyuan Avenue, Huangpu District, Guangzhou 510535, China
*
Authors to whom correspondence should be addressed.
Photonics 2023, 10(11), 1230; https://doi.org/10.3390/photonics10111230
Submission received: 16 September 2023 / Revised: 18 October 2023 / Accepted: 1 November 2023 / Published: 3 November 2023
(This article belongs to the Special Issue Technologies and Applications of Spectroscopy)

Abstract

:
Raman spectroscopy is a type of inelastic scattering that provides rich information about a substance based on the coupling of the energy levels of their vibrational and rotational modes with an incident light. It has been applied extensively in many fields. As there is an increasing need for the remote detection of chemicals in planetary exploration and anti-terrorism, it is urgent to develop a compact, easily transportable, and fully automated remote Raman detection system for trace detection and identification of information, with high-level confidence about the target’s composition and conformation in real-time and for real field scenarios. Here, we present an unmanned vehicle-based remote Raman system, which includes a 266 nm air-cooling passive Q-switched nanosecond pulsed laser of high-repetition frequency, a gated ICMOS, and an unmanned vehicle. This system provides good spectral signals from remote distances ranging from 3 m to 10 m for simulating realistic scenarios, such as aluminum plate, woodblock, paperboard, black cloth, and leaves, and even for detected amounts as low as 0.1 mg. Furthermore, a convolutional neural network (CNN)-based algorithm is implemented and packaged into the recognition software to achieve faster and more accurate detection and identification. This prototype offers a proof-of-concept for an unmanned vehicle with accurate remote substance detection in real-time, which can be helpful for remote detection and identification of hazardous gas, explosives, their precursors, and so forth.

1. Introduction

The remote detection of chemicals using laser-based techniques is highly desirable due to increasing planetary exploration activities and anti-terrorism government programs for detecting hazardous chemicals [1,2,3,4]. Remote Raman systems, consisting of an active pulsed laser and a gated detector provide rapid and reliable detection and identification of chemicals, via gating the pulsed Raman echoes. The ability to maintain a distance from the target, while acquiring the spectra, provides good protection for operators or equipment from the potential damage and contaminations, or alterations in the composition of the target. Raman spectroscopy can be performed remotely and provides a very high level of confidence when detecting chemicals through vibrational or rotational modes, which also offers benefits for art, heritage, and restorative biomedicine applications [5,6].
Time-gated remote Raman spectroscopy achieves excellent results, especially compared to a conventional continuous wave (CW) Raman technique, such as the feasibility of daytime measurement, improved immunity to strong fluorescence, and suppression of back-scattering and thermal radiation. Misra et al. demonstrated a remote Raman system utilizing a 35 mJ, 532 nm pulsed laser and a gated intensified charged couple device (ICCD) detector, that realized the capability of measuring the Raman spectra of minerals located at distances in the range of 10–65 m from the telescope. It demonstrated good performance, in comparison to the continuous mode of operation, in reducing the background signal and eliminating the long-lived fluorescence signals from the calcite Raman spectra [7]. Maeda et al. showed good-quality Raman spectra for KNO3 and NH4NO3 from a 430 m standoff distance during daylight, within a detection time of 1–10 s, with a frequency-doubled Nd:YAG pulsed laser and ICCD [8]. Anupam et al. reported on a time-gated Raman system for fast remote detection of various solid and liquid chemicals from a distance of 1752 m during the afternoon on a sunny day. They also demonstrated the feasibility of developing future mid-size remote Raman systems, suitable for long-range chemical detection using helicopters and light airplanes [9]. Gueutue et al. created an optimized time-resolved Raman system, based on a gated detection and a nanosecond pulsed laser excitation, which demonstrated the contactless Raman measurements of some materials (such as zirconia and yttria) at very high temperatures, i.e., up to 2100 °C [10].
Although gated Raman techniques have achieved great success, such systems can have limitations due to their relatively large volume, heavy weight, and the power consumption of the low repetition frequency high-energy pulsed laser (especially for the required water cooler), which is not suitable for portable and unmanned vehicle requirements. Moreover, because of the continued worldwide rise of terrorist activities, it is urgent to develop compact, easily transportable, and fully automated remote Raman detection systems for the trace detection and identification of information with high-level confidence about the target’s composition and conformation in real-time and for real field scenarios [2].
Although there remains a great number of standard spectrum databases for identifying chemicals, it is still a challenge to extract discriminative Raman features accurately and rapidly from a large dataset in real-field scenarios for real-time requirements. Thanks to the development of the recognition algorithms for the Raman spectrum, the efficient classification and identification of substances is feasible [11,12]. Among these algorithms, the convolutional neural network (CNN) acts as one of the state-of-the-art deep learning algorithms, which has been observed to outperform other methods, due to a simpler machine identification system and higher accuracy [13,14,15,16]. Sang et al. developed a 1D-deep CNN for classifying and recognizing hundreds of classes, which attained a higher recognition accuracy and improved performance; it has better applicability to datasets with thousands of classes and imbalanced class distribution [15].
To solve the previously mentioned problems, we first designed a remote Raman spectroscopy scheme with a 266 nm air-cooling passive Q-switched nanosecond pulsed laser with a high-repetition frequency of 3 KHz, which was reasonably miniaturized compared to the low repetition frequency active Q-switched laser. Next, we developed an unmanned vehicle based on a remote Raman detection system via systematic design and integration. We demonstrated that this system could attain a good spectral signal from the tested samples in remote distances ranging from 3 m to 10 m, even for detected amounts as low as 0.1 mg, for the different substrate backgrounds of aluminum plate, woodblock, paperboard, black cloth, or leaves, which simulate realistic scenarios. For real-time identification, a CNN-based algorithm was implemented and packaged into the recognition software, which effectively reduced the acquisition and recognition time. This prototype provides a proof-of-concept for an unmanned vehicle with real-time remote and accurate substance detection, which can be helpful for the remote detection and identification of hazardous gas, explosives, their precursors, and so forth.

2. Methods and Experiment

To attain compactness and effective integration, we designed a remote time-gated Raman system, as shown in Figure 1a, which consists of a 266 nm passive Q-switched nanosecond pulsed laser (CNI, EO-266-N, ~20 μJ per pulse, and pulse width of 9.6 ns at a repetition rate of 3 kHz), a telescope optical system (homemade Cassegrain telescope with primary mirror (radius of curvature 498.596 mm and diameter 130 mm) and secondary mirror (radius of curvature 69.597 mm and diameter 16 mm), and working distance between 2 m and 12 m), a fiber, a photodetector (Thorlabs, Newton, NJ, USA, DET10A2), a spectrometer (homemade CT structure with 3600 lp/mm and <10 cm−1 resolution), a solar-blind ultraviolet ICMOS (Photonis, Roden, The Netherlands, INocturn-U3), a gating module, and a synchronization module. These latter three components constitute a complete time-gated ICMOS, with the ability of gain, gating, and synchronization analogous to commercial ICCD, in which the gating module has a fixed gating width of ~4.8 ns and a synchronization module with an adjustable time range from 0 ns–10 s with minimum steps of about 10 ps. As the pulse is delivered, a small portion of the beam is sampled and delivered to the photodetector, whose rising edge triggers the synchronization and gating modules [17]. The main laser beam is collimated by a beam expansion and reflected by the dichroic filter (Semrock, Rochester, NY, USA, Di01-R266) to the secondary and primary mirrors of the telescope, then converges on the sample. During the Raman pulse echo generation, the telescope collects and delivers the light through a dichroic filter and a long-pass edge filter (Semrock, Rochester, NY, USA, LP02-266RU) to clean up the Rayleigh scattering. Next, the collected light is focused onto the fiber by an off-axis parabolic mirror (Thorlabs, Newton, NJ, USA, MPD119-F01) and is dispersed and detected by the spectrometer and ICMOS camera. In addition, the 266 nm laser has benefits including higher eye-safe characteristics, enhanced Raman signals, and reduced wavelength overlap of the Raman and fluorescence spectra. In time-gated Raman spectroscopy, the temporal interval between the laser pulse and Raman echo is the time-of-flight (TOF) of the light, as shown in Figure 1b, which represents the round-trip optical path between the laser and the detector. The predetermined short-time window of the gated ICMOS is ‘gate on’ only as the Raman echo arrives; the temporal synchronization is achieved by a 30 m silica fiber to compensate for the inherent delay time of the gated ICMOS. The gating response of the gated ICMOS, which is controlled by the applied voltage to the photoelectric cathode, operates at the same frequency as the pulsed laser. Next, gated pulsed signals accumulate for a single frame exposure, which occurs because the pulsed laser repetition rate is higher than the frame frequency [17,18]. In this work, we set the frame rate of the ICMOS as 50 fps, and the frames accumulation as 1000 for single data acquisition. Afterwards, the system operates in burst mode to accumulate 60 pulses on average for every single frame exposure. Finally, we introduced a tracked unmanned vehicle for transportable and convenient remote detection. The proposed unmanned vehicle-based remote Raman system also incorporates a rotating stage, motion handle, and a tablet computer—as shown in Figure 1c. A photograph of the designed unmanned vehicle-based remote Raman system is displayed in Figure 1d.

3. Results and Discussion

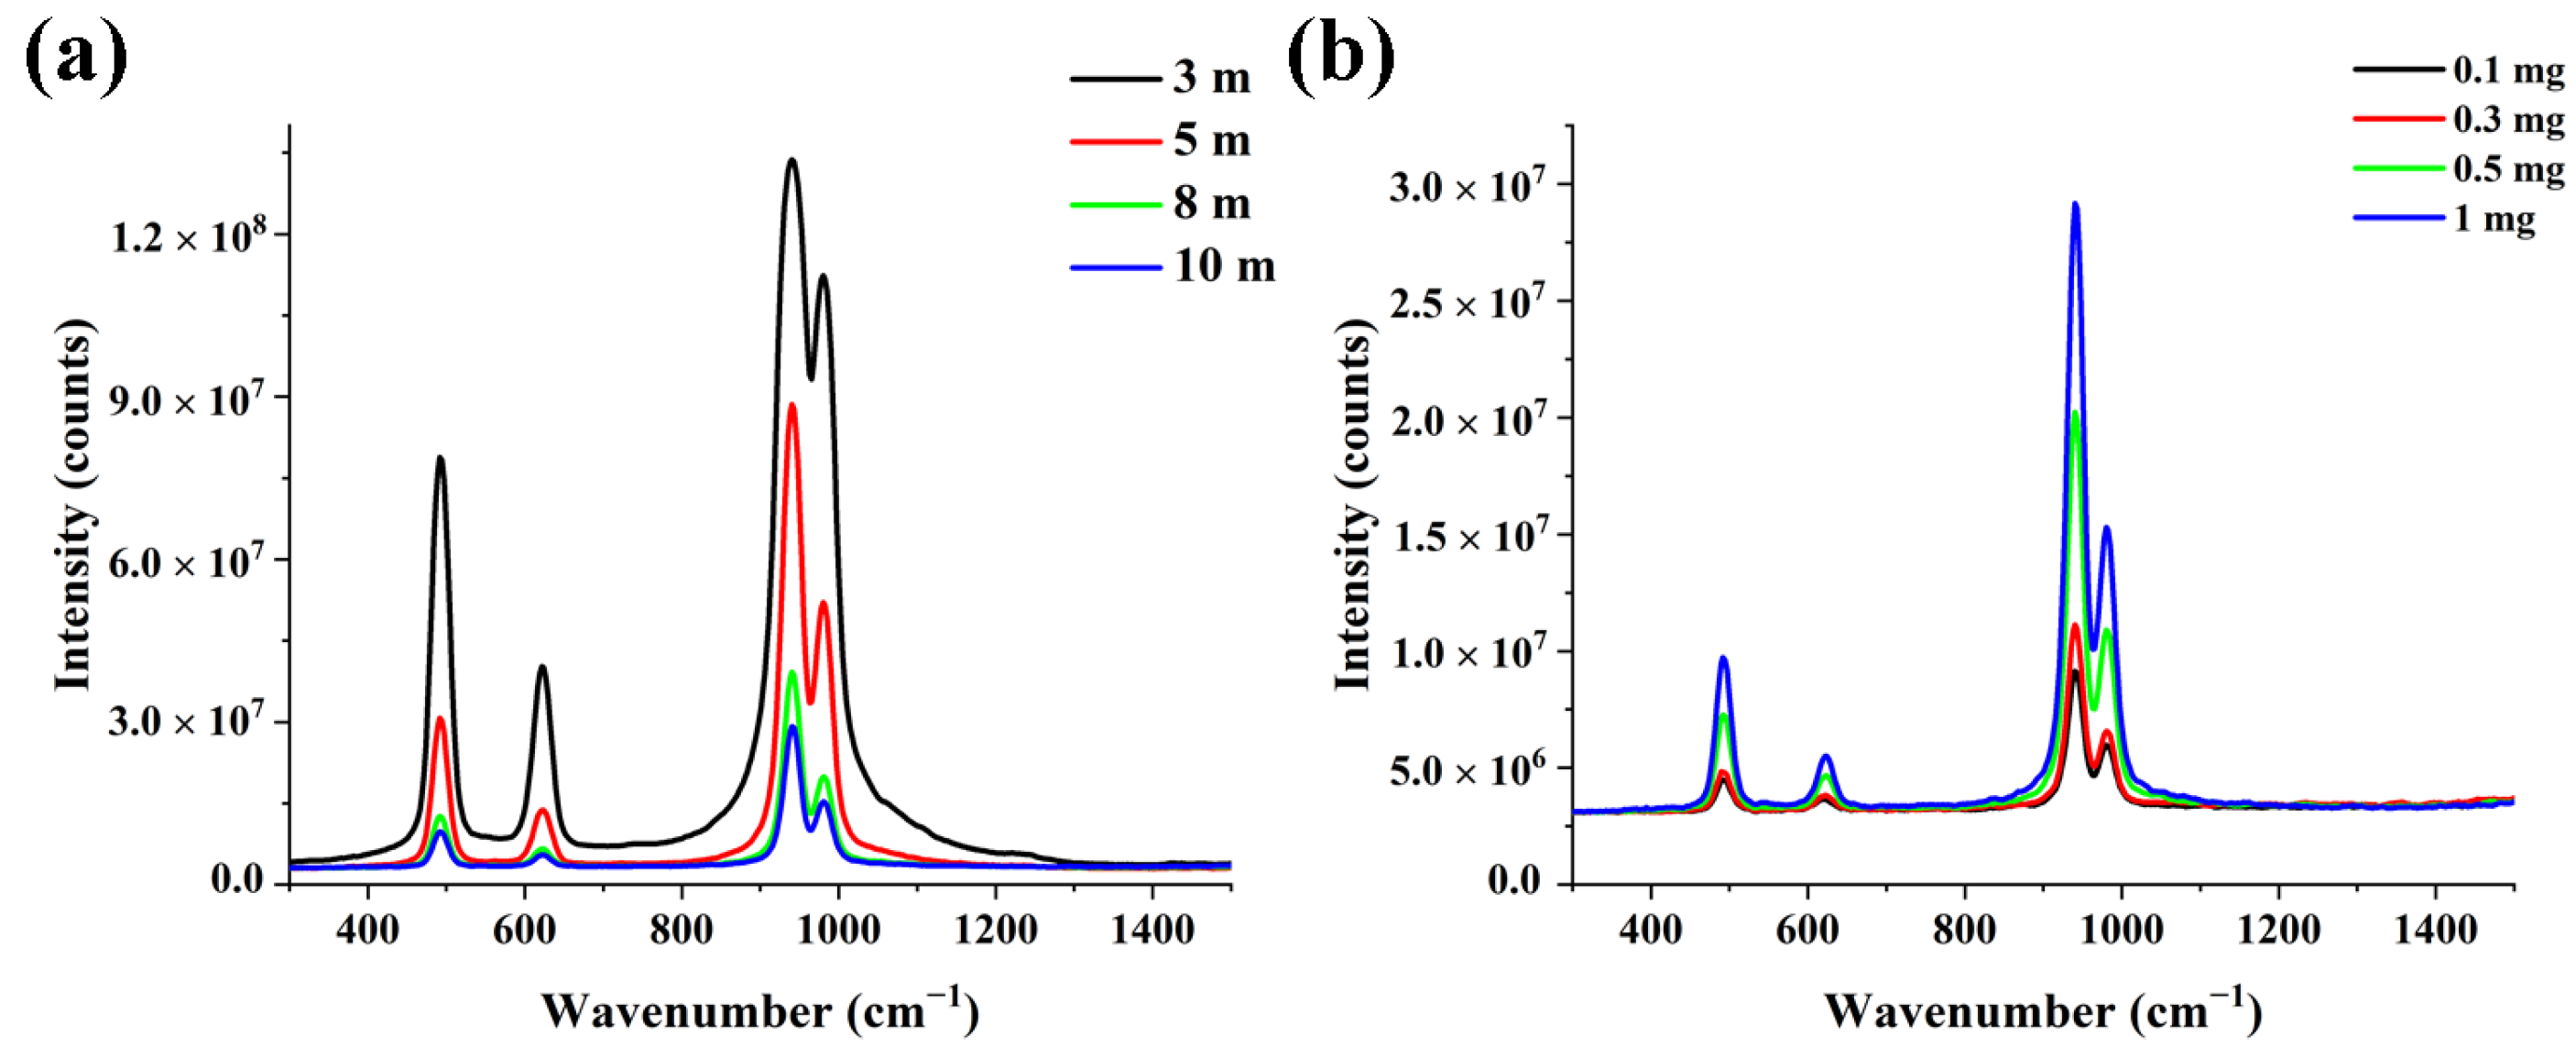
For initial demonstration verification, we first prepared 1 mg of potassium chlorate (KClO3) on an aluminum plate to acquire the Raman signal from the distant targets. Since the signal background fluctuation is relatively high for long-term acquisition, especially the noise from the thermal electron gain of the intensifier of the ICMOS when a high voltage is applied onto the microchannel plate (leading to difficulties for the spectral feature recognition with the weak signal measurement), we recorded the mean data value from the 10 acquisitions of the presentation. As shown in Figure 2a, high-quality Raman spectra for 1 mg of KClO3 on an aluminum plate at distances of 3 m, 5 m, 6 m, 8 m, and 10 m were achieved. The most intense Raman peaks are clearly visible for the wavenumber 939 cm−1 (i.e., corresponding to a Cl–O full symmetric stretching vibration) and 982 cm−1 (a Cl–O anti-symmetric stretching vibration). The other two spectral characteristic peak positions are located at 493 cm−1 and 621 cm−1, which belong to the Cl–O bending vibration and the Cl–O umbrella vibration, respectively [19]. The samples of the KClO3 with the amounts of 0.1 mg, 0.3 mg, and 0.5 mg are also detected for a 10 m remote distance, as shown in Figure 2b.
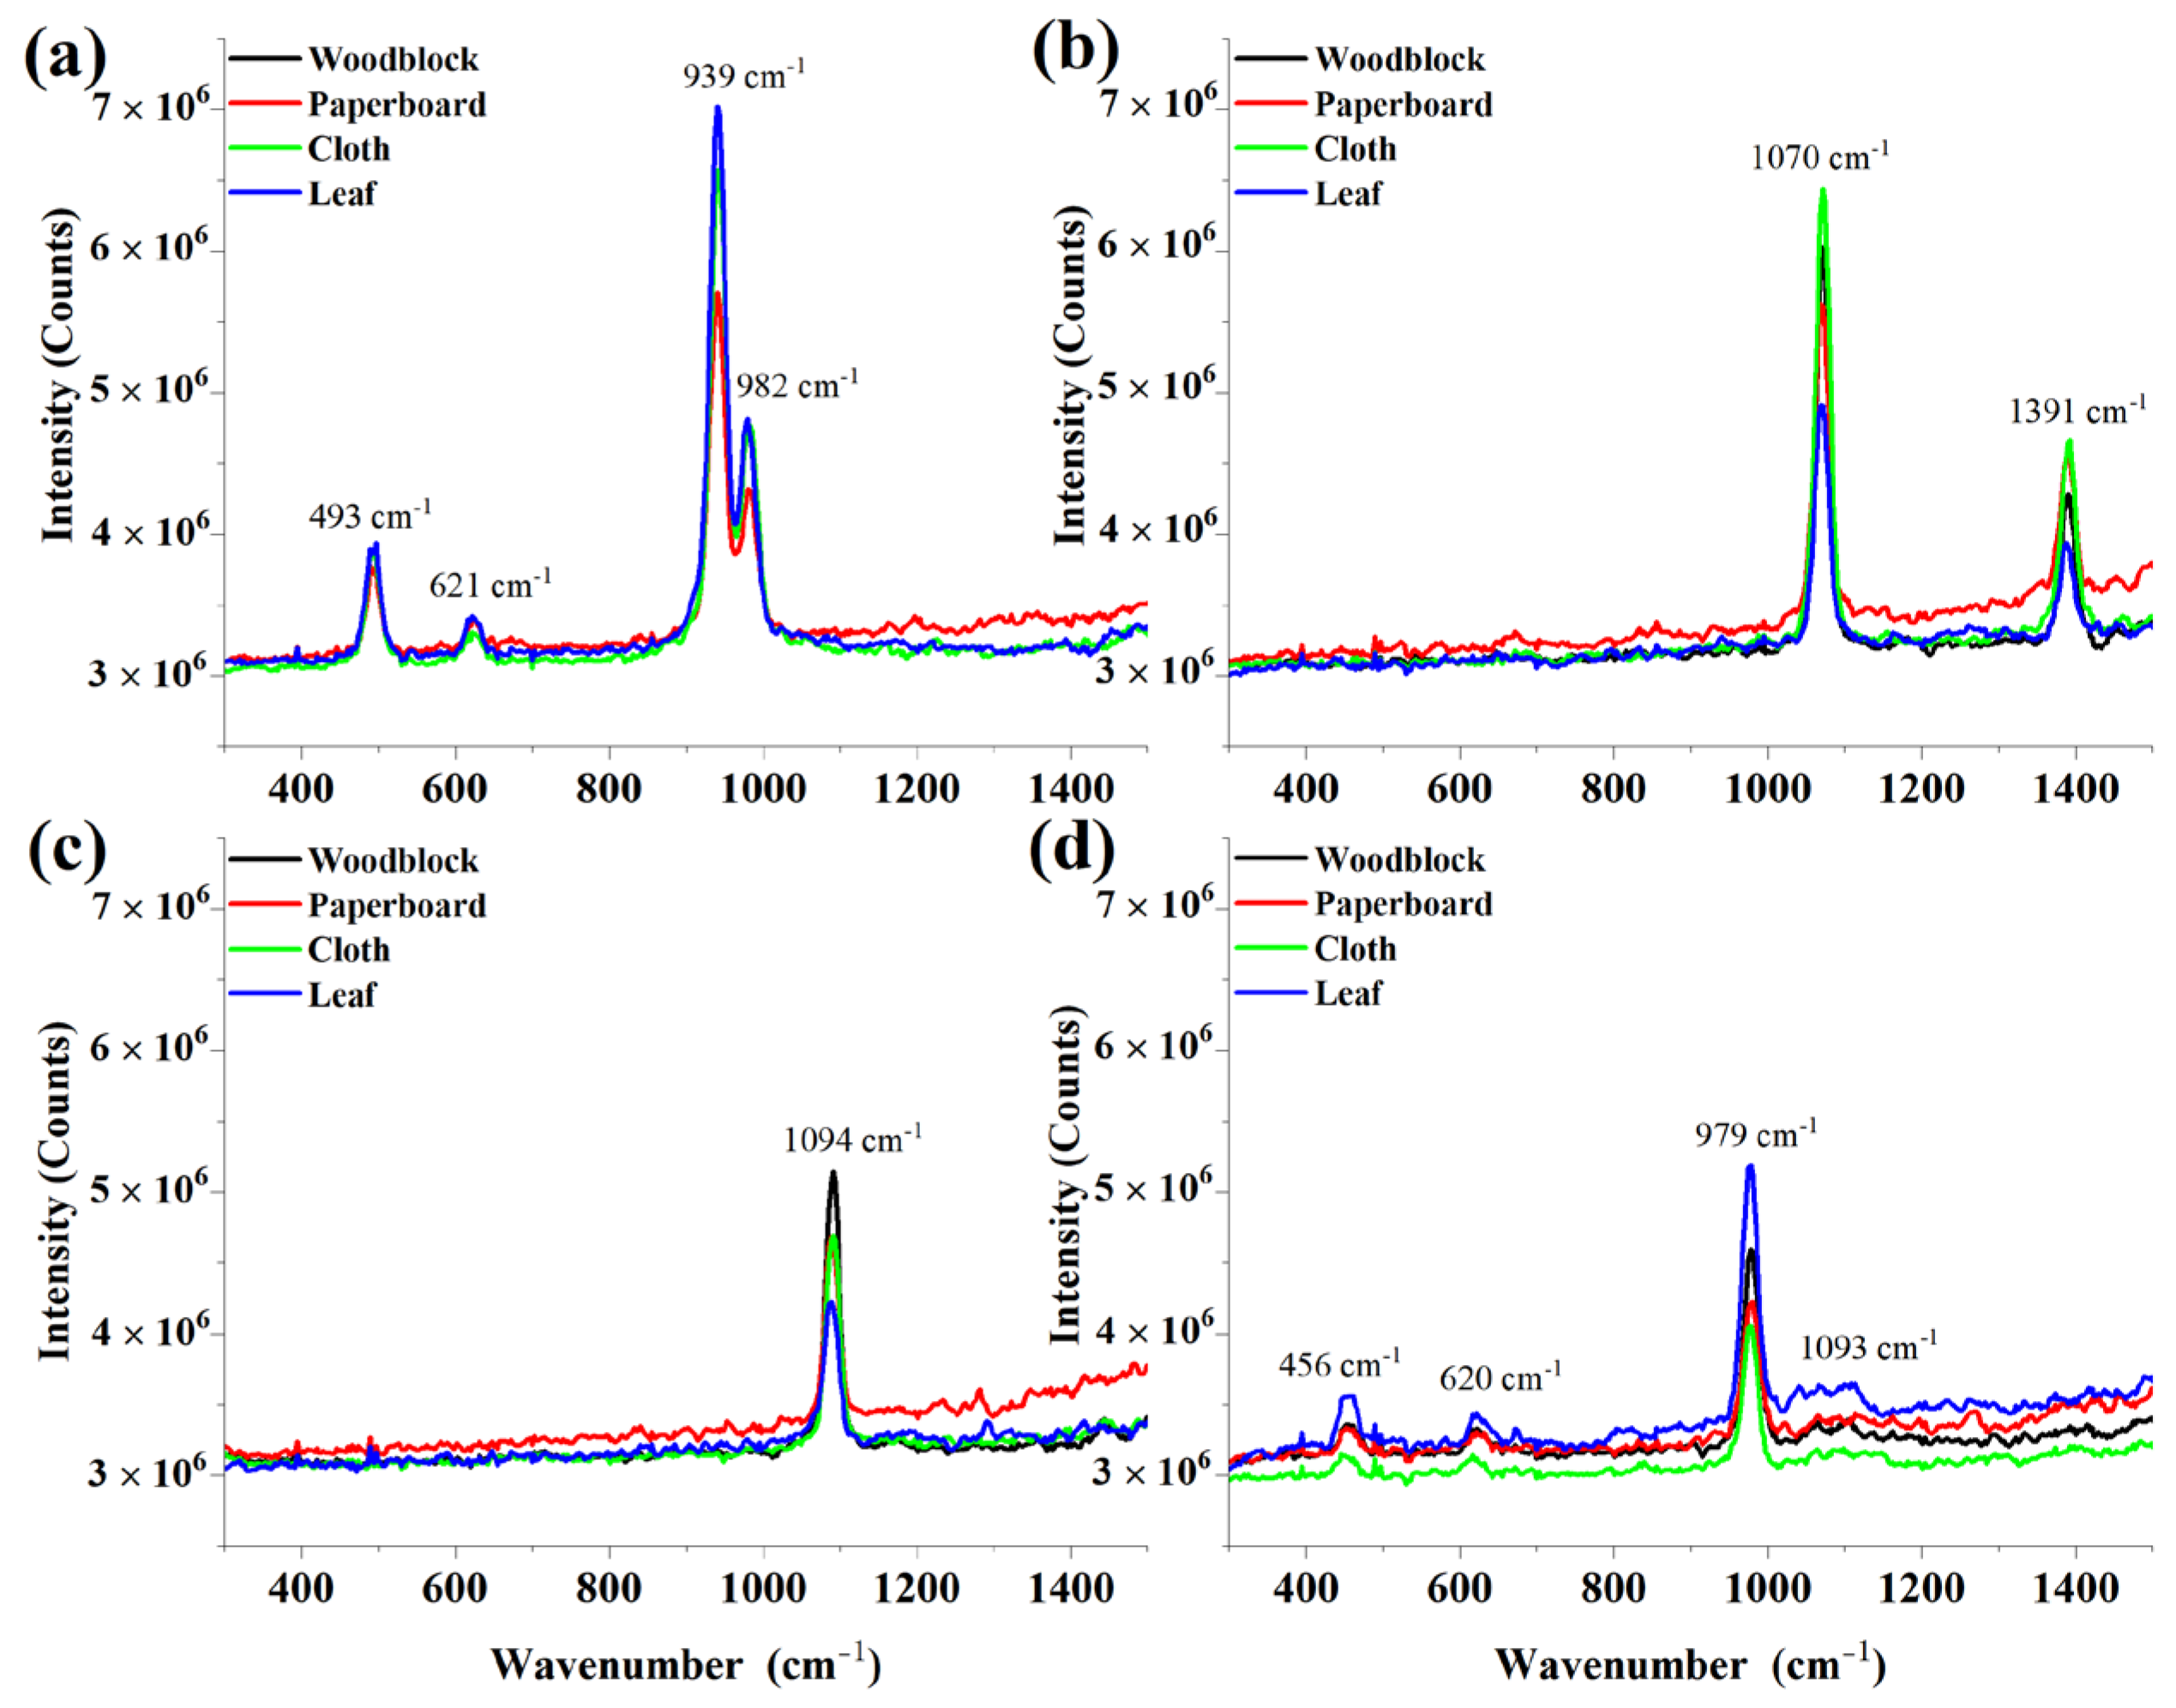
To simulate realistic encounters in a possible scenario, we prepared different amounts of potassium chlorate (KClO3), sodium nitrate (NaNO3), calcium carbonate (CaCO3), and ammonium sulfate (NH4)2SO4) samples on woodblock, paperboard, black cloth, and leaf, the photographs of which are shown in Figure S1 of the Supplementary Materials section. Here, we present the remote Raman spectra for 0.1 mg of these samples on different substrates at a distance of 10 m, as shown in Figure 3a–d. The four distinct Raman vibrations of KClO3 remain intact, as is observable from Figure 3a. The N–O symmetric stretching vibration (located at 1070 cm−1) and the N–O anti-symmetric stretching vibration (seen at 1391 cm−1) for NaNO3 are clearly distinguishable in Figure 3b [20]. As displayed in Figure 3c, the C–O bending vibration of CaCO3 at 1092 cm−1 is a good indicator for its identification, but the C–O symmetric stretching vibration at 720 cm−1 and the C–O anti-symmetric stretching vibration at 1442 cm−1 of CaCO3 are not observed for the amount of 0.1 mg [21]. The discriminative Raman features can easily be extracted from the Raman spectra of (NH4)2SO4. For the latter, as seen in Figure 3d, the strongest intensity vibration at 979 cm−1 belongs to the S–O symmetric stretching vibration, and 456 cm−1 (the S–O bending vibration), 620 cm−1 (the S–O rocking vibration), and 1093 cm−1 (the S–O anti-symmetric stretching vibration) are also recognizable, as depicted in Figure 3d [22]. Additionally, we present mean Raman spectra for 0.3 mg, 0.5 mg, and 1 mg of KClO3 (Figure S2), NaNO3 (Figure S3), CaCO3 (Figure S4) and (NH4)2SO4 (Figure S5) on different substrates in the Supplementary Materials section.
As mentioned previously, due to noise occurring at the ICMOS detector, there were fluctuations in the various measurements, especially for traces at remote distances. The latter is shown in Figure 4a, which depicts Raman spectra for 0.1 mg (NH4)2SO4 on paperboard substrate with a 10 m distance, in which the difficulty when precisely manually discriminating the chemicals can be seen. The denoised data for a single acquisition is shown in Figure 4b, represented as a red line, which appears to be more accurate than the mean data. However, false peaks appear (i.e., at 908 cm−1, 1092 cm−1, 1144 cm−1, and 1296 cm−1), as denoted by the red arrows in Figure 4b, which may mislead the operator’s determination of the chemicals.
To achieve real-time detection and exact identification, a CNN-based method, using software developed with the Python language, was integrated and packaged onto the tablet computer. The input layer of the relevant neural network was a vector with a size of 1280; the hidden layer consisted of 5 convolutional blocks. The training and optimization of the CNN depends on the Adam algorithm, which is an extension of gradient descent. The Adam algorithm is an adaptive learning rate optimization algorithm that can adaptively adjust the learning rate based on the gradient of different parameters, thereby improving the training efficiency and model performance. In this work, the predictions were compared with the true values by means of an error function. In our model, the cross-entropy loss function was used to determine the difference between the true and predicted distributions, and the learning rate was set to 0.001, with a batch size of 128 used. The final output map was fed into the fully connected layers to learn non-linear combinations for the extracted features. Next, the output layer obtained the features learnt by the model to calculate the input’s classification scores for each possible category. The Raman spectral data of the tested samples were acquired by our designed remote Raman system; the initial database included 3200 spectra (four (substance types) × five (substrate types) × four (distances) × four (amounts) × ten (times of the measurement)). The measured dataset was randomly shuffled and then divided into a training set, a test set, and a validation set, according to a ratio of 8:1:1. Examining the single acquisition of Figure 4a, for example, the matched accuracy is around 98.16% for the developed CNN model. The real-time recognition software interface based on CNN, for the detection of 0.1 mg (NH4)2SO4 on paperboard substrate at a 10 m distance, is shown in Figure 4c.

4. Conclusions

In conclusion, we have systematically designed and optimized a form of unmanned vehicle-based remote Raman system, which consists of a 266 nm passive Q-switched pulsed laser, a telescope optical system, a fiber, a photodetector, a homemade spectrometer, a solar-blind ultraviolet ICMOS, a gating module, and a synchronization module. The remote Raman-pulsed echo signal was acquired by synchronizing the time sequence between the PD triggered by the laser and the gated ICMOS through a 30 m fiber delay line. We have presented the Raman spectra for trace substances on an aluminum plate, woodblock, paperboard, black cloth, and leaf at remote distances. There still remains excellent spectral discriminability, even for detected amounts as low as 0.1 mg at a distance of 10 m. Furthermore, a CNN-based method that uses software developed using the Python language was integrated and packaged onto the tablet computer to create real-time detection and exact identification. The proposed prototype provides a proof-of-concept for an unmanned vehicle with accurate remote substance detection in real-time, for which important potential applications are planetary exploration, anti-terrorism government programs, heritage, and so forth.

Supplementary Materials

The following supporting information can be downloaded at https://www.mdpi.com/article/10.3390/photonics10111230/s1. Figure S1: photographs of the samples; Figure S2: mean Raman spectra for 0.3 mg, 0.5 mg, and 1 mg of KClO3 on different substrates; Figure S3: mean Raman spectra for 0.3 mg, 0.5 mg, and 1 mg of NaNO3 on different substrates; Figure S4: mean Raman spectra for 0.3 mg, 0.5 mg, and 1 mg of CaCO3 on different substrates; Figure S5: mean Raman spectra for 0.3 mg, 0.5 mg, and 1 mg of (NH4)2SO4 on different substrates.

Author Contributions

Conceptualization: W.R., X.Z. and W.Z.; methodology: W.Z. and X.Z.; software: B.W.; validation: W.R., Z.X. and H.W.; formal analysis: W.Z. and Z.X.; investigation: W.Z. and H.W.; resources: W.Z. and B.W.; data curation: W.R.; writing—original draft preparation: W.R.; writing—review and editing: W.R.; visualization: W.R.; supervision: H.W. and X.Z.; project administration: X.Z. and W.Z.; funding acquisition: H.W., X.Z. and W.Z. All authors have read and agreed to the published version of the manuscript.

Funding

This research was funded by Guangdong Province Key R&D Program under Grant 2019B090917012, The Stabilization Supporting Project of Science and Technology on Near-Surface Detection Laboratory under Grant 6142414200714, the Research and Development Project of Scientific Research Instruments and Equipment of Chinese Academy of Sciences under Grant ZDKYYQ20220007, the Major Scientific Research Instrument Development Project of the National Natural Science Foundation of China under Grant 52127817, and the Key Deployment Projects of Chinese Academy of Sciences under Grant ZDRW-XH-2021-6.

Institutional Review Board Statement

Not applicable.

Informed Consent Statement

Not applicable.

Data Availability Statement

MDPI Research Data Policies.

Acknowledgments

Wenzhen Ren is thankful for the assistance of Ke Lin (Xidian University, China) during the band assignments of the Raman spectra.

Conflicts of Interest

The authors declare no conflict of interest.

References

  1. Misra, A.K.; Acosta-Maeda, T.E.; Porter, J.N.; Berlanga, G.; Muchow, D.; Sharma, S.K.; Chee, B. A Two Components Approach for Long Range Remote Raman and Laser-Induced Breakdown (LIBS) Spectroscopy Using Low Laser Pulse Energy. Appl. Spectrosc. 2019, 73, 320–328. [Google Scholar] [CrossRef] [PubMed]
  2. Cantu, L.M.L.; Gallo, E.C.A. Explosives and warfare agents remote Raman detection on realistic background samples. Eur. Phys. J. Plus 2022, 137, 207. [Google Scholar] [CrossRef]
  3. Angel, S.M.; Gomer, N.R.; Sharma, S.K.; McKay, C. Remote Raman Spectroscopy for Planetary Exploration: A Review. Appl. Spectrosc. 2012, 66, 137–150. [Google Scholar] [CrossRef] [PubMed]
  4. Giordano, D.; Russell, J.K.; Gonzalez-Garcia, D.; Bersani, D.; Dingwell, D.B.; Del Negro, C. Raman Spectroscopy from Laboratory and Proximal to Remote Sensing: A Tool for the Volcanological Sciences. Remote Sens. 2020, 12, 805. [Google Scholar] [CrossRef]
  5. Li, Y.; Suzuki, A.; Cheung, C.S.; Gu, Y.; Kogou, S.; Liang, H. A study of potential laser-induced degradation in remote standoff Raman spectroscopy for wall paintings. Eur. Phys. J. Plus 2022, 137, 1102. [Google Scholar] [CrossRef]
  6. Corden, C.; Boitor, R.; Notingher, I. Time-gated Raman spectroscopy for biomedical application under ambient or strong background light conditions. J. Phys. D Appl. Phys. 2021, 54, 504003. [Google Scholar] [CrossRef]
  7. Misra, A.K.; Sharma, S.K.; Chio, C.H.; Lucey, P.G.; Lienert, B. Pulsed remote Raman system for daytime measurements of mineral spectra. Spectrochim. Acta Part A Mol. Biomol. Spectrosc. 2005, 61, 2281–2287. [Google Scholar] [CrossRef]
  8. Acosta-Maeda, T.E.; Misra, A.K.; Muzangwa, L.G.; Berlanga, G.; Muchow, D.; Porter, J.; Sharma, S.K. Remote Raman measurements of minerals, organics, and inorganics at 430 m range. Appl. Opt. 2016, 55, 10283–10289. [Google Scholar] [CrossRef]
  9. Misra, A.K.; Acosta-Maeda, T.E.; Porter, J.N.; Egan, M.J.; Sandford, M.W.; Oyama, T.; Zhou, J. Remote Raman Detection of Chemicals from 1752 m During Afternoon Daylight. Appl. Spectrosc. 2020, 74, 233–240. [Google Scholar] [CrossRef]
  10. Gueutue, E.S.F.; Canizares, A.; Simon, P.; Raimboux, N.; Hennet, L.; Ammar, M.R. Nanosecond time-resolved Raman spectroscopy for solving some Raman problems such as luminescence or thermal emission. J. Raman Spectrosc. 2018, 49, 822–829. [Google Scholar] [CrossRef]
  11. Post, C.; Brulisauer, S.; Waldschlaeger, K.; Hug, W.; Grueneis, L.; Heyden, N.; Schmor, S.; Foerderer, A.; Reid, R.; Reid, M.; et al. Application of Laser-Induced, Deep UV Raman Spectroscopy and Artificial Intelligence in Real-Time Environmental Monitoring-Solutions and First Results. Sensors 2021, 2, 3911. [Google Scholar] [CrossRef] [PubMed]
  12. Hollon, T.C.; Pandian, B.; Adapa, A.R.; Urias, E.; Save, A.V.; Khalsa, S.S.S.; Eichberg, D.G.; D’Amico, R.S.; Farooq, Z.U.; Lewis, S.; et al. Near real-time intraoperative brain tumor diagnosis using stimulated Raman histology and deep neural networks. Nat. Med. 2020, 26, 52. [Google Scholar] [CrossRef] [PubMed]
  13. Yan, H.; Yu, M.; Xia, J.; Zhu, L.; Zhang, T.; Zhu, Z.; Sun, G. Diverse Region-Based CNN for Tongue Squamous Cell Carcinoma Classification With Raman Spectroscopy. IEEE Access 2020, 8, 127313–127328. [Google Scholar] [CrossRef]
  14. Zhou, W.; Tang, Y.; Qian, Z.; Wang, J.; Guo, H. Deeply-recursive convolutional neural network for Raman spectra identification. RSC Adv. 2022, 12, 5053–5061. [Google Scholar] [CrossRef]
  15. Sang, X.; Zhou, R.-G.; Li, Y.; Xiong, S. One-Dimensional Deep Convolutional Neural Network for Mineral Classification from Raman Spectroscopy. Neural Process. Lett. 2022, 54, 677–690. [Google Scholar] [CrossRef]
  16. Fuentes, A.M.M.; Narayan, A.; Milligan, K.; Lum, J.J.J.; Brolo, A.G.G.; Andrews, J.L.L.; Jirasek, A. Raman spectroscopy and convolutional neural networks for monitoring biochemical radiation response in breast tumour xenografts. Sci. Rep. 2023, 13, 1530. [Google Scholar] [CrossRef]
  17. Blacksberg, J.; Alerstam, E.; Maruyama, Y.; Cochrane, C.J.; Rossman, G.R. Miniaturized time-resolved Raman spectrometer for planetary science based on a fast single photon avalanche diode detector array. Appl. Opt. 2016, 55, 739–748. [Google Scholar] [CrossRef]
  18. Li, Z.; Deen, M.J.; Kumar, S.; Selvaganapathy, P.R. Raman Spectroscopy for In-Line Water Quality Monitoring—Instrumentation and Potential. Sensors 2014, 14, 17275–17303. [Google Scholar] [CrossRef]
  19. Brooker, M.H.; Shapter, J.G. Raman Studies of the Phase-Transition in KClO3. J. Phys. Chem. Solids 1989, 50, 1087–1094. [Google Scholar] [CrossRef]
  20. Ghosh, M.; Wang, L.; Asher, S.A. Deep-Ultraviolet Resonance Raman Excitation Profiles of NH4NO3, PETN, TNT, HMX, and RDX. Appl. Spectrosc. 2012, 66, 1013–1021. [Google Scholar] [CrossRef]
  21. De La Pierre, M.; Carteret, C.; Maschio, L.; Andre, E.; Orlando, R.; Dovesi, R. The Raman spectrum of CaCO3 polymorphs calcite and aragonite: A combined experimental and computational study. J. Chem. Phys. 2014, 140, 164509. [Google Scholar] [CrossRef] [PubMed]
  22. Qiu, J.; Li, X.; Qi, X. Raman Spectroscopic Investigation of Sulfates Using Mosaic Grating Spatial Heterodyne Raman Spectrometer. IEEE Photonics J. 2019, 11, 6802612. [Google Scholar] [CrossRef]
Figure 1. (a) Schematic of time-gated remote Raman spectroscopy, in which the blue lines from the laser to the sample indicate the light’s direction before sample excitation and the green lines from the sample to the fiber indicate the direction for the light collection. The initials NF denote the narrow-band filter, LC signifies the laser collimator, DF is the dichroic filter, SM is the secondary mirror, PM is the primary mirror, LF is the long-pass edge filter, SyncM is the synchronization module, GM is the gating module and OPM is the off-axis parabolic mirror. The blue light indicates the excited laser, and the green line indicates Raman signals. (b) Temporal sequence for the laser pulse, pulsed-Raman echo, gating sequence, and single frame exposure of the ICMOS. (c) Structure composition diagram of the proposed unmanned vehicle-based remote Raman system. (d) Photograph of the designed unmanned vehicle-based remote Raman system, where a 600 mm steel ruler is used as a reference.
Photonics 10 01230 g001
Figure 2. (a) Mean Raman spectra for 1 mg of KClO3 on an aluminum plate at distances of 3 m (black line), 5 m (red), 8 m (green), and 10 m (blue). (b) Mean Raman spectra for 0.1 mg (black), 0.3 mg (red), 0.5 mg (green), and 1 mg (blue) of KClO3 on an aluminum plate at a distance of 10 m.
Photonics 10 01230 g002
Figure 3. Mean Raman spectra for 0.1 mg of (a) KClO3, (b) NaNO3, (c) CaCO3, and (d) (NH4)2SO4 on an aluminum plate with woodblock (black line), paperboard (red), cloth (green), and leaves (blue) substrate for a 10 m remote distance.
Photonics 10 01230 g003
Figure 4. (a) Raw Raman spectral data for the 10 single acquisitions. (b) Comparison between the mean data of the 10 acquisitions (black line) and the denoised data for a single acquisition (red). (c) Real-time recognition software interface based on CNN for the detection of 0.1 mg (NH4)2SO4 on a paperboard substrate at a distance of 10 m.
Photonics 10 01230 g004
Disclaimer/Publisher’s Note: The statements, opinions and data contained in all publications are solely those of the individual author(s) and contributor(s) and not of MDPI and/or the editor(s). MDPI and/or the editor(s) disclaim responsibility for any injury to people or property resulting from any ideas, methods, instructions or products referred to in the content.