Abstract
No membranous optical sensors have excellent development prospects in aerospace and other industrial fields due to their small size and anti-electromagnetic interference. Here, we proposed a novel Fabry–Pérot (FP) cavity acoustic sensor based on silicon optical waveguide Bragg gratings. The FP cavity consists of two Bragg gratings written on the silicon-based optical waveguide and a miniature air groove. When the sound signal acts on the miniature air groove, the sound pressure changes the density of air molecules near the waveguide grating’s evanescent field, causing variation in the air’s refractive index. This results in a shift in the reflection spectrum of the FP cavity to detect the sound signal. The effects of the grating period, grating pitch quantity, and groove depth of the FP cavity on acoustic sensing were studied. The modelling predicts that the sensing sensitivity could be 0.4 nm/Pa. Theoretically, the compact self-designed acoustic sensor can withstand temperatures above 800 °C. Therefore, it has significant potential applications in precision measurement in high-temperature and high-pressure environments.
1. Introduction
Sound waves as a carrier to transmit information and energy have extensive applications in aerospace, metallurgy, oil exploration, and other fields. In particular, the detection of acoustic signals is very important for the development of information technology. In recent years, the research focus of acoustic sensors has developed from electroacoustic sensing technology to photoacoustic sensing technology [1,2].
In 1880, Bell et al. proposed the concept of an “optical telephone” and realized the optical detection of acoustic signals for the first time [3]. Due to technical and material limitations, the development of fiber-optic acoustic sensing was slow until the 1970s [4,5]. As early as 1977, Nelson et al. used an optical fiber bent into a “U” shape and fixed it to a film at the bending position. The film was deformed by an acoustic wave, which in turn slightly bent the optical fiber to detect the acoustic signal [6]. Bucaro et al. first proposed a fiber-optic hydrophone based on a Mach–Zehnder interferometer (MZI), which achieved a minimum detection sound pressure of 0.1 Pa [7]. In 1991, Garthe built an acoustic signal detection device with a single-mode fiber, reflective film, and self-focused lens [8]. In 1996, Webb et al. reported an acoustic sensor based on fiber Bragg grating (FBG) for the first time, which realized the acoustic detection of 950 kHz in water by detecting the wavelength change in light reflected by FBG [9]. In 2000, Takahashi et al. conducted the detection of the transmission wavelength of FBG hydrophones [10]. In 2018, Li et al. proposed a miniature flexible FBG sound sensor. The wavelength sensitivity caused by sound pressure is 0.041 nm/Pa [11]. In 2019, Zhang et al. proposed a high-sensitivity static pressure balanced microphone based on FBG, which achieved detection capability of the mPa level through interferometric demodulation [12]. Constrained by their own structure, they cannot achieve a major breakthrough in a short period. Later, acoustic sensors with vibrating membrane structures were invented. In 2005, Xu et al. proposed an FP sensor with a SiC diaphragm to improve the sensor performance [13,14]. In 2013, Ma et al. realized an acoustic sensor with a graphene pressure-sensitive diaphragm in the range of 0.2–22 kHz [15]. In 2014, Xu et al. realized acoustic detection by inserting a high-sensitivity nano-silver film probe into the interference arm [16]. The acoustic pressure response sensitivity was 160 nm/Pa. In 2015, Ma et al. proposed a new silicon fiber optic acoustic sensor based on a diaphragm probe, which improved the frequency response range of the acoustic sensor in air [17]. In 2016, Bandutunga et al. proposed a diaphragm-structure-based FBG FP cavity microphone, achieving a sound pressure detection of 74 μPa/Hz at 1 kHz [18]. In 2018, Ni et al. proposed an ultra-low-voltage acoustic sensor with a parylene diaphragm and stainless steel sleeve [19]. In the same year, Luo et al. proposed a fiber laser microphone based on a copper diaphragm with a minimum measurable sound pressure of about 30 μPa/Hz [20]. In 2020, Qi et al. and Zhang et al. proposed flywheel- and gold-diaphragm-based FP interference fiber acoustic sensors, respectively, and achieved a good sensing performance [21,22]. Although the sensors based on thin-film structures can achieve higher sensitivity, the thin film will peel off and its properties will change when the temperature exceeds 300 °C. To measure the sound signal at high temperature, an acoustic sensor with a membraneless structure was proposed. In 2010, Ballard et al. demonstrated that a simple FBG-FP cavity can serve as a transducer for the detection of audio frequency vibrations [23]. In 2011, Fischer et al. proposed an FP fiber optic acoustic sensor [24]. The sensor contains no membranes or mechanical parts and achieves an acoustic detection sensitivity of 80 mV/Pa. Recently, Zhao et al. proposed a miniature membraneless optical fiber acoustic sensor based on a rigid FP cavity [25]. A maximum sensitivity of 491.2 mV/Pa is achieved at 200 °C, which is limited by the temperature resistance of the high-reflectivity dielectric films at both ends of the FP cavity. In 2014, Wang et al. proposed a micro FBG-FP underwater ultrasonics sensor, which presents high sensitivity and acts as a promising candidate for photoacoustic imaging [26]. In 2020, Gao et al. proposed a high-finesse fiber FP micro-cavity active acoustic sensor, which transformed the acoustic pressure to beat signals through a delay-arm interferometer and direct detection by a photodetector. The sensing device exhibits a high sensitivity of 2.6 V/Pa and a noise equivalent acoustic signal level of 230 µPa/Hz1/2 at 4 kHz [27]. In 2022, Wu et al. proposed a fiber acoustic wave transducer with a stable operating point based on a photo-thermal cavity. Experimental results showed that the manufactured sensor sample had a tuning coefficient of about 0.2 pm/mW, which was more suitable for in situ detecting in the application of bioimaging and underwater sonar [28]. Similarly, for the acoustic sensors based on silica fiber, the commercial fiber coating is mainly made of polyimide material with a maximum temperature resistance of only 300 °C. In recent years, sapphire fiber has gained people’s attention due to its excellent high-temperature resistance [29]. However, sapphire is expensive and difficult to process, and the process technology of large-area grating is not mature. Additionally, the minimum core diameter of common sapphire fiber in the market is 60 μm, and the sapphire fiber has too many modes that interfere with acoustic signal detection.
Here, considering that the silicon optical waveguide is inexpensive and commercial and the process technology is very mature, we propose an acoustic sensor based on a silicon optical waveguide Fabry–Pérot cavity (OWG-FPC). The FP cavity sensing unit consists of two sets of Bragg gratings with a withstand temperature above 800 °C. The sound signal is detected by the variation in the air refractive index in an air groove of OWG-FPC caused by the sound pressure. We study the effects of the grating period, grating pitch quantity, and groove depth of the sensor on acoustic sensing. The integrated acoustic sensing structure has high sensitivity by optimizing the parameters of the gratings. In this study, the waveguide grating FP cavity is coupled with gold-plated fiber, which is designed to significantly improve the withstanding temperature of the sensor. The self-designed acoustic sensor based on silicon OWG-FPC has potential applications under high-temperature and high-pressure environments due to its small size, portability, ease of reuse, and low price.
2. Structural Design and Principle
2.1. Structural Design
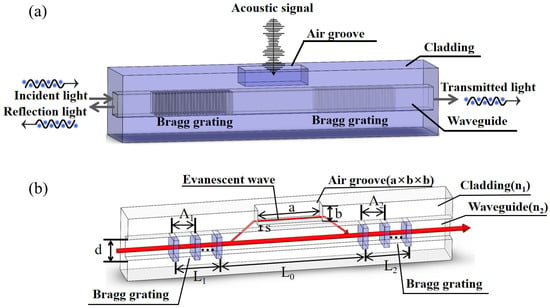
The OWG-FPC is composed of two Bragg gratings with a specific interval as reflecting surfaces of the FP cavity, and the three-dimensional structure of the self-designed silicon OWG-FPC is shown in Figure 1a. It is composed of a miniature air groove and two Bragg gratings with a specific interval. The sectional view of the silicon-based OWG-FPC is shown in Figure 1b, where the sizes of the core layer and the air groove are d × d and a × b × b, respectively, and the gap between them is s.
Figure 1.
(a) The schematic diagram of the three-dimensional structure of silicon-based OWG-FPC, which is composed of a cladding layer and waveguide. The waveguide is inscribed with two gratings, the cladding layer is inscribed with a miniature air groove (a × b × b), and the incident light is a broad-spectrum light source. (b) The sectional view of silicon-based OWG-FPC. The red arrow is the route of light transmission. When the external sound signal acts on the miniature air groove, the evanescent wave transmitted from the waveguide into the air groove will change, causing a shift in the spectrum.
The material of the cladding layer is silicon dioxide, and the core layer is germanium-doped silicon dioxide. As the overall structure is made of silica single crystal, the homogeneous material integration structure can eliminate the stress mismatch and ensure the high reliability of the sensor under high temperatures.
The refractive index of the core layer is higher than that of the cladding layer. Based on the total reflection principle, when light travels in the optical waveguide, it is reflected at the interface between the waveguide core layer and the cladding layer. Almost all the light travels in the core layer, but some light will enter the cladding layer, which is called the evanescent wave. The evanescent wave travels a short distance and enters the core layer again, which can be used to sense acoustic signals.
2.2. Fabry–Pérot Cavity Based on Bragg Gratings
The incident light is only reflected within the Bragg bandwidth. Due to multi-beam interference in the FP cavity, it has more abundant resonant spectral lines within the Bragg reflection bandwidth. Supposing the periods of the two Bragg gratings are and , their lengths are and , and the pitch between them is (the length of the FP cavity). The reflection and transmission coefficients are and , and , respectively. The effective cavity length of the resonator is ; its reflection coefficient can thus be expressed as [30,31,32]:
where , , and n and λ are the air refractive index and incident light wavelength, respectively.
If the parameters of the two Bragg grating are the same, that is, ,, Equation (1) can be simplified as:
The reflectivity , that is:
where the sharpness coefficient is , , the phase of the transmission light is , , , is the coupling coefficient, and is the Bragg wavelength. The transmissivity is .
The reflection spectra of FBG and the transmission spectra of the FP cavity are shown in Figure 2a. The red lines represent the transmission spectra of the FP cavity, and the black lines represent the reflection spectra of FBG. The reflection and transmission spectra of the FP cavity constituted of two FBGs are shown in Figure 2b. Figure 2c shows the reflection spectra of OWG-FPC when the FP cavity length is 1 and 0.5 mm, respectively. As the cavity length decreases, the reflection bandwidth becomes wider and the number of side lobes of resonance spectral lines increases.
2.3. Principle of Acoustic Sensing Based on Evanescent Wave
When light travels in the optical waveguide, the total reflection will occur at the interface between the waveguide core layer and cladding layer. Almost all light is propagated in the core layer, but some light may enter the cladding layer, which is called an evanescent wave. The evanescent wave will re-enter the core layer after a short propagation distance. The propagation distance of the evanescent wave is often called the “Goos–Hänchen Shift”. Using electromagnetic wave theory to analyze the total reflection, we can conclude that: when the light beam produces the total reflection on the dividing surface of the light-dense medium and the light-sparse medium, there will also be a part of the electromagnetic field energy in the light-sparse medium, that is, there is a transmission wave from the light-dense medium to the light-sparse medium. The amplitude term of the evanescent wave satisfies [33,34,35]:
where is the initial electric field of the incident light, is the refractive index of the first medium, is the refractive index of the second medium, is greater than , is the wavelength of the incident light, is the incident angle, and is the effective penetration depth, which can be expressed as:
where is the wave vector, and the penetration depth and intensity of the evanescent wave are closely related to the sensitivity of the sensing device. When the penetration depth is deeper and the intensity is larger, the sensitivity is higher.
When the sound passes through the FP cavity, the sound wave changes the air density in that region, as follows [33,34,35]:
where is the density of the air medium, p is the sound pressure, and c is the speed of sound propagation in the air. The change in air density actually changes the distribution of gas molecules. Since sound relies on gas molecules as a medium to propagate in the air, the change in gas density also affects the air refractive index change, which can be derived from the Lorenz–Lorentz Equation:
where is the average polarizability of isotropic molecules. Combining Equations (6) and (7), we can obtain the relationship between the refractive index of air and the air pressure by:
In this equation, is the initial density of the air. The free spectrum range (FSR) of the FP cavity is . Using the derivative of FSR to cavity length , we can obtain . When the refractive index of the air in the FP cavity changes, the effective optical path changes. Combining the effective optical path change with , we can obtain the relationship between the spectral shift of the FP cavity and the refractive index of air :
3. Simulation and Analysis
The OWG-FPC is an improvement on a single Bragg grating, which is formed by two Bragg gratings as an FP cavity. Compared with the traditional FP cavity, it is easier to miniaturize and integrate. According to the fabrication dimensions of the optical waveguide resonant cavity provided by the Shijia Photonics Company, China, the refractive index difference between the cladding and core layer varies with different cross-sectional dimensions of waveguides. When the cross-sectional dimension is 7.0 μm× 7.0 μm, the refractive index difference is 0.36%, and the transmission loss and coupling loss of the waveguide are the lowest. Therefore, the refractive index difference of 0.36% is selected for simulation in this paper. We simulate the above structure using Rsoft 2020.3 software, where the central wavelength is 1550 nm, the refractive index of the core layer is 1.4500 and that of the cladding layer is 1.4464, the length of FP cavity is 2 mm, and the waveguide width is 7 μm. It is very important to achieve acoustic sensing by optimizing the parameters of the optical waveguide, such as the grating period, grating pitch quantity, air groove depth, etc.
3.1. Grating Period
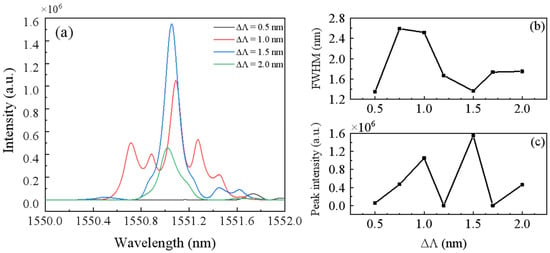
When the light with a certain spectral width passes through the OWG-FPC, the light satisfying the Bragg condition () is reflected back at the first grating, and the rest of the light continues to travel forward. Some part of the light is also reflected back at the second grating. When the periods of the two groups of gratings are not the same and the difference is not big, the two groups of light with different central wavelengths reflected back will be superimposed and the reflection bandwidth will be widened. If the two groups of grating periods are the same, the center wavelengths of the two reflected lights are the same, and the reflection bandwidth does not change. If the grating period difference is too large, the reflected lights are too far away to be superimposed, the reflection spectra will display two peaks, and the reflection bandwidth will not increase. Therefore, it is better to choose two gratings with different periods for sound sensing. In Figure 1, the difference between two Bragg grating periods is defined as , . Figure 3a shows the reflection spectra for different values, ranging from 0.5 to 2 nm. The full width at half maximum (FWHM) of these spectra by multi-peak Voigt fitting is presented in Figure 3b. Figure 3c shows the maximum spectral intensity for each . As a rule of thumb, narrower peaks, in other words, smaller FWHMs, indicate a higher spectral resolution, while broader peaks indicate a lower spectral resolution. When is set to 1.5 nm, its reflection spectrum is particularly smooth and has few side lobes. This suggests that the majority of the light energy is focused in the waveguide, with minimal scattering loss into the cladding layer.
3.2. Grating Pitch Quantity
The grating pitch quantity is also one of the important factors affecting the reflectivity. As the grating pitch quantity increases, more light can be reflected and the loss of the total energy is less. The light energy in the FP cavity can be expressed by optical circulating power, which is given as [36]:
where is a parameter representing the depth of the dip in the reflected signal at resonance, is the incident power, and is the optical frequency. is the round-trip cavity gain (), and are the reflectivities of the first mirror and the second mirror, and represents other cavity losses. is related to the cavity finesse F as:
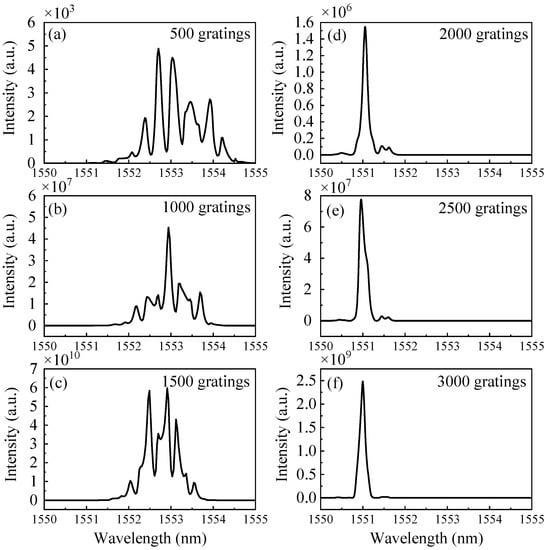
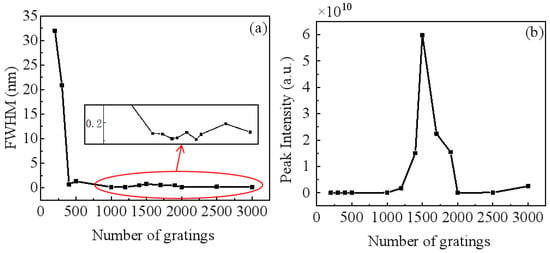
The larger the reflectivity of the end face of the FP cavity, the smaller the transmittance. When the F increases, the energy in the cavity increases. The reflection spectra for 200–3000 gratings are shown in Figure 4. When the grating pitch quantity is reduced, the multi-beam interference signal is weak, and a large number of side lobes and multiple resonance peaks appear in the reflection spectra. On the contrary, when the grating pitch quantity increases, the strong multi-beam interference signal is more sensitive to the weak sound signal. But the grating pitch quantity is not as high as possible, because there is an optimal in-coupling transmittance in the FP cavity. Thus, when the grating pitch quantity reaches a certain value, the intensity of the reflected light will not increase significantly with the further increase in the grating pitch quantity.
Figure 4.
The reflection spectra of OWG-FPC from 500 to 3000 gratings, (a) 500; (b) 1000; (c) 1500; (d) 2000; (e) 2500; and (f) 3000 gratings.
Figure 5 shows the FWHM and maximum light intensity of the spectra for different grating pitch quantities. When the grating pitch quantity is over 500, the FWHM of the spectra is narrower and does not change much. Furthermore, when the grating pitch quantity is 1500, the spectral intensity is the maximum.
3.3. Air Groove Depth
The air groove of OWG-FPC is used to sense the acoustic signal by the evanescent waves. The interference of the sound pressure on evanescent waves depends on the air groove depth. The evanescent wave energy is very feeble and only exists on the surface of the core layer. It decays exponentially with the increase in distance from the core layer, so the cladding layer has to be etched. If the air groove is too deep, most of the light will be lost outside the core layer. On the contrary, if the groove is too shallow, the effect of sound on the evanescent wave is very weak, which the test is unable to sense. Therefore, the appropriate air groove depth is very important for sound signal sensing.
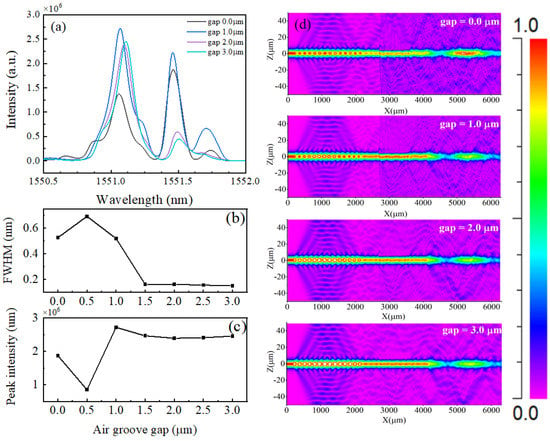
Figure 6a shows the spectra of OWG-FPC for the gap between the air groove and the core layer in the range of 0–3 μm. The FWHM and light intensity of the leftmost main peak of the spectra in Figure 6a are shown in Figure 6b,c, respectively. Figure 6d shows the light field distribution for different gaps. When the gap ≥1.5 μm, the effect of the air groove depth on the FWHM and peak intensity of the spectra is almost negligible. At this point, the interference of the sound signal on the evanescent wave is too small to realize its high-sensitivity sensing. For a gap of 0–1 μm, the air groove is so deep that a large amount of light is scattered into the cladding layer and the air. The resulting weaker spectral signals are also disadvantageous to the detection of acoustic signals. When the gap is 1 μm, the reflection spectrum is smooth and has few side lobes, and its peak intensity is highest. It makes the waveguide sensitive to the variation of weak sound signals.
3.4. Acoustic Performance Analysis on OWG-FPC
When we analyze the performance of OWG-FPC acoustic sensing, the optimal parameters of this sensor are as follows: the refractive index of the core layer is 1.45, the length of FP cavity is 2 mm, is 1.5 nm, the grating pitch quantity of the single Bragg grating is 1500, the gap between the air groove and the core layer is 1 μm. Next, we investigate the effect of these parameters on the acoustic sensing performance.
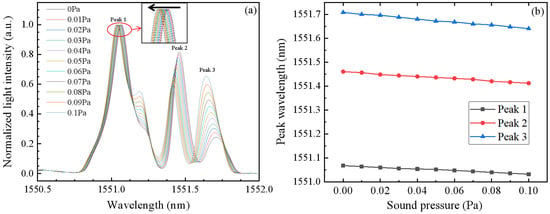
Figure 7a is the normalized reflection spectra when the sound pressure ranges from 0 to 0.1 Pa. Figure 7b is the corresponding peak wavelengths of the spectra with different sound pressures applied. There exists a remarkable linear relationship between the sound pressure and the peak wavelengths of the reflection spectra. Specifically, with the increase in the sound pressure, the peak wavelengths of the spectra shift towards the left, indicating a decrease in the peak wavelength. The rate of change is given by the spectral sensitivity to the variation of sound pressure and modelling predicts the sensitivity could be 0.4 nm/Pa. This observation validates the suitability of the proposed reflection spectra system as a sensitive tool to detect variations in sound pressure.
Figure 7.
(a) Normalized reflection lines under different sound pressures. The black arrow is the direction that the peak wavelength moves in with increasing sound pressure; (b) Peak wavelengths when different sound pressures are applied.
Based on the results shown in Figure 7, it can be concluded that there is a strong correlation between the sound pressure and the reflection spectra of the sensor. This relationship can be used to develop a sensor for monitoring sound pressure levels. The sensitivity of such a sensor depends on the spectral sensitivity of the sample and can be optimized by selecting materials with high spectral sensitivity. Additionally, the linearity of the relationship between sound pressure and peak wavelength suggests that this sensor could potentially be used for quantitative measurements of sound pressure levels. Therefore, the self-designed acoustic sensor based on silicon OWG-FPC has potential applications in the high-precision measurement field for acoustic signals.
3.5. Temperature Resistance Analysis of OWG-FPC
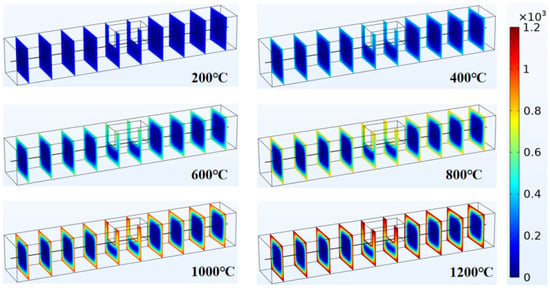
To analyze the finite element simulation model of the OWG-FPC, Comsol software is deployed and the resulting temperature distribution diagram is presented in Figure 8. The ambient temperature is constant (200–1200 °C) and the heat is allowed to flow along the waveguide. Because the heat cannot be transferred into the sensor in a relatively short time in the transient process, the external temperature of the sensor is high, and its internal temperature is low. When the time is infinite, the internal and external temperatures of the sensor are consistent, which is comparable to the ambient temperature. This shows that the sensor can withstand the impact of high temperatures for a short period of time.
SiO2 is an atomic crystal famous for its high melting point of 1723 °C. The cladding of the silicon-based optical waveguide is silica; the core layer is germanium-doped silica. The optical fibers are the same as the silicon-based optical waveguide. The physical properties of germanium-doped silica and silica are essentially the same. Under the same temperature change, the coefficients of thermal expansion and thermal stress of these materials are almost the same. Therefore, high-temperature thermal stress does not affect its structural integrity and optical properties.
However, quartz fiber is prone to breakage, so different coating materials must be used. Polyimide, copper, and gold-plated fibers are the three most commonly used coating materials, withstanding up to 400, 600, and 800 °C, respectively. Depending on the coating material utilized for the quartz fiber, the maximum operating temperature of the sensor may be restricted. For instance, if gold-plated fiber is chosen as the optical sensing medium, the withstanding temperature is limited to 800 °C. It is therefore critical to carefully select and match the waveguide and fiber coating materials to ensure optimal and accurate performance of the sensor.
Noise sensors are mostly used when the ambient temperature changes slowly. If the temperature changes greatly in a short time, the waveguide grating is not heated uniformly, resulting in a change in the spectra, which will affect the accuracy and sensitivity of the sensor. In the future, we can consider carving another set of gratings next to the waveguide. By comparing the spectra of the two gratings, we can further reduce the influence of the temperature.
The traditional FP cavity, consisting of two highly reflective dielectric films positioned at both ends, cannot sustain high temperatures since the film can only withstand temperatures below 300 °C. Consequently, the FP cavity is not suitable for use in high-temperature and harsh environments. However, the waveguide grating FP cavity, coupled with gold-plated fiber, which we have adopted in the study, is designed to significantly improve the withstanding temperature of the sensor. This feature makes it more viable for use in extreme environments characterized by high temperature and high pressure. The design of this novel structure is of great significance and holds immense potential for applications in industries such as petroleum, chemical, and aerospace where high-temperature monitoring is critical. Table 1 shows the comparison of different acoustic sensors.
3.6. Preparation Process of OWG-FPC
The silicon-based OWG-FPC is a micro-structure formed by micro-nano processing on a silicon substrate using femtosecond laser inscription [37,38,39,40]. The air groove is typically etched using the mask method. The preparation process of the OWG-FPC is shown in Figure 9.
- (a)
- A layer of SiO2 is grown on the silicon substrate, and a layer of germanium-doped SiO2 is grown on the silicon dioxide layer.
- (b)
- After the growth is completed, the entire structure is annealed at high temperatures of 900 °C–1100 °C for 35 h. A mask template is set on the germanium-doped SiO2 layer.
- (c)
- The excess germanium-doped SiO2 is etched off by reactive ion etching to form a straight optical waveguide in the SiO2 layer.
- (d)
- The SiO2 is grown on the SiO2 layer by plasma-enhanced chemical vapor deposition to form the upper cladding layer. After the reflux treatment at high temperature, the upper cladding layer and SiO2 layer coated the straight optical waveguide to form the optical waveguide substrate.
- (e)
- Set the mask template again, and the upper surface of the upper cladding layer is etched by reactive ion etching to form a micro air groove.
- (f)
- The depth of the micro air groove is less than the thickness of the upper cladding layer. The transmission fiber is then coupled at both ends of the straight optical waveguide. Finally, two Bragg gratings are formed by using the femtosecond laser inscription method.
4. Conclusions
In conclusion, we propose a method for sound pressure measurement based on a silicon optical waveguide Bragg grating FP cavity. By simulating the sensor structure with Rsoft, Matlab, and Comsol software, we studied the influence of different parameters on the spectra, such as the grating pitch quantity, grating length and air groove depth, and obtained the optimal parameters of the waveguide. Furthermore, we simulated the reflection spectra caused by sound pressure. The modelling predicts that the sensor’s sensitivity could be 0.4 nm/Pa. We also simulated the temperature distribution of the sensor at different temperatures and discussed the sensor’s tolerance temperature and preparation technology in detail. Because the optical waveguide grating FP interference cavity has multiple resonant spectral lines in the reflection bandwidth, it has higher demands on signal processing, which needs to be further optimized in future works. Compared with the traditional acoustic sensors with a thin film or mass block, the self-designed sensing structure has high sensitivity and small size, and is portable, easy to reuse, and uncostly. It is significant for noise detection in the field of precision measurement, high-temperature, and high-pressure environments.
Author Contributions
Conceptualization, X.G. and J.B.; methodology, J.B.; software, X.G.; validation, X.G., S.C., Y.Z. and J.B.; formal analysis, J.B.; investigation, X.G., S.C. and J.B.; resources, Y.Z. and J.B.; data curation, X.G.; writing—original draft preparation, X.G.; writing—review and editing, J.B.; visualization, X.G.; supervision, J.B.; project administration, Y.Z. and J.B.; funding acquisition, Y.Z. and J.B. All authors have read and agreed to the published version of the manuscript.
Funding
This research was funded by the National Natural Science Foundation of China (12104417, 62131018); the Fundamental Research Program of Shanxi Province (202103021222012, 20210302124161); and Shanxi “1331 Project” Key Subject Construction (1331KSC).
Institutional Review Board Statement
Not applicable.
Informed Consent Statement
Not applicable.
Data Availability Statement
The data that support the findings of this study are available from the first author and the corresponding author upon reasonable request.
Conflicts of Interest
The authors declare no conflict of interest.
References
- Othonos, A. Fiber Bragg gratings. Rev. Sci. Instrum. 1997, 68, 4309–4341. [Google Scholar] [CrossRef]
- Nezam, U.; Guigen, L.; Qiwen, S.; Ming, H. Constant temperature operation of fiber-optic hot-wire anemometers. Opt. Lett. 2019, 44, 2578–2581. [Google Scholar] [CrossRef]
- Bell Graham, A. Upon the production and reproduction of sound by light. J. Soc. Telegr. Eng. 1880, 34, 404–426. [Google Scholar] [CrossRef]
- Bucaro, J.A. Fiber-optic hydrophone. J. Acoust. Soc. Am. 1977, 62, 1302–1304. [Google Scholar] [CrossRef]
- Culshaw, B.; Davies, D.; Kingsley, S.A. Acoustic sensitivity of optical-fibre waveguides. Electron. Lett. 1977, 13, 760–761. [Google Scholar] [CrossRef]
- Nelson, D.F.; Kleinman, D.A.; Wecht, K.W. Vibration-induced modulation of fiber guide transmission. Appl. Phys. Lett. 1977, 30, 94–96. [Google Scholar] [CrossRef]
- Bucaro, J.A.; Dardy, H.D.; Carome, E.F. Optical fiber acoustic sensor. Appl. Opt. 1977, 16, 1761–1762. [Google Scholar] [CrossRef]
- Garthe, D.A. Optical fiber microphone. Sens. Actuators A 1991, 26, 341–345. [Google Scholar] [CrossRef]
- Webb, D.J. An ocean model code for array processor computers. Comput. Geosci. 1996, 22, 569–578. [Google Scholar] [CrossRef]
- Takahashi, N.; Yoshimura, K.; Takahashi, S.; Imamura, K. Development of an optical fiber hydrophone with fiber Bragg grating. Ultrasonics 2000, 38, 581–585. [Google Scholar] [CrossRef]
- Li, C.; Peng, X.B.; Zhang, H.; Wang, C.; Fan, S.C.; Cao, S.Q. A sensitivity-enhanced flexible acoustic sensor using side-polished fiber Bragg grating. Measurement 2018, 117, 252–257. [Google Scholar] [CrossRef]
- Zhang, F.X.; Wang, C.; Zhang, X.L.; Jiang, S.D.; Ni, J.S.; Peng, G.D. High-sensitivity FBG microphone with static pressure equalization and optimized response. Chin. Opt. Lett. 2019, 17, 010601. [Google Scholar] [CrossRef]
- Xu, J.; Wang, A.; Cooper, K.L.; Wang, X. Miniature all-silica fiber optic pressure and acoustic sensors. Opt. Lett. 2005, 30, 3269–3271. [Google Scholar] [CrossRef]
- Wang, Q.; Wang, W.; Jiang, X.; Yu, Q. Diaphragm-based extrinsic Fabry-Pérot interferometric optical fiber pressure sensor. In Proceedings of the SPIE—The International Society for Optical Engineering, Dalian, China, 31 December 2010; Volume 7656. [Google Scholar] [CrossRef]
- Ma, J.; Xuan, H.F.; Ho, H.L.; Jin, W.; Yang, Y.H.; Fan, S.C. Fiber-optic Fabry-Pérot acoustic sensor with multilayer graphene diaphragm. IEEE Photonics Technol. Lett. 2013, 25, 932–935. [Google Scholar] [CrossRef]
- Xu, F.; Shi, J.; Gong, K.; Li, H.; Hui, R.; Yu, B. Fiber-optic acoustic pressure sensor based on large-area nanolayer silver diaghragm. Opt. Lett. 2014, 39, 2838–2840. [Google Scholar] [CrossRef]
- Ma, J.; Yu, Y.; Jin, W. Demodulation of diaphragm based acoustic sensor using Sagnac interferometer with stable phase bias. Opt. Express 2015, 23, 29268–29278. [Google Scholar] [CrossRef]
- Bandutunga, C.P.; Fleddermann, R.; Gray, M.B.; Close, J.D.; Chow, J.H. All-optical low noise fiber Bragg grating microphone. Appl. Opt. 2016, 55, 5570–5574. [Google Scholar] [CrossRef]
- Ni, W.J.; Lu, P.; Fu, X.; Zhang, W.; Shum, P.P.; Sun, H.D.; Yang, C.Y.; Liu, D.M.; Zhang, J.S. Ultrathin graphene diaphragm-based extrinsic Fabry-Pérot interferometer for ultra-wideband fiber optic acoustic sensing. Opt. Express 2018, 26, 20758–20767. [Google Scholar] [CrossRef]
- Luo, Y.; Zhang, W.; Cui, P.; Ma, Y.A. High sensitivity fiber laser microphone. In Proceedings of the 2018 Asia Communications and Photonics Conference (ACP), Hangzhou, China, 26–29 October 2018. [Google Scholar]
- Qi, X.; Wang, S.; Jiang, J.; Liu, K.; Liu, T. Study on the sensitization effect of flywheel-like diaphragm on fiber-optic Fabry-Pérot acoustic sensor. IEEE Access 2020, 8, 99286–99293. [Google Scholar] [CrossRef]
- Zhang, W.; Lu, P.; Ni, W.J.; Xiong, W.Z.; Liu, D.M.; Zhang, J.S. Gold-diaphragm based Fabry-Pérot ultrasonic sensor for partial discharge detection and localization. IEEE Photonics J. 2020, 12, 1–12. [Google Scholar] [CrossRef]
- Ballard, N.; Paz-Soldan, D.; Kung, P.; Loock, H.P. Musical instrument recordings made with a fiber Fabry-Pérot cavity: Photonic guitar pickup. Appl. Opt. 2010, 49, 2198–2203. [Google Scholar] [CrossRef] [PubMed]
- Gao, C.; Nie, F.; Zhang, P.; Zhao, B.; Li, B. Optical fiber acoustic sensors. Opto-Electron. Eng. 2018, 45, 180050. [Google Scholar] [CrossRef]
- Zhao, X.; Bai, J.; Zheng, Y.; Chen, J.; Wu, L.; Gao, X.; Li, Z.; Zhang, J.; Xue, C. Research on high-temperature characteristics of a miniature Fabry–Pérot cavity acoustic sensor. Opt. Express 2022, 30, 26609–26619. [Google Scholar] [CrossRef] [PubMed]
- Wang, X.X.; Jin, L.; Li, J.; Ran, Y.; Guan, B.O. Microfiber interferometric acoustic transducers. Opt. Express 2014, 22, 8126–8135. [Google Scholar] [CrossRef]
- Gao, X.X.; Cui, J.M.; Ai, M.Z.; Huang, Y.F.; Guo, G.C. An acoustic sensor based on active fiber Fabry–Pérot microcavities. Sensors 2020, 20, 5760. [Google Scholar] [CrossRef]
- Wu, S.N.; Xie, L.J.; Lin, H.G.; Tan, Q.; Chen, X.L.; He, S.L. Fiber acoustic sensor with stable operating-point based on a photo-thermal cavity. IEEE Sens. J. 2022, 22, 1321–1326. [Google Scholar] [CrossRef]
- Zhang, Z.; Wang, Y.; Zhou, M.; He, J.; Liao, C.; Wang, Y. Recent advance in hollow-core fiber high-temperature and high-pressure sensing technology. Chin. Opt. Lett. 2021, 19, 070601. [Google Scholar] [CrossRef]
- Rao, Y.J. Recent progress in applications of in-fibre Bragg grating sensors. Opt. Lasers Eng. 1999, 31, 297–324. [Google Scholar] [CrossRef]
- Morey, W.W.; Meltz, G.; Glenn, W.H. Fibre optic Bragg grating sensors. Proc. SPIE 1990, 1169, 98–107. [Google Scholar]
- Udd, E. Fiber optic smart structures. Proc. IEEE 1996, 84, 884–894. [Google Scholar] [CrossRef]
- Chen, C.; Zheng, Y.; Chen, J.; Wu, L.; Xue, C. Full investigation of frequency locking loop model for high-Q Fabry-Pérot cavity acoustic sensor. Opt. Laser Technol. 2021, 139, 106976. [Google Scholar] [CrossRef]
- Mechel, F.P. Revision of the kirchhoff-rayleigh-theory of sound propagation in visco-thermal air. Part II: Evaluation of sound fields in flat capillaries. Acta Acust. United Acust. 2007, 93, 675–705. [Google Scholar]
- Klemm, K.; Pieszynski, K.; Rozniakowski, K. Examination of air density fluctuations with the aid of laser beam. Opt. Appl. 2007, 37, 219–228. [Google Scholar]
- Ryan, W.; Felipe, G.; Akobuije, C.; Gurpreet, K.; Gulati, M. Direct measurement of radiation pressure and circulating power inside a passive optical cavity. Opt. Express 2018, 26, 23492–23506. [Google Scholar] [CrossRef]
- Li, L.; Kong, W.; Chen, F. Femtosecond laser-inscribed optical waveguides in dielectric crystals: A concise review and recent advances. Adv. Photonics 2022, 4, 29. [Google Scholar] [CrossRef]
- Gattass, R.R.; Mazur, E. Femtosecond laser micromachining in transparent materials. Nat. Photonics 2008, 2, 219–225. [Google Scholar] [CrossRef]
- Sugioka, K.; Cheng, Y. Ultrafast lasers-reliable tools for advanced materials processing. Light Sci. Appl. 2014, 3, e149. [Google Scholar] [CrossRef]
- Gross, S.; Withford, M.J. Ultrafast-laser-inscribed 3D integrated photonics: Challenges and emerging applications. Nanophotonics 2015, 4, 332–352. [Google Scholar] [CrossRef]
Disclaimer/Publisher’s Note: The statements, opinions and data contained in all publications are solely those of the individual author(s) and contributor(s) and not of MDPI and/or the editor(s). MDPI and/or the editor(s) disclaim responsibility for any injury to people or property resulting from any ideas, methods, instructions or products referred to in the content. |
© 2023 by the authors. Licensee MDPI, Basel, Switzerland. This article is an open access article distributed under the terms and conditions of the Creative Commons Attribution (CC BY) license (https://creativecommons.org/licenses/by/4.0/).
