Abstract
The polarization properties of bismuth active centers (BACs) are important for many applications of bismuth-doped fibers, but they are still lacking in study. In this paper, we present the measurements of polarized luminescence (PL) of the BACs formed in a Bi-doped phosphosilicate glass matrix. This research was performed on phosphosilicate fiber preforms used for the drawing of active bismuth-doped fibers for efficient optical amplifiers and lasers. The degree of polarization (DOP) of luminescence of the BACs associated with phosphorus and silica (BAC-P and BAC-Si) is provided and discussed. The DOP of luminescence at the 1320 nm wavelength appeared to be around 19%, 0% and 7.5% for pumps at 1240 nm, 762 nm and 425 nm, respectively. The DOP of PL caused by resonant excitation may be described in terms of a model of a partially anisotropic oscillator with the parameters represented by the principal axes of an ellipsoid. For the resonant excitation at 1240 nm, the ratio of the major principal axis to the minor one turned out to be 5.1 and 3.0 for BAC-P and BAC-Si, respectively.
1. Introduction
Bismuth is a rather prominent element for the creation of all-fiber gain media covering the wavelength ranges of 1150–1220 nm, 1260–1550 nm and 1640–1770 nm [1,2,3]. This seems to be possible due to the variation of BAC properties with a glass host composition [4]. The unique characteristics of Bi-doped fibers allow one to consider this material as prospective media for lasers and amplifiers operating in wavelength ranges that are potentially in demand. One of the important applications of Bi-doped fibers is the development of amplifiers for O, E and S telecommunication bands, which, in combination with Er-doped fiber amplifiers (EDFA), can provide an upgrade for the deployed fiber-optic networks for data transmission in an extended wavelength range of 1260–1675 nm [1,2,3,4].
However, for commercial utilization of Bi-doped fibers, it is necessary to solve a number of problems, one of which is a low Bi concentration in efficient laser fibers [5]. It should be underlined that this task is directly connected to the understanding of the nature of BACs, which is still under discussion [6]. A clearer understanding of the nature of BACs may help to find a way to reduce the unsaturable loss and, hence, increase the performance of Bi-doped fiber lasers [5]. To collect the experimental data on the structure of BACs, various approaches have been used, including conventional techniques of solid-state investigation: EPR, NMR, EXAFS and XANES [7,8,9]. Based on these data, a number of hypotheses regarding the models of BACs have been proposed [5,10,11,12,13,14]. One of the most promising models of BACs assumes that a BAC is a complex consisting of a Bi ion adjacent to an oxygen deficiency center [5]. It should be noted that this model was built using absorption and luminescence spectroscopy, which allow us to determine the main optical transitions and the energy level diagrams for various type of BACs. As a result, one can certainly state the fact that four types of BACs associated with Al, P, Si and Ge atoms can be formed in silica-based fibers, making these fibers laser-active in certain ranges [4]. Nevertheless, research regarding the nature of BACs is still being conducted.
Another spectroscopic technique is polarization spectroscopy, which can be efficiently used to study the features and structure of optical centers in solid-state media. Studies of fluorescence anisotropy by means of polarization spectroscopy have been widely implemented in research on crystalline solids to evaluate the symmetry of luminescence centers [15,16] and, less broadly, on rare-earth-doped amorphous glasses [17,18,19]. Despite the wide application of luminescence spectroscopy in the study of BACs and the use of PL methods in characterization of rare-earth-doped glasses, a thorough investigation of PL in BACs has not been performed up to now. There is only one paper dedicated to studies of DOP of PL of BAC-Si [20], where it was revealed that BAC-Si is characterized by a relatively high DOP of ~9–11%.
In this paper, we studied the polarization properties of BACs in the phosphosilicate glasses fabricated by MCVD-technology. The DOP of PL originating from the near-IR transitions of BAC-P was determined. The parameters of partially anisotropic oscillators [21] modeling the DOP of PL were calculated for BAC-P and BAC-Si. The differences in PL properties of phosphosilicate and germanosilicate Bi-doped glasses [20] were scrutinized.
2. Materials and Methods
To study the PL of BAC-P, four Bi-doped fiber preforms fabricated by MCVD were investigated: F46, F50, F59 and F62. The samples had a cylindrical shape and consisted of a silica cladding (SiO2) and a phosphosilicate glass core doped with Bi (Bi:SiO2-P2O5). The outer diameter of the samples was 6–9 mm and the diameter of the doped core was 1 mm. The difference in the refractive index of the studied samples was in the range 5–8 × 10⁻³. From each of the investigated preforms, a single mode optical fiber was fabricated. The absorption of BACs in these fibers was used as an indicator of the BAC content in the preforms (Table 1). It is seen that the maximum difference in BAC concentration among the studied samples was about 3-fold.

Table 1.
Optical losses in the fibers and the outer diameters of the preforms.
An FLSP920 spectrofluorometer from Edinburg Instruments was used to acquire the emission spectra. The corresponding measurements were performed using an L-type configuration, as presented in Figure 1. A xenon lamp (ExL) included in the standard configuration of the spectrofluorometer and a laser diode (LD) at 1240 nm were used independently to excite BAC-P in the samples. The radiation from the LD, transmitted through a collimator (Col), was polarized by a Glan prism (GP). Thereafter, the polarized light fell on the side surface of the sample (S). In other experiments, we used the light from the ExL as an excitation source, which passed a monochromator (MC1) and polarizer (P1). A lens system (L) allowed us to obtain a plane-parallel beam of light incident on the sample. The diffraction grating in the MC1 was optimized for the 250–900 nm wavelength range. Luminescence signal was collected by a lens system (L) placed in the detection path in both cases. A long-pass filter (LPF) provided for the elimination of the excitation light scattered from the sample. Afterwards, a polarization component of the light was selected by a polarizer (P2). Before the light reached a photomultiplier tube (PMT), it had passed a monochromator (MC2) equipped with a diffraction grating having 830 grooves/mm and optimized for the range 900–1800 nm. The acquisition of PL spectra was performed in a 1300–1500 nm wavelength range.
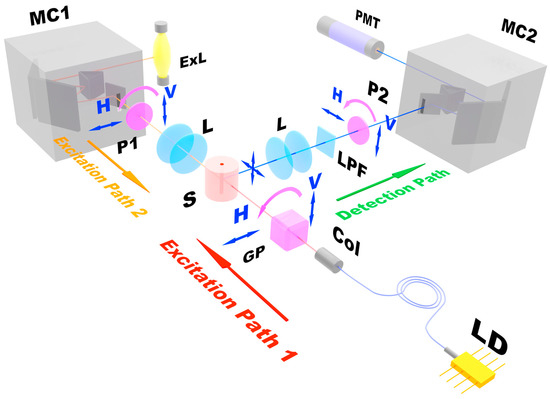
Figure 1.
The schematic of experimental setup. MC1, MC2 are monochromators; P1, P2 are polarizers; L indicates lenses; S is a sample, LPF is a long-pass filter; GP is a Glan prism; Col is a collimator; LD is a laser diode; ExL is a xenon lamp; PMT is a photomultiplier tube. Blue arrows with an index H and V denote horizontal and vertical orientations of polarization, correspondingly. Magenta arrows indicate the switching of polarization by the polarizer or Glan prism rotation. Red, yellow and green arrows show the direction of the light propagation in the excitation path 1, the excitation path 2 and the detection path, respectively.
There are several conventional procedures of PL measurements [22]. In this case, we implemented the L-format or single-channel method, which consisted of a number of stages described below. Initially, two spectra of PL excited by the light with a vertical state of polarization were measured for two positions of the polarizer in the detection path: parallel and perpendicular with respect to the polarization state of the light incident on the sample. The first one corresponds to the vertically polarized component of PL. This component has the intensity extremum due to the collinearity of orientation of P2 and the GP (or P1). The second PL spectrum corresponds to the horizontal state of polarization of the PL. In this case, one has to observe the intensity extremum as well because of the orthogonal orientation of P2 and the GP (or P1). The polarization state of the pump light sources was controlled by the rotation of the GP or P1. To select the component of PL with a vertical or horizontal state of polarization, P2 was rotated. It should be noted that the geometrical shape of a sample and the optical components in the detection path, such as the diffraction grating in MC2, may induce extra polarization or a depolarization in the PL signal. To estimate these extra-polarization effects, it was necessary to measure PL spectra excited by horizontally polarized radiation. In this case, two polarization components of the PL spectrum were measured as previously but excited by the light with a horizontal state of polarization. The luminescence signal in this case must not be polarized intrinsically due to the collinear orientation of the pump polarization with respect to the detection path [22]. Thereby, any detected polarization of the signal must be due to the extra-polarization/depolarization effects in the detection channel. This information, therefore, helped us to correct the polarization induced by the optical system.
The DOP of PL can be calculated according to (1) using four spectra obtained by excitation with light having a vertical or horizontal state of polarization and registering the vertically or horizontally polarized component of PL [20]:
We designated each spectrum of PL as , where the first index means the polarization state of the pump and the second index denotes the polarization state of the fluorescence. Indices h and v indicate the horizontal and the vertical polarization states, respectively.
G-factor is a coefficient responsible for the correction of the polarization induced by the optical components and the geometrical shape of the sample but not by potential BAC anisotropy itself (2) [22]:
In addition, the influence of the geometrical shape of samples was also evaluated by measurements of the DOP of PL acquired from a sample placed in a cuvette made of plane-parallel glass plates with an immersion liquid inside (glycerin). In this case, a lens formed by the curvature of the sample was eliminated. The difference between the results for the samples in the glycerin and those not immersed was in the range of measurement error. The absolute error of DOP evaluation was about 2%. To verify the precision of measurements, we acquired and processed PL from an Er-doped aluminosilicate glass sample. The samples’ DOP in this case was < 5%, which is in agreement with the reference values from [17].
3. Results
To investigate the DOP of PL of Bi-doped phosphosilicate glasses, we measured broadband luminescence peaked in the range of 1250–1450 nm excited using an ExL at 425 nm and 762 nm and an LD at 1240 nm. The measurements were carried out in accordance with peaks of an excitation spectrum acquired at the luminescence wavelength of 1320 nm for BAC-P (Figure 2a). The energy level diagrams for BAC-P and BAC-Si with corresponding optical transitions are presented in Figure 2b [23].
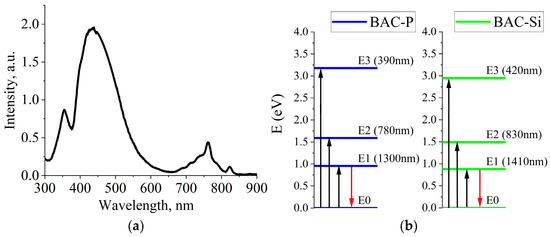
Figure 2.
(a) The excitation spectrum for a 1320 nm-peaked luminescence band. (b) The energy level diagrams of BAC-P and BAC-Si with optical transitions [23].
To calculate the DOP of PL of the studied preforms, four spectra were acquired for each sample. Typical spectra are presented in Figure 3a. The calculated spectral dependences of the DOP for excitation wavelengths at 1240 nm, 762 nm and 425 nm are demonstrated in Figure 3b.
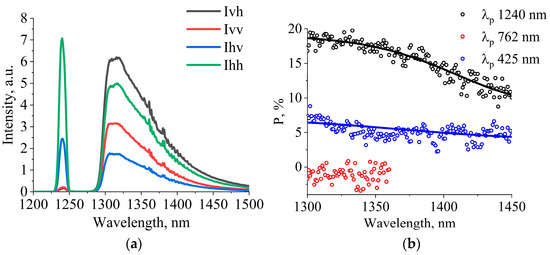
Figure 3.
(a) PL spectra excited by 1240 nm (Sample F46). (b) DOP of PL as a function of wavelength (circles—experiment; lines—approximation) (Sample F46).
DOPs of PL at 1320 nm for all the samples are presented in Table 2. The values of the DOPs were similar for all samples. Therefore, we could conclude that the difference in the concentration of BACs and in the outer diameter within the evaluated range did not affect the resulting value of the DOP of BAC-P. Thus, DOP averaged over all the samples within one wavelength of PL excitation is also provided in Table 2.
Table 2.
DOP of PL at 1320 nm originating from BAC-P excited by 1240 nm, 762 nm, 425 nm. is DOP averaged over all the samples within one wavelength of PL excitation.
The DOP of the PL while excited at 1240 nm demonstrated the highest value among the evaluated pumping wavelength, 19%. This originates from the fact that the resonant excitation preserves the polarization of the excitation light more effectively than non-resonant excitation [22]. The obtained DOP of PL of BAC-P at 1320 nm demonstrates a greater value than the value of DOP of PL of BAC-Si at 1400 nm in germanosilicate samples, which was shown to be 9–11% [20]. According to the abovementioned results, a higher impact of BAC-P anisotropy is expected in the interaction of polarized radiation with Bi-doped phosphosilicate glasses. For instance, polarization-dependent gain (PDG) in Bi-doped fibers may strongly affect the properties of Bi-doped-fiber devices.
4. Discussion
The previous research provided us with the information that two types of BACs exist in the studied phosphosilicate glass samples: BAC-P and BAC-Si [4]. Considering PL pumped at 1240 nm and 425 nm, we can claim that two types of BACs were excited and each of them contributed to the observed PL spectra as a result of the overlapping bands of BAC-Si and BAC-P. The PL pumped at 762 nm had only a BAC-P spectral component due to an absence of energy levels in BAC-Si that might be excited by 762 nm. On the other hand, the resulting spectral dependencies of DOP of PL when pumped at 1240 nm and 425 nm consisted of BAC-P and BAC-Si spectral components with different DOPs.
At first, the resonant excitation provided by 1240 nm light was considered. We found the impact of the BAC-P and BAC-Si spectral components in the acquired fluorescent spectrum. The peak of BAC-P luminescence is at 1300 nm, and the BAC-Si peak position is at 1400 nm when excited at 1240 nm [4]. The spectrum can be decomposed into two Gaussians (Figure 4a).
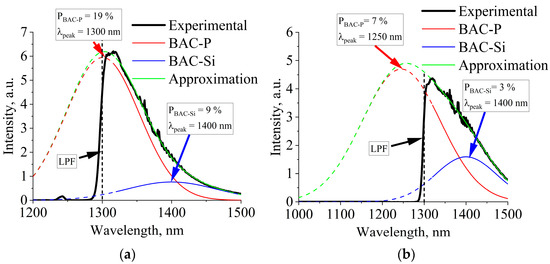
Figure 4.
(a) The spectrum of luminescence pumped at (a) 1240 nm and (b) 425 nm with the decomposition into BAC-P and BAC-Si spectral components. LPF is the cut-on wavelength of the long-pass filter. (Sample F46).
The resulting DOP of the luminescence of two spectral components can be represented as follows [24].
Then, the fit of DOP spectrum of the PL excited at 1240 nm was performed by (4) taking into account the Gaussian functions and from (3). The DOPs of BAC-P and BAC-Si appeared to be = 19% and = 9%. The fitting curve of the DOP spectrum is presented in Figure 3b.
In [20], the DOP of BAC-Si in germanosilicate glass samples for the PL pumped at 1260 nm and the luminescence peak at 1400 nm was provided as 9–11%. The evaluated in this paper value of of PL under the resonant excitation in the phosphosilicate glass sample coincides with results for the germanosilicate matrix in [20] despite the difference in the glass matrix structure. Therefore, one can conclude that BAC-Si in a phosphosilicate glass matrix and germanosilicate glass matrix both have identical polarization properties.
By a similar method, we can analyze the PL pumped at 425 nm (Figure 4b). When excited at 425 nm, the peak position of luminescence is 1250 nm for BAC-P and 1400 nm for BAC-Si [4]. The DOPs of BAC-P and BAC-Si were = 7% and = 3%. The fitting curve is demonstrated in Figure 3b.
For the analysis of the polarization properties of the luminescent centers, the model of anisotropic oscillators is used. This model is based on the characterization of the DOP of luminescence by the relative orientation of partially anisotropic absorption and emission oscillators responsible for absorption and emission transitions [25]. In the case of a resonant excitation, the absorption oscillator and the emission oscillator are the same and the related PL has the highest DOP due to the most effective preservation of polarization of the exciting light [22]. Under the non-resonant excitation, each transition is represented by a separate oscillator with its own parameters. Therefore, the orientation of an emission oscillator differs from the orientation of an absorption oscillator [21]. This effect causes a drop in the DOP of PL under a non-resonant excitation relative to a resonant one. To describe the DOP of PL in a general case, a partially anisotropic oscillator that is represented by an ellipsoid with three different principal axes has to be utilized [21].
The general equation connecting the DOP of luminescence and the oscillator’s principal axes of orientation is as follows [21]:
where ; .
is an absorption oscillator principal axis;
is an emission oscillator principal axis;
the cosine of the angle between and .
Under a resonant excitation, when and when . Therefore, for a resonant case:
When we apply some extra restrictions, can be evaluated. First of all, oscillator principal axes represent a ratio of powers of absorption (the principal “absorption intensities”) of the BAC excited by a linearly polarized light. Thus, the sum of is equal to 1 [26]. The main purpose of this analysis was to obtain the ratio between the minor and major principal axes of the ellipsoid for BAC-P and BAC-Si. Therefore, the next precondition is the lateral symmetry of the partially anisotropic oscillator, meaning that the minor principal axes of the ellipsoid are equal . In sum, we had a system of three equations with three variables for the resonant excitation at 1240 nm with the DOP of luminescence = 19% and = 9%.
Firstly, we evaluated the oscillator’s principal axes of the BAC-P optical transition. The only solution of the system satisfying physical conditions is
Secondly, the optical transition of BAC-Si was investigated. The system had two sets of solutions.
The second solution for the BAC-Si seemed less probable due to high values for lateral principal axes that do not correlate with the BAC-P solution and contradict the known models of the silica network [27]. The second solution is more appropriate for a planar structure rather than for bulk glass. The model of the structure of BAC-Si supposes a tetrahedral structure of the glass matrix. The tetrahedral structure is less compatible with the planar oscillator representation. Therefore, we selected the first solution for the BAC-Si for further investigations. Considering the chosen solutions, the partially anisotropic oscillator had one long principal axis with short principal axes and . The comparison indicated that of the BAC-P is longer than of the BAC-Si for the PL under the resonant excitation at 1240 nm (Figure 5).
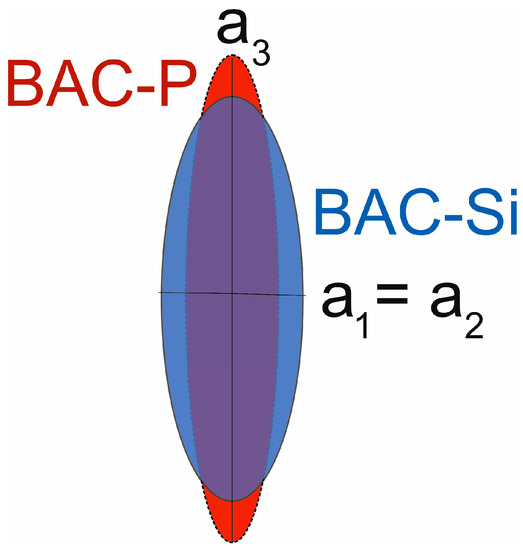
Figure 5.
The ellipsoids representing partially anisotropic oscillators of BAC-P and BAC-Si for the PL under resonant excitation at 1240 nm.
The processing of the spectra of the DOP of PL under a non-resonant excitation at 762 nm and 425 nm for the calculation of oscillator principal axes cannot be implemented in the same way as it has been performed for the resonant excitation at 1240 nm. Considering non-resonant excitation, the principal axes of absorption and emission oscillators are not equal and have a different orientation [21]. Therefore, such a plain approach could not be performed.
The most reliable model of BACs describes their structure as complexes formed by interstitial Bi atoms and intrinsic glass defects, i.e., oxygen vacancies. For instance, in BAC-Si, the twofold Bi ion is bounded with Si by bringing O atoms [28]. Unfortunately, the obtained data did not allow us to implement a complete qualitative analysis of the polarization properties of fiber preforms from the point of view of a possible structure or symmetry of the BAC. Nevertheless, some assumptions in this relation can be formulated. Earlier, it was determined that BAC-Si and BAC-P are characterized by similar energy level diagrams with corresponding optical transitions [29,30]. However, it turned out that the energies of these transitions are different, which is most likely caused by the local environment of the corresponding center. Bismuth as a chemical element being an essential part of BAC is not capable of replacing Si or P atoms in the glass network and, therefore, a BAC is an interstitial structure, where the local environment plays an important role. In particular, the local surroundings can form a kind of potential well with a certain size for a BAC, which depends on the geometric parameters of the glass-forming components, such as length of P-O and Si-O and type of point defects. This can determine the strength of interaction and strongly affects BAC properties, including those of polarization. For example, the P-O length is noticeably shorter (0.145 nm) than that of Si-O (0.161 nm) [27,31] and, therefore, can have a more pronounced effect on BAC-P features regarding polarization properties compared to the BAC-Si. Nevertheless, the detailed microscale structure of BACs requires additional research.
5. Conclusions
The polarization features of active centers formed in Bi-doped phosphosilicate optical-fiber preforms were investigated. The DOP of PL turned out to be equal to 19%, 0% and 7.5% for the main radiative transition of BAC-P excited by 1240 nm, 762 nm and 425 nm, respectively. The DOP of PL of BAC-Si [20] was lower than that of BAC-P. The ratios of the powers of absorption of BAC-P and BAC-Si were calculated for the anisotropic oscillator in the case of resonant excitation. The aspect ratios of the ellipsoids of BAC-P and BAC-Si were up to 5.1 and 3.0, respectively. The mechanism explaining the difference in partially anisotropic oscillator parameters for BAC-Si and BAC-P was suggested.
Author Contributions
Conceptualization, K.E.R. and M.A.M.; methodology, A.V.E., K.E.R. and M.A.M.; investigation, A.V.E., K.E.R. and E.G.F.; resources, F.V.A. and K.N.N.; data curation, A.V.E.; validation, M.A.M.; writing—original draft preparation, A.V.E. and K.E.R.; writing—review and editing, S.V.F., S.V.A., A.V.K. and A.M.K.; funding acquisition, K.E.R. All authors have read and agreed to the published version of the manuscript.
Funding
This research was funded by Russian Scientific Foundation, grant number 22-79-00157, https://rscf.ru/project/22-79-00157/.
Institutional Review Board Statement
Not applicable.
Informed Consent Statement
Not applicable.
Data Availability Statement
The data supporting the findings of this study are available within the article.
Conflicts of Interest
The authors declare no conflict of interest.
References
- Wang, Y.; Thipparapu, N.K.; Richardson, D.J.; Sahu, J.K. Ultra-Broadband Bismuth-Doped Fiber Amplifier Covering a 115-nm Bandwidth in the O and E Bands. J. Light. Technol. 2021, 39, 795–800. [Google Scholar] [CrossRef]
- Dianov, E.M. Amplification in Extended Transmission Bands Using Bismuth-Doped Optical Fibers. J. Light. Technol. 2013, 31, 681–687. [Google Scholar] [CrossRef]
- Firstov, S.V.; Alyshev, S.V.; Riumkin, K.E.; Khopin, V.F.; Guryanov, A.N.; Melkumov, M.A.; Dianov, E.M. A 23-dB Bismuth-Doped Optical Fiber Amplifier for a 1700-nm Band. Sci. Rep. 2016, 6, 28939. [Google Scholar] [CrossRef]
- Bufetov, I.A.; Melkumov, M.A.; Firstov, S.V.; Riumkin, K.E.; Shubin, A.V.; Khopin, V.F.; Guryanov, A.N.; Dianov, E.M. Bi-doped Optical Fibers and Fiber Lasers. IEEE J. Sel. Top. Quantum Electron. 2014, 20, 111–125. [Google Scholar] [CrossRef]
- Dianov, E.M. Nature of Bi-related near IR active centers in glasses: State of the art and first reliable results. Laser Phys. Lett. 2015, 12, 095106. [Google Scholar] [CrossRef]
- Dianov, E.M. Bismuth-doped optical fibers: A challenging active medium for near-IR lasers and optical amplifiers. Light Sci. Appl. 2012, 1, e12. [Google Scholar] [CrossRef]
- Ohkura, T.; Fujimoto, Y.; Nakatsuka, M. Local Structures of Bismuth Ion in Bismuth-Doped Silica Glasses Analyzed Using Bi LIII X-Ray Absorption Fine Structure. J. Am. Ceram. Soc. 2007, 90, 3596–3600. [Google Scholar] [CrossRef]
- Fujimoto, Y. Bi-doped silica glass—Analysis of luminescent center. In Proceedings of 3rd Europhoton Conference, Paris, France, 31 August 2008. [Google Scholar]
- Haruna, T.; Iihara, J.; Onishi, M. Bismuth-doped silicate glass fiber for ultrabroadband amplification media. Proc. SPIE 2006, 6389, 638903. [Google Scholar] [CrossRef]
- Peng, M.; Zollfrank, C.; Wondraczek, L. Origin of broad NIR photoluminescence in bismuthate glass and Bi-doped glasses at room temperature. J. Phys. Condens. Matter. 2009, 21, 285106. [Google Scholar] [CrossRef]
- Kustov, E.F.; Bulatov, L.I.; Dvoyrin, V.V.; Mashinsky, V.M. Molecular orbital model of optical centers in bismuth-doped glasses. Opt. Lett. 2009, 34, 1549–1551. [Google Scholar] [CrossRef]
- Razdobreev, I.M.; Bigot, L.; Ivanov, V.; Godlewski, M. Optically detected magnetic resonance in bismuth-doped silica glasses. Opt. Lett. 2009, 34, 2691–2693. [Google Scholar] [CrossRef] [PubMed]
- Dianov, E.M. On the nature of near-IR emitting Bi centres in glass. Quantum Elec. 2010, 40, 283–285. [Google Scholar] [CrossRef]
- Wen, J.; Wang, T.; Pang, F.; Zeng, X.; Chen, Z.; Peng, G.D. Photoluminescence characteristics of Bi(m+) doped silica optical fiber: Structural model and theoretical analysis. Jpn. J. Appl. Phys. 2013, 52, 122501. [Google Scholar] [CrossRef]
- Liua, B.; Shia, J.; Wanga, Q.; Tanga, H.; Liub, J.; Zhaoa, H.; Lic, D.; Liud, J.; Xuc, X.; Wanga, Z.; et al. Crystal growth, polarized spectroscopy and Judd-Ofelt analysis of Pr:YAlO3. J. Lumin. 2018, 196, 76–80. [Google Scholar] [CrossRef]
- Zhao, W.; Zhou, W.; Wei, B.; Yu, Y.; Wang, G.; Du, J.; Yu, H.; Lv, Z.; Chen, Y. Spectroscopic assessment of Dy3+:LiLa(MoO4)2 crystal as an active medium for all-solid-state direct yellow-emitting lasers. J. Alloys Compd. 2012, 538, 136–143. [Google Scholar] [CrossRef]
- Desurvire, E. Erbium Doped Fiber Amplifiers: Principles and Application, 1st ed.; John Wiley & Sons, Inc.: New Jersey, NJ, USA, 2002; pp. 303–305. ISBN 978-0-471-26434-7. [Google Scholar]
- Lebedev, V.; Przhevuskii, A. Polarized Luminescence of Glasses Activated with Rare-Earth Ions. Solid State Phys. 1977, 19, 1373–1376. [Google Scholar]
- Rokhmin, A.; Aseev, V.; Nikonorov, N. Polarized luminescence of erbium and thulium ions in glasses. Opt. Mater. 2014, 41, 136–138. [Google Scholar] [CrossRef]
- Riumkin, K.E.; Firstov, S.V.; Khegai, A.M.; Kharakhordin, A.V.; Alyshev, S.V.; Melkumov, M.A. Polarized Luminescence of Bismuth Active Centers in Germanosilicate Glasses. Quantum Electron. 2020, 50, 502–505. [Google Scholar] [CrossRef]
- Feofilov, P. Polarization of Luminescence of Complex Molecules. In Polarized Luminescence of Atoms, Molecules and Crystals, 1st ed.; Kuznetsova, E., Moiseeva, Z., Murashova, N., Eds.; State Publishing House of Physical and Mathematical Literature: Moscow, Russia, 1959; Volume 1, pp. 121–186. [Google Scholar]
- Lakowicz, J. Principles of Fluorescence Spectroscopy, 3rd ed.; Springer: New York, NY, USA, 2006; pp. 353–382. ISBN 978-0-387-31278-1. [Google Scholar]
- Khegai, A.M.; Alyshev, S.V.; Vakhrushev, A.S.; Riumkin, K.E.; Umnikov, A.A.; Firstov, S.V. Recent advances in Bi-doped silica-based optical fibers: A short review. J. Non-Cryst. Solids X 2022, 16, 100126. [Google Scholar] [CrossRef]
- Weber, G. Polarization of the Fluorescence of Macromolecules. Biochem. J. 1952, 51, 145–155. [Google Scholar] [CrossRef]
- Jabłoński, A. Zur Theorie der Polarisation der Photolumineszenz von Farbstofflösungen. Z. Physik. 1935, 96, 236–246. [Google Scholar] [CrossRef]
- Kawski, A. Fluorescence Anisotropy: Theory and Applications of Rotational Depolarization. Crit. Rev. Anal. Chem. 1993, 23, 459–529. [Google Scholar] [CrossRef]
- Shackelford, J.F.; Doremus, R.H. Ceramic and Glass Materials: Structure, Properties and Processing, 1st ed.; Springer: New York, NY, USA, 2008; pp. 71–86. ISBN 978-0-387-73361-6. [Google Scholar]
- Sokolov, V.O.; Plotnichenko, V.G.; Dianov, E.M. The origin of near-IR luminescence in bismuth-doped silica and germania glasses free of other dopants: First-principle study. Opt. Mater. Express 2013, 3, 1059–1074. [Google Scholar] [CrossRef]
- Firstov, S.V.; Khopin, V.F.; Bufetov, I.A.; Firstova, E.G.; Guryanov, A.N.; Dianov, E.M. Combined excitation-emission spectroscopy of bismuth active centers in optical fibers. Opt. Express 2011, 19, 19551–19561. [Google Scholar] [CrossRef]
- Firstova, E.G.; Bufetov, I.A.; Khopin, V.F.; Vel’miskin, V.V.; Firstov, S.V.; Bufetova, G.A.; Nishchev, K.N.; Gur’yanov, A.N.; Dianov, E.M. Luminescence properties of IR-emitting bismuth centres in SiO2—Based glasses in the UV to near-IR spectral region. Quantum Electron. 2015, 45, 59–65. [Google Scholar] [CrossRef]
- Fanciuli, M.; Bonera, E.; Nokhrin, S.; Pacchioni, G. Phosphorous–oxygen hole centers in phosphosilicate glass films. Phys. Rev. B. 2006, 74, 134102. [Google Scholar] [CrossRef]


Disclaimer/Publisher’s Note: The statements, opinions and data contained in all publications are solely those of the individual author(s) and contributor(s) and not of MDPI and/or the editor(s). MDPI and/or the editor(s) disclaim responsibility for any injury to people or property resulting from any ideas, methods, instructions or products referred to in the content. |
© 2023 by the authors. Licensee MDPI, Basel, Switzerland. This article is an open access article distributed under the terms and conditions of the Creative Commons Attribution (CC BY) license (https://creativecommons.org/licenses/by/4.0/).